Abstract
The hippocampal CA2 subfield was initially identified by Lorente de Nó as an anatomically distinct region based on its cytoarchitectural features. Although there is an enormous body of literature on other hippocampal subfields (CA1 and CA3), relatively little is known about the physiological and developmental properties of CA2. Here we report identification of the CA2 region in the mouse by immunostaining with a Purkinje cell protein 4 (PCP4) antibody, which effectively delineates CA3/CA2 and CA2/CA1 borders and agrees well with previous cytoarchitectural definitions of CA2. The PCP4 immunostaining–delineated CA2 neurons have distinguishable differences in cell morphology, physiology, and synaptic circuit connections compared with distal CA3 and proximal CA1 regions. The average somatic sizes of excitatory cells differ across CA1–3, with the smallest to largest somatic size being CA1<CA2<CA3. CA2 excitatory cells have dense dendritic spines, but do not have thorny excrescences associated with bordering CA3 neurons. Photostimulation functional circuit mapping shows that CA2 excitatory neurons receives extensive synaptic input from CA3, but no detectable input from the dentate gyrus. CA2 excitatory cells also differ significantly from CA3 cells in intrinsic electrophysiological parameters, such as membrane capacitance and spiking rates. Although CA2 neurons differ from CA1 neurons for PCP4 and other marker expressions, these neurons have less distinct neurophysiological and morphological properties. Developmental examination revealed that PCP4 immunostaining first appears at postnatal day 4–5 and becomes successively more refined around CA2 until reaching adult form by postnatal day 21. J. Comp. Neurol. J. Comp. Neurol. 522:1333–1354, 2014. © 2013 Wiley Periodicals, Inc.
Keywords: immunochemical, electrophysiology, circuit mapping
The current division of hippocampal subfields is largely based on the analysis of Lorente de Nó (1934), extending the work of Santiago Ramón y Cajal and further defining regions within Ammon’s horn (the hippocampus proper), with CA1 corresponding to regio superior, CA3 to most of regio inferior, and CA2 to a small boundary zone between CA1 and CA3. Anatomically, unlike CA3, CA2 does not have mossy fiber innervation from the dentate gyrus (Lorente de Nó, 1934). Compared with CA3 and CA1, the CA2 region has been largely neglected due to its small size and controversial identity as a distinct region (Grove and Tole, 1999; Tole et al., 1997). However, recent studies are beginning to illuminate molecular expression profiles, circuit connectivity, and physiology of CA2, and they suggest that CA2 is a critical component of hippocampal circuitry rather than a mere transition zone between CA3 and CA1 (Caruana et al., 2012; Chevaleyre and Siegelbaum, 2010; Jones and McHugh, 2011; Lein et al., ,; Zhao et al., 2001).
The compelling evidence for the existence of a distinct CA2 region comes from molecular marker studies, which show differential labeling between putative CA2 and other hippocampal regions in rodents. These markers include Purkinje cell protein 4 (PCP4), neurotrophin 3, fibroblast growth factor, α-actinin 2, adenosine A1 receptor, vasopressin 1b receptor, RGS14 (regulator of G-protein signaling 14), and amigo2. These markers are specifically or more prominently expressed in the distal portion of regio inferior corresponding roughly to Lorente de Nó’s CA2 (for review, see Caruana et al., 2012; Jones and McHugh, 2011; Lein et al., 2005). However, technical limitations often prevent the sole use of molecular markers from precisely locating the CA2 region, as gene expression profiling via in situ hybridization often does not have a sufficient resolution for distinguishing CA2 from distal CA3 (Bland et al., 2007; Laeremans et al., 2013; Lein et al., 2005; Young et al., 2006; Zhao et al., 2001). Therefore, it remains to be determined whether the putative CA2 region mapped by the “CA2 molecular markers” corresponds to the CA2 region classically defined by Lorente de Nó’s criteria, which specify that CA3-like pyramidal neurons in CA2 lack the specialized postsynaptic “thorny excrescences” (characteristic of mossy fiber synapses) and thus do not have mossy fiber innervation from dentate granule cells.
As PCP4 expression currently represents the best estimate of “molecularly defined” CA2 (Laeremans et al., 2013; Lein et al., 2005), in this study we used immunostaining of mouse hippocampal sections against PCP4 to localize the CA2 region in combination with anatomical and physiological analysis to test the hypothesis that anti-PCP4 staining effectively delineates the CA3/CA2 and CA2/CA1 borders as a basis for comparing the neurophysiological and morphological properties of CA2 with CA1 and CA3. Compared with previous PCP4 in situ hybridization that tends to label cell bodies, PCP4 immunostaining regarding PCP4 protein distribution is quite effective for hippocampal subfield identification and delineation particularly when taking into consideration PCP4 immunoreactivity of the mossy fiber tract associated with CA3. We found that excitatory pyramidal cells in the PCP4-delineated CA2 region have distinct properties of single cell morphology and physiology, as well as circuit connectivity. In addition, the developmental feature of PCP4 immunostaining was examined at different postnatal ages; our data showed when it appears postnatally and when it becomes spatially restricted around the CA2 region at older ages.
MATERIALS AND METHODS
Animals
All animals were handled and experiments were conducted in accordance with procedures approved by the Institutional Animal Care and Use Committee at the University of California, Irvine. The ages and numbers of animals used for different types of experiments are detailed in Table1. In the Calb2-Cre:tdTomato double transgenic mouse obtained by crossing the Calb2-Cre mouse line (Taniguchi et al., 2011) to a Rosa-CAG-LSL-tdTomato Cre reporter line (Madisen et al., 2010), dentate granule cells express strong red fluorescent (tdTomato) proteins so that their axon bundles (i.e., the mossy fiber tract) are fluorescently visible in hippocampal sections.
Table 1.
Animals Used for Different Types of Experiments
| Types of experiments | Animal strain | Animal age | No. of animals used |
|---|---|---|---|
| PCP4 immunostaining in mature mice | C57/B6 | 6–8 weeks old | 6 |
| Calcium binding protein (PV, CR, CB) immunostaining in mature mice | C57/B6 | 6–8 weeks old | 3 |
| PCP4 immunostaining in transgenic mice | Calb2-Cre:tdTomato double transgenic | 4–5 weeks old | 3 |
| Developmental examination of PCP4 immunostaining | C57/B6 | P1–2, P4–5, P6–7, P10–15, P21–25 | 3, 4, 5, 5, 4 |
| Electrophysiological experiments | C57/B6 | P1–7, P15–18 | 15, 25 |
Abbreviations: CB, calbindin; CR, calretinin; PCP4, Purkinje cell protein 4; PV, parvalbumin.
For immunochemical staining experiments, the animals were deeply anesthetized with Uthasol (sodium pentobarbital, 100 mg/kg, i.p.) and perfused transcardially with 0.1 M phosphate-buffered saline (PBS; pH 7.3–7.4), followed by 4% paraformaldehyde (PFA) in PBS. The brain was removed from the skull, postfixed overnight in the same fixative (4°C), and then transferred to 30% sucrose in PBS for at least 2 days. Either horizontal or coronal sections were cut on a freezing microtome (Leica SM 2010R, Nussloch, Germany) at 25-μm thickness. For electrophysiological studies, the animals were deeply anesthetized and rapidly decapitated, and their brains were removed to make living hippocampal slices (see below) for whole-cell recordings and circuit mapping experiments.
Immunochemical staining
Antibody information, characterization, and specificity
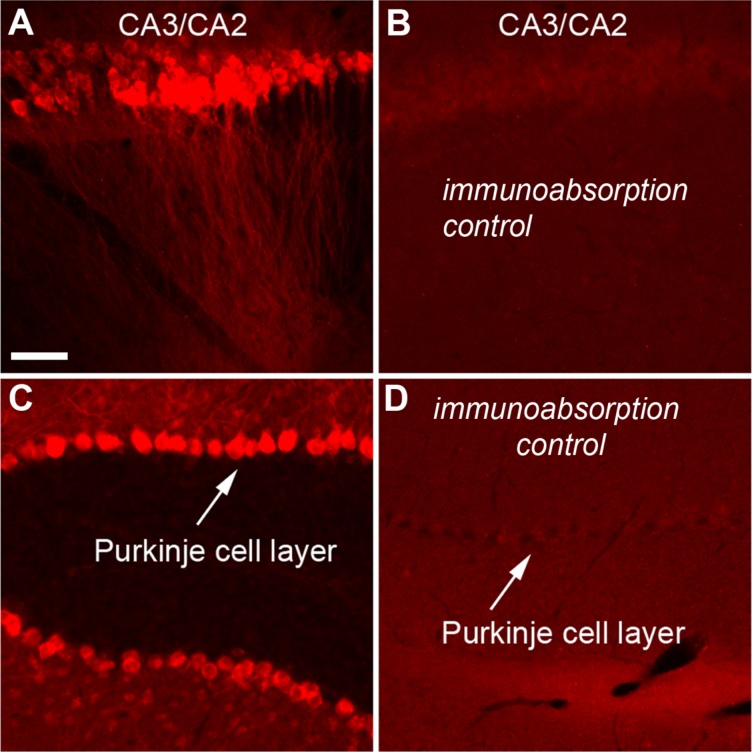
All primary antibodies (Table2) used in our immunostaining experiments are commercially available from major companies. The PCP4 gene encodes the PCP4 protein (also known as Pep19), which modulates calmodulin activity by activating the interaction of calcium with calmodulin (Kleerekoper and Putkey, 2009; Putkey et al., 2003). Expression of PCP4 is detected in the brain with the highest level in Purkinje cells of the cerebellum. In the mouse hippocampal formation, gene expression profiling studies via in situ hybridization show that the PCP4 gene has its strong expression around the region roughly corresponding to CA2, in addition to the granule cell layer of the dentate gyrus (Lein et al., ,). In the present study, we chose to immunochemically label mouse hippocampal sections with a PCP4 antibody (Santa Cruz Biotechnology, Santa Cruz, CA). Based on technical information from Santa Cruz Biotechnology, the PCP4 antibody is an affinity-purified antibody raised against a peptide mapped at the C-terminus of PCP4 of human origin; its specificity has been confirmed by western blot analysis of PCP4 expression in nontransfected and human PCP4-transfected 293T whole-cell lysates. As shown in Figure 1, we independently confirmed the specificity of the PCP4 antibody in both mouse hippocampal and cerebellar sections by immunoabsorption tests using 10 μg/ml of the PCP4 peptide (sc-74816 P, Santa Cruz Biotechnology).
Table 2.
Primary Antibodies Used for Immunochemical Staining Experiments
| Antigen | Immunogen | Manufacturing details | Working dilution |
|---|---|---|---|
| PCP4 | C-terminus peptide of PCP-4 of human origin | Santa Cruz Biotech (Santa Cruz, CA), rabbit polyclonal, sc-74816 | 1:250 |
| Calretinin | Human recombinant calretinin | Swant (Bellinzona, Switzerland), rabbit polyclonal, 7699/4 | 1:1,000 |
| Calbindin D-28k | Recombinant rat calbindin D-28k | Swant, rabbit polyclonal, CB-38a | 1:1,000 |
| Parvalbumin | Rat muscle parvalbumin | Swant, rabbit polyclonal, PV-25 | 1:1,000 |
| Synapsin-1 | Synapsin I from bovine brain | Sigma-Aldrich (St. Louis, MO), rabbit polyclonal, S193 | 1:500 |
| Fibroblast growth factor (FGF)−2 | Synthetic peptide directed against the N terminus of rat basic FGF | EMD Millipore (Billerica, MA), rabbit polyclonal, 07–1435 | 1:500 |
| α-Actinin | Purified rabbit skeletal α-actinin | Sigma-Aldrich, mouse monoclonal, A7732 | 1:500 |
Figure 1.
Independent immunoabsorption tests confirm the specificity of the PCP4 antibody. A,B: Example staining results using the PCP4 antibody without and with preincubation with the PCP4 peptide, respectively, in mouse hippocampal horizontal sections. C,D: Example staining results using the PCP4 antibody without and with preincubation with the PCP4 peptide, respectively, in mouse cerebellar sections. Scale bar = 50 μm in A (applies to A–D).
In different sets of immunostaining experiments, we stained mouse hippocampal sections against calcium binding proteins such as calretinin (CR), calbindin-D28 K (CB), and parvalbumin (PV) (Swant, Bellinzona, Switzerland) to compare with PCP4 staining. In addition, in a few sections we used the antibody of synapsin 1 (Sigma-Aldrich, St. Louis, MO) to restain the same PCP4-stained sections to confirm the PCP4 immunoreactivity of the mossy fiber tract, which is known to course in the suprapyramidal layer (also known as the stratum lucidum) of CA3. These antibodies (included in the Journal of Comparative Neurology Antibody Database) have been widely used, and their specificity and effectiveness are confirmed in our previous work or in the published studies of others (Burkhalter, 2008; Dailey et al., 1994; Fletcher et al., 1991; Kawaguchi and Kondo, 2002; Xu et al., ,).
Antibodies against fibroblast growth factor-2 (FGF2) and α-actinin were initially used in examining CA2 immunoreactivity, as some previous studies had used them as CA2 markers (Chevaleyre and Siegelbaum, 2010; Mercer et al., 2007). However, we found that in mouse hippocampal sections, their immunostaining was not clear or was diffuse in the CA2 region. We did not further examine their distribution or compare them with other markers. Based on technical information from EMD Millipore, the FGF2 antibody is routinely evaluated by western blot on Huvec lysates; it reacts strongly with basic fibroblast growth factor (FGF-2), but no cross-reactivity is seen with acidic FGF (FGF-1). Based on technical information from Sigma-Aldrich, α-actinin is an actin-binding protein present in both muscle and nonmuscle cells. The actinin monoclonal antibody shows wide reactivity with α-actinin in many species with various immunochemical techniques.
The secondary antibodies, Cy3-conjugated or Alexa Fluor 488–conjugated donkey anti-rabbit IgG (Jackson ImmunoResearch, West Grove, PA; 711-165-152 or 711-225-152,1:200 dilution) were used for fluorescent visualization of the immunostaining. None of the observed labeling was due to nonspecific binding of secondary antibodies or autofluorescence in the fixed tissue because sections labeled with secondary antibodies alone showed no detectable labeling.
Immunostaining procedure
To stain tissue sections with antibodies, conventional fluorescent immunohistochemistry was performed as follows. Free-floating sections were rinsed 3–5 times with PBS with 0.1% Triton X, and incubated in a blocker solution for 2 hours at room temperature. The blocker solution contains 10% normal donkey serum, 2% bovine serum albumin, and 0.25% Triton X in PBS. Sections then were incubated with the primary antibody in the blocker solution at the appropriate dilution for 24–36 hours at 4°C. After the primary antibody incubation, sections were rinsed thoroughly with PBS (or working buffer: 10% blocker and 90% PBS), and then incubated with an appropriate secondary antibody in the blocker solutions for 2 hours at room temperature. After the secondary antibody solution was rinsed off, sections were counterstained with 10 μM 4′-6-diamidino-2-phenylindole (DAPI; Sigma-Aldrich) for 10 minutes to help distinguish hippocampal subfields. Finally, sections were rinsed and wet-mounted, and were either directly coverslipped with the mounting medium Vectashield (H-1000, Vector, Burlingame, CA) or air-dried overnight, dehydrated, defatted, and then coverslipped with the mounting medium Krystalon (EM Science, Fort Washington, PA; 64969-95). The sections were examined, and low- and high-power images were acquired with an Olympus BX61 microscope equipped with a CCD camera (Hamamatsu Photonics, Tokyo, Japan) or a confocal microscope (LSM 700, Carl Zeiss Microscopy, Nussloch, Germany).
For immunoabsorption control tests, the PCP4 antibody was first preincubated with the PCP4 peptide overnight in blocker solution and this solution was then applied to the sections for 24 hours and the remaining staining procedures were completed as described above. We did not see any specific immunolabeling in the sections used for these control tests (Fig. 1).
Measurements and image data analysis
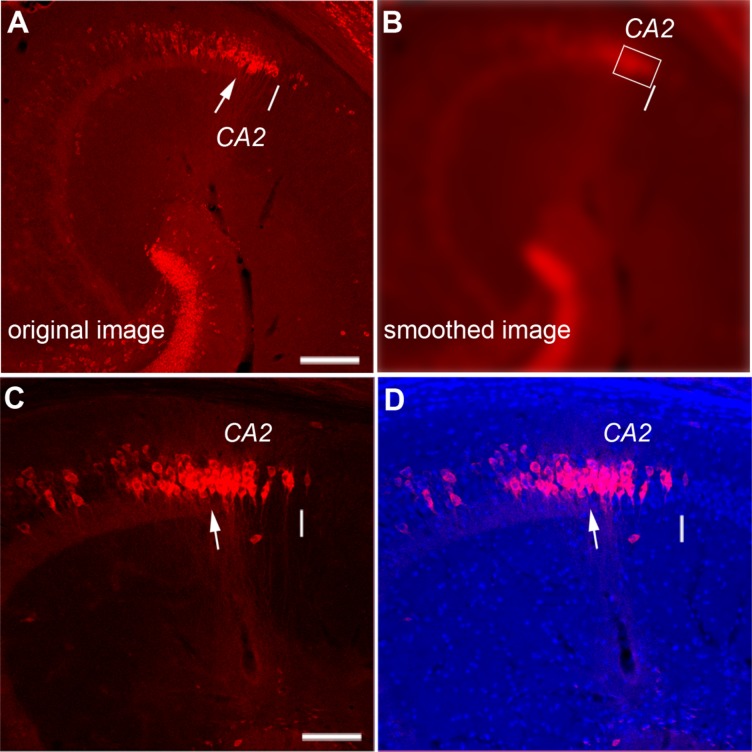
To identify the CA2/CA1 border in a less arbitrary fashion in practice (see Fig. 3A,B), we used Adobe (San Jose, CA) Photoshop tools (blurring and thresholding) to perform Gaussian blurring with an empirically determined radius of 20 μm (about the size of two PCP4+ cell bodies), which resulted in exclusion of sparsely labeled PCP4-positive cells across hippocampal subregions. Furthermore, applying a threshold of 50% local maximal intensity (measured from distal CA3 and CA2) to the smoothed image facilitated identification of the CA2/CA1 border. This CA2/CA1 border identification was consistent with the cytoarchitectural border determined from the transition of DAPI nuclear staining in the pyramidal cell layer. In the processed images, the extent of PCP4-expressing CA3 was similarly determined.
Figure 3.
Delineation of the CA2/CA1 border aided by simple image processing protocol. A,B: The original (A) and smoothed (B) images. The white arrow indicates the end of mossy fibers (i.e., the border of distal CA3 and CA2) from A, and the white line determined from B indicates the CA2/CA1 border. B is a smoothed version of the image shown in A using Gaussian blurring with an empirically determined radius of 20 μm (about the size of two PCP+ cell bodies; see Materials and Methods). This smoothing results in the exclusion of sparsely labeled PCP4-positive cells across hippocampal subregions. Furthermore, applying a 50% local intensity threshold to the smoothed image helps to identify the CA2/CA1 border (indicated by the white line in A and B). The white rectangular box encloses the CA2 region with the main cluster of PCP4-stained cells in the absence of mossy fibers. C,D: The CA2/CA1 border identified with this protocol is consistent with the cytoarchitectural border determined from the transition of DAPI nuclear staining in the pyramidal cell layer, as shown in the images of PCP4 immunostaining and PCP4/DAPI staining overlay of an example hippocampal section. Note that CA1 has more compact DAPI nuclear staining compared with CA2. In addition, the cytoarchitectural transition from distal CA3 to CA2 includes overall smaller somatic sizes of the putative excitatory pyramidal cells in CA2, compared with CA3. Scale bar = 200 μm in A (applies to A,B); 100 μm in C (applies to C,D).
A custom analysis program written in Matlab (MathWorks, Natick, MA) was used to measure the extent of the PCP4 densely stained region versus the delineated CA2 portion, and CA3 length of the hippocampus. The measurements were obtained for the various ages of mouse brains (Table1). We only took measurements from the sections in which we had good confidence in properly delineating distal CA3, CA2, and CA1 subregions. Unless specified, the data were measured from pyramidal cell layer of distal CA3 (within about 200 μm from the CA2/CA3 border), CA2, and proximal CA1 (200 μm from the CA2/CA1 border). In addition, the manual measurement tools of Adobe Photoshop were used to measure somatic sizes of clearly distinguishable individual PCP4+ cells in distal CA3 and CA2 using confocal image stacks. The Adobe Photoshop tool was also used to measure optical densities associated with DAPI nuclear staining in the pyramidal cell layer of distal CA3, CA2, and proximal CA1.
As for morphological characterization of electrophysiologically recorded cells, the cells were first revealed with biocytin staining (see below), and reconstructions were conducted based on stacks of optical sections acquired by the confocal microscope. Then we examined the number of primary apical dendritic branches, and measured the distance between a primary branching point and the base of the apical dendrite (i.e., primary branching distance) using the Adobe Photoshop measurement tool.
Electrophysiology and laser scanning photostimulation
Horizontal hippocampal slices 400 μm thick were cut at the angle optimized to conserve the intrahippocampal axonal projections (Bischofberger et al., 2006) in well-oxygenated, ice-cold sucrose-containing cutting solution (in mM: 85 NaCl, 75 sucrose, 2.5 KCl, 25 glucose, 1.25 NaH2PO4, 4 MgCl2, 0.5 CaCl2, and 24 NaHCO3). Two morphologically intact slices intermediate between dorsal and ventral hippocampus from each animal were used for experiments. Slices were first incubated in sucrose-containing ACSF for 30 minutes to 1 hour at 32°C, and then transferred to recording ACSF (in mM: 126 NaCl, 2.5 KCl, 26 NaHCO3, 2 CaCl2, 2 MgCl2, 1.25 NaH2PO4, and 10 glucose). Throughout the cutting, incubation, and recording, the solutions were continuously supplied with 95% O2−5% CO2.
Our overall system of electrophysiological recording, photostimulation, and imaging was described previously (Xu et al., 2010; Xu, 2011). Electrophysiological experiments were conducted at room temperature. To perform whole-cell recordings, neurons were visualized at high magnification (60× objective) with an upright microscope (BX51WI, Olympus, Tokyo, Japan). Cell bodies of recorded neurons were at least 50 μm below the slice-cutting surface and were initially targeted based on the pyramidal appearance of the cell soma and thick apical dendrite when possible. Patch pipettes (4–6 MΩ resistance) made of borosilicate glass were filled with an internal solution containing (in mM) 126 K-gluconate, 4 KCl, 10 HEPES, 4 ATP-Mg, 0.3 GTP-Na, and 10 phosphocreatine (pH 7.2, 300–305 mOsm). The internal solution also contained 0.1% biocytin for cell labeling and morphological identification. Once stable whole-cell recordings were achieved with good access resistance (usually <20 MΩ), basic electrophysiological properties were examined through hyperpolarizing and depolarizing current injections (ranging from −100 pA to 400 pA with a duration of 1,000 ms). We focused on analyzing intrinsic properties such as neuronal resting membrane potentials, spike rates, and spiking interval adaptation. We also performed spike shape analysis similar to that of Murphy and du Lac 2001. The data are summarized in Table3.
Table 3.
Electrophysiological Properties of Excitatory Pyramidal Cells Across Different Hippocampal Subfields
| Distal CA3 (CA3a) cells (n = 20) | CA2 cells (n = 14) | Proximal CA1 cells (n = 14) | |
|---|---|---|---|
| Resting membrane potential (mV) | −59.7 ± 4.5 (mean ± SD) | −62.1 ± 5.4 | −59.4 ± 3.7 |
| Access resistance (MΩ) | 19.9 ± 4.7 | 23.7 ± 4.1 | 24 ± 3.7 |
| Membrane resistance (MΩ) | 191.4 ± 153.3 | 136.6 ± 76.4 | 156.5 ± 105.2 |
| Membrane capacitance (pF) | 139.3 ± 56.5 | 98.6 ± 61.51 | 83.9 ± 37.4# |
| Amplitude of threshold currents to elicit action potentials (pA) | 92 ± 39 | 52 ± 71 | 61 ± 20# |
| Spike height (mV) | 77.6 ± 11.8 | 83.5 ± 5.6 | 81.1 ± 7.2 |
| Spike width at half height (ms) | 2.0 ± 0.2 | 2.7 ± 0.41 | 2.6 ± 0.4# |
| Average firing rates (Hz) in response to ∼200 pA current injection | 13.6 ±6.6 | 23.9 ±4.21 | 22.7 ± 2.9# |
| The average of the first two interspike intervals (ms) at ∼200pA injection | 73.8 ± 55.7 | 21.6 ± 7.91 | 24.8 ±8.2# |
| Spike adaptation (1st spike interval versus last interval) index at ∼200pA injection | 0.5 ± 0.28 | 0.27 ±0.11 | 0.36 ±0.13# |
Indicates that the average value of CA2 cells differs significantly from that of CA3 cells.
#Indicates that the average value of CA1 cells differs significantly from that of CA3 cells.
During laser scanning photostimulation (LSPS) experiments, the microscope objective was switched from 60× to 4×. Stock solution of MNI-caged L-glutamate (Tocris Bioscience, Ellisville, MO) was added to 20 ml of ACSF for a concentration of 0.2 mM caged glutamate. The slice image was acquired by a high-resolution digital CCD camera (Retiga 2000, Q-imaging, Austin, TX), which in turn was used for guiding and registering photostimulation sites.
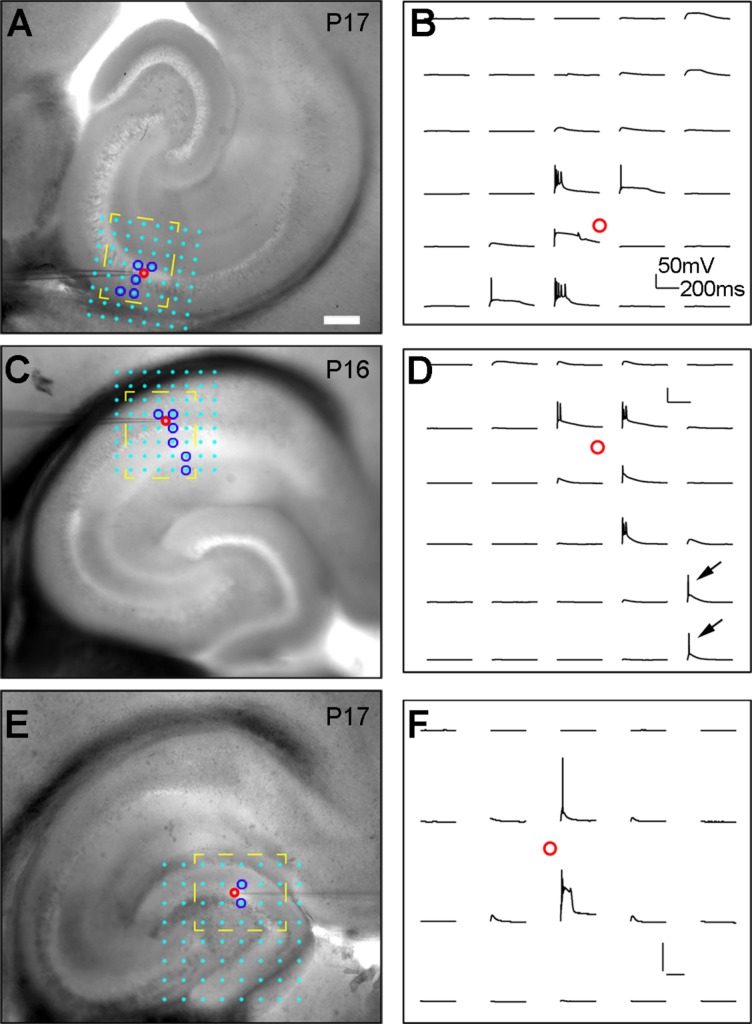
The LSPS method has been previously used in the neocortex and hippocampus (Brivanlou et al., 2004; Dantzker and Callaway, 2000; Shepherd et al., 2005; Weiler et al., 2008; Xu and Callaway, 2009); it is a precise and useful approach for detailed local circuit mapping. A laser unit (DPSS Lasers, Santa Clara, CA) was used to generate 355-nm UV laser pulses for glutamate uncaging. Short pulses of laser flashes (1 ms, 20 mW) were controlled by using an electro-optical modulator and a mechanical shutter. The laser beam formed uncaging spots, each approximating a Gaussian profile with a width of 100 μm laterally at the 4× objective focal plane (Xu et al., 2010). Physiologically, under our experimental conditions, LSPS evoked action potentials only from stimulation locations within ∼100 μm of targeted somata (see Fig. 9). In these calibration experiments, we did not find evidence of synaptically driven spiking evoked by distant photostimulation, because such trans-synaptic driving would appear in excitation profiles as spike-evoking sites far away from the perisomatic area of the recorded neurons. Additional data against synaptically driven spiking came from mapping experiments, in which synaptic input maps of the same recorded cells were acquired multiple times with different photostimulation powers. Even at the double uncaging power, the topography of input sources was unchanged with only increased input strength at the input locations. The stable map topography cannot exist if LSPS evoked inputs are derived from disynaptic or polysynaptic activation. Based on these control experiments, we conclude that synaptic inputs mapped in LSPS experiments are monosynaptic inputs from directly photostimulated sites.
Figure 9.
Validation of spatial resolution of laser scanning photostimulation (LSPS) by examining the excitability profiles of excitatory neurons in CA3, CA1, and the fascia dentate of the dentate gyrus (DG). A,B: The excitability profile (i.e., spatial distribution of uncaging sites that produce action potentials) of a CA3a cell recorded in current clamp mode. The 8 × 8 photostimulation sites (spaced at 80 μm2) are shown with cyan dots overlying the slice image; photostimulation-evoked action potentials (spikes) are restricted to a small region (blue circles, shown in A), and the response traces within the yellow, dashed region are separately shown in B. C–F: The excitability profiles of a CA1 cell (C,D) and a DG granule cell (E,F), as similarly formatted in A and B. The arrows in D indicate the evoked spikes in response to photostimulation at the cell’s distal apical dendrites (as seen for some CA3 cells as well) in the S-LM layer, which decreases the LSPS resolution along the vertical dendritic dimension. However, as we are concerned about excitatory input from different hippocampal subfields (CA3-1) and the fascia dentate, the most relevant spatial resolution in the hippocampus proper is defined as the lateral distance in the main axonal projection axis of DG→CA3→CA1, relative to the photostimulation site. By this definition, the average spatial precision of the method is within 108 ± 42 μm (mean ± SD, n =17 cells) of photostimulation sites. Also see Materials and Methods for exclusion of photostimulation-evoked EPSCs in the S-LM layer. Considering that the total distance from DG to CA2/CA1 is more than 1,200 μm, this approach allows valid measures of differences of inputs to the recorded cell types from specific hippocampal subfields and the fascia dentate. In addition, the excitability profile experiments did not show evidence of synaptically driven spiking by photostimulation (i.e., no spike-evoking sites far away from the perisomatic area of the recorded neuron), indicating that the LSPS maps represent monosynaptic inputs. Scale bar = 200 μm in A (applies to A,C,E).
During mapping experiments, photostimulation was usually applied to 16 × 16 patterned sites (with an intersite space of 100 μm2) covering the whole hippocampal slice. Glutamate uncaging was delivered sequentially in a nonraster, nonrandom sequence, following a “shifting-X” pattern designed to avoid revisiting the vicinity of recently stimulated sites (Shepherd and Svoboda, 2005). Whole-cell voltage-clamp recordings were made from the recorded neurons to measure photostimulation-evoked excitatory postsynaptic current (EPSC) responses at the holding potential at −65 mV (P6–P7) or −70 mV (P15–P18), which was based on the empirically determined γ-aminobutyric acid (GABA)ergic reversal potentials at the recorded mouse ages.
Photostimulation data analysis has been described in detail (Shi et al., 2010). Photostimulation can induce two major forms of excitatory responses (Shi et al., 2010; Xu and Callaway, 2009): 1) direct glutamate uncaging responses (direct activation of the recorded neuron’s glutamate receptors); and 2) synaptically mediated responses (EPSCs) resulting from the suprathreshold activation of presynaptic excitatory neurons. Responses occurring within the 10-ms window from laser onset are considered direct. Synaptic currents with such short latencies are not possible because they occur before the generation of action potentials in photostimulated neurons. Therefore, direct responses need to be excluded from synaptic input analysis. However, at some locations, synaptic responses were over-riding on the relatively small direct responses and were identified and included in synaptic input analysis (see Fig. 10). As for individual map construction, input measurements from different stimulation sites were assigned to their corresponding anatomical locations in the hippocampus; color-coded maps of average input amplitude and the number of events per site were plotted to illustrate overall input patterns to the recorded cell. The total input from each stimulation site was the measurement of the sum of individual EPSCs within the analysis window (>10 ms to 160 ms post photostimulation), with the baseline spontaneous response subtracted from the photostimulation response of the same site; the value was normalized with the duration of the analysis window (i.e., 150 ms) and expressed as average integrated amplitudes in picoamperes (pA). The analysis window was chosen because photostimulated neurons fire most of their action potentials during this time.
Figure 10.
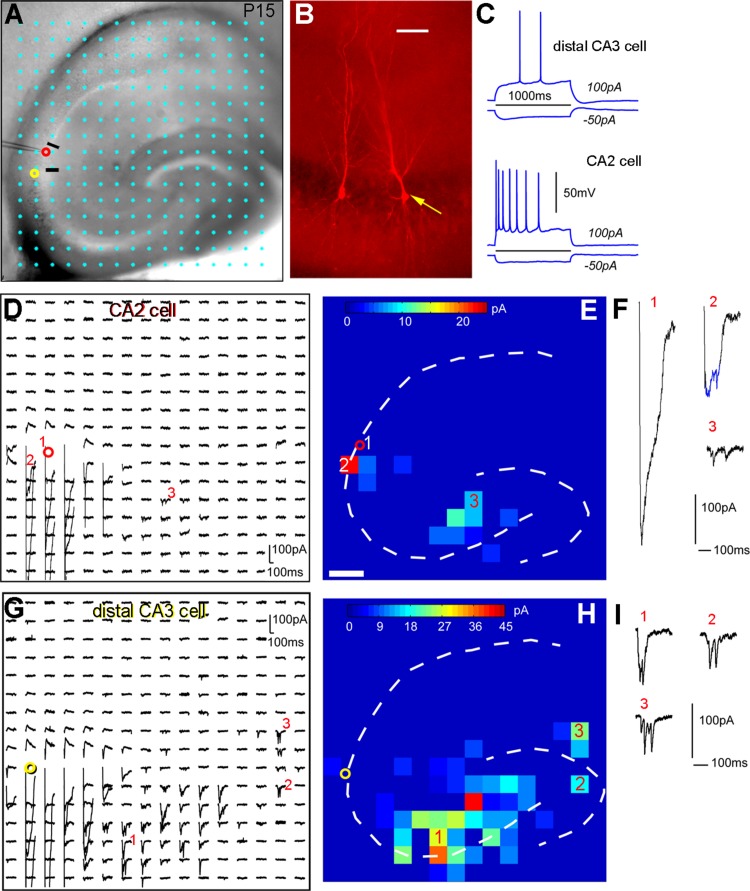
Laser scanning photostimulation reveals that CA2 excitatory pyramidal neurons receive excitatory synaptic input from CA3 cells but not from dentate granule cells. A: The mouse hippocampal slice image with the superimposed photostimulation sites (16 × 16 cyan dots, spaced at 100 μm × 100 μm). The cell body locations of the sequentially recorded CA2 and distal CA3 cells are indicated by the red and yellow circles, respectively. The short black lines indicate the borders of CA2. B: The pyramidal cell morphology of the recorded cells. The yellow arrow points to the distal CA3 cell bordering CA2. C: Intrasomatic current injection responses of the two recorded cells. D: An array of photostimulation-evoked response traces from the corresponding sites in A, with the recorded CA2 cell held in voltage clamp mode to detect inward excitatory postsynaptic currents (EPSCs). The red circle indicates the recorded cell body location of the CA2 cell. Only the 250 ms of the recorded traces after the onset of laser photostimulation are shown. F: Different forms of photostimulation responses are illustrated by the traces, which are expanded and shown separately. Trace 1 is an example of a large direct response (excluded for further analysis) to glutamate uncaging on the cell body. Trace 2 shows an example of relatively small direct response, with over-riding synaptic responses (blue). Trace 3 is a typical example of synaptic input responses. E: The color-coded, averaged input map constructed from D (with each square corresponding to one stimulation site) superimposed with the hippocampal contour, illustrating the pattern and strength of synaptic input to the recorded neuron. The input amplitude from each stimulation site is a measurement of average integrated strength of individual EPSCs in the specified analysis window, with the baseline spontaneous response subtracted from the photostimulation response of the same site. The numbered sites correspond to the illustrated response traces. G–I: Photostimulation-based circuit mapping for the distal CA3 cell, as formatted in D–F. Scale bar = 50 μm in B; 200 μm in E (applies to E,H).
To quantitatively compare input strength across cell groups, we measured the ESPC input amplitudes and the numbers of EPSCs across specific hippocampal subfields for individual cells. Note that as stratum lacunosum-moleculare (S-LM) only has sparse inhibitory neurons, but that pyramidal neurons located in the pyramidal cell layer could fire action potentials when their distal apical dendrites were stimulated in the S-LM layer (e.g., see Fig. 9), EPSCs detected after photostimulation in the S-LM layer were not included for analysis to avoid repeated sampling.
After physiological assays had been completed, the brain slices were fixed in 4% paraformaldehyde in PBS overnight and transferred to 30% sucrose solution in PBS. The slices were stained against biocytin with 1:500 Alexa Fluor 488 or Cy3-conjugated streptavidin (Jackson ImmunoResearch) to show the morphology of the recorded cells. Sections were also stained for DAPI.
Statistics
When two independent groups were compared, normally distributed data were analyzed by using a Student’s t-test; when data were not normally distributed, a Mann–Whitney U-test was used. For statistical comparisons across three groups, we used the Kruskal–Wallis test (nonparametric one-way analysis of variance [ANOVA]) to identify the overall significance (e.g., CA3a, CA2, and CA1 cells) and Mann–Whitney U-tests for group comparisons (e.g., CA3a vs. CA2, CA3a vs. CA1, and CA2 vs. CA1). Alpha levels of P ≤ 0.05 were considered significant. All the values were presented as mean ± SD. For electrophysiological experiments, sample size n was defined as cell number. For morphological measurements, unless specified, individual data points were measured and calculated for each section/slice and averaged for each animal, in which n stood for animal number.
RESULTS
PCP4-based identification and delineation of hippocampal CA2
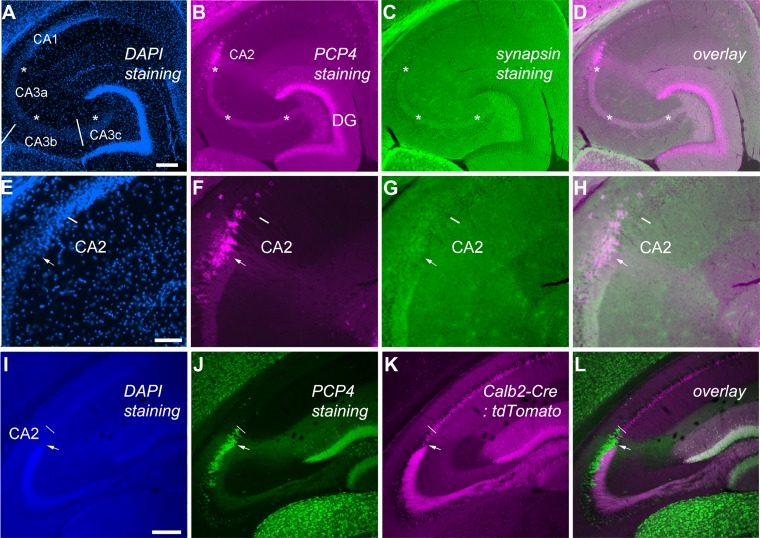
In 6–8-week-old mice, hippocampal subfields CA1, CA2, CA3, and the dentate gyrus (DG) were differentiated on the basis of highly specific and strong anti-PCP4 immunostaining (Fig. 2). We follow the basic nomenclature of Lorente de Nó (1934) and Ishizuka et al. (1990) and use the terms proximal (nearer the dentate gyrus) and distal (further away from the dentate gyrus) to designate positions along the transverse axis of the CA1 and CA3. In the mouse hippocampal proper, consistent with previous PCP4 in situ hybridization (Lein et al., ,; Zhao et al., 2001), strong PCP4 immunoreactivity was localized in both CA2 and the distal part of CA3 (CA3a), which is distinct from proximal CA1 (CA1c) (Fig. 2B,F,J). However, different from in situ hybridization, PCP4 immunostaining resulted in concurrent detection of the mossy fiber tract (Fig. 2A–D,I,J), which allows for distinguishing distal CA3 from the CA2 region (see below). Little PCP4 immunoreactivity was seen in the proximal portion of CA3 pyramidal cells, and CA1 pyramidal cells were sparsely labeled. As shown in Figure 3A and B, an unbiased smoothing and thresholding protocol was applied for every image of interest to facilitate identification of the CA2/CA1 border in a less arbitrary manner (see Materials and Methods). Dentate granule cells were also strongly immunopositive for PCP4 (Fig. 1B,J), so that the bundles of their axons (mossy fibers) were detected in the stained sections.
Figure 2.
PCP4 immunostaining effectively delineates the CA2 region in adult mouse hippocampus. A–H: Images are from the same horizontal section, with E–H depicting the CA2 region at higher magnification. The images stained for DAPI (A,E), Purkinje cell protein 4 (PCP4; B,F), and synapsin 1 (C,G) and the overlay images for PCP4 and synapsin 1 staining (D,H) are specifically shown. Asterisks (*) indicate location of the mossy fiber tract at the suprapyramidal layer (also known as the stratum lucidum), labeled by PCP4 and synapsin 1. E–H: In high-power images, the arrow indicates the end of the mossy fiber tract and the beginning of CA2, and the short bar indicates the border between CA2 and CA1 as determined by cytoarchitecture, matching PCP4 staining. I–L: Images are from the same coronal section of a Calb2-Cre:tdTomato double transgenic mouse, in which the mossy fiber tract (K) is clearly shown through red fluorescent proteins expressed by dentate granule cell axons. The same section was stained by DAPI (I) and PCP4 (J), and sequentially imaged in separate non-overlapping channels. The merge of the green and magenta channels is shown (L). Note that the basic terminology of Lorente de Nó (1934) and Ishizuka et al. (1990) is used to designate positions along the transverse axis of CA3 (CA3c, -b, --a) and CA1; the midline of the fimbria separates CA3a and CA3b. Scale bar = 200 μm in A (applies to A–D) and I (applies to I–L); 100 μm in E (applies to E–H).
Double labeling using the synapsin-1 antibody in wild-type mice and genetic labeling of granule cell axons in Calb2-Cre:tdTomato double transgenic mice, confirmed the mossy fiber tract revealed by PCP4 immunoreactivity (Fig. 2C,G,K). Given that the extent of mossy fiber innervation remains a functionally useful criterion, the presence versus absence of mossy fiber tract distinguishes the CA3a/CA2 border in the PCP4-stained hippocampal sections. That is, as the termination of the mossy fiber tract traveling in the suprapyramidal layer of CA3 (Dailey et al., 1994; Romer et al., 2011; Zimmer and Haug, 1978) allows for precise delineation of PCP4-immunopositive distal CA3a, the other portion (∼200 μm in length) of the dense PCP4-stained region is unambiguously localized as CA2 that lacks the presence of the mossy fiber tract. Because the mossy fiber tract ends relatively bluntly at the CA3/CA2 border at horizontal sections, but gradually tapers off toward the border in coronal sections, horizontal sections should be preferred for CA2 examination when possible, even though we used both horizontal and coronal sections for our analysis.
Differential cytoarchitecture supports the finding that the PCP4-delineated CA2 region differs from distal CA3 or proximal CA1 (Figs. 2E–H, 3C,D). In the DAPI-stained sections, distal CA3 had loosely packed, large cell nuclei located in the pyramidal cell layer, whereas CA1 had densely packed, compact nuclei in the pyramidal cell layer. In comparison, the CA2 pyramidal cell layer had cell density that was intermediate between CA1 and CA3. Consistent with qualitative observations, the mean optical densities of the pyramidal cell layer in distal CA3 (within about 200 μm from the CA3/CA2 border), CA2 and proximal CA1 (200 μm from the CA2/CA1 border) showed differences, with their values being 11.2 ± 4.5 (mean ± SD; unadjusted raw gray scale unit, 0 for black, 255 for white), 14.8 ± 5.8, and 16.3 ± 5.8, respectively (n = 10 slices from five mice, Kruskal–Wallis test: P = 0.04, Mann–Whitney U-tests for group comparisons: distal CA3 versus CA1 P = 0.03, distal CA3 versus CA2 P = 0.08; CA2 versus CA1 P = 0.3). Furthermore, the overall somatic sizes measured from PCP4+ cells in distal CA3a were larger than those of CA2 (Fig. 3C,D), with the average values being 363.3 μm2 ± 58.7 μm2 and 264.4 μm2 ± 68.4 μm2 (n = 20 and 16 cells for CA3a and CA2, pooled from five sections from four mice), respectively (P = 0.0002). In addition, the PCP4-defined CA2 was verified by its neuronal morphology, electrophysiology, and local circuit connectivity, which differed from distal CA3 and proximal CA1 (see below). Together, these data establish the PCP4-based method for proper identification of the CA2 region.
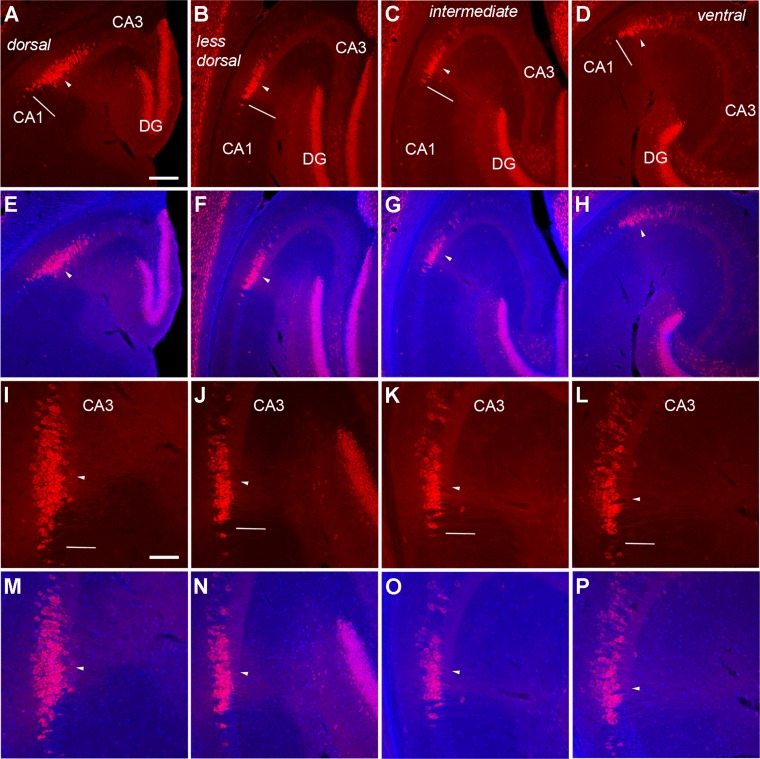
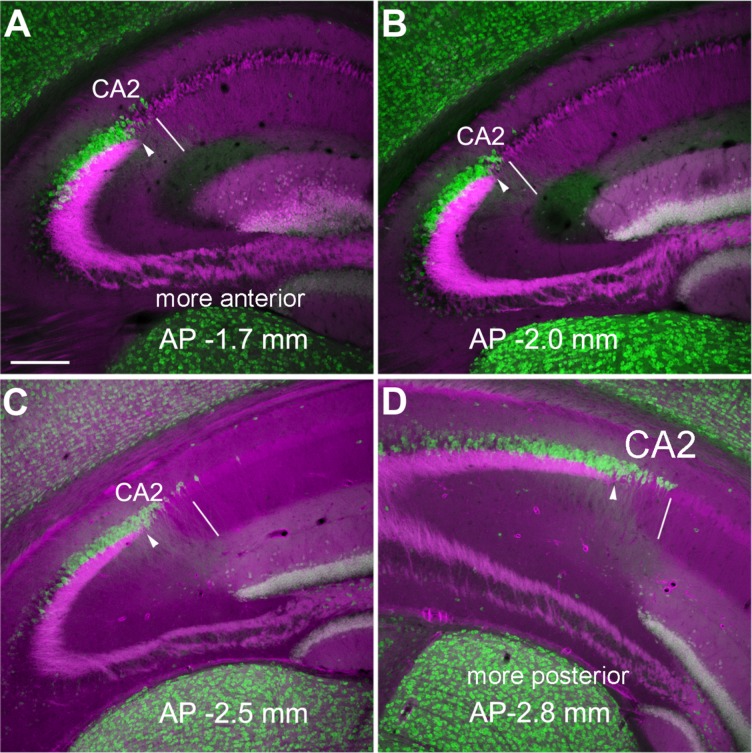
Considering the dorsal and ventral variations of the hippocampus in its anatomical and neurochemical organization (Jung et al., 1994; Sahay and Hen, 2007), we further examined the variations of PCP4 immunostaining and the CA2 extent at different dorsal–ventral levels across horizontal sections (Fig. 4), and at different anterior–posterior positions across coronal sections (Fig. 5) of mouse hippocampus (6–8 weeks old). In the dorsal sections, the average lengths of delineated CA2 region and total PCP4 stained region were 224.5 ± 30.4 μm and 317.5 ± 33.3 μm (measured from three to six sections of each animal and averaged across four mice), respectively, whereas in the ventral sections, the lengths of delineated CA2 region and total PCP4 densely stained region were 197.9 ± 26.4 μm and 285.6 ± 54.4 μm, respectively. In the anterior sections (AP ≥ −1.5 mm), the average lengths of delineated CA2 region and total PCP4 densely stained region were 116 ± 16.5 μm and 375 ± 23.8 μm (measured from three sections of each animal and averaged across two mice), respectively; in the middle sections (AP −1.7–2 mm), the average lengths of delineated CA2 region and total PCP4 densely stained region were 95.8 ± 14.8 μm and 347.3 ± 14.7 μm, respectively; in the posterior sections (AP −2.2–2.8 mm), the average lengths of delineated CA2 region and total PCP4-stained region were 142.8 ± 23.2 μm and 446 ± 38.7 μm, respectively. It should be noted that our immunostaining data indicate that PCP4 gene expression encompasses a large proportion of CA3a particularly at dorsal or ventral sections, similar to what was previously acknowledged with in situ hybridization (Lein et al., ,).
Figure 4.
PCP4 staining varies along the dorsal–ventral axis across horizontal sections of adult mouse hippocampus. The images of PCP4 immunostaining (A–D, I–L) and PCP4/DAPI staining overlays (E–H, M–P) of the example sections from dorsal (A,E,I,M), less dorsal (B,F,J,N), intermediate (C,G,K,O), and ventral levels (D,H,L,P) taken under lower (A–H) versus higher power (I–P) objectives. PCP4 staining is denser and more widespread in dorsal regions of the adult mouse hippocampus. The arrowhead indicates the end of the mossy fiber tract and beginning of CA2, and the short bar indicates the border between CA2 and CA1 as determined by cytoarchitectural structure revealed by DAPI staining. For quantification, the dorsal and less dorsal sections were pooled for the dorsal group, and the intermediate and ventral sections were pooled for the ventral group. Scale bar = 200 μm in A (applies to A–H); 100 μm in I (applies to I–P).
Figure 5.
PCP4 staining differs along the anterior–posterior axis across coronal sections of adult mouse hippocampus. A–D: The overlaid images (PCP4, green and mossy fiber tract, magenta) of the coronal sections at different anterior–posterior (AP) coordinates show more widespread PCP4 immunolabeling at the posterior sections. The PCP4 staining was done on the sections of Calb2-Cre:tdTomato mice, in which dentate granule cells express red fluorescent proteins in their mossy fibers. The arrowhead indicates the end of the mossy fiber tract, and the thin white line indicates the border between CA2 and CA1. Scale bar = 200 μm in A (applies to A–D).
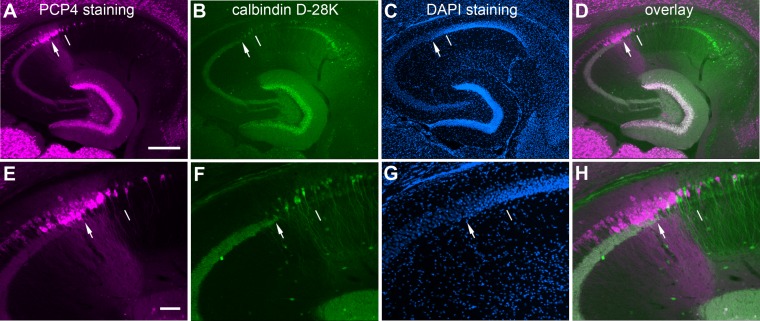
We compared the use of PCP4 with other molecules that can be potentially used as CA2 markers. Although FGF-2 and α-actinin have been used for CA2 studies (Chevaleyre and Siegelbaum, 2010; Mercer et al., 2007), we found that their immunostaining was not clear in the CA2 region. Among the calcium binding proteins tested (calretinin, calbindin-D28K, and parvalbumin), we found that calbindin-D28K (CB) immunostaining can be used for hippocampal subfield delineation (Fig. 6), which is supported by previous work (Forster et al., 2006; Sloviter, 1989). Strong CB immunoreactivity was present in the mossy fiber tract and CA1 pyramidal cell layer, and was relatively weak in the transitional CA2 region, but not in the CA3 pyramidal cell layer (Fig. 6B,F). Given that there is some uncertainty in the use of PCP4+ mossy fibers to define the border between distal CA3 and CA2, particularly at anterior coronal or dorsal horizontal sections where the ending of mossy fibers is not well defined, colabeling of mossy fibers with CB staining (Fig. 6B,F) together with PCP4 staining (Fig. 6A,E) can help with precise determination of the distal CA3/CA2 border (Fig. 6C,D, G,H). Nevertheless, it appears that single PCP4 immunostaining is more effective and definitive than CB staining in determining the CA2 region.
Figure 6.
Double immunolabeling of mouse hippocampal sections against PCP4 and calbindin D-28K (CB) further helps to determine the distal CA3/CA2 border. A–H: The images of PCP4 immunostaining (A,E), CB staining (B,F), DAPI staining (C,G), and PCP4/CB staining overlays (D,H) of one example hippocampal section, taken under lower (A–D) versus higher power (E–H) objectives. The arrowhead indicates the end of the mossy fiber tract, and the thin white line indicates the border between CA2 and CA1. Scale bar = 200 μm in A (applies to A–D); 50 μm in E (applies to E–H).
Characterization of mouse hippocampal CA2
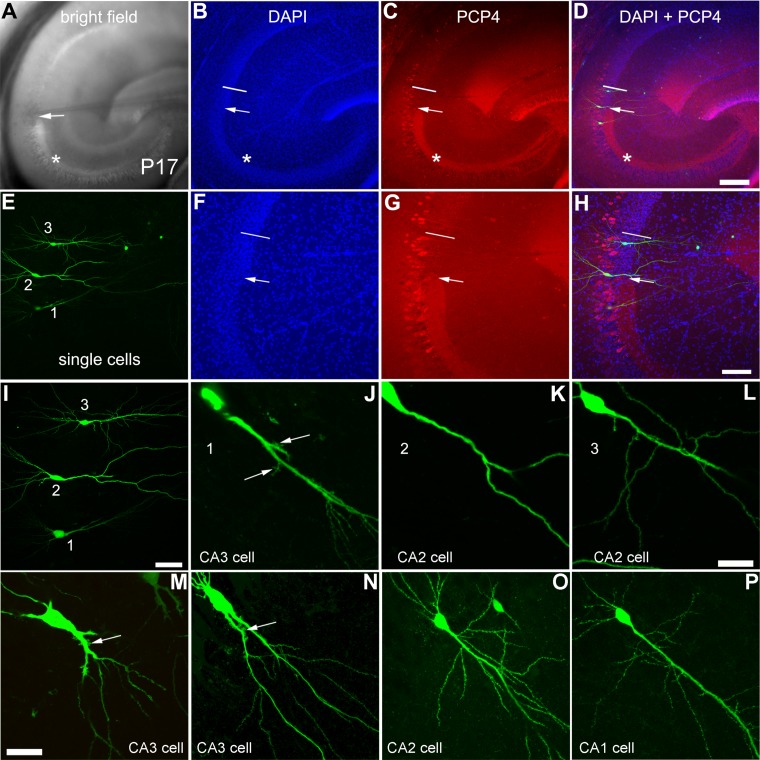
We continued to determine whether the PCP4-delineated CA2 region can be distinguished from distal CA3 and proximal CA1. We examined the detailed morphology, intrinsic physiology, and local circuit connections of mouse hippocampal CA2 cells, using whole-cell recordings and LSPS in living brain slices of P15–P18 mice. Under differential interference contrast (DIC) microscopy, the CA2 region in the slice can be visually identified as a narrow region intermediate between CA3, determined by its suprapyramidal layer (i.e., the stratum lucidum) through which the mossy fiber tract courses, and CA1, characterized by its compact cell body layer. The PCP4 staining worked sufficiently well in 400-μm-thick slices postfixed after physiological recording, and confirmed the CA2 region identified in the living slice image (Fig. 7A–H). Differential cell morphology was revealed by cell fills followed by intracellular biocytin staining across CA3 (including CA3a, CA3b), CA2, and CA1 (Figs. 7, 8). These results are in accordance with CA2 identification by PCP4 immunostaining. Wherease excitatory pyramidal cells in CA3 had complex postsynaptic spines termed thorny excrescences in their proximal dendrites (Fig. 7J,M,N), CA2 excitatory cells, like CA1 cells, had dense dendritic spines, but did not have such thorny excrescences (Fig. 7K,L,O).
Figure 7.
Excitatory pyramidal cells in the CA2 region have distinct morphology from CA3 excitatory cells. A–D: The brightfield image of a living hippocampal slice (A), the aligned images of the same slice fixed and stained by DAPI and PCP4 (B,C), and their overlay image (D). E–H: Intracellularly recorded excitatory cells revealed by biocytin staining, which are located at distal CA3 (1), the beginning of CA2 (2), and the end of CA2 (3) in the same slice shown in A. Their locations are verified through DAPI and PCP4 immunostaining (F,G,H). The arrow depicts the end of the mossy fiber tract and the beginning of CA2; the short bar represents the border between CA2 and CA1. I–L: Detailed morphology of the recorded cells. The distal CA3 excitatory cell (J) has thorny excrescences (indicated by the arrows) at its proximal apical dendrites; CA2 cells (K,L) show no sign of such complex postsynaptic spines. M–P: More example cells in CA3 and CA2, as well as in CA1. Excitatory pyramidal cells from midfield (CA3b) and distal CA3 (CA3a) are shown with thorny excrescences (indicated by the arrow) in M and N, respectively. The CA2 pyramidal cells (K,L,O) are similar to the CA1 pyramidal cell (P), lacking thorny excrescences at their proximal apical dendrites. Scale bar = 200 μm in D (applies to A–D); 100 μm in H (applies to E–H); 50 μm in I; 20 μm in L (applies to J–L); and 40 μm in M (applies to M–P).
Figure 8.
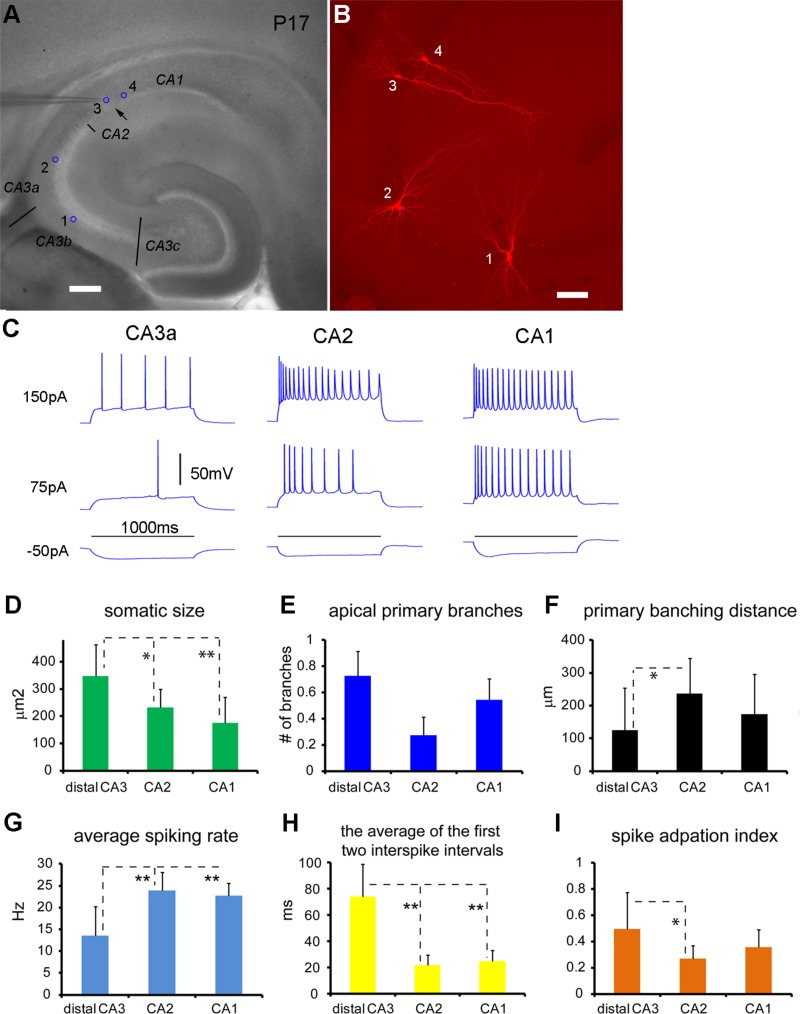
Excitatory pyramidal cells in CA2 and CA1 differ from distal CA3 excitatory cells in their morphological and intrinsic electrophysiological properties. A,B: The locations and morphology of the recorded cells visualized by intracellular biocytin staining. The cells of 1–4 (indicted by the blue circles in A) are located in CA3b, CA3a, CA2, and CA1, respectively. Note the morphological transition of the pyramidal cell shapes from CA3 to CA2 and CA1. Whereas cell 1 has two major apical dendrites, cells 2 and 4 have two primary branches originating from their single apical dendrites. Cell 3 has no apparent primary branch off its apical dendrite. The primary branching distances of cells 1 and 2 are shorter than that of cell 4. C: Intrasomatic current injection responses of the cells of 2–4 shown in A and B. Generally, CA2 excitatory cells, like CA1 cells, have higher spiking rates than CA3 excitatory cells. D–F: Group summary data of morphological quantification for CA3a, CA2, and CA1 cells (n = 11, 12, and 12, respectively). The values are presented as mean ± SD. G–I: Group summary data of electrophysiological quantification for CA3a, CA2, and CA1 cells (n = 20, 14, and 14, respectively). * and ** indicate the statistical significance of P < 0.05 and P < 0.005 for comparison between CA3a and CA2 or CA1, respectively. Scale bar = 200 μm in A; 100 μm in B.
This morphological feature, as originally identified by Lorente de Nó using Golgi staining, suggests that CA2 excitatory cells do not receive direct synaptic inputs from dentate granule cells as do CA3 excitatory cells. As CA3 and CA1 have large and small pyramidal cells, respectively, and CA2 have CA3-like pyramidal cells shown in Golgi staining (Lorente de Nó, 1934) (also see Fig. 3 C,D), our quantification indicates that the average somatic sizes of intracellularly labeled pyramidal cells differ across these regions; the least to greatest average somatic size is CA1<CA2<CA3 (Fig. 8D; Kruskal–Wallis test: P = 0.002, Mann–Whitney U-tests for group comparisons: CA3 versus CA2 P = 0.02, CA3 versus CA1 P = 0.002, CA2 versus CA1 P = 0.045). In comparison with CA3 cells, both CA2 and CA1 excitatory cells tended to have fewer primary apical branches and more distant branching points (Fig. 8E,F). Whereas CA2 neurons show some morphological differences with CA1 neurons, CA2 excitatory cells are generally similar to CA1 excitatory cells electrophysiologically (Table3). In contrast, CA2 neurons differed significantly from distal CA3 cells for many electrophysiological parameters including membrane capacitance, spike width, firing rate, and degree of spike interval adaptation (Table3, Fig. 8C,G–I).
To address whether PCP4-positive CA3a neurons electrophysiologically differ from other CA3 neurons not expressing PCP4, we compared the parameters of distal CA3 cells closely adjacent to CA2 (n = 9 cells) with those of CA3c/b excitatory cells (n = 15 cells). The two groups of cells (CA3c/b vs. PCP4+ CA3a) differed significantly overall in terms of such parameters as average spiking rate at the current injection of 200 pA (7.53 ± 4.52 Hz vs. 16.7 ± 8.52 Hz, P = 0.005), the average of the first two interspike intervals (82.9 ± 36.7 ms vs. 44.1 ± 38 ms, P = 0.009), and spike interval adaptation index (0.54 ± 0.2 vs. 0.33 ± 0.24, P = 0.02). Thus, the results indicate that PCP4-positive CA3a neurons are different from other CA3 neurons in CA3c/b subdivisions not expressing PCP4. Compared with CA3c/b cells, these PCP4-positive distal CA3a cells are more similar to CA2 cells.
We conducted photostimulation mapping experiments to examine intrahippocampal circuit connections to CA2, CA3, and CA1 excitatory cells. LSPS combined with whole-cell recordings allows for mapping inputs from many stimulation sites over a large region to single recorded neurons, which has a great technical advantage over paired intracellular recordings limited in highly localized circuits. Specifically, the LSPS approach involves recording from single neurons, and then sequentially stimulating at other sites in order to generate action potentials from neurons in those sites to establish the map of input sources for the recorded neuron based on activation of presynaptic inputs. As LSPS evoked action potentials from the recorded cells in DG, CA3, and CA1 in a spatially restricted manner (Fig. 9), combined with other control experiments (see Materials and Methods), it is inferred that this approach has a sufficient spatial resolution to map direct synaptic inputs from specific hippocampal subfields and DG to individual excitatory neurons.
Our results indicate that CA2 excitatory pyramidal cells receive photostimulation-evoked input from CA3, but do not have photostimulation-evoked input from DG (Fig. 10). The CA2 cells received most excitatory inputs from CA3a and CA3b, and the average strengths of summed excitatory synaptic input (excitatory postsynaptic currents, EPSCs) measured from stimulation sites of CA3a and CA3b were 50.1 ± 46.8 pA and 88.9 ± 154.6 pA (n = 11 cells), respectively. Whereas CA2 cells received input from within CA2 (19.5 ± 27.7 pA), they did not receive photostimulation-evoked input from DG or CA1, compared with baseline spontaneous activity. That is, statistical analysis showed that the EPSC input amplitudes from DG or CA1 during photostimulation did not differ significantly from those of spontaneously occurring EPSCs. To further distinguish spontaneous events from photostimulation-evoked inputs from DG sites, multiple photostimulation maps were collected from the same CA2 cells and maps were merged into an average map by a “two successes” filtering criterion described in a published study (Zhang et al., 2012). Only sites associated with EPSCs in the analysis windows during at least two out of three trials were considered to be actual input sites. This analysis confirmed the absence of DG input to CA2 cells (Fig. 10D–F). In contrast, in the same slices in which CA2 cells (n = 6) were recorded, CA3 cells received clear DG input (Fig. 10G–I), with the average input strength from DG being 49.7 ± 48.3 pA (measured from five CA3a and three CA3b cells).
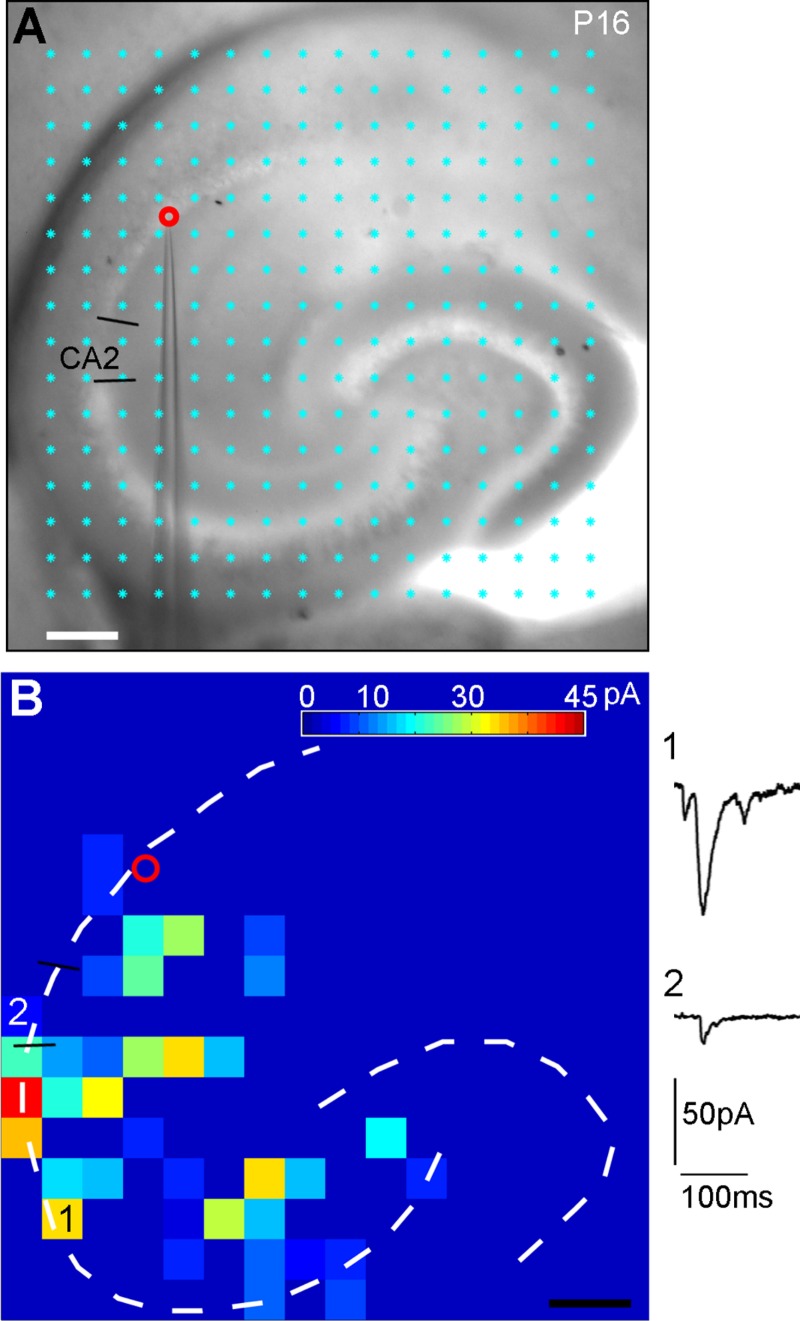
Overall, CA2 cells had weaker intrahippocampal excitatory inputs than CA3 cells, as the average strengths of summed EPSC inputs measured from CA2 (n =11), CA3a (n = 8), and CA3b (n = 7) excitatory pyramidal cells were 149 ± 127.4 pA, 262.9 ± 235 pA, and 386.9 ± 301 pA (CA2 vs. CA3a P = 0.045, CA2 vs. CA3b P = 0.02), respectively. Whereas CA3a cells received excitatory inputs from CA2 region with its average strength being 52.1 ± 65.9 pA, CA3b did not receive CA2 input. In addition, we found that CA1 excitatory pyramidal cells (n = 10 cells) received the majority of excitatory synaptic input from the CA3 region and weaker inputs from the CA2 and CA1 regions (Fig. 11), with the average input strengths measured from proximal CA3, distal CA3, CA2, and CA1 being 94.2 ± 63.9 pA, 51.1 ± 42.1 pA, 8.9 ± 18.7 pA, and 16 ± 13 pA, respectively.
Figure 11.
CA1 excitatory pyramidal cells receive strong and extensive excitatory synaptic input from CA3. A: The mouse hippocampal slice image with the superimposed photostimulation sites (16 × 16 cyan dots, spaced at 100 μm × 100 μm). The somatic location of the recorded CA1 pyramidal cell is indicated by the red circle. B: The color-coded, averaged input map illustrating that CA1 excitatory cells receive extensive synaptic input from CA3, as well as weaker input from CA1 and CA2. The numbered sites correspond to the illustrated response traces. Scale bar = 200 μm in A,B.
Postnatal development of the CA2 region
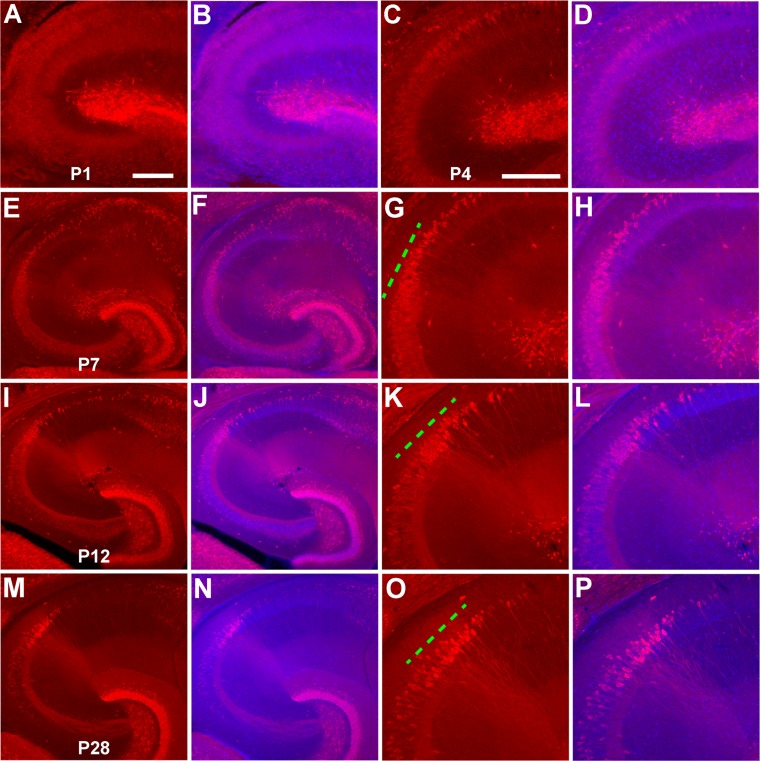
With the PCP4-based method for CA2 identification in hand, we used immunostaining of the surrogate marker PCP4 in conjunction with gross slice morphology and circuit connection mapping to examine the developmental property of CA2. We assessed PCP4 immunostaining in horizontal hippocampal slices of postnatal animals at P1–P2, P4–P5, P6–P7, P10–P15, and P21–P25 (Fig. 12; see Table1 for the number of animals for each age group). PCP4 immunoreactivity appeared weak and diffuse around the presumptive CA2 and CA1 at P4–5 (Fig. 12C,D). The intensity of staining gradually increased by the end of first postnatal week (P7) (Fig. 12E–H). The PCP4-positive region became successively more refined by the middle of the second week (i.e., around P12); CA2 could be delineated from the adjacent distal CA3 region (Fig. 12I–L). By P21 and beyond, the CA2 region revealed by PCP4 immunostaining became spatially restricted and reached adult-like form. Note that the appearance and strengthening of PCP4 immunoreactivity at CA2 concurs with the development of mossy fiber tract revealed by PCP4 or CB staining. Thus, assuming that the strength of immunolabeling corresponds directly to the strength of PCP4 gene expression, gene driven labeling would be expected to be more useful for later ages due to the gradual emergence of PCP4 immunostaining.
Figure 12.
PCP4 immunostaining in the CA2 region emerges and develops postnatally. A–P: Images of PCP4 immunostaining (A,C,E,G,I,K,M,O) and PCP4/DAPI staining overlays (B,D,F,H,J,L,N,P) for P1, P4, P7, P12, and P28 mouse hippocampal sections, respectively. The images of PCP4 immunostaining and DAPI/PCP4 staining overlays are at different magnification, acquired under lower (E,F, I,J, M,N) versus higher power (A–D, G,H, K,L, O,P) objectives. The green dashed line indicates the dense PCP4 staining at the intermediate region between CA3 and CA1. Scale bar = 200 μm in A (also applies to B,E,F,I,J, M,N) and C (also applies to D,G,H,K,L,O,P).
The CA2 region does not appear to grow much in size during development (Fig. 10G,K,O), as the widths of PCP4-delineated CA2 regions are 176.1 ± 7.6 μm, 183.4 ± 34.8 μm, and 204 ± 25.5 μm (measured from three to five sections of each animal and averaged across three to four mice each age group) for the age groups of P6–P7, P10–P14, and P21–P25 mice, respectively. In addition, we measured the CA3 length (from proximal to distal end) of the same age groups, with the average lengths being 1,057.6 ± 55 μm, 1,198 ± 52.8 μm, and 1,307.1 ± 39.8 μm (measured from two to three sections of each animal across two to three mice of each age group) for P7, P14–P15, and P25 mice, respectively. By comparison, the degree of CA3 developmental growth was larger than that of CA2.
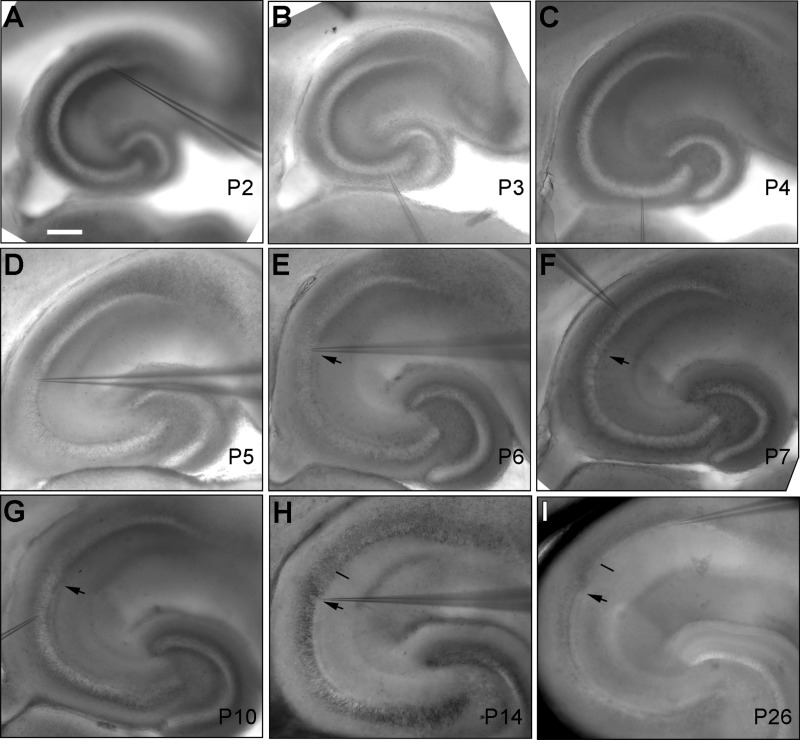
We also took advantage of brightfield images of living slice morphology to examine the CA2 development, and confirmed the CA2 regional differentiation during the postnatal development as seen in the PCP4 immunostaining. In acutely cut living slices, by P4 there was no differentiated region intermediate between CA3 and CA1 in gross morphology (Fig. 13A,B). Starting at P4–P5, a presumptive CA2 region appeared (Fig. 13C,D); by P6–P7 it was more distinguishable with differential gross cytoarchitecture of CA3 and CA1, and the detection of the mossy fiber tract (Fig. 13E,F). The CA2 region could be confidently identified by P14 and beyond (Fig. 13H–I). The overall CA subfield development and lamination patterns observed in the living slices of mouse developing hippocampus are consistent with previous studies using in situ hybridization of field-specific gene expression (Tole et al., 1997) and Timm’s silver staining (Zimmer and Haug, 1978).
Figure 13.
Examination of living slice morphology at different developmental times supports the postnatal emergence of a distinct CA2 region. A–I: Brightfield images of P2, P3, P4, P5, P6, P7, P10, P14, and P26 living mouse hippocampal sections, respectively. The arrowhead in E–I points to the end of the mossy fiber tract in distal CA3; the thin black bar indicates the CA2/CA1 border, which is identifiable at and beyond P14. Scale bar = 200 μm in A (applies to A–I).
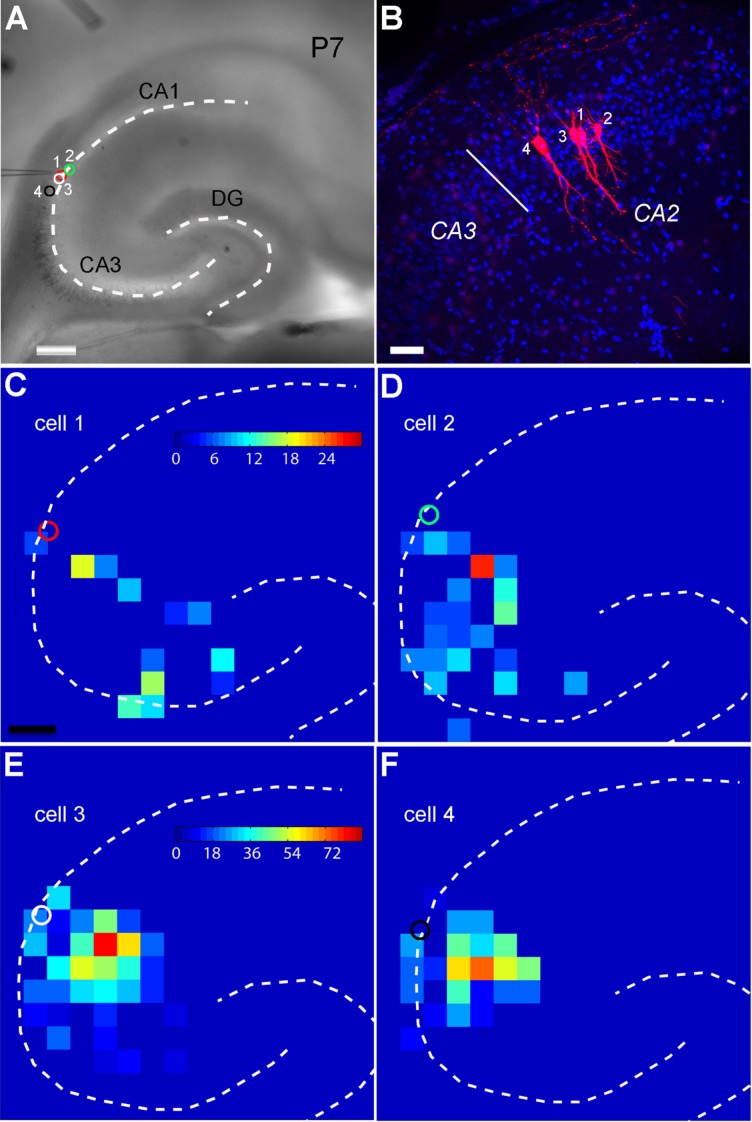
Electrophysiological recordings from the developing slices indicated that P1–P4 neurons exhibited immature spiking patterns (absent or broad poorly defined spikes) in response to depolarizing current injections, whereas cells beyond P4 exhibited more mature sharply defined spiking patterns. In addition, there was rapid morphological development of excitatory cells in distal CA3 and CA2 regions during the first postnatal week; excitatory pyramidal cells revealed by intracellular biocytin labeling had close to adult-like morphology with wide dendritic fields and extensive branches at or beyond P7 (Fig. 14A,B). Recordings from single cells in the emerging CA2 region revealed local excitatory circuit connections to CA2 excitatory cells at P7 (Fig. 14C–F). Although the total EPSC input strength for the cells of two age groups (P7 vs. P15–P18) were similar, the P7 cells had more input from distal CA3 than proximal CA3 compared with the CA2 cells at later developmental ages (c.f., Figs. 10 and 14), which suggests age-related developmental connections. The average strengths of summed EPSC inputs to P7 CA2 excitatory cells (n = 5 cells) were 28.8 ± 49.2 pA, 146.8 ± 157.9 pA, and 8.9 ± 15 pA for CA2, CA3a, and CA3b, respectively.
Figure 14.
Intrahippocampal excitatory circuit connections to CA2 excitatory pyramidal cells at P7. A: Mouse hippocampal slice image with the dashed lines showing the hippocampal contour. The somatic locations of four sequentially recorded CA2 pyramidal cells are indicated by the red, green, white, and black circles, respectively. B: The pyramidal cell morphology of the four recorded cells revealed by intracellular biocytin staining, against the DAPI (blue) staining. C–F: The color-coded, averaged input maps showing that these CA2 excitatory cells receive synaptic input from CA3 with different patterns and strengths. Scale bar = 200 μm in A and C (applies to C–F); 50 μm in B.
DISCUSSION
By using a suite of immunochemical staining, anatomical, and physiological techniques, we show that immunostaining for PCP4 is the best, most functionally useful way to localize the “classically defined” hippocampal CA2. Our analysis bridges the discrepancy observed between “classically defined” CA2 and “molecularly defined” CA2. The CA2 region delineated by PCP4 immunostaining have cell morphology, physiology, and synaptic circuit connections that are distinguishable from distal CA3 and proximal CA1 regions. Unlike distal CA3 cells, our photostimulation functional circuit mapping supports the idea that CA2 excitatory pyramidal cells do not receive excitatory synaptic input from dentate granule cells. Our data also suggest postnatal emergence of a distinct CA2 region, as PCP4 staining gradually emerges with increasing age, reaching adult-like form at age P21 onward.
Hippocampal CA2 identification and delineation
Lorente de Nó identified the CA2 region by means of histological staining with cresyl violet and Golgi staining, and defined the CA2 region as a CA subfield between CA1 and CA3. The CA2 region is estimated to be about 100–150 μm wide at certain coronal sections of rat hippocampus in later studies based on anatomical criteria (Ishizuka et al., 1995; Ochiishi et al., 1999; Swanson et al., 1978). By comparison, the CA2 region defined based on gene or protein expression in both rats and mice is typically much broader, sometimes more than 500 μm wide, particularly at the ventral posterior portion of the hippocampus (Lein et al., 2005). This is typically because any marker that is being expressed at the CA3/CA1 border is assumed to define CA2 without consideration of mossy fiber innervations. Hence, it is important to bring together the original cytoarchitectural criteria and molecular markers to define CA2 and other hippocampal subregions.
Although previous studies have used PCP4 as a CA2 marker, here for the first time we applied PCP4 immunostaining to hippocampal sections and revealed new and important information. We show that the classical definition of CA2, as confirmed functionally in this study, does not correspond to the extent of PCP4 expression, which currently represents the best estimate of “molecularly defined” CA2 (Laeremans et al., 2013). Although the immunoreactivity of PCP4 is localized in both CA2 and distal CA3 regions, PCP4+ mossy fibers concurrently detected by immunostaining allows us to distinguish CA2 (the PCP4-immunopostive portion with the absence of mossy fibers) from distal CA3 (the PCP4-immunopostive portion with the presence of mossy fibers) in mature mouse hippocampus. The total PCP4-stained regions (including both distal CA3 and CA2) range from ∼375 to ∼446 μm at coronal sections, being wider at the more posterior than anterior hippocampus, which fits with the reported values found by in situ hybridization of PCP4 gene expression in mouse hippocampus (Lein et al., 2005). However, the average width of the properly delineated CA2 is more spatially restricted, ∼100–150 μm across the anterior and posterior sections. At the horizontal sections, our estimation of the average length of the delineated CA2 region is about 200 μm across dorsal–ventral levels.
Excitatory neurons in hippocampal subfields
That the PCP4-delineated CA2 is a distinct subfield is supported by our characterization of the morphology, intrinsic electrophysiology, and circuit connections of excitatory pyramidal cells recorded from that region. CA2 excitatory cells have relatively large somatic sizes that overall are smaller than distal CA3 cells but larger than proximal CA1 cells. The cell packing densities also differ across these three regions. In agreement with the established anatomical criteria, CA2 excitatory cells are different from distal CA3 cells by lacking thorny excrescences in their proximal apical dendrites. The apical dendritic branching patterns also differ between distal CA3 and CA2 excitatory cells. In addition, electrophysiological properties differentiate excitatory cells in CA3–CA1. CA3 cells (including both CA3a and CA3c/b) generally have shorter action potential widths and lower spiking rates with more spike interval adaptation in response to intrasomatic current injections, compared with CA2 or CA1 cells. Interestingly, compared with other CA3 neurons in CA3c/b subdivisions not expressing PCP4, PCP4-positive CA3a neurons are more similar to CA2 cells in their electrophysiological parameters. This suggests that the changes in intrinsic electrophysiological properties between CA3 subdivisions may be related to PCP4 expression. Overall, these morphological and intrinsic electrophysiological differences suggest that CA2 and CA3 cells act as different types of functional elements for hippocampal circuit information processing. Whereas we found that CA2 cells have similar physiological properties to proximal CA1 cells in mouse hippocampus in the age group of P15–18, it has been noted that in rat and mouse hippocampus, CA2 and CA1 neurons have some differences in their intrinsic electrophysiological properties. For example, CA2 cells recorded from the age group of 11–21-day-old rats and mice are reported to have larger leak currents and more negative resting membrane potentials than CA1 neurons, and stronger current injection is required to evoke their action potentials (Zhao et al., 2007). Another recent study also reports that mouse CA2 neurons are distinguished from CA1 neurons by their absence of the slow after-hyperpolarization seen in CA1 neurons (Chevaleyre and Siegelbaum, 2010).
As neurons are integrated and function within cortical circuits, the connectional difference provides strong evidence for the distinction of the CA2 region. Using photostimulation mapping, we are able to examine and compare intrahippocampal circuit connections to excitatory cells across different hippocampal subfields. Local synaptic circuit connections differ for distal CA3, CA2, and CA1 excitatory cells. Unlike distal CA3 cells, CA2 cells do not receive direct DG input; in a way similar to CA1 cells, CA2 cells can receive extensive CA3 input from both distal and proximal CA3. In contrast, CA2 excitatory input can distinguish CA3a and CA3b cells, as CA3b cells do not receive excitatory input from the CA2 region. Whereas CA1 cells receive a great amount of input from CA3, our circuit mapping indicates that CA2 excitatory cells provide weak excitatory input to CA1 excitatory cells, consistent with the sparse connections demonstrated by whole-cell paired recordings between CA2 and CA1 excitatory cells (Chevaleyre and Siegelbaum, 2010). However, the LSPS approach is limited by its mapping of direct connections to target cell types by photoactivating presynaptic somatic spiking, which requires conservations of longer distance neuron to neuron connections in slice preparations. Alternatively, the subcellular channelrhodopsin-2 (ChR2)-assisted circuit mapping (sCRAM) approach can be used for future investigations of CA2 input sources including entorhinal cortex (EC) and DG, as this approach allows one to map presynaptic inputs defined by presynaptic ChR2 expression in axons from a particular input source to recorded neurons. As axons with intense ChR2 expression can be focally photoactivated by blue laser to produce postsynaptic responses via neurotransmitter release, the alternative approach can be free of slice cutting artifacts compared with LSPS.
In terms of synaptic plasticity, other studies have shown that CA2 is a special region in that no robust long-term potentiation (LTP) with highly variable long-term depression occurs at CA3–CA2 synapses via the Schaffer collaterals to CA2 (Simons et al., 2009; Zhao et al., 2007), but robust LTP is present at entorhinal cortico–CA2 synapses at the distal dendrites (Chevaleyre and Siegelbaum, 2010). These circuit connectional and physiological studies support CA2 as a unique and important region of hippocampal circuitry.
Development of CA2 subfield
So far, not much is known about CA2 development. In the developing hippocampus, two presumptive fields corresponding to the CA1 and CA3 fields can be distinguished in the mouse several days before birth by a complementary pattern of gene expression such as SCIP and KA1 (Grove and Tole, 1999; Tole et al., 1997). In early postnatal hippocampus, expression of SCIP and KA1 overlaps in this transitional field between CA1 and CA3; the mixing of SCIP- and KA1-expressing cells in the presumptive CA2 is evident at P7 and remains in the adult (Grove and Tole, 1999). Thus, the CA2 progenitor cells may originate from both CA1 and CA3 regions, but the emergence and development of the true identity of CA2 may be guided by multiple factors including unique CA2-localized molecular expression (see above) and selective cortical and subcortical circuit connections (Ochiishi et al., 1999).
Within this context, in the present study, we have attempted to address the developmental feature of CA2 through immunostaining of the surrogate marker PCP4 at different postnatal ages in conjunction with morphological and physiological analysis. PCP4 has been known to be developmentally regulated in rat cerebellum as its mRNA rises from low levels at embryonic day 17 of gestation in the rat to a plateau value by P18, with the polypeptide appearing at around birth and rising to adult levels by the third postnatal week (Ziai et al., 1988). Resembling the cerebellar developmental pattern, in the mouse hippocampus, PCP4 starts to appear diffusely at P4–5, and gradually becomes localized at the presumptive CA2 region around P7; then the PCP4 immunostaining pattern becomes successively more refined at later development time points, reaching adult form by P21. In addition, in the present study the CA2 development assessed by the immunostaining assay was also confirmed by CA2 regional differentiation observed in living slice morphology. Similar to PCP4 immunoreactivity, adenosine A1 receptor-like immunoreactivity is diffuse on P7 around rat hippocampal CA2, and shows increased intensity and spatial restriction by P21 (Ochiishi et al., 1999). Thus, these data suggest that a distinct CA2 region, characteristic of the expression of at least some molecular markers, emerges and develops postnatally.
Our study has identified anatomical and developmental features, and mapped physiological properties of the CA2 region. This work has laid a new foundation for further CA2 circuit and functional studies.
Acknowledgments
We thank Dr. Todd C. Holmes for his kind help with the manuscript writing.
CONFLICT OF INTEREST STATEMENT
The authors report no conflict of interest.
ROLE OF AUTHORS
All authors had full access to all the data in the study and take responsibility for the integrity of the data and the accuracy of the data analysis. All experiments were performed in the laboratory of Dr. Xiangmin Xu at the University of California, Irvine. Data were collected, analyzed, and interpreted by TI, AS, KL, ET, and XX. XX conceived and designed the experiments, supervised the project, and wrote the manuscript. All authors approved the final version of the manuscript and assert that all persons designated as authors qualify for authorship, and all those who qualify for authorship are listed.
LITERATURE CITED
- Bischofberger J, Engel D, Li L, Geiger JR, Jonas P. Patch-clamp recording from mossy fiber terminals in hippocampal slices. Nat Protoc. 2006;1:2075–2081. doi: 10.1038/nprot.2006.312. [DOI] [PubMed] [Google Scholar]
- Bland ST, Tamlyn JP, Barrientos RM, Greenwood BN, Watkins LR, Campeau S, Day HE, Maier SF. Expression of fibroblast growth factor-2 and brain-derived neurotrophic factor mRNA in the medial prefrontal cortex and hippocampus after uncontrollable or controllable stress. Neuroscience. 2007;144:1219–1228. doi: 10.1016/j.neuroscience.2006.11.026. [DOI] [PMC free article] [PubMed] [Google Scholar]
- Brivanlou IH, Dantzker JL, Stevens CF, Callaway EM. Topographic specificity of functional connections from hippocampal CA3 to CA1. Proc Natl Acad Sci U S A. 2004;101:2560–2565. doi: 10.1073/pnas.0308577100. [DOI] [PMC free article] [PubMed] [Google Scholar]
- Burkhalter A. Many specialists for suppressing cortical excitation. Front Neurosci. 2008;2:155–167. doi: 10.3389/neuro.01.026.2008. [DOI] [PMC free article] [PubMed] [Google Scholar]
- Caruana DA, Alexander GM, Dudek SM. New insights into the regulation of synaptic plasticity from an unexpected place: hippocampal area CA2. Learn Mem. 2012;19:391–400. doi: 10.1101/lm.025304.111. [DOI] [PMC free article] [PubMed] [Google Scholar]
- Chevaleyre V, Siegelbaum SA. Strong CA2 pyramidal neuron synapses define a powerful disynaptic cortico-hippocampal loop. Neuron. 2010;66:560–572. doi: 10.1016/j.neuron.2010.04.013. [DOI] [PMC free article] [PubMed] [Google Scholar]
- Dailey ME, Buchanan J, Bergles DE, Smith SJ. Mossy fiber growth and synaptogenesis in rat hippocampal slices in vitro. J Neurosci. 1994;14:1060–1078. doi: 10.1523/JNEUROSCI.14-03-01060.1994. [DOI] [PMC free article] [PubMed] [Google Scholar]
- Dantzker JL, Callaway EM. Laminar sources of synaptic input to cortical inhibitory interneurons and pyramidal neurons. Nat Neurosci. 2000;3:701–707. doi: 10.1038/76656. [DOI] [PubMed] [Google Scholar]
- Fletcher TL, Cameron P, De Camilli P, Banker G. The distribution of synapsin I and synaptophysin in hippocampal neurons developing in culture. J Neurosci. 1991;11:1617–1626. doi: 10.1523/JNEUROSCI.11-06-01617.1991. [DOI] [PMC free article] [PubMed] [Google Scholar]
- Forster E, Zhao S, Frotscher M. Laminating the hippocampus. Nat Rev Neurosci. 2006;7:259–267. doi: 10.1038/nrn1882. [DOI] [PubMed] [Google Scholar]
- Grove EA, Tole S. Patterning events and specification signals in the developing hippocampus. Cereb Cortex. 1999;9:551–561. doi: 10.1093/cercor/9.6.551. [DOI] [PubMed] [Google Scholar]
- Ishizuka N, Cowan WM, Amaral DG. A quantitative analysis of the dendritic organization of pyramidal cells in the rat hippocampus. J Comp Neurol. 1995;362:17–45. doi: 10.1002/cne.903620103. [DOI] [PubMed] [Google Scholar]
- Jones MW, McHugh TJ. Updating hippocampal representations: CA2 joins the circuit. Trends Neurosci. 2011;34:526–535. doi: 10.1016/j.tins.2011.07.007. [DOI] [PubMed] [Google Scholar]
- Jung MW, Wiener SI, McNaughton BL. Comparison of spatial firing characteristics of units in dorsal and ventral hippocampus of the rat. J Neurosci. 1994;14:7347–7356. doi: 10.1523/JNEUROSCI.14-12-07347.1994. [DOI] [PMC free article] [PubMed] [Google Scholar]
- Kawaguchi Y, Kondo S. Parvalbumin, somatostatin and cholecystokinin as chemical markers for specific GABAergic interneuron types in the rat frontal cortex. J Neurocytol. 2002;31:277–287. doi: 10.1023/a:1024126110356. [DOI] [PubMed] [Google Scholar]
- Kleerekoper QK, Putkey JA. PEP-19, an intrinsically disordered regulator of calmodulin signaling. J Biol Chem. 2009;284:7455–7464. doi: 10.1074/jbc.M808067200. [DOI] [PMC free article] [PubMed] [Google Scholar]
- Laeremans A, Nys J, Luyten W, D'Hooge R, Paulussen M, Arckens L. AMIGO2 mRNA expression in hippocampal CA2 and CA3a. Brain Struct Funct. 2013;218:123–130. doi: 10.1007/s00429-012-0387-4. [DOI] [PubMed] [Google Scholar]
- Lein ES, Zhao X, Gage FH. Defining a molecular atlas of the hippocampus using DNA microarrays and high-throughput in situ hybridization. J Neurosci. 2004;24:3879–3889. doi: 10.1523/JNEUROSCI.4710-03.2004. [DOI] [PMC free article] [PubMed] [Google Scholar]
- Lein ES, Callaway EM, Albright TD, Gage FH. Redefining the boundaries of the hippocampal CA2 subfield in the mouse using gene expression and 3-dimensional reconstruction. J Comp Neurol. 2005;485:1–10. doi: 10.1002/cne.20426. [DOI] [PubMed] [Google Scholar]
- Lorente de Nó R. Studies on the structure of the cerebral cortex. II. Continuation of the study of the ammonic system. J Psychol Neurol (Lpz) 1934;46:113–177. [Google Scholar]
- Madisen L, Zwingman Ta, Sunkin SM, Oh SW, Zariwala Ha, Gu H, Ng LL, Palmiter RD, Hawrylycz MJ, Jones AR, Lein ES, Zeng H. A robust and high-throughput Cre reporting and characterization system for the whole mouse brain. Nat Neurosci. 2010;13:133–140. doi: 10.1038/nn.2467. [DOI] [PMC free article] [PubMed] [Google Scholar]
- Mercer A, Trigg HL, Thomson AM. Characterization of neurons in the CA2 subfield of the adult rat hippocampus. J Neurosci. 2007;27:7329–7338. doi: 10.1523/JNEUROSCI.1829-07.2007. [DOI] [PMC free article] [PubMed] [Google Scholar]
- Murphy GJ, Du LS. Postnatal development of spike generation in rat medial vestibular nucleus neurons. J Neurophysiol. 2001;85:1899–1906. doi: 10.1152/jn.2001.85.5.1899. [DOI] [PubMed] [Google Scholar]
- Ochiishi T, Saitoh Y, Yukawa A, Saji M, Ren Y, Shirao T, Miyamoto H, Nakata H, Sekino Y. High level of adenosine A1 receptor-like immunoreactivity in the CA2/CA3a region of the adult rat hippocampus. Neuroscience. 1999;93:955–967. doi: 10.1016/s0306-4522(99)00179-7. [DOI] [PubMed] [Google Scholar]
- Putkey JA, Kleerekoper Q, Gaertner TR, Waxham MN. A new role for IQ motif proteins in regulating calmodulin function. J Biol Chem. 2003;278:49667–49670. doi: 10.1074/jbc.C300372200. [DOI] [PubMed] [Google Scholar]
- Romer B, Krebs J, Overall RW, Fabel K, Babu H, Overstreet-Wadiche L, Brandt MD, Williams RW, Jessberger S, Kempermann G. Adult hippocampal neurogenesis and plasticity in the infrapyramidal bundle of the mossy fiber projection: I. Co-regulation by activity. Front Neurosci. 2011;5:107. doi: 10.3389/fnins.2011.00107. [DOI] [PMC free article] [PubMed] [Google Scholar]
- Sahay A, Hen R. Adult hippocampal neurogenesis in depression. Nat Neurosci. 2007;10:1110–1115. doi: 10.1038/nn1969. [DOI] [PubMed] [Google Scholar]
- Shepherd GM, Svoboda K. Laminar and columnar organization of ascending excitatory projections to layer 2/3 pyramidal neurons in rat barrel cortex. J Neurosci. 2005;25:5670–5679. doi: 10.1523/JNEUROSCI.1173-05.2005. [DOI] [PMC free article] [PubMed] [Google Scholar]
- Shepherd GM, Stepanyants A, Bureau I, Chklovskii D, Svoboda K. Geometric and functional organization of cortical circuits. Nat Neurosci. 2005;8:782–790. doi: 10.1038/nn1447. [DOI] [PubMed] [Google Scholar]
- Shi Y, Nenadic Z, Xu X. Novel use of matched filtering for synaptic event detection and extraction. PLoS One. 2010;5:e15517. doi: 10.1371/journal.pone.0015517. [DOI] [PMC free article] [PubMed] [Google Scholar]
- Simons SB, Escobedo Y, Yasuda R, Dudek SM. Regional differences in hippocampal calcium handling provide a cellular mechanism for limiting plasticity. Proc Natl Acad Sci U S A. 2009;106:14080–14084. doi: 10.1073/pnas.0904775106. [DOI] [PMC free article] [PubMed] [Google Scholar]
- Sloviter RS. Calcium-binding protein (calbindin-D28k) and parvalbumin immunocytochemistry: localization in the rat hippocampus with specific reference to the selective vulnerability of hippocampal neurons to seizure activity. J Comp Neurol. 1989;280:183–196. doi: 10.1002/cne.902800203. [DOI] [PubMed] [Google Scholar]
- Swanson LW, Wyss JM, Cowan WM. An autoradiographic study of the organization of intrahippocampal association pathways in the rat. J Comp Neurol. 1978;181:681–715. doi: 10.1002/cne.901810402. [DOI] [PubMed] [Google Scholar]
- Taniguchi H, He M, Wu P, Kim S, Paik R, Sugino K, Kvitsiani D, Fu Y, Lu J, Lin Y, Miyoshi G, Shima Y, Fishell G, Nelson SB, Huang ZJ. A resource of Cre driver lines for genetic targeting of GABAergic neurons in cerebral cortex. Neuron. 2011;71:995–1013. doi: 10.1016/j.neuron.2011.07.026. [DOI] [PMC free article] [PubMed] [Google Scholar]
- Tole S, Christian C, Grove EA. Early specification and autonomous development of cortical fields in the mouse hippocampus. Development. 1997;124:4959–4970. doi: 10.1242/dev.124.24.4959. [DOI] [PubMed] [Google Scholar]
- Weiler N, Wood L, Yu J, Solla SA, Shepherd GM. Top-down laminar organization of the excitatory network in motor cortex. Nat Neurosci. 2008;11:360–366. doi: 10.1038/nn2049. [DOI] [PMC free article] [PubMed] [Google Scholar]
- Xu X. “High precision and fast functional mapping of brain circuitry through laser scanning photostimulation and fast dye imaging,”. In: Wang C-C, editor. Laser Scanning, Theory and Applications. Madrid: Rijeka, Croatia: InTech; 2011. pp. 113–132. [Google Scholar]
- Xu X, Callaway EM. Laminar specificity of functional input to distinct types of inhibitory cortical neurons. J Neurosci. 2009;29:70–85. doi: 10.1523/JNEUROSCI.4104-08.2009. [DOI] [PMC free article] [PubMed] [Google Scholar]
- Xu X, Roby KD, Callaway EM. Mouse cortical inhibitory neuron type that coexpresses somatostatin and calretinin. J Comp Neurol. 2006;499:144–160. doi: 10.1002/cne.21101. [DOI] [PubMed] [Google Scholar]
- Xu X, Roby KD, Callaway EM. Immunochemical characterization of inhibitory mouse cortical neurons: three chemically distinct classes of inhibitory cells. J Comp Neurol. 2010;518:389–404. doi: 10.1002/cne.22229. [DOI] [PMC free article] [PubMed] [Google Scholar]
- Young WS, Li J, Wersinger SR, Palkovits M. The vasopressin 1b receptor is prominent in the hippocampal area CA2 where it is unaffected by restraint stress or adrenalectomy. Neuroscience. 2006;143:1031–1039. doi: 10.1016/j.neuroscience.2006.08.040. [DOI] [PMC free article] [PubMed] [Google Scholar]
- Zhang W, Huguenard JR, Buckmaster PS. Increased excitatory synaptic input to granule cells from hilar and CA3 regions in a rat model of temporal lobe epilepsy. J Neurosci. 2012;32:1183–1196. doi: 10.1523/JNEUROSCI.5342-11.2012. [DOI] [PMC free article] [PubMed] [Google Scholar]
- Zhao M, Choi YS, Obrietan K, Dudek SM. Synaptic plasticity (and the lack thereof) in hippocampal CA2 neurons. J Neurosci. 2007;27:12025–12032. doi: 10.1523/JNEUROSCI.4094-07.2007. [DOI] [PMC free article] [PubMed] [Google Scholar]
- Zhao X, Lein ES, He A, Smith SC, Aston C, Gage FH. Transcriptional profiling reveals strict boundaries between hippocampal subregions. J Comp Neurol. 2001;441:187–196. doi: 10.1002/cne.1406. [DOI] [PubMed] [Google Scholar]
- Ziai MR, Sangameswaran L, Hempstead JL, Danho W, Morgan JI. An immunochemical analysis of the distribution of a brain-specific polypeptide, PEP-19. J Neurochem. 1988;51:1771–1776. doi: 10.1111/j.1471-4159.1988.tb01158.x. [DOI] [PubMed] [Google Scholar]
- Zimmer J, Haug FM. Laminar differentiation of the hippocampus, fascia dentata and subiculum in developing rats, observed with the Timm sulphide silver method. J Comp Neurol. 1978;179:581–617. doi: 10.1002/cne.901790309. [DOI] [PubMed] [Google Scholar]


