Abstract
Background
There currently is a need for cost-effective, quantitative techniques to evaluate the gradual progression of Alzheimer's disease (AD). Measurement techniques based on diffuse optical spectroscopy can detect blood perfusion and brain cellular composition changes, through measuring the absorption (µa) and reduced scattering (µs′) coefficients, respectively, using non-ionizing near-infrared light. Previous work has shown that brain perfusion deficits in an AD mouse model can be detected. The objective of this study was to determine if µs′ is sensitive to the inflammation and neuron death found in AD.
Methods
We used spatial frequency domain imaging (SFDI) to form quantitative maps of µa and µs′ in 3-month old male CaM/Tet-DTA mice harboring transgenes for the doxycyline-regulated neuronal expression of diphtheria toxin. When doxycycline is removed from the diet, CaM/Tet-DTA mice develop progressive neuronal loss in forebrain neurons. Mice (n = 5) were imaged longitudinally immediately prior to and after 23 days of lesion induction, and µa and µs′ (30 wavelengths, 650–970 nm) were compared to properties obtained from Tet-DTA controls (n = 5). Neuron death and infiltration of inflammatory cells in brain cortical slices was confirmed with immunohistochemistry.
Results
No significant difference in baseline scattering and absorption were measured between CaM/Tet-DTA mice and controls. After 23 days of lesion induction, brain cortical µs′ was 11–16% higher in the CaM/Tet-DTA mice than in controls (P < 0.03). Longitudinal imaging showed no significant difference in µs′ between the first and 23rd day of imaging in controls. Removing doxycycline from the diet was associated with a significant decrease in total hemoglobin concentrations (119 ± 9 µM vs. 91 ± 8 µM) (P < 0.05) in controls, but not in CaM/Tet-DTA mice.
Conclusions
Neuronal death and brain inflammation are associated with increased tissue scattering (µs′) and this optical biomarker may be useful in pre-clinical AD therapy evaluation or monitoring of disease progression in AD patients.Lasers Surg. Med. 46:27–33, 2014. © 2013 The Authors. Lasers in Surgery and Medicine Published by Wiley Periodicals, Inc.
Keywords: diffuse optical spectroscopy, absorption, scattering, spatial frequency domain imaging, neuron death, inflammation
INTRODUCTION
Alzheimer's disease (AD), the most common dementia associated with an accumulation of amyloid-β plaques and tau tangles, affects over 35 million people worldwide and there currently is no cure 1. A major problem with treating AD is that by the time clinical symptoms (e.g., memory loss) appear, the disease is so advanced that reversing or slowing the process is largely ineffective 2. Medical imaging research suggests hippocampal atrophy and reduced brain perfusion 3, coupled with low brain metabolism 4, could be early biomarkers of AD. Amyloid-β plaques can be directly visualized with molecular imaging compounds such as Pittsburgh compound B (PIB) 5 and 18F flutemetamol (flute) 6. However, these medical imaging techniques are not ideal for screening at-risk populations because they are expensive, radioactive, and limited mainly to research facilities.
We have been actively investigating diffuse optical spectroscopy (DOS) as a non-ionizing, sensitive, and less expensive alternative to detecting AD biomarkers. DOS techniques probe thick living tissue with red and near-infrared light (600–1,000 nm) to measure the absorption (µa) and reduced scattering (µs′) coefficients of the tissue. The absorption spectra can be decomposed into functional parameters, such as oxy-hemoglobin (HbO2), deoxy- hemoglobin (Hb), tissue oxygen saturation (O2 Sat), and water and lipid content 7. Reduced scattering coefficients are indicative of the tissue architecture, which may change due to cellular morphological changes 8 or apoptosis 9. DOS instrumentation can range from fiber-based designs meant to interrogate human brain cortex through skin and skull 10, to non-contact, camera-based measurements that allow for a wider field-of-view with reduced penetration depth 7. Our strategy is to use mouse brain optical properties measured with a camera-based instrument to inform human brain measurements with the fiber-based DOS instruments.
This study employs a camera-based DOS technique, spatial frequency domain imaging (SFDI), to characterize the in-vivo, spatially resolved optical properties in mouse models of AD. In a previous study 11, we demonstrated extensive optical property differences in the brain between a triple transgenic mouse model of AD (3×Tg-AD) and age-matched controls. Average µs′ values measured over the 650–970 nm wavelength range were 13–26% higher than those in controls, and the heavy amyloid-β and tau build-up in the 3×Tg-AD mice was associated with a 27% reduction in total hemoglobin (Total Hb), as compared with controls 11. While the 3×Tg-AD mice suffer from microgliosis 12 and astrocytosis 13, key components of AD that could contribute to changes in measured µs′, these mice do not develop the significant neuronal loss seen in human AD. Therefore, in this work we seek to better characterize the AD scattering biomarker in the CaM/Tet-DTA mouse model 14, which allows controlled lesioning of forebrain neurons by removing doxycycline from the diet.
METHODS
Animal Model
All mice were bred and raised in the UC Irvine Institute for Memory Impairments and Neurological Disorders (UCI MIND). We imaged 3-month-old male CaM/Tet-DTA mice 14, which harbor transgenes for the doxycyline-regulated neuronal expression of diphtheria toxin. When doxycycline is removed from the diet, CaM/Tet-DTA mice develop progressive loss in forebrain neurons.
CaM/Tet-DTA mice (n = 5) were imaged longitudinally immediately prior to and after 23 days of lesion induction, and compared to images from Tet-DTA controls (n = 5) for scattering and absorption (30 wavelengths, 650–970 nm). An additional five CaM/Tet-DTA and nine Tet-DTA controls were imaged only after 23 days of lesion induction to test the reliability of longitudinal imaging.
Anesthesia was induced with isoflurane anesthesia (2% maintenance in 21% oxygen balanced by nitrogen, induction chamber). The head was secured in a stereotactic frame (Stoelting Co., Wood Dale, IL) equipped with a gas mask to enable repeatable positioning of the animal during imaging. The scalp was shaved and imaging windows were created by making a midline incision in the scalp and retracting the skin bilaterally to the temporalis muscle attachments. The skull was cleaned with a sterile cotton swab. Petroleum jelly (Vaseline, Unilever, London, UK) was used to create a well on the skull surface, and the well was filled with saline and covered with a glass coverslip. This approach prevents scattering artifacts from drying of the skull. During the surgery and the subsequent imaging sessions, the animal was kept at 37°C by a thermister-controlled heating pad (CWE, Inc., Ardmore, PA). Following surgery, isoflurane was turned down to 1% concentration and maintained at 1 L/minute. Excess gases were scavenged via a f/air adsorber unit (A.M. Bickford, Inc., Wales Center, NY). After imaging, the scalps of animals undergoing longitudinal imaging were closed via suture and allowed to recover. An antibiotic, Baytril (10 mg/ml), was administered in the drinking water to prevent infection. All skin wounds healed within 2 days. For imaging on Day 23, the same procedures listed above were performed. All procedures were performed in accordance with the regulations of the Institutional Animal Care and Use Committee (IACUC) at the University of California, Irvine (protocol no. 2010–2934).
SFDI Instrument and Analysis
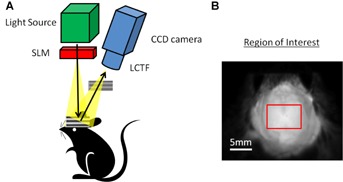
A schematic of the experimental arrangement is illustrated in Figure 1A. A complete description of SFDI instrumentation and data analysis has been previously presented in detail 11,15,16. Briefly, a 250 W broadband near-infrared light source (Newport Corp., Irvine, CA) was directed onto a spatial light modulator (Texas Instruments, Dallas, TX) in order to create twodimensional sinusoidal patterns at two spatial frequencies (0, 0.125 mm−1) and phase-shifted 120° apart, resulting in six total projections (three at each frequency). These light intensity patterns were serially projected onto the imaging window of the animal and the remitted reflectance was imaged with the Nuance Multispectral Imaging System (CRI, Inc., Woburn, MA). A liquid-crystal tunable filter was used to image specific wavelengths in a serial fashion, resulting in images at 30 equally-spaced center wavelengths from 650 to 970 nm (10 nm bandwidth). After demodulating the three phase-shifted images at each spatial frequency, µa and µs′ maps were created at each wavelength by performing a linear least-squares fit of the diffuse reflectance from the two spatial frequencies to a Monte Carlo model of light transport in tissue 16. All image processing and analysis of SFDI data was done with MATLAB software (MathWorks, 2007b, Natick, MA).
Fig 1.

A: Schematic of SFDI setup. The spatial light modulator (SLM) shapes the light source into 2-dimensional sinusoidal projections and the remitted reflectance is detected using a CCD camera with spectral differentiation by a liquid crystal-tunable filter (LCTF). B: Grayscale image of a superior view of the mouse cranium and the region of interest is enclosed by the red line.
In each SFDI image, a region of interest (ROI) was selected between the suture junctions, bregma and lambda, and bilaterally to the temporalis muscle attachments (Fig. 1B). The average of pixel intensities in the ROI for each animal was calculated and was used for all subsequent analysis. We applied a Levenberg–Marquardt least-squares fit with the wavelength-dependent Beer–Lambert law, to decompose the absorption spectra to estimates of HbO2, Hb, total hemoglobin (Total Hb = HbO2 + Hb), and tissue oxygen saturation (O2 sat = HbO2/Total Hb × 100). All averages, standard deviation bars, and P-values shown were calculated from mean ROI and standard deviation values between animals in each group. A two-tailed student's t-test analysis was applied to the absorption and scattering data, to assess differences between CaM/Tet-DTA and Tet-DTA mice.
Histology
To determine whether removal of doxycycline from the diet in the CaM/Tet-DTA mice resulted in expected trends, immunohistochemical methods were used. We expected to observe a decrease in neuronal cells and an increase in inflammatory microglia and astrocytes. After the last imaging session for a given animal, the animal was euthanized, and the brain was preserved in 10% formalin, cryo-protected with 30% sucrose, and subsequently flash frozen. Coronal sections of 40 µm thickness were incubated overnight at 4°C with 1:1,000 dilutions of NeuN (EMD Millipore, Billerica, MA), a neuronal cell marker; Iba-1 (Wako Chemicals, Richmond, VA), a marker of microglia; and GFAP (EMD Millipore) primary antibodies, a marker of activated astrocytes. Washed sections were then incubated for 1 hour with the appropriate secondary fluorescent antibodies. An area of cortex corresponding to the ROI was imaged with a 10× objective on a Zeiss confocal microscope. After initial settings were determined for the best signal-to-noise imaging, all slices were imaged with the same settings at 1,024 × 1,024 pixel resolution. Further analysis included manual selection of a rectangular cortical ROI (average area = 130,000 square pixels) and calculation of the average optical density of staining, using ImageJ software 17. Four animals were used in each group for statistical analysis.
RESULTS
SFDI Analysis of a Brain Following Lesion Induction
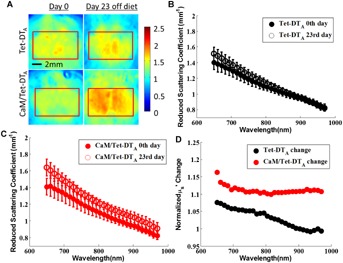
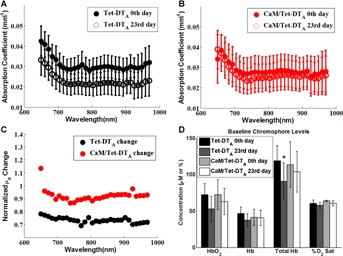
Baseline reduced scattering and absorption coeffcients showed no significant difference between CaM/Tet-DTA mice and Tet-DTA controls (Figs. 2B,C, and 3A,B). Visual inspection of the reduced scattering maps showed a global scattering change in the lesioned mice (Fig. 2A). After 23 days of lesion induction, including both naïve and chronically imaged mice, brain cortical scattering was 11–16% higher in the CaM/Tet-DTA mice as compared to controls (P < 0.005) across the 650–970 nm range (Fig. 2D). Longitudinal imaging, which involved exposing the skull and suturing the scalp together after the first day of imaging, was not associated with any significant difference in reduced scattering coefficient between the first and 23rd day of imaging in Tet-DTA controls. Data in Figure 3A suggests that removal of doxycycline from the diet causes a significant decrease in absorption for all wavelengths from 650–970 nm in the Tet-DTA mice (P < 0.05). This lower absorption was associated with a difference in Total Hb (119 ± 21 µM vs. 91 ± 25 µM) (P < 0.05) in controls. This difference in Total Hb was not observed in CaM/Tet-DTA mice (Fig. 3D).
Fig 2.

A: Representative reduced scattering coefficient maps at 650 nm of Tet-DTA and CaM/Tet-DTA mice, (left) before and (right) after removal of doxycycline from the diet for a 23-day period. ROI's are enclosed within the red line. The reduced scattering coefficient of the CaM/Tet-DTA mice increased, whereas that of the Tet-DTA mice did not significantly change. B: The average µs′ of the ROI did not change in a significant manner with the control Tet-DTA mice. C: In contrast, the average µs′ of the ROI increased over the 650–970 nm wavelength range in the CaM/Tet-DTA mice. Standard deviation bars are shown. D: The average µs′ of the ROI increased 11–16% in the CaM/Tet-DTA mice and up to 8% in the Tet-DTA control mice.
Fig 3.

A: The average µa of the ROI decreased after 23 days off the doxycycline diet in the control Tet-DTA mice. B: In contrast, the average value did not change in a significant fashion in the CaM/Tet-DTA mice. C: The average µa of the ROI decreased up to 13% in the CaM/Tet-DTA mice and 22–31% in the Tet-DTA control mice. D: This change in average µa of the ROI in the control Tet-DTA mice is due to a significant decrease in Total Hb. Standard deviation bars are shown. *P < 0.05.
Histological Analysis
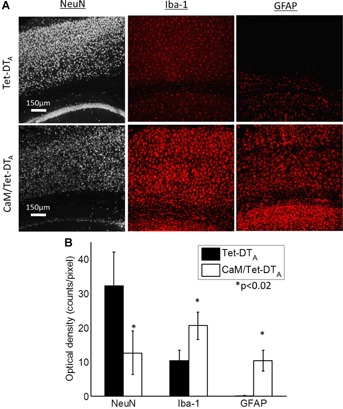
As expected, after 23 days of lesion induction, neuron loss, and infiltration of inflammatory cells were seen in the cortex of CaM/Tet-DTA mice but not in Tet-DTA controls (Fig. 4A). We quantified these structural changes in the cortex by comparing the average optical density of the staining in the cortex (Fig. 4B). Neuronal staining decreased 61%, microglial staining increased 97%, and activated astrocytes increased ∼100-fold in the lesioned animals.
Fig 4.

Cellular pathology mimicking human AD is seen in confocal images of the cortex above the CA1 region of the mouse hippocampus. A: Loss of neuronal staining (NeuN) concurrent with elevated markers for activated microglia (Iba-1) and astrocytes (GFAP) are seen in the lesioned CaM/Tet-DTA mice. B: Average optical density of the cortex above the CA1 region of the mouse hippocampus was calculated for NeuN, Iba1, and GFAP staining in the Tet-DTA and CaM/Tet-DTA mice after 23 days off the doxycycline diet. The induced lesion caused significant decrease in neuron staining and increased density of activated microglia and astrocytes in the cortex.
DISCUSSION
This is the first report, to our knowledge, of the increase in µs′ as a result of neuronal death and increased brain inflammation in vivo. Our previous work showed increased µs′ in the triple transgenic (3×Tg-AD) mouse model of AD 11. However, it was unclear if this increase was due to inflammation of the brain, misfolded protein build-up, or differences in skull thickness. In this study, we have controlled for differences and changes in skull thickness by comparing CaM/Tet-DTA mice and Tet-DTA controls at baseline and after lesion induction. The 11–16% increase in µs′ from 650 to 970 nm that we observed is on par with the scattering increase seen in human AD brain tissue compared to controls in vitro 18.
Interestingly, we observed a significant decrease in absorption due to reduced blood perfusion in the control mice after removing doxycycline from their diet for 23 days. This is a previously unknown phenotype of these mice, but it may be due to the role of doxycycline in vascular tone regulation 19. The reduction in absorption is not seen to the same extent in the CaM/Tet-DTA mice, perhaps because of inflammation-induced vasodilation. These results underscore the importance of separating the effects of scattering from absorption. Unlike planar reflectance imaging, SFDI enables the mathematical separation of scattering from absorption. Without this additional information, the measured decrease in absorption combined with an increase in scattering would confound our interpretation of the underlying physiology.
In conclusion, we have shown that µs′ increases in a model of brain injury that mimics the cellular and structural changes found in late human AD 20. Monitoring µs′ could be useful in evaluation of pre-clinical therapies in animals, as well as for tracking AD progression in humans. The ultimate goal, however, is to detect AD before neuronal loss occurs. AD is intimately associated with microglial activation, which has roles both in clearing amyloid-β and in secreting pro-inflammatory factors 1. In addition, inflammatory genes have been shown to be up-regulated early and chronically throughout the brain in AD 21. Further studies need to be done to determine if light scattering may be uniquely sensitive to the broad cellular changes seen in an inflammatory state before brain atrophy occurs. Previous studies have demonstrated the sensitivity of optical absorption to neurovascular dysfunction in AD 11. As a result, clinical DOS techniques that separate scattering from absorption could be useful as a point-of-care approach for detecting and characterizing AD.
Acknowledgments
Funding for this work was supported in part by an American Society for Laser Medicine and Surgery student grant, the NIH (NIBIB) Laser Microbeam and Medical Program P41EB015890, NIH (NIA) R01A6-21982, NIH (NIA) Ruth Kirschstein NRSA fellowship 5F30AG039949-02, NIH (NINDS) R21NS078634, UC Irvine MSTP, and the Arnold and Mabel Beckman Foundation.
REFERENCES
- 1.Querfurth HW, LaFerla FM. Alzheimer's disease. N Engl J Med. 2010;362(4):329–344. doi: 10.1056/NEJMra0909142. [DOI] [PubMed] [Google Scholar]
- 2.Karran E, Mercken M, De Strooper B. The amyloid cascade hypothesis for Alzheimer's disease: An appraisal for the development of therapeutics. Nat Rev Drug Discov. 2011;10(9):698–712. doi: 10.1038/nrd3505. [DOI] [PubMed] [Google Scholar]
- 3.Scheltens P. Imaging in Alzheimer's disease. Dialogues Clin Neurosci. 2009;11(2):191–199. doi: 10.31887/DCNS.2009.11.2/pscheltens. [DOI] [PMC free article] [PubMed] [Google Scholar]
- 4.Reiman EM. Fluorodeoxyglucose positron emission tomography: Emerging roles in the evaluation of putative Alzheimer's disease-modifying treatments. Neurobiol Aging. 2011;32:S44–S47. doi: 10.1016/j.neurobiolaging.2011.09.007. (Suppl 1): [DOI] [PMC free article] [PubMed] [Google Scholar]
- 5.Klunk WE, Engler H, Nordberg A, Wang Y, Blomqvist G, Holt DP, Bergstrom M, Savitcheva I, Huang GF, Estrada S, Ausen B, Debnath ML, Barletta J, Price JC, Sandell J, Lopresti BJ, Wall A, Koivisto P, Antoni G, Mathis CA, Langstrom B. Imaging brain amyloid in Alzheimer's disease with Pittsburgh Compound-B. Ann Neurol. 2004;55(3):306–319. doi: 10.1002/ana.20009. [DOI] [PubMed] [Google Scholar]
- 6.Vandenberghe R, Van Laere K, Ivanoiu A, Salmon E, Bastin C, Triau E, Hasselbalch S, Law I, Andersen A, Korner A, Minthon L, Garraux G, Nelissen N, Bormans G, Buckley C, Owenius R, Thurfjell L, Farrar G, Brooks DJ. 18F-flutemetamol amyloid imaging in Alzheimer disease and mild cognitive impairment: A phase 2 trial. Ann Neurol. 2010;68(3):319–329. doi: 10.1002/ana.22068. [DOI] [PubMed] [Google Scholar]
- 7.O'Sullivan TD, Cerussi AE, Cuccia DJ, Tromberg BJ. Diffuse optical imaging using spatially and temporally modulated light. J Biomed Opt. 2012;17(7):071311. doi: 10.1117/1.JBO.17.7.071311. [DOI] [PMC free article] [PubMed] [Google Scholar]
- 8.Garcia-Allende PB, Krishnaswamy V, Hoopes PJ, Samkoe KS, Conde OM, Pogue BW. Automated identification of tumor microscopic morphology based on macroscopically measured scatter signatures. J Biomed Opt. 2009;14(3):034034. doi: 10.1117/1.3155512. [DOI] [PMC free article] [PubMed] [Google Scholar]
- 9.Mulvey CS, Sherwood CA, Bigio IJ. Wavelength-dependent backscattering measurements for quantitative real-time monitoring of apoptosis in living cells. J Biomed Opt. 2009;14(6):064013. doi: 10.1117/1.3259363. [DOI] [PMC free article] [PubMed] [Google Scholar]
- 10.Haeussinger FB, Heinzel S, Hahn T, Schecklmann M, Ehlis AC, Fallgatter AJ. Simulation of near-infrared light absorption considering individual head and prefrontal cortex anatomy: implications for optical neuroimaging. PLoS ONE. 2011;6(10):e26377. doi: 10.1371/journal.pone.0026377. [DOI] [PMC free article] [PubMed] [Google Scholar]
- 11.Lin AJ, Koike MA, Green KN, Kim JG, Mazhar A, Rice TB, LaFerla FM, Tromberg BJ. Spatial frequency domain imaging of intrinsic optical property contrast in a mouse model of Alzheimer's disease. Ann Biomed Eng. 2011;39(4):1349–1357. doi: 10.1007/s10439-011-0269-6. [DOI] [PMC free article] [PubMed] [Google Scholar]
- 12.Mastrangelo MA, Bowers WJ. Detailed immunohistochemical characterization of temporal and spatial progression of Alzheimer's disease-related pathologies in male triple-transgenic mice. BMC Neurosci. 2008;9:81. doi: 10.1186/1471-2202-9-81. [DOI] [PMC free article] [PubMed] [Google Scholar]
- 13.Olabarria M, Noristani HN, Verkhratsky A, Rodriguez JJ. Concomitant astroglial atrophy and astrogliosis in a triple transgenic animal model of Alzheimer's disease. Glia. 2010;58(7):831–888. doi: 10.1002/glia.20967. [DOI] [PubMed] [Google Scholar]
- 14.Yamasaki TR, Blurton-Jones M, Morrissette DA, Kitazawa M, Oddo S, LaFerla FM. Neural stem cells improve memory in an inducible mouse model of neuronal loss. J Neurosci. 2007;27(44):11925–11933. doi: 10.1523/JNEUROSCI.1627-07.2007. [DOI] [PMC free article] [PubMed] [Google Scholar]
- 15.Cuccia DJ, Bevilacqua F, Durkin AJ, Tromberg BJ. Modulated imaging: quantitative analysis and tomography of turbid media in the spatial-frequency domain. Opt Lett. 2005;30(11):1354–1356. doi: 10.1364/ol.30.001354. [DOI] [PubMed] [Google Scholar]
- 16.Cuccia DJ, Bevilacqua F, Durkin AJ, Ayers FR, Tromberg BJ. Quantitation and mapping of tissue optical properties using modulated imaging. J Biomed Opt. 2009;14(2):024012. doi: 10.1117/1.3088140. [DOI] [PMC free article] [PubMed] [Google Scholar]
- 17.Rasband WS. Image J. Book ImageJ. Series ImageJ, ed., Editor ed. eds., 1997-2012, pp.
- 18.Hanlon EB, Perelman LT, Vitkin EI, Greco FA, McKee AC, Kowall NW. Scattering differentiates Alzheimer disease in vitro. Opt Lett. 2008;33(6):624–626. doi: 10.1364/ol.33.000624. [DOI] [PubMed] [Google Scholar]
- 19.Zeydanli EN, Kandilci HB, Turan B. Doxycycline ameliorates vascular endothelial and contractile dysfunction in the thoracic aorta of diabetic rats. Cardiovasc Toxicol. 2011;11(2):134–147. doi: 10.1007/s12012-011-9107-1. [DOI] [PubMed] [Google Scholar]
- 20.Drachman DA. Aging of the brain, entropy, and Alzheimer disease. Neurology. 2006;67(8):1340–1352. doi: 10.1212/01.wnl.0000240127.89601.83. [DOI] [PubMed] [Google Scholar]
- 21.Podtelezhnikov AA, Tanis KQ, Nebozhyn M, Ray WJ, Stone DJ, Loboda AP. Molecular insights into the pathogenesis of Alzheimer's disease and its relationship to normal aging. PLoS ONE. 2011;6(12):e29610. doi: 10.1371/journal.pone.0029610. [DOI] [PMC free article] [PubMed] [Google Scholar]


