Abstract
Objective
To determine the strength of common radiographic and radial CT views for measuring true femoral head asphericity.
Patients and Methods
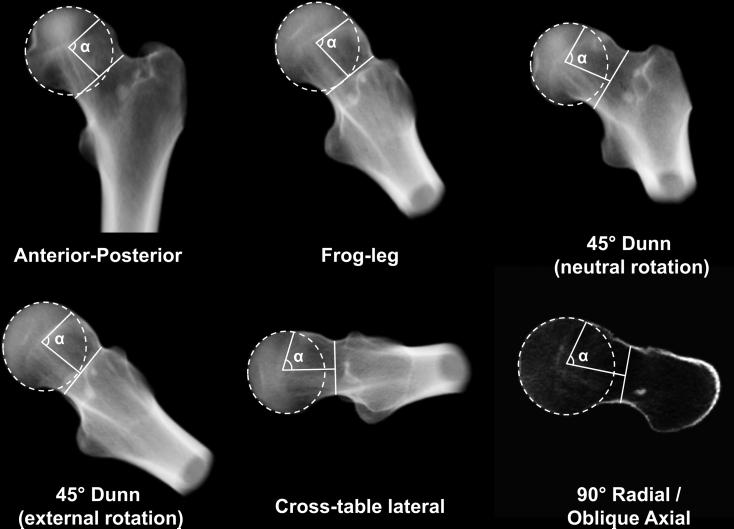
In 15 patients with cam femoroacetabular impingement (FAI) and 15 controls, alpha angles were measured by two observers using radial CT (0°, 30°, 60°, 90°) and digitally reconstructed radiographs (DRRs) for the: anterior-posterior (AP), standing frog-leg lateral, 45° Dunn with neutral rotation, 45° Dunn with 40°external rotation, and cross-table lateral views. A DRR validation study was performed. Alpha angles were compared between groups. Maximum deviation from a sphere of each subject was obtained from a previous study. Alpha angles from each view were correlated with maximum deviation.
Results
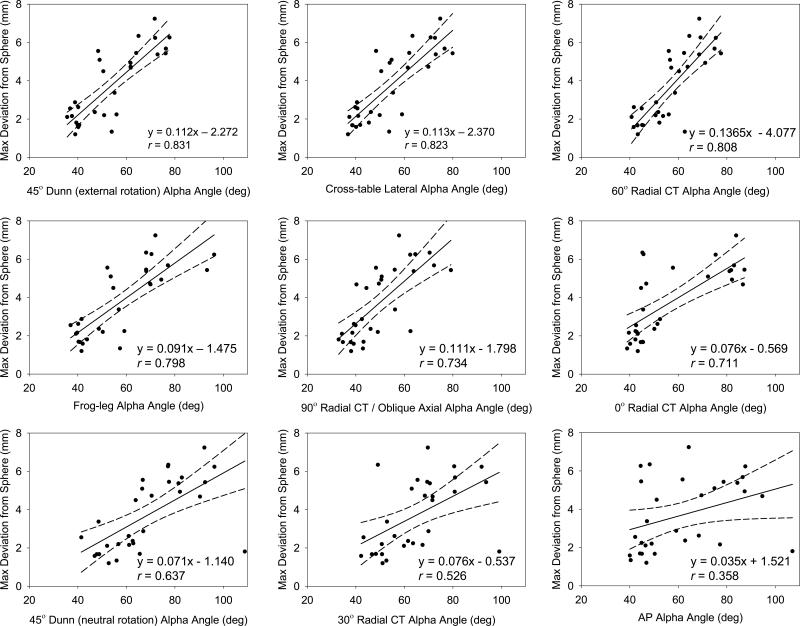
There were no significant differences between alpha angles measured on radiographs and the corresponding DRRs (p = 0.72). Alpha angles were significantly greater in patients for all views (p ≤0.002). Alpha angles from the 45° Dunn with 40° external rotation, cross-table lateral, and 60° radial views had the strongest correlations with maximum deviation (r = 0.831; r = 0.823; r=0.808, respectively). The AP view had the weakest correlation (r = 0.358).
Conclusion
DRRs were a validated means to simulate hip radiographs. The 45° Dunn with 40° external rotation, cross-table lateral, and 60° radial views best visualized femoral asphericity. Although commonly used, the AP view did not visualize cam deformities well. Overall, the magnitude of the alpha angle may not be indicative of the size of the deformity. Thus, 3D reconstructions and measurements of asphericity could improve the diagnosis of cam FAI.
Keywords: Cam Femoroacetabular Impingement, Alpha Angle, Femur Asphericity, Digitally Reconstructed Radiograph, Diagnosis
Introduction
Cam-type femoroacetabular impingement (FAI) has been implicated as a cause of chondrolabral damage, hip osteoarthritis (OA), and musculoskeletal pain in young adults [1-3]. Cam FAI is characterized by an aspherical femoral head and/or insufficient femoral head-neck offset [4,5]. Identifying the degree of femoral head asphericity is important as the underlying goal of surgery to correct cam FAI is to restore a more normal, spherical morphology to the femoral head.
The alpha angle is a two-dimensional (2D) radiographic measure of femoral head asphericity that is commonly used to diagnose cam FAI [6-8]. Although, first proposed by Notzli et al. for only an oblique axial view of the femur, use of the alpha angle has been extended to several radiographic projections and radial computed tomography (CT) or magnetic resonance (MR) views [7,9-14]. Unfortunately, alpha angle measurements can vary between views of the same femur [10,15,16]. Consequently, the ideal view to diagnose cam FAI remains unknown [15,17].
One approach to identify the optimal view in which to measure the alpha angle has been to quantify observer repeatability. However, reports of repeatability have not been consistent and repeatability is not necessarily a measure of effectiveness [18,19]. Another approach has been to correlate alpha angles from standard radiographic views to oblique axial or radial MRI/CT views [12,14,15,17]. Still, alpha angle measurements from radial views are not generated automatically, and thus do not provide a true reference standard. In addition, radial views do not consider the geometry of the entire femoral head. Alternatively, subject-specific 3D reconstructions of femur morphology, generated from volumetric CT or MR images, can be used to visualize the anatomy of the entire femoral head. By fitting the 3D reconstruction to a sphere, one can quantify the size of a deformity as maximum deviation from the sphere, herein referred to as ‘true femoral head asphericity’ [20,21].
Alpha angles from radiographs and radial views will continue to be used in the diagnosis of cam FAI, but the strength of each projection for quantifying true femoral head asphericity has yet to be quantified. The objective of this study was to correlate 3D model-based measurements of maximum deviation from a sphere of the femoral head (obtained in our previous study [21]) to alpha angles measured on five radiographic and four radial CT views. For the five radiographic views, digitally reconstructed radiographs (DRRs) were created from existing CT image stacks, and were used in-lieu of traditional plain films. In doing so, bias in alpha angle measurements from the five radiographic projections caused by inconsistencies in inter-subject positioning was eliminated as was unnecessary radiation exposure beyond that of the original CT scan (a standard of care in our clinic). A validation study was conducted to demonstrate the suitability of DRRs as surrogates for traditional films prior to the principal study (see Appendix).
Patients and Methods
Subject Selection
Images of the pelvis and proximal femur were retrospectively acquired from 15 patients with cam FAI who had received a CT arthrogram as part of a previous study (IRB # 10983, 56086) [21]. All patients had presented with hip and groin pain, had radiographic evidence of cam FAI and tested positive for impingement during clinical examination. Patients received or were scheduled for femoral osteochondroplasty and treatment of chondrolabral injury. Three patients were treated for mixed FAI. A set of 15 control femurs was selected from an available database of cadavers (IRB #56086). Cadaveric femurs available for this study had been disarticulated from the pelvis. All musculoskeletal soft-tissue with the exception of articular cartilage was removed from each specimen. Cartilage was visually screened for degenerative changes consistent with OA. Next, the CT images were inspected for bony deformities and sclerotic changes consistent with OA and/or cam FAI. Of the remaining database, 15 cadaver specimens and associated CT images that best matched the age, weight, height, and body mass index (BMI) of the cam FAI patients were selected; none of the specimens were paired. All human studies were carried out in accordance with those policies and procedures detailed in the Declaration of Helsinki.
CT images of the patients had been acquired using a Siemens SOMATOM 128 Definition CT Scanner (120 kVp tube voltage, 512 x 512 acquisition matrix, 1.0 mm slice thickness, 0.9 to 1.0 pitch, 250 mAs baseline tube current with automated dose modulation using CareDose™, 300-400 mm field of view, estimated dose equivalent (EDE) 0.969 rem) [21]. Each cadaveric control femur had been aligned in neutral [22] and imaged with a GE High Speed CTI Single Slice Helical CT Scanner (100 kVp tube voltage, 512 × 512 acquisition matrix, 1.0 mm slice thickness, 1.0 pitch, 100 mAs tube current, 160 mm field of view).
3D Reconstruction and Sphere Fitting
In our previous study [21], femurs were semi-automatically segmented from the CT image data using Amira (v5.4, Visage Imaging, San Diego, CA) and 3D reconstructions were generated for each subject [23]. To improve resolution of the segmentation mask, and decrease segmentation artifact, CT images had been up-sampled to 1536×1536, 0.3 mm thickness for patients and 1024×1024, 0.5 mm for controls.
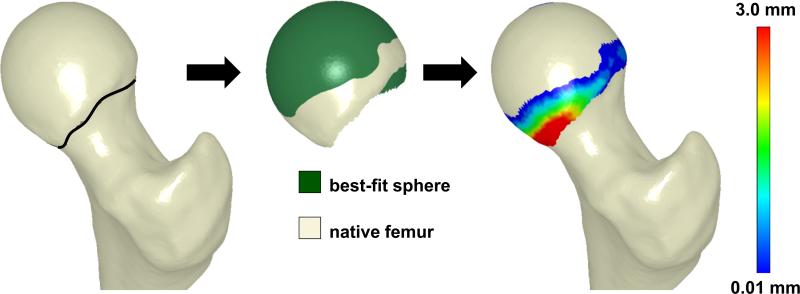
Femoral asphericity was reported in the previous study, according to the following sphere-fitting technique [21]. First, a contour map of principal curvatures was created for the entire femur. Next, a cutting surface was fit to points of inflection (curvature = 0) to define the head-neck boundary. The femoral head was identified as the section of the femur proximal to the cutting surface (Fig. 1). PreView (http://mrl.sci.utah.edu/software/preview) was used to determine the radius and center of the sphere which best fit the isolated head, via linear least-squares-minimization. Next, a spherical surface was generated by projecting nodes from the native femoral head onto the best-fit sphere (Fig. 1). Finally, asphericity was calculated as the maximum deviation (i.e. distance) between nodes on the native head and the best-fit sphere surface (Fig. 1).
Figure 1.
Process of femoral head isolation and sphere fitting. Left - The femoral head was delineated from the neck using inflection points around the circumference of the head-neck junction (black line). Middle - The isolated head (off-white) was then projected onto the best fitting sphere surface (green). Right - Deviations (mm) between the femur and the best-fit sphere were calculated across the isolated surface of the head.
Generation and Alignment of Digitally Reconstructed Radiographs
Digitally reconstructed radiographs (DRR) were used in the present study to simulate five common radiographic views used to diagnosis cam FAI. DRRs are generated from CT data using ray casting to produce an image similar to a clinical radiograph [24]. DRRs were utilized because they could be generated from controlled perspectives with respect to the CT image stack. In doing so, bias in alpha angle measurements caused by inconsistencies in inter-subject positioning was eliminated as was unnecessary radiation exposure that would be required to acquire all five radiographic projections in a standard fashion. Before completing the principal study, which was to correlate alpha angles to 3D measures of asphericity, a separate validation study was completed to demonstrate that alpha angles measured on DRRs were nearly identical to those from traditional radiographs (see Appendix).
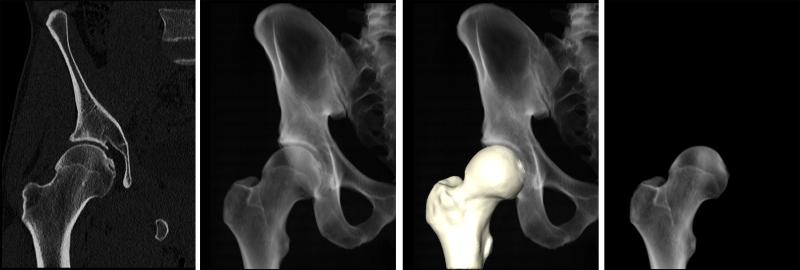
For the principal study, DRRs were generated in Amira to simulate the: standing anterior-posterior (AP), standing frog-leg lateral, Dunn view with 45° flexion and neutral rotation, Dunn view with 45° flexion and 40° external rotation, and the cross-table lateral view. First, a DRR was generated from the complete CT image dataset (Fig. 2 a-b). Then, the segmentation mask used to generate the 3D femur model was combined with the DRR to isolate image data of the femur only (Fig. 2 c-d).
Figure 2.
DRR generation. From volumetric CT data (a), a DRR was made to visualize only the pelvis and femur bones (b). The segmentation mask used to generate a 3D reconstruction of the femur (c) was then used to isolate a DRR of only the femur (d).
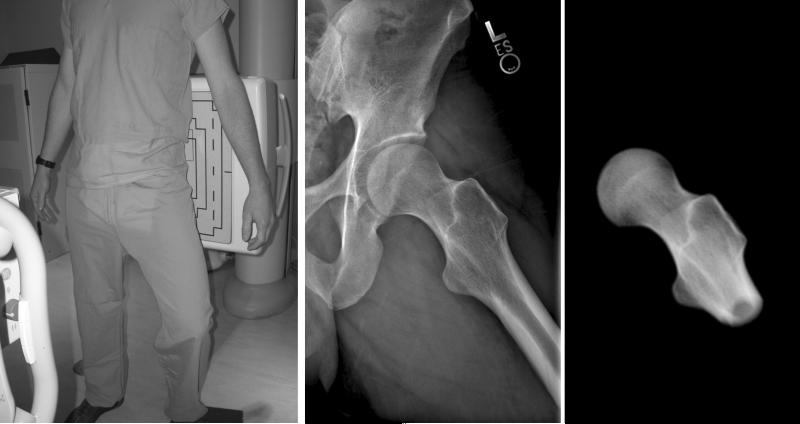
DRR images simulating each of the five projection views were created as follows (example for the standing frog-leg lateral in Fig. 3). First, traditional radiographs from the five projection views were obtained for a single, living control volunteer. This volunteer had CT image data acquired for an unrelated study (IRB # 10983). CT data for this subject were then used to generate a DRR of the femur, which was aligned in neutral orientation [22]. From neutral, the DRR was rotated to match orientations of the traditional radiographs for the five views (see immediately below for information on positioning). The transformation was applied to DRRs of all subjects; this alignment routine was repeated for each projection.
Figure 3.
DRR alignment routine applied to standing frog-leg lateral. (a) A subject was positioned with the left leg on a 10 cm step with the hip flexed ~35° and externally rotated ~60°. (b) Resulting frog-leg lateral radiograph. (c) A simulated frog-leg lateral DRR, created by transforming the neutral DRR to match the example radiograph.
Positioning of the subject was as follows. For AP, the subject was standing with the femur in 15° internal rotation with neutral flexion and abduction. For the standing frog-leg, the femur was flexed approximately 35° and externally rotated approximately 60° with the foot resting on a 10 cm step. In the first Dunn view, the femur was flexed 45°, abducted 20° and maintained in neutral rotation [10]. In the second Dunn view, the femur was flexed 45°, abducted 20°, and then rotated 40° externally. Applying external rotation for the second Dunn view is not a new view, rather it was found to yield radiographs that closely resembled several reported in the literature as 45° Dunn views [6,15]. For the cross-table lateral view, the femur was in neutral flexion with 15° internal rotation and the beam parallel to the table and oriented 45° to the femoral head [25]. The EDE of each radiograph was 0.018 rem or less per film.
Generation and Alignment of Radial CT and Oblique Axial Views
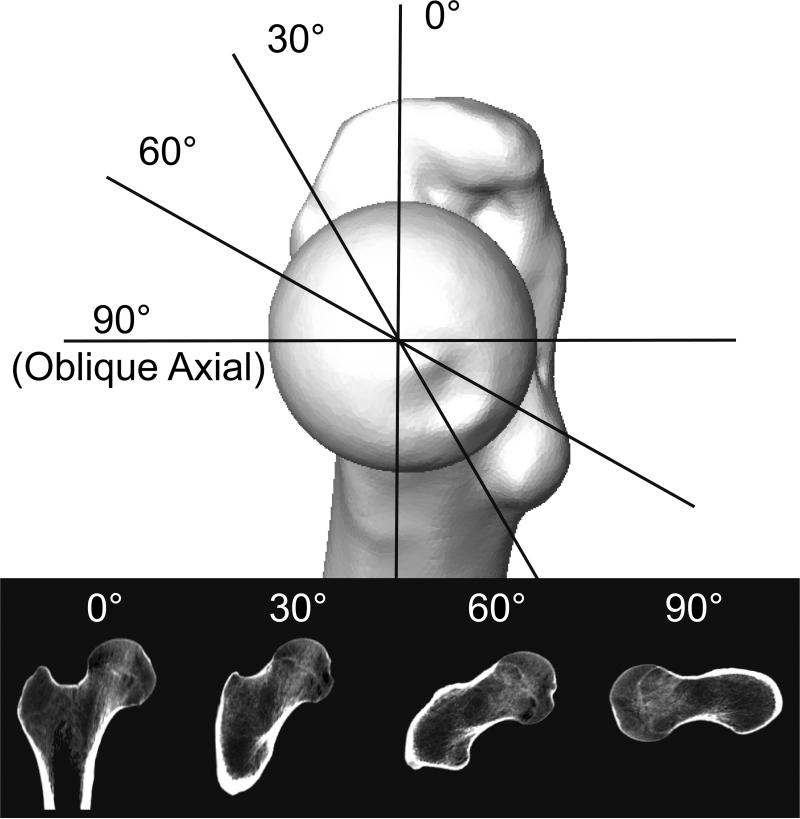
Four radial CT views were generated in the present study, which covered the superior to anterior region of the femoral head. First, a plane was fit to points at: 1) the center of the femoral head (when fit to a sphere), 2) the center of the femoral neck, and 3) the center of the femoral shaft. The slice through the CT data at this plane was designated as 0° radial CT (Fig. 4). Using a line through the center of the femoral head and center of the neck as the axis of rotation, planes were created at 30° increments in an anterior progression (Fig. 4), resulting in 0°, 30°, and 60° radial CT views. A final plane was created at 90° of rotation about the head-to-neck axis, generating the oblique axial view described by Notzli et al [7].
Figure 4.
Planes and resulting radial CT views for one subject. Medial view of the right femur is directly along the axis of rotation between the center of the femoral head and the center of the neck. Four radial CT views were captured from the superior to anterior region of the femoral head.
Measurement of Alpha Angle
The alpha angle was semi-automatically measured on the DRRs and radial CT images using a custom Matlab script (Fig. 5) [7]. First, a circle was fit to the contour of the femoral head. Next, a line traversing the narrowest section of the neck was drawn. The alpha angle was measured as the angle between: 1) the line from the automatically calculated midpoint of the narrowest section of the neck to the center of the circle around the femoral head and 2) the line from the automatically calculated center of the circle to the point where the native femur began to deviate from the circle. Two observers (A and B; imaging scientists with training and experience in radiographic evaluation of FAI) independently measured the alpha angle on all views for all subjects. Observer A repeated all measurements on two separate occasions.
Figure 5.
Representative DRRs and 90° Radial CT / oblique axial view with alpha angle (α) outlines for a single cam FAI patient.
Data and Statistical Analysis
Statistical analysis was performed using SPSS (v16; IBM Corp., Armonk NY). Significance was set at p ≤ 0.05. Maximum deviations between groups had been compared previously using the Student's t-test [21]. In the present study, inter-observer and intra-observer repeatability of alpha angle measurements was quantified using the intraclass correlation coefficient (ICC), with 95% confidence intervals. Inter-observer repeatability was assessed between the first reads of both observers. Agreement was interpreted as: slight if the ICC < 0.20, fair if 0.21–0.40, moderate if 0.41–0.60, substantial if 0.61–0.80, and almost perfect if > 0.80 [26].
For subsequent analysis, alpha angle measurements were averaged to include reads 1 and 2 from Observer A and read 1 from Observer B. Differences in alpha angles between the control and cam FAI subjects in each view were tested for statistical significance using Student's t-test.
Data from patient and control groups were combined and the relationship between the alpha angle and maximum deviation was quantified using linear regression. The strength of the relationship was assessed with Pearson's correlation coefficient (r). For the purpose of interpreting the correlation coefficient, r= 0-0.19 was regarded as very weak, 0.2-0.39 as weak, 0.40-0.59 as moderate, 0.6-0.79 as strong and 0.8-1 as very strong correlation. Post-hoc power analysis was performed on the correlations to assess the appropriateness of the chosen sample size of 30 subjects by determining the correlation coefficient that could be detected with 80% power using a two-sided comparison with alpha = 0.05.
Results
The average and standard deviation age, weight, height and BMI of the patients and (matched controls) was 26 ± 7 (27 ± 8) years, 84 ± 10 (83 ± 10) kg, 181 ± 8 (182 ± 7) cm, and 25.3 ± 3.4 (24.9 ± 3.2) kg/m2, respectively [21]. Alpha angles for the cam FAI patients were significantly larger than those of control subjects in all views (all p ≤ 0.002) (Table 1). Intra-observer ICC values for the alpha angle were almost perfect for all views, with a range of 0.868 to 0.981 (Table 1). Inter-observer values were substantial to almost perfect, ranging from 0.722 to 0.978 (Table 1).
Table 1.
Alpha angles and ICCs with 95% confidence intervals for each view
| View | Control Alpha Angle (°) | Cam FAI Alpha Angle (°) | Intra-observer ICC (95% CI) | Inter-observer ICC (95% CI) |
|---|---|---|---|---|
| AP | 50.2 ± 8.8 | 73.1 ± 19.6 | 0.868 (0.742-0.935) | 0.832 (0.677-0.916) |
| Frog-leg Lateral | 45.7 ± 7.0 | 68.1 ± 15.4 | 0.980 (0.958-0.990) | 0.955 (0.907-0.978) |
| 45° Dunn (neutral rotation) | 56.8 ± 8.2 | 80.3 ± 15.0 | 0.981 (0.961-0.991) | 0.877 (0.759-0.940) |
| 45° Dunn (external rotation) | 43.9 ± 6.6 | 62.8 ± 12.8 | 0.945 (0.889-0.974) | 0.886 (0.774-0.944) |
| Cross-table Lateral | 44.1 ± 7.5 | 63.7 ± 11.7 | 0.975 (0.947-0.988) | 0.978 (0.954-0.989) |
| 0° Radial CT | 45.7 ± 4.9 | 66.5 ± 19.3 | 0.981 (0.960-0.991) | 0.722 (0.493-0.857) |
| 30° Radial CT | 55.5 ± 9.0 | 73.9 ± 14.1 | 0.924 (0.847-0.963) | 0.744 (0.529-0.870) |
| 60° Radial CT | 49.0 ± 6.9 | 64.9 ± 8.1 | 0.929 (0.856-0.965) | 0.809 (0.636-0.904) |
| 90° Radial CT (Oblique Axial) | 42.8 ± 7.0 | 56.3 ± 13.0 | 0.919 (0.837-0.961) | 0.885 (0.773-0.943) |
Note – Alpha angles are means ± standard deviations. ICC is intraclass correlation coefficient. CI is confidence interval.
As previously reported, the asphericity of cam FAI patient femurs, as indicated by maximum deviation from best-fit spheres, was 4.99 ± 0.39 mm and was significantly greater than that of the controls at 2.41 ± 0.31 mm (p < 0.001) [21]. Maximum deviations occurred in the anterolateral region of the femoral head for all patients and 14 of 15 control femurs; one control femur had a maximum deviation located in the posteromedial region [21].
Linear regression indicated that correlations between alpha angles and maximum deviation from a sphere were significant for all views (p< 0.002) except the AP (p = 0.052) (Fig. 6). For those correlations found to be significant, the strength of the correlation ranged from moderate for the 30° Radial CT (r = 0.526) to very strong for the 45° Dunn view with 40° external rotation (r= 0.831). Three of the nine views had very strong correlations: 45° Dunn with 40° external rotation (r=0.831), cross-table lateral view (r=0.823), and the 60° radial CT (0.808). The post hoc power analysis indicated that 80% power was achieved for all correlations with r ≥ 0.47. Therefore, with a total sample size of 30 subjects (15 FAI patients, 15 controls), each of the correlations found to be significant in this study achieved 80% power.
Figure 6.
Linear regressions (solid line), including 95% confidence intervals (dashed lines), of alpha angles compared to maximum deviations from spheres. Best-fit lines and correlation coefficients (r) are provided in each plot. Starting in the upper left panel and moving to the right, plots have been presented in order of decreasing r value strength.
Discussion
The objective of this study was to correlate 3D model-based measurements of true femoral head asphericity (i.e. maximum deviation from a best-fit sphere) to alpha angles measured on five radiographic and four radial CT views. The results of our validation study demonstrated that DRRs could serve as a surrogate for actual radiographs in the measurement of the alpha angle (Appendix). Alpha angles from eight of the nine views analyzed herein were significantly correlated with femoral head asphericity. Of those, very strong correlations (r> 0.8) were found for the 45° Dunn with 40° external rotation, cross-table lateral and 60° radial CT views. We also found that the magnitude of the alpha angle was not necessarily indicative of the size of the deformity.
The strength of the correlations for the 45° Dunn with 40° external rotation, cross-table lateral and 60° radial CT views corroborates previous reports [10,15,27]. These “lateral views” captured maximum deviation well since they image the anterolateral/anterosuperior region, where maximum deviations were most often noted in our study. Because intra and inter-repeatability of alpha angle measurements was very good, we are confident that correlations for lateral views are the result of actual correspondence.
Based on the results of this study, we recommend that the 45° Dunn with 40° external rotation and cross-table lateral views be obtained for assessing cam FAI. The 60° radial CT may provide additional diagnostic value. We advocate against the use of the AP view as the primary means to diagnose cam FAI. However, the AP view may be useful to grade OA and assess pelvic alignment. It is important to note that the location of deformities may vary between patients. Thus, assessments of correlations cannot ensure that use of the lateral views alone will result in an accurate diagnosis of cam FAI. If the lateral views fail to visualize a cam deformity in a hip with symptoms consistent with FAI, we recommend clinicians obtain additional views and/or consider CT/MRI.
Larger alpha angles are thought to be associated with more extensive damage [28,29]. An unexpected finding of this study was that the view from which the highest alpha angles were measured did not have the strongest correlation to maximum deviation. The highest alpha angles were measured in the 45° Dunn view with neutral rotation. However, correlations between alpha angles and maximum deviation for this view were not strong. Our study suggests that a large alpha angle in one view may not be a sure indicator of maximum deviation, and therefore, severity of the deformity. A recent study also reported larger alpha angles from the 45° Dunn view with neutral rotation when compared to other views, which could make it sensitive to detecting deformities. However, this view may also be susceptible to false classification of a patient as having cam FAI when using a 50° alpha angle threshold [14]. Thus, the threshold of the alpha angle to indicate a diagnosis of cam FAI may have to be adjusted between views. Overall, obtaining views that are strongly correlated to maximum deviation is likely a better approach than ordering views that yield a high alpha angle.
Our results indirectly suggest that the manner in which a patient is positioned during a radiograph may influence measurements of the alpha angle and hence, estimates of maximum deviation. For example, the literature most often describes positioning for the 45° Dunn view as 45° flexion, 20° abduction and neutral rotation (Fig. 5) [6]. Maintaining neutral rotation in the 45° Dunn view resulted in a radiographic view that was relatively weak in correlation to maximum deviation. However, allowing approximately 40° of external rotation produced a view of the femur that matched images commonly identified as the regular 45° Dunn view in the literature (e.g. compare [6,15] to [10]) and resulted in the strongest correlation. Hence, we recommend that clinicians and radiology technicians standardize patient positioning since this likely influences the appearance of the femoral head and associated measurements.
In addition to patient position during the radiograph, the manner in which a deformity presents may have important implications on the alpha angle. Anecdotally, we have noted that some femurs with cam FAI become aspheric more proximally, but do not have a sharply rising (i.e. prominent) bump; this would lead to a high alpha angle with relatively low maximum deviation. In contrast, we have observed femurs that become aspheric more distally, but have a prominent bump; this would lead to a lower alpha angle but a higher maximum deviation. Overall, 3D reconstructions and measurements of asphericity could delineate the manner in which a bump presents on a patient-specific basis.
Radial MRI is an increasingly popular tool to diagnose cam FAI [15-17]. However, limiting the analysis of femoral head shape to a single radial view could be misleading. For example, in the current study, alpha angles from the 60° radial images were strongly correlated with maximum deviation, but angles from 30° radial images were weakly correlated. If volumetric imaging is to be used, we recommend the use of multiple radial views. Also, many clinical CT/MR scanners have the ability to automatically generate 3D reconstructions, which could provide improved, albeit qualitative, visualization of cam deformities.
A final consideration, inherent during all radiographic screening is exposure to ionizing radiation. The CT arthrogram images used in the current study had an EDE of 0.969 rem; each of the radiographic views evaluated in this study had an EDE of 0.018 rem or less. We recognize that CT may provide valuable diagnostic information. However, by using the radiographic views we found to have very strong correlations, it may possible to avoid a CT scan for the purpose of estimating femoral head asphericity. Also, radial MRI could be used as an alternative to CT for assessment of femoral head deformities in cam FAI patients. Using similar techniques described in this paper, it should be possible to correlate alpha angles from radiographs to femoral head asphericity from MRI-based 3D reconstructions of the femur.
A few limitations to the present study warrant discussion. First, for correlation with alpha angles, a single feature, maximum deviation, was chosen. Maximum deviation may not fully describe a cam deformity, including its area and characteristic shape. Nevertheless, maximum deviation provided an objective indication of the location and severity of a cam lesion and was straightforward to interpret. There may be additional variables that can be extracted in future studies, such as volume of the bump.
A possible limitation to this study is that it was performed retrospectively. However, we do not believe a prospective approach to acquire all five radiographic projections using standard x-ray would add intrinsic value to this particular research as alpha angle measurements could have been biased from the variability in patient positioning. By using DRRs, we avoided errors due to positional variability. Further, the validation study demonstrated that alpha angles measured on DRRs were nearly identical to those measured on traditional radiographs. Nevertheless, correlations presented herein should be considered the best-case results given the controlled manner in which the DRRs were generated.
Another limitation was that detailed histories were not available for the cadaveric control group. Prior to matching to the cam FAI patients, cadaver femora and the CT images of the cadavers were both screened visually to exclude advanced OA and bony deformities consistent with cam FAI. Though this screening procedure cannot rule out the possibility that the control subjects had radiographic FAI (from any single perspective), the purpose of this study was to relate alpha angles to objectively measured 3D asphericity when including data from both groups in a single correlation plot. Thus, the design of the study makes it rather insensitive to having the two groups be completely distinct. Regardless, alpha angles for the control subjects fell within ranges reported for asymptomatic, normal subjects, and were significantly less than cam FAI patients for all views [30,31]; demographics were also nearly identical between groups. Finally, our study did not focus upon establishment of normal and abnormal alpha angle values, only correlation between alpha angle and maximum deviation from a sphere. Additional subjects could be included in the future for the purpose of defining normal/abnormal.
Clinical Conclusions
This study correlated clinical indicators of femoral asphericity (i.e. alpha angles) from radiographs to objective measures of asphericity from 3D reconstructions of femoral geometry. Correlations were strongest in the 45° Dunn view with external rotation and cross-table lateral, which suggests that these views best visualize cam deformities. Provided analyses of femoral shape are not limited to only one or two views, radial MRI or CT may also be useful for diagnosis of cam FAI. Our data suggest that the AP view should not be used as the primary means to diagnose cam FAI. One interesting finding was that the alpha angle was not a sure indicator of deformity size. Thus, obtaining views that are strongly correlated to maximum deviation is likely a better approach than ordering views that yield a high alpha angle. An even better alternative may be to analyze femoral head asphericity directly from 3D reconstructions. Finally, our data indirectly suggest that patient positioning can strongly affect the radiographic appearance of the femur. Thus, surgeons, radiologists, and technicians should establish and standardize patient screening protocols. If CT data are available, DRRs may be a valuable tool to create radiographs from user-defined perspectives in a controlled fashion.
Acknowledgements
Funding from NIH grant R01-AR053344 and the U.S. Department of the Army grant W81XWH-06-1-0574 are gratefully acknowledged. Dr. Peters was a co-investigator of the NIH grant. Dr. Anderson was a co-investigator of the Department of the Army Grant. We acknowledge Dr. Jeff Weiss (Principal Investigator of R01-AR053344) and Dr. Kent Bachus (Principal Investigator of W8XWH-06-1-0574) for providing funding for imaging of human subjects and cadavers.
Appendix
DRR Validation: Methods
A separate study was conducted to demonstrate the validity of using DRRs as a surrogate for clinical radiographs. First, seven 2 mm diameter steel beads were implanted into the femur of a cadaveric pelvis to toe-tips specimen. The specimen was radiographed using the following seven projection views: the five views described above (except that the AP image was taken in a supine position, but with femur rotation as described above), an additional iteration of the 45° Dunn view (at approximately 25 to 30° external rotation), and a frog-leg lateral in a supine position (the heel of the foot was brought to contact the contralateral medial condyle of the knee). CT images of the cadaver were then collected and segmented into 3D reconstructions using Amira. A copy of the CT image set was created with the metallic beads intentionally obscured by converting pixels representing metal to those of the surrounding bone.
Using the images in which beads had been obscured and 3D reconstructions of the femur, DRRs were generated and oriented to match each of the seven projection views captured with traditional x-ray. Thus, orientation of the DRRs to match traditional radiographs was blinded to bead location and, instead, relied only upon bony landmarks and prescribed rotations. The transformation applied to orient the bead-obscured CT images was then copied and applied to the original CT images for which the beads were visible. The result was a radiograph from each view and corresponding DRR with and without beads (Appendix Fig. 1).
For the DRR validation study, the difference in orientation between the DRRs and corresponding traditional radiographs was quantified by measuring the distance between beads visible in both the DRR and radiograph. For each view, 10 inter-bead distances were measured on the traditional radiographs as the reference standard. Distances were then measured between the same beads on the DRR. Distances measured on the traditional radiographs and DRRs were tested for significant differences using paired Student's t-tests and agreement with Bland-Altman plots [32].
The appropriateness of using DRRs was further ascertained by measuring alpha angles on pairs of radiographs and DRRs. This included seven pairs from the cadaver, five pairs from the template volunteer, and 15 pairs from clinically acquired AP radiographs of FAI patients included in this study and the corresponding AP DRRs. Thus, a total of 27 pairs were available for statistical comparison. Differences and agreement between x-ray and DRR alpha angles were tested using a paired Student's t-test and Bland-Altman plots, respectively. Finally, correspondence between alpha angles on the DRR versus those on the traditional radiograph was assessed by correlation and linear regression.
DRR Validation: Results
For the validation study, no significant differences were found between inter-bead distances measured on cadaver radiographs compared to DRRs for any view (p ≥ 0.064). The average ± standard deviation difference of all measured inter-bead distances between the radiographs and DRRs was -0.22 ± 0.77 mm with a 95% confidence interval (CI) of -0.04 to - 0.40 mm and limits of agreement -1.76 mm and 1.33 mm. There were no significant differences between alpha angles measured on radiographs and their corresponding DRRs (p = 0.72). The average ± standard deviation of alpha angle differences between radiographs and DRRs was 0.2° ± 2.9° with a 95% CI of -0.9° to 1.3°; limits of agreement were -5.6° and 6.0°. The correlation coefficient of alpha angles between the radiograph and DRR images was r = 0.99. The relationship between alpha angles on radiographs compared to DRRs was almost perfectly linear (y = 0.98x + 1.19) with excellent agreement (R2 = 0.98). Bland-Altman plots also indicated strong agreement between alpha angles measured on DRRs compared to traditional radiographs (Appendix Fig. 2).
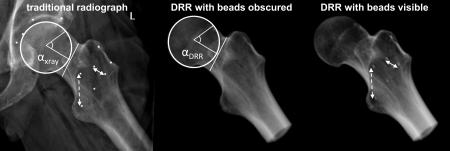
Appendix Figure 1. DRR validation. Beads were obscured in the CT data and a DRR image was created to match the representative traditional radiograph. Beads were then revealed and a second DRR was created using the transformation matrix used to orient the first DRR. Inter-bead distances and alpha angles between the DRRs and traditional radiograph were statistically compared. Dashed arrows indicate representative bead distances.
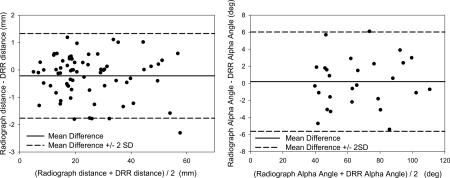
Appendix Figure 2. Bland-Altman plot of agreement between traditional radiograph and DRR measurements (left: inter-bead distances, right: alpha angles). Solid line represents the mean difference. Dashed lines represent limits of agreement calculated as mean ± 2*standard deviation.
Footnotes
Publisher's Disclaimer: This is a PDF file of an unedited manuscript that has been accepted for publication. As a service to our customers we are providing this early version of the manuscript. The manuscript will undergo copyediting, typesetting, and review of the resulting proof before it is published in its final citable form. Please note that during the production process errors may be discovered which could affect the content, and all legal disclaimers that apply to the journal pertain.
Conflict of Interest Statement The authors have no potential conflict, financial or otherwise, with the research reported herein.
Contributor Information
Michael D. Harris, Department of Orthopaedics Department of Bioengineering University of Utah 590 Wakara Way A-100, Salt Lake City, UT 84108, USA 1-801-587-5200 michael.harris@utah.edu.
Ashley L. Kapron, Department of Orthopaedics Department of Bioengineering University of Utah 590 Wakara Way A-100, Salt Lake City, UT 84108, USA 1-801-587-5200 ashley.kapron@utah.edu.
Christopher L. Peters, Department of Orthopaedics University of Utah School of Medicine 590 Wakara Way A-100, Salt Lake City, UT 84108, USA 1-801-587-5200 chris.peters@hsc.utah.edu.
Andrew E. Anderson, Department of Orthopaedics Department of Bioengineering Department of Physical Therapy Scientific Computing and Imaging Institute University of Utah 590 Wakara Way A-100, Salt Lake City, UT 84108, USA.
References
- 1.Barros HJ, Camanho GL, Bernabe AC, Rodrigues MB, Leme LE. Femoral head-neck junction deformity is related to osteoarthritis of the hip. Clin Orthop Relat Res. 2010;468(7):1920–5. doi: 10.1007/s11999-010-1328-2. [DOI] [PMC free article] [PubMed] [Google Scholar]
- 2.Beck M, Kalhor M, Leunig M, Ganz R. Hip morphology influences the pattern of damage to the acetabular cartilage: femoroacetabular impingement as a cause of early osteoarthritis of the hip. J Bone Joint Surg Br. 2005;87(7):1012–8. doi: 10.1302/0301-620X.87B7.15203. [DOI] [PubMed] [Google Scholar]
- 3.Wagner S, Hofstetter W, Chiquet M, et al. Early osteoarthritic changes of human femoral head cartilage subsequent to femoro-acetabular impingement. Osteoarthritis Cartilage. 2003;11(7):508–18. doi: 10.1016/s1063-4584(03)00075-x. [DOI] [PubMed] [Google Scholar]
- 4.Ito K, Minka MA, 2nd, Leunig M, Werlen S, Ganz R. Femoroacetabular impingement and the cam-effect. A MRI-based quantitative anatomical study of the femoral head-neck offset. J Bone Joint Surg Br. 2001;83(2):171–6. doi: 10.1302/0301-620x.83b2.11092. [DOI] [PubMed] [Google Scholar]
- 5.Siebenrock KA, Wahab KH, Werlen S, Kalhor M, Leunig M, Ganz R. Abnormal extension of the femoral head epiphysis as a cause of cam impingement. Clin Orthop Relat Res. 2004;(418):54–60. doi: 10.1097/00003086-200401000-00010. [DOI] [PubMed] [Google Scholar]
- 6.Clohisy JC, Carlisle JC, Beaule PE, et al. A systematic approach to the plain radiographic evaluation of the young adult hip. J Bone Joint Surg Am. 2008;90(Suppl 4):47–66. doi: 10.2106/JBJS.H.00756. [DOI] [PMC free article] [PubMed] [Google Scholar]
- 7.Notzli HP, Wyss TF, Stoecklin CH, Schmid MR, Treiber K, Hodler J. The contour of the femoral head-neck junction as a predictor for the risk of anterior impingement. J Bone Joint Surg Br. 2002;84(4):556–60. doi: 10.1302/0301-620x.84b4.12014. [DOI] [PubMed] [Google Scholar]
- 8.Tannast M, Siebenrock KA, Anderson SE. Femoroacetabular impingement: radiographic diagnosis--what the radiologist should know. Am J Roentgenol. 2007;188(6):1540–52. doi: 10.2214/AJR.06.0921. [DOI] [PubMed] [Google Scholar]
- 9.Clohisy JC, Nunley RM, Otto RJ, Schoenecker PL. The frog-leg lateral radiograph accurately visualized hip cam impingement abnormalities. Clin Orthop Relat Res. 2007;462:115–21. doi: 10.1097/BLO.0b013e3180f60b53. [DOI] [PubMed] [Google Scholar]
- 10.Meyer DC, Beck M, Ellis T, Ganz R, Leunig M. Comparison of six radiographic projections to assess femoral head/neck asphericity. Clin Orthop Relat Res. 2006;445:181–5. doi: 10.1097/01.blo.0000201168.72388.24. [DOI] [PubMed] [Google Scholar]
- 11.Beaule PE, Zaragoza E, Motamedi K, Copelan N, Dorey FJ. Three-dimensional computed tomography of the hip in the assessment of femoroacetabular impingement. J Orthop Res. 2005;23(6):1286–92. doi: 10.1016/j.orthres.2005.03.011.1100230608. [DOI] [PubMed] [Google Scholar]
- 12.Dudda M, Albers C, Mamisch TC, Werlen S, Beck M. Do normal radiographs exclude asphericity of the femoral head-neck junction? Clin Orthop Relat Res. 2009;467(3):651–9. doi: 10.1007/s11999-008-0617-5. [DOI] [PMC free article] [PubMed] [Google Scholar]
- 13.Sutter R, Dietrich TJ, Zingg PO, Pfirrmann CW. How useful is the alpha angle for discriminating between symptomatic patients with cam-type femoroacetabular impingement and asymptomatic volunteers? Radiology. 2012;264(2):514–21. doi: 10.1148/radiol.12112479. [DOI] [PubMed] [Google Scholar]
- 14.Nepple JJ, Martel JM, Kim YJ, Zaltz I, Clohisy JC. Do plain radiographs correlate with CT for imaging of cam-type femoroacetabular impingement? Clin Orthop Relat Res. 2012;470(12):3313–20. doi: 10.1007/s11999-012-2510-5. [DOI] [PMC free article] [PubMed] [Google Scholar]
- 15.Domayer SE, Ziebarth K, Chan J, Bixby S, Mamisch TC, Kim YJ. Femoroacetabular cam- type impingement: diagnostic sensitivity and specificity of radiographic views compared to radial MRI. Eur J Radiol. 2011;80(3):805–10. doi: 10.1016/j.ejrad.2010.10.016. [DOI] [PubMed] [Google Scholar]
- 16.Pfirrmann CW, Mengiardi B, Dora C, Kalberer F, Zanetti M, Hodler J. Cam and pincer femoroacetabular impingement: characteristic MR arthrographic findings in 50 patients. Radiology. 2006;240(3):778–85. doi: 10.1148/radiol.2403050767. [DOI] [PubMed] [Google Scholar]
- 17.Rakhra KS, Sheikh AM, Allen D, Beaule PE. Comparison of MRI alpha angle measurement planes in femoroacetabular impingement. Clin Orthop Relat Res. 2009;467(3):660–5. doi: 10.1007/s11999-008-0627-3. [DOI] [PMC free article] [PubMed] [Google Scholar]
- 18.Carlisle JC, Zebala LP, Shia DS, et al. Reliability of various observers in determining common radiographic parameters of adult hip structural anatomy. Iowa Orthop J. 2011;31:52–8. [PMC free article] [PubMed] [Google Scholar]
- 19.Konan S, Rayan F, Haddad FS. Is the frog lateral plain radiograph a reliable predictor of the alpha angle in femoroacetabular impingement? J Bone Joint Surg Br. 2010;92(1):47–50. doi: 10.1302/0301-620X.92B1.22359. [DOI] [PubMed] [Google Scholar]
- 20.Anderson AE, Ellis BJ, Maas SA, Weiss JA. Effects of idealized joint geometry on finite element predictions of cartilage contact stresses in the hip. J Biomech. 2010;43(7):1351–7. doi: 10.1016/j.jbiomech.2010.01.010. [DOI] [PMC free article] [PubMed] [Google Scholar]
- 21.Harris MD, Reese SP, Peters CL, Weiss JA, Anderson AE. Three-dimensional quantification of femoral head shape in controls and patients with cam-type femoroacetabular impingement. Ann Biomed Eng. 2013;41(6):1162–71. doi: 10.1007/s10439-013-0762-1. [DOI] [PMC free article] [PubMed] [Google Scholar]
- 22.Ruff CB, Hayes WC. Cross-sectional geometry of Pecos Pueblo femora and tibiae--a biomechanical investigation: I. Method and general patterns of variation. Am J Phys Anthropol. 1983;60(3):359–81. doi: 10.1002/ajpa.1330600308. [DOI] [PubMed] [Google Scholar]
- 23.Anderson AE, Peters CL, Tuttle BD, Weiss JA. Subject-specific finite element model of the pelvis: development, validation and sensitivity studies. J Biomech Eng. 2005;127(3):364–73. doi: 10.1115/1.1894148. [DOI] [PubMed] [Google Scholar]
- 24.Metz CT. Masters thesis(INF/SCR-04-72) Utrecht University; 2005. Digitally Reconstructed Radiographs. http://bigr.nl/files/publications/321_DRR.pdf. [Google Scholar]
- 25.Eijer H, Leunig M, Mahomed N, Ganz R. Cross table lateral radiographs for screening of anterior femoral head-neck offset in patients with femoro-acetabular impingement. Hip Int. 2001;11:37–41. [Google Scholar]
- 26.Landis JR, Koch GG. The measurement of observer agreement for categorical data. Biometrics. 1977;33(1):159–74. [PubMed] [Google Scholar]
- 27.Barton C, Salineros MJ, Rakhra KS, Beaule PE. Validity of the alpha angle measurement on plain radiographs in the evaluation of cam-type femoroacetabular impingement. Clin Orthop Relat Res. 2011;469(2):464–9. doi: 10.1007/s11999-010-1624-x. [DOI] [PMC free article] [PubMed] [Google Scholar]
- 28.Johnston TL, Schenker ML, Briggs KK, Philippon MJ. Relationship between offset angle alpha and hip chondral injury in femoroacetabular impingement. Arthroscopy. 2008;24(6):669–75. doi: 10.1016/j.arthro.2008.01.010. [DOI] [PubMed] [Google Scholar]
- 29.Beaule PE, Hynes K, Parker G, Kemp KA. Can the alpha angle assessment of cam impingement predict acetabular cartilage delamination? Clin Orthop Relat Res. 2012;470(12):3361–7. doi: 10.1007/s11999-012-2601-3. [DOI] [PMC free article] [PubMed] [Google Scholar]
- 30.Jung KA, Restrepo C, Hellman M, AbdelSalam H, Morrison W, Parvizi J. The prevalence of cam-type femoroacetabular deformity in asymptomatic adults. J Bone Joint Surg Br. 2011;93(10):1303–7. doi: 10.1302/0301-620X.93B10.26433. [DOI] [PubMed] [Google Scholar]
- 31.Kang AC, Gooding AJ, Coates MH, Goh TD, Armour P, Rietveld J. Computed tomography assessment of hip joints in asymptomatic individuals in relation to femoroacetabular impingement. Am J Sports Med. 2010;38(6):1160–5. doi: 10.1177/0363546509358320. [DOI] [PubMed] [Google Scholar]
- 32.Bland JM, Altman DG. Statistical methods for assessing agreement between two methods of clinical measurement. Lancet. 1986;1(8476):307–10. [PubMed] [Google Scholar]


