Abstract
In this paper, we consider the two dimensional flow of blood in a rectangular microfluidic channel. We use Mixture Theory to treat this problem as a two-component system: One component is the red blood cells (RBCs) modeled as a generalized Reiner–Rivlin type fluid, which considers the effects of volume fraction (hematocrit) and influence of shear rate upon viscosity. The other component, plasma, is assumed to behave as a linear viscous fluid. A CFD solver based on OpenFOAM® was developed and employed to simulate a specific problem, namely blood flow in a two dimensional micro-channel, is studied. Finally to better understand this two-component flow system and the effects of the different parameters, the equations are made dimensionless and a parametric study is performed.
Keywords: Blood flow, Mixture theory, Two phase flow, Rheology, Channel flow, Non-linear fluids
1. Introduction
Blood is a unique multi-component fluid whose composition is responsible for important rheological properties that are responsible for its vital physiological functions. Its primary constituents are flexible, discoid red blood cells (RBCs) (approximately 45% volume fraction) suspended within essentially Newtonian plasma (Robertson, Sequeira, & Kameneva, 2008). In the context of blood-wetted medical devices, the trafficking of RBCs within the plasma greatly contributes to both safety and efficacy. For example in oxygenators and artificial lungs, it is desirable for RBCs which are responsible for transport of oxygen and carbon dioxide, to efficiently interact with the artificial fibers that deliver and remove these gasses. In virtually all blood-wetted devices, it is usually undesirable for the blood to coagulate on the artificial surfaces. This phenomenon, known as thrombosis, is mediated by the platelets, a dilute constituent of blood which is in turn influenced by collisions with the RBCs. Therefore at the microscopic level, the distribution of RBCs is responsible for the distribution of platelets (Aarts, Steendijk, Sixma, & Heethaar (1986)). Accordingly the design of improved cardiovascular devices requires an accurate model of these phenomena. Conversely, the inadequacies of current models stifle our ability to design these devices with any confidence (Thompson, Loebe, & Noon, 2003). As a result, contemporary designs are based primarily on empiricism, and experimental trial-and-error.
It is known that in large vessels (whole) blood behaves as a Navier–Stokes (Newtonian) fluid (Fåhraeus, 1929; Fåhræus & Lindqvist, 1931; Fung, 1993, Chapter 3); however, in a vessel whose characteristic dimension is in the range of tens to hundreds of blood cells (e.g., for a diameter in the range of 20–500 microns) blood behaves as a non-Newtonian fluid, exhibiting shear-thinning, stress relaxation (Bagchi, 2007) and phase separation (Goldsmith, 1971). In larger vessels blood also exhibits shear thinning, particularly for shear rates below 100 s−1. These non-Newtonian properties of blood are mainly attributed to the behavior of the RBCs: the aggregation and disaggregation of the RBCs as a function of shear rate; the deformability of the RBCs; and the alignment of the RBCs in response to extensional flow. Because of the fibrinogen and large globulins, RBCs aggregate and form rod-shaped stacks called rouleaux at low shear rate [see Popel and Johnson (2005) and Bäumler, Neu, Donath, and Kiesewetter (1999)]. This aggregation of the RBCs, which increases the blood viscosity is however reversed when the shear rate increases, causing their disaggregation. The volume fraction of RBCs (known as hematocrit) strongly influences all of the aforementioned phenomena. Increased packing of RBCs affects their collision frequency, and hence their ability to aggregate and to migrate within the flow field. Accordingly, the viscosity of the blood increases dramatically as the hematocrit increases (Chien, Usami, Taylor, Lundberg, & Gregersen, 1966, 1971; Pries, Neuhaus, & Gaehtgens, 1992). Likewise, the property of shear-thinning viscosity becomes weaker and eventually disappears as the hematocrit decreases (Brooks, Goodwin, & Seaman, 1970). The deformability of RBCs is also an important property which affects viscosity and cell trafficking. In capillaries, with sizes equivalent or smaller than that of RBCs, the deformability of RBCs allow them to fold and flex as they transport gasses through the vessel walls. In larger vessels or passages, the deformability of the RBCs allow them to become more streamlined, and aligned at high shear rates – thereby contributing to shear thinning (Chien, 1970). It should be acknowledged that, although the RBCs dominates the rheological properties of blood, other factors such as the plasma viscosity, white blood cells, etc. also play a role (Kameneva, Garrett, Watach, & Borovetz, 1998; Middleman, 1972; Rourke & Ernstene, 1930).
In the past several decades, investigations of blood flow in micro-scale channels have revealed several important phenomena due to the complex rheological properties of blood. In vessel of diameter ranging from approximately 0.05 to 1.5 mm, blood exhibits a thin layer adjacent to the wall that is depleted of RBCs (Marhefka et al., 2009). This phenomenon is known as the Fahraeus–Lindqvist effect (Fung, 1993). This depletion of RBCs near the wall causes the hematocrit of branch vessels to be depleted – a phenomenon known as plasma-skimming (Carr & Wickham, 1990; Krogh, 1921; Marhefka et al., 2009; Skalak, Ozkaya, & Skalak, 1989). Several early experiments related to blood cell margination were performed in tubes, such as Goldsmith’s seminal experiment in which he flash froze the flow to observe the concentration of cells to the center-line (Goldsmith, 1968), a great number of modern experiments are performed in microchannels of rectangular cross section. The reason for this is twofold: microchannels can be much more easily formed using photolithography, and secondly, parallel walls are much more amenable to microscopic measurements. The technology for visualizing flow in non-parallel (e.g. circular) cross sections is still in its infancy, and include micro PIV (Sugii & Okuda, 2005) and confocal PIV methods (Lima & Wada, 2006; Patrick, Chen, Frakes, Dur, & Pekkan, 2011). Furthermore, micro-channels have also been used in a variety of devices such as film oxygenators and recently, dialysis-like cell separators such as the one being developed by our group for treatment of malaria-infected blood. [see Kim, Massoudi, Antaki, and Gandini (2012)]. In summary, it is evident that blood flow at micro-scale exhibits more complex behavior and acts as a multi-component material, which cannot be described by a single phase model.
Motivated by the observation of these phenomena, various multiphase models for blood have been developed. The Immersed Boundary Method (IBM) combined with the Lattice Boltzman Method (LBM) has become a popular method for modeling deformation, cluster formation and collisions of RBCs [see Dupin, Halliday, Care, Alboul, and Munn (2007), Clausen, Reasor, and Aidun (2010) and Zhang, Johnson, and Popel (2009)]. An alternative method consists of the so-called two-fluid or Eulerian–Eulerian two phase model (Jung, Hassanein, & Lyczkowski, 2006). In tandem, over the past four decades, multiconstituent models have been developed for a variety of non-biologic fluids. Two methods in particular are based on first principles of continuum mechanics: the Mixture Theory (or the theory of interacting continua) [see Rajagopal and Tao (1995)] and the Averaging Method [see Ishii (1975)]. In this paper the Mixture Theory is applied as a basis for deriving a two-phase model for blood (Massoudi, Kim, & Antaki, 2012).
The Mixture Theory was first presented by Truesdell in 1957 (Truesdell, 1957) as a means of generalizing the equations and principles of the mechanics of a single continuum to include any number of superimposed continua. In a sense, it is a homogenization process in which each component is regarded as a single continuumand at each instant of time, every point in space is considered to be occupied by a particle belonging to each component of the mixture (Truesdell, 1984). In recent years it has been applied to a variety of applications such as fluid–solid particles, lubrication with binary-mixtures of bubbly oil, viscoelastic porous mixtures, swelling porous media with microstructure, reacting immiscible mixtures, polymeric solutions, growth and remodeling of soft tissues, ionized fluid mixtures, etc., (Massoudi, 2008). For review articles on this subject, see the papers by Atkin and Craine (1976a, 1976b) and Bowen (1976). Mixture Theory has also been used in a variety of biomechanics applications [see for example, Ateshian, Likhitpanichkul, and Hung (2006), Garikipati, Arruda, Grosh, Narayanan, and Calve (2004), Humphrey and Rajagopal (2002), Klisch and Lotz (2000), Lemon, King, Byrne, Jensen, and Shakesheff (2006) and Tao, Humphrey, and Rajagopal (2001)]. Because of its many desirable properties, Mixture Theory has been adopted for this study.
The paper is organized as follows. The kinematical variables and governing equations are introduced in Section 2 while the related constitutive equations are presented in Section 3. In Section 4, the effect of the various dimensionless parameters of our model is studied.
2. Governing equations
Let X1 and X2 denote the position of the bodies in the reference configuration (i.e., prior to mixing) belonging respectively to the plasma, treated as a fluid constituent, and the RBCs, treated as a solid. The motion of the two components can be represented as [see Johnson, Massoudi, and Rajagopal (1991)]
| (1) |
while the kinematical quantities associated with these motions take the expressions
| (2) |
| (3) |
where v is the velocity field, D is the symmetric part of velocity gradient, and and denote differentiation with respect to time holding X1 and X2 fixed, respectively. The bulk density field, ρ1 and ρ2, for these two components are
| (4) |
where ρ10 and ρ20 are the pure density of plasma, and the RBCs, in the reference configuration; ϕ is the volume fraction of RBCs, the hematocrit, where 0 ≤ ϕ < ϕmax < 1. The function ϕ is represented as a continuous function of position and time, which takes a value between one and zero at any position and at anytime, with the extreme values of 1 and 0 depending upon whether one is pointing to a particle (RBCs) or to the liquid (plasma) at that position. That is, the real volume distribution content has been averaged, in some sense, over the neighborhood of any given position. It should be mentioned that in practice ϕ is never equal to one; its maximum value, generally designated as the maximum packing fraction, depends on the shape, size, method of packing, etc.
In the absence of thermo-chemical and electromagnetic effects, the governing equations consist of the conservation of mass, linear momentum and angular momentum. The equations of conservation of mass in the Eulerian form are [see Atkin and Craine (1976a, 1976b)],
| (5a) |
| (5b) |
where is the derivative with respect to time and div is the divergence operator, while the equations of balance of the linear momentum are given by,
| (6a) |
| (6b) |
where in general for any scalar β, , α = 1, 2, and (for any vector w), , T1 and T2 stand for the Cauchy stress tensors, fI represents the interaction forces (exchange of momentum) between the components, and b1 and b2 refer to the body force. T1, T2 and fI will be given by the constitutive equations. The balance of the angular momentum implies that, in the absence of couple stresses, the total Cauchy stress tensor is symmetric. Once the individual (partial) stress tensors are derived (or proposed), a mixture stress tensor can be defined for blood as Tm = T1 + T2 (Green & Naghdi, 1967, 1968) where T1 = (1 − ϕ) T10 and T2 = ϕT20 so that the mixture stress tensor reduces to that of the plasma as ϕ → 0 and to that of the RBCs as ε → 0 [where ε = (1 − ϕ)]. T2 may also be written as , where may be thought of as representing the stress tensor in the reference configuration of the RBCs. Finally, for a complete study of a thermo-mechanical problem, not only in Mixture Theory, but in continuum mechanics in general, the Second Law of Thermodynamics has to be considered. In other words, in addition to other principles in continuum mechanics such as material symmetry, frame indifference, etc., the Second Law imposes important restrictions on the type of motion and/or the constitutive parameters [For a discussion of important concepts in constitutive equations of mechanics, we refer the reader to the books by Liu (2002) and Batra (2006)]. Since, there is no general agreement on the functional form of the constitutive relation and since the Helmholtz free energy is not known, a complete thermodynamical treatment of the model used in our studies is lacking.1In the next section, we briefly discuss the constitutive models for both the plasma and the RBCs.
3. Constitutive equations
For closure of the governing equations of motion, Eqs. (5) and (6), we can see that constitutive equations are needed for the stress tensors of the plasma and the RBCs as well as the interaction forces. A complete constitutive relation for the stress tensor of the (whole) blood, not only must capture and describe the rheological characteristics of its different components, but also must include the biochemistry and the chemical reactions occurring. To date no such comprehensive and universal constitutive relation exists. As mentioned by Anand, Rajagopal, and Rajagopal (2005): “However, the numerous biochemical reactions that take place leading to the formation and lysis of clots, and the exact influence of hemodynamic factors in these reactions are incompletely understood.” In fact, the majority, if not all, of the papers published on blood characteristics either deal with the biochemistry of clot formation and other biochemical issues, ignoring completely the hemodynamic [see for example Kuharsky and Fogelson (2001)], or deal exclusively with hemodynamic or homeostasis and pay no attention to the biochemical reactions [see Sorensen, Burgreen, Wagner, and Antaki (1999)]. Anand and Rajagopal (2002) developed a model for blood that is capable of incorporating platelet activation. More recently, Rajagopal and colleagues (Anand, Rajagopal, & Rajagopal (2006, 2008)) have provided a framework whereby some of the biochemical aspects of blood along with certain rheological (viscoelastic) properties of blood are included in their formulation. We assume that blood is a two-component mixture, composed of the red blood cells (RBCs) suspended in a (platelet rich) plasma.
3.1. Plasma
We assume that the plasma behaves as a linear viscous fluid [see Massoudi and Antaki (2008)]
| (7) |
where p1 is the plasma pressure, μ1 and λ1 are the first and second coefficients of viscosity of the plasma, ‘tr’ is the trace operator, and I is the identity tensor. It is necessary to make sure that when the volume fraction of the RBCs equals ϕmax, the effect of plasma should disappear from the equations. To ensure this, we assume,
| (8) |
where p is the pressure of the mixture, and λ10 and μ10 are the first and second (constant) coefficients of viscosity of the pure plasma.
3.2. RBCs
We model the RBCs as a generalized Reiner–Rivlin model proposed by Massoudi (2011), which exhibits a shear dependent viscosity and includes the effect of porosity,
| (9) |
where β1,β2,β3 and β4, depend on the hematocrit ϕ; in addition, β3, is also assumed to depend on the symmetric part of the velocity gradient, implying a shear rate dependent viscosity. Furthermore, based on the basic principle of Mixture Theory that when the hematocrit is equal to 0, the effect of the RBCs should disappear, the expressions for β1,β2,β3 and β4 as proposed by Massoudi and Antaki (2008) are,
| (10) |
where Π is related to the invariants of D2; β20, β30 and β40 are material parameters which, in general, need to be measured experimentally. In the present study, the shear-thinning effect is incorporated by applying a shear dependent viscosity model for the RBCs, as suggested by Yeleswarapu (1994),
| (11) |
where μ0 and μ∞ are the viscosities when the shear rate approaches zero and infinity, respectively, and k is the shear thinning parameter. It is known that in a vessel whose characteristic dimension is about the same size as the characteristic size of blood cells, blood behaves as a non-Newtonian fluid, exhibiting shear-thinning and stress relaxation. Thurston (1972, 1973) has pointed out the viscoelastic behavior of blood while stating that the stress relaxation is more significant for cases where the shear rate is low. It has also been reported that at low shear rates, blood seems to have a high apparent viscosity (due to RBC aggregation) while at high shear rates the opposite behavior is observed (due to RBC dis-aggregation) [see Anand and Rajagopal (2004) and Anand et al. (2005, 2006)]. A model which has been able to capture the shear-thinning behavior of blood over a wide range of shear rates is the one proposed by Yeleswarapu (1994) and Yeleswarapu, Kamaneva, Rajagopal, and Antaki (1998) which is a generalization of a three constant Oldroyd-B fluid. Thus, in a sense the model we are using here for the RBCs, is a viscoelastic shear-thinning fluid model where the viscosity is also a function of volume fraction.
3.3. Interaction forces
For the interaction forces, we use a simplified form of the constitutive equation proposed by Johnson, Massoudi, and Rajagopal (1990) and Massoudi (2003),
| (12) |
where the first term represents the force due to the density gradient (Muller, 1968); the second term is related to the (Stokes) drag force; and the third corresponds to the shear lift (or Saffman’s lift (Saffman, 1965, 1968)) force. Furthermore, A1, A2 and A3 are related to material properties, F(ϕ) is called the hindrance function which comes from the generalization of the interaction force from a single particle (RBC) to an assembly of particles. It can be obtained from the empirical correlations of sedimentation of particles (see Johnson et al. (1990) and Drew (1976)),
| (13) |
where a is the radius of the particles (RBCs). Various forms of the hindrance function are available (see for example, Johnson et al. (1990), Batchelor (1972), Tam (1969) and Rourke & Ernstene (1930)),
| (14) |
In this paper we use the relationship suggested by Drew (Batchelor).
4. Parametric study: flow of blood in a rectangular channel
In this section, in order to gain further insight into the nature and influence of the various terms in the two phase model we perform a parametric study. To achieve numerical stability, making it possible to select a wider range of parameters, we choose a special case of the function F (ϕ) above suggested by Bachelor (Drew). Moreover in order to save computational time, we reduce the geometry to 2-D, by assuming an infinitely deep channel (z direction as shown in Fig. 1). Hexahedral meshes of the micro-channel are generated by OpenFOAM® (blockMesh) with 50 and 40 elements in x and y directions, respectively, and with the meshes refined near the walls. The velocity and the volume fraction fields are:
| (15) |
Fig. 1.
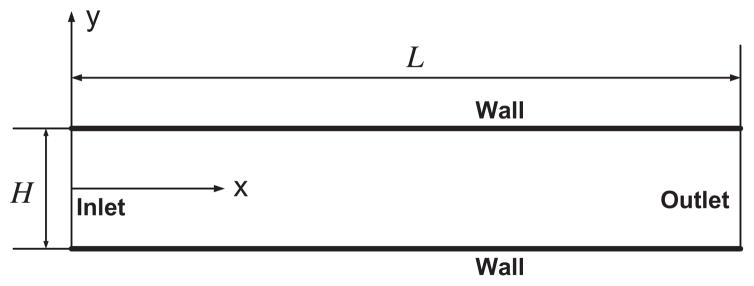
Schematic of the rectangular micro-channel, with infinite depth (z direction).
In a recent study, Wu, Aubry, and Massoudi (2013a) studied the flow of blood in a micro-channel. They used this particular geometry, since Patrick et al. (2011) had focused on a study where they measured the near-wall RBCs in a rectangular microchannel. Wu, Aubry, and Massoudi (2013b) were able to show that their numerical results, using the data available in literature, produced very good agreement with the experimental results of Patrick et al. (2011). In the current study, we will perform a parametric study using the dimensionless forms of the equations. We can see that the stress tensors and the interaction forces have many material parameters which need to be modeled. In the absence of any or limited experimental data, we have assumed very specific functions for some of these coefficients in the stress tensors and we have proposed some new ones for the interaction forces. Clearly, these choices would restrict the solution to the problem and clearly alternative choices are possible and they in turn may provide different answers. In our selection of the material coefficients, we have been guided by our previous studies in granular materials and blood flow.
4.1. Dimensionless governing equations
Substituting Eqs. (7), (9) and (12) into Eqs. (6a) and (6b), we obtain the two dimensionless momentum equations (here we have assumed that both phases are incompressible) which yield for the plasma phase,
| (16) |
and for the RBCs phase,
| (17) |
where
| (18) |
where H is a characteristic length, e.g., the distance between the two channel plates (y direction in Fig. 1), u0 is a characteristic velocity, e.g., the inlet velocity, ρ0 is a characteristic density, e.g., the plasma density, and x is the position vector. Moreover, the asterisks are dropped for simplicity. The following dimensionless numbers are then obtained,
| (19) |
where Re is the Reynolds number of plasma, R4 is related to the normal stress coefficient, Fr is the Froude number, K is a parameter related to the shear-thinning of the RBCs, B31 and B32 are related to the viscous effects of the RBCs (similar to the Reynolds number), C1 is related to the coefficient of the force due to density gradients, C2 is related to the drag coefficient, and C3 is related to the lift coefficient.
In all cases in this study, we assume that a uniform volume fraction of the RBCs at the inlet equal to 0.45 and the inlet velocity of both RBCs and plasma is 1. The full set of boundary conditions2 is summarized in Table 1. [See also Kim (2012).] Based on the mathematical model discussed above, using OpenFOAM®, a two-component CFD solver was been developed. For a detailed description of the algorithm see Kim (2012) and Rusche (2002). We also assume that the first term in the interaction force, i.e. A1, and the normal stress effect term, β40, are zero; the effect of the body force, i.e. the gravity, is assumed to be negligible; thus we only consider the effect of the dimensionless parameters, Re, K, B31, B31, C2 and C3 hereafter.
Table 1.
Boundary conditions.
| Boundary | Pressure | Velocity | Volume fraction |
|---|---|---|---|
| Inlet | Zero gradient | Uniform value | Uniform value |
| Outlet | Uniform value (0) | Zero Gradient | Zero gradient |
| Wall | Zero gradient | Uniform value (0) | Zero gradient |
4.2. Numerical results
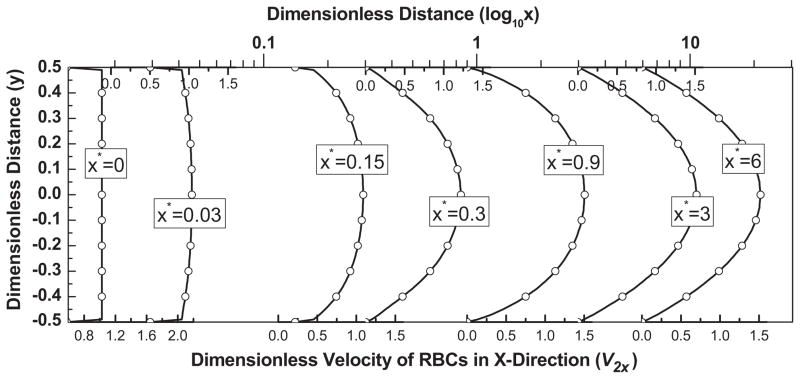
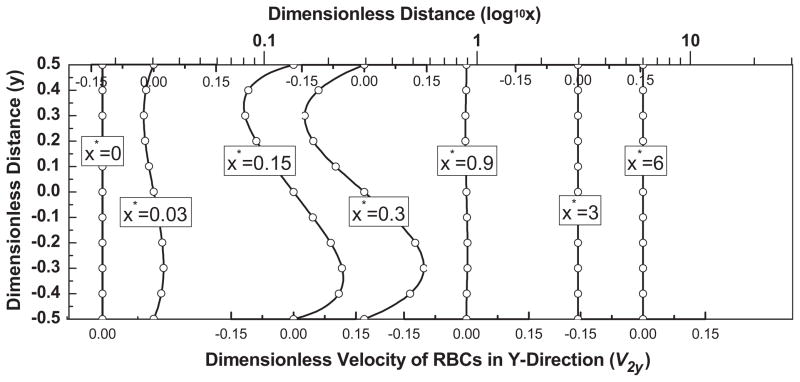
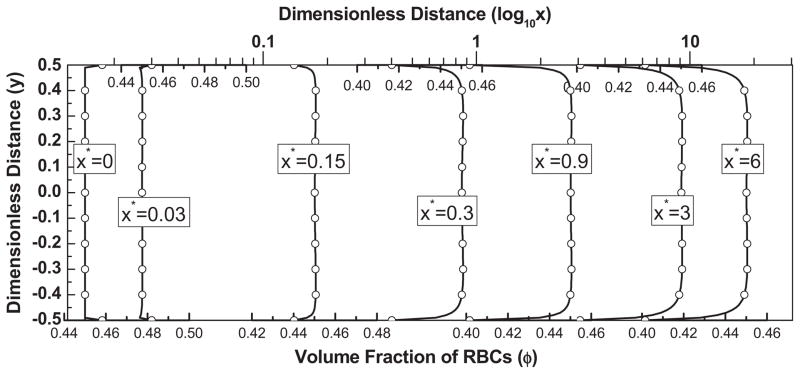
Figs. 2(a)–(c) show the velocity distributions in the x direction [v2x] and y direction [v2y] [see Eq. (15)] and the volume fraction of RBCs. Due to the large value of the drag force term, C2, chosen in this case, the velocity profiles of the plasma and the RBCs coincide. From the observed development of velocity, we see that the flow becomes fully developed at approximately position x*= 3 (i.e. x = 3H). Fig. 2b shows the corresponding y-velocity distribution of the RBCs at various downstream (x*) locations. We observe that in the lower half of the channel the velocity is positive while in the upper half the velocity is negative, indicating that the RBCs migrate from the wall to the center of the channel. It also can be seen that near the inlet of the channel, influenced by the inlet boundary condition, the y velocity component is initially small and gradually increases due to the lift force, C3, achieving a maximum value at approximately x* = 0.3 and then returning to zero as the RBC distribution reaches equilibrium. The resulting volume fraction of the RBCs are provided in Fig. 2c, in which the development of a depletion layer is clearly visible.
Figure 2.
Fig. 2a. The streamwise (x) velocity distribution of RBCs at various streamwise locations, for the parameter values Re = 100, K = 1000, B31 = 0.5, B32 = 20, C2 = 10,000, C3 = 3.
Fig. 2b. The y-velocity distribution of RBCs at various streamwise locations, for the parameter values Re = 100, K = 1000, B31 = 0.5, B32 = 20, C2 = 10,000, C3 = 3.
Fig. 2c. The volume fraction distribution of RBCs at various streamwise locations, for the parameter values Re = 100, K = 1000, B31 = 0.5, B32 = 20, C2 = 10,000, C3 = 3.
In the remainder of this section, we perform a parametric study, exploring the effect of various dimensionless parameters on the flow. All the numerical results shown in Figs. 3–8 are obtained for the case of the fully developed flow.
Figure 3.
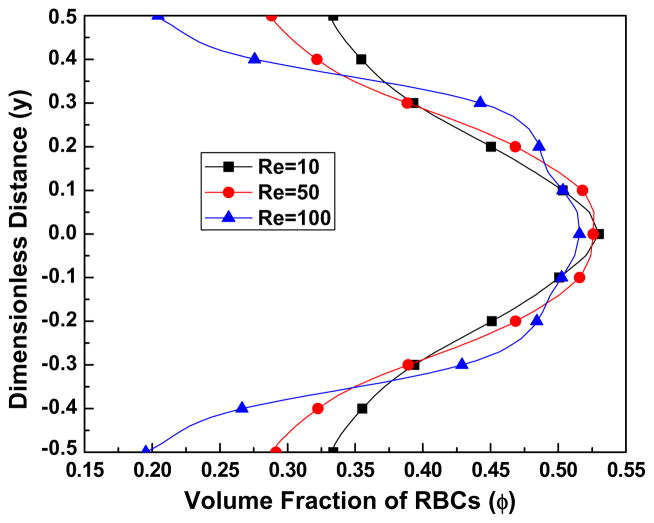
Fig. 3a. The effect of the Reynolds number Re on the volume fraction of RBCs, for the parameter values K = 1000, B31 = 0.5, B32 = 20, C2 = 10, C3 = 3.
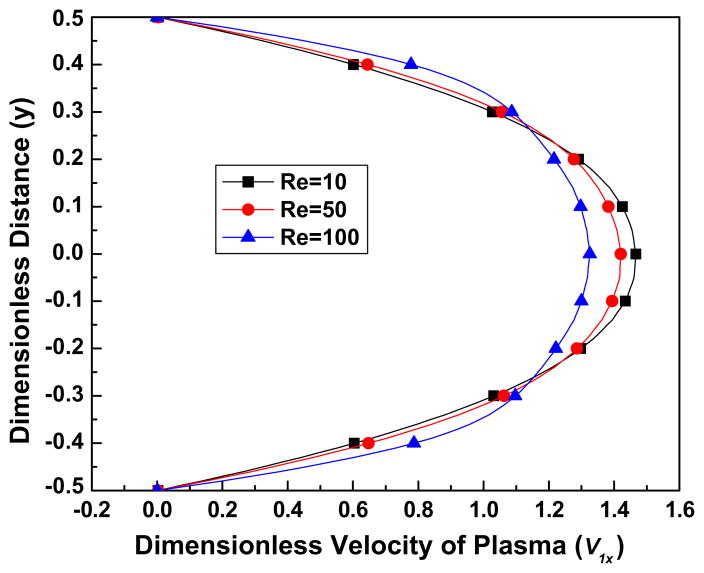
Fig. 3b. The effect of the Reynolds number Re on the streamwise (x) velocity of the plasma, for the parameter values K = 1000, B31 = 0.5, B32 = 20, C2 = 10, C3 = 3.
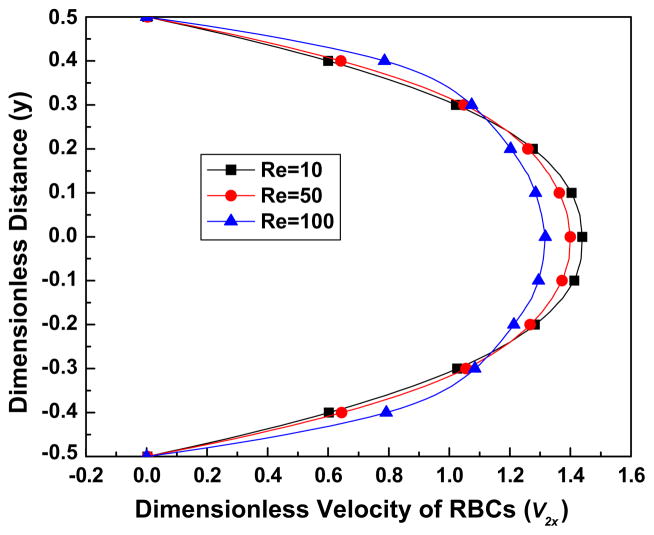
Fig. 3c. The effect of the Reynolds number Re on the streamwise (x) velocity of RBCs, for the parameter values K = 1000, B31 = 0.5, B32 = 20, C2 = 10, C3 = 3.
Figure 8.
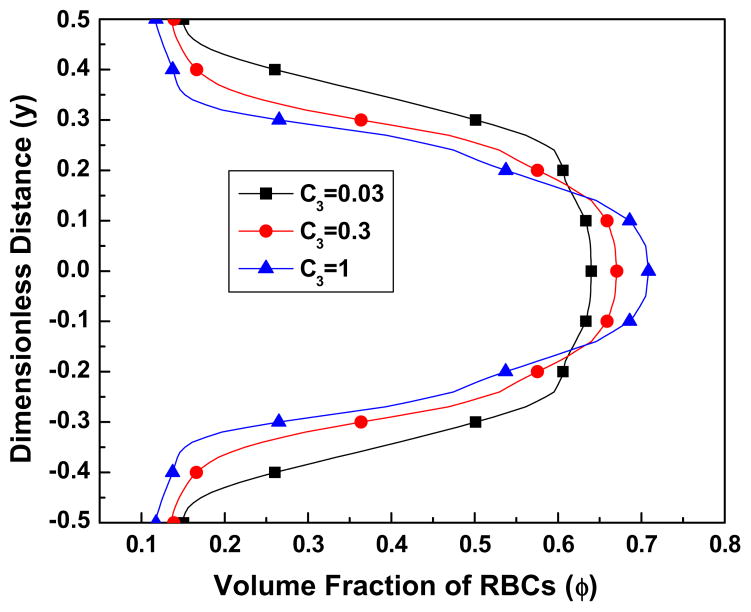
Fig. 8a. The effect of the parameter C3 on the volume fraction of the RBCs, for the parameter values Re = 100, K = 1000, B31 = 0.5, B32 = 20, C2 = 0.1.
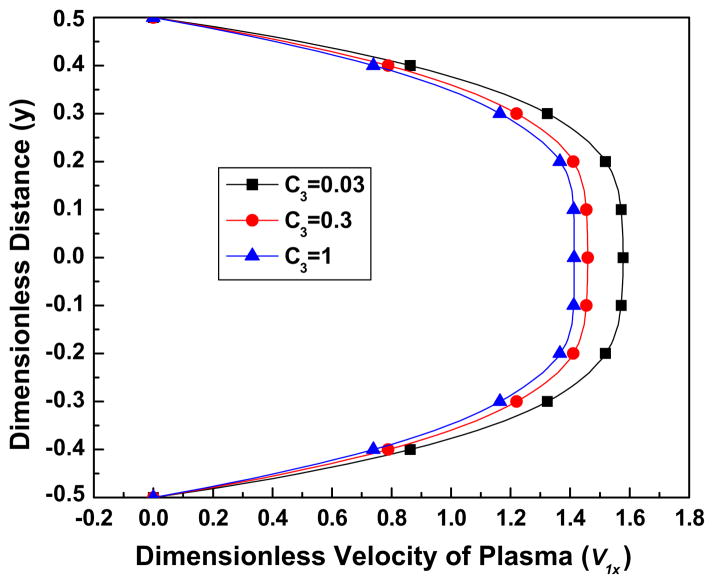
Fig. 8b. The effect of the parameter C3 on the streamwise (x) velocity of the plasma, for the parameter values Re = 100, K = 1000, B31 = 0.5, B32 = 20, C2 = 0.1.
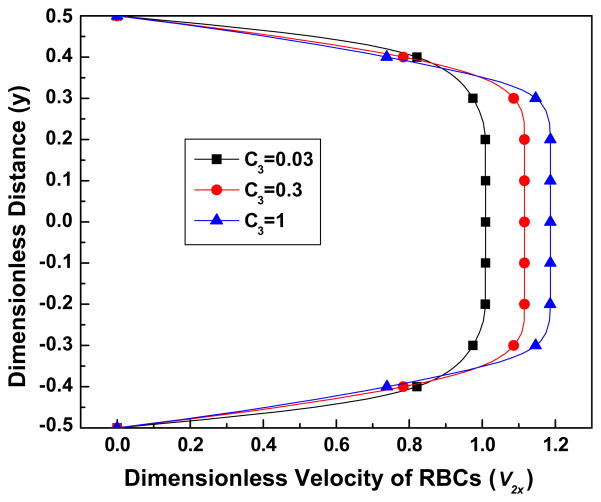
Fig. 8c. The effect of the parameter C3 on the streamwise (x) velocity of the RBCs, for the parameter values Re = 100, K = 1000, B31 = 0.5, B32 = 20, C2 = 0.1.
4.2.1. Effect of Re
Fig. 3a shows the volume fraction distribution of the RBCs for different values of the Reynolds number Re. It can be seen that an increase of the Reynolds number accentuates the depletion phenomenon near the wall, which is consistent experimental observations of Lih (1969). Figs. 3(b) and(c) show the effect of the Reynolds number on the streamwise (x) velocity distribution of the plasma and the RBCs. Comparing these two figures we deduce that the velocity difference between the two phases is rather small. This could be attributed to the large value of the drag force term, C2. These two figures also illustrate the effect of increasing values of the Reynolds number, for example through a decrease of the plasma viscosity, on the bluntness of the velocity profile.
4.2.2. Effect of K, B31 and B32
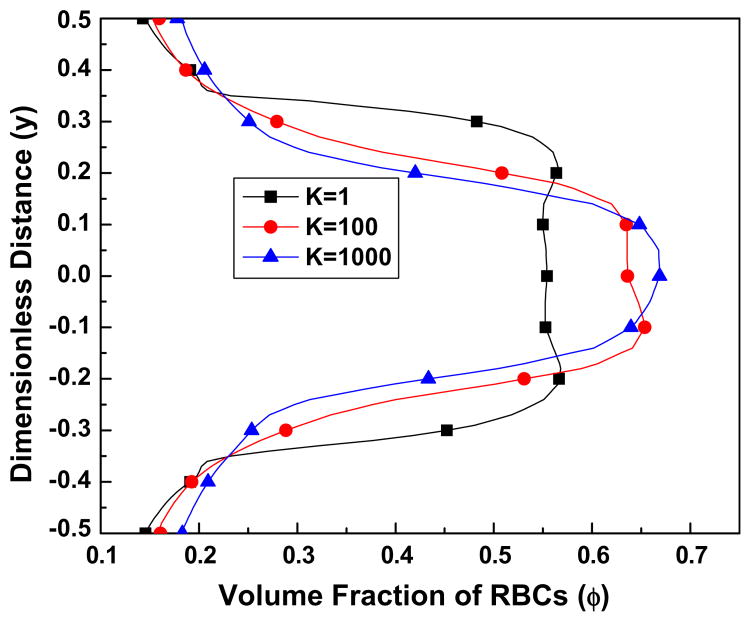
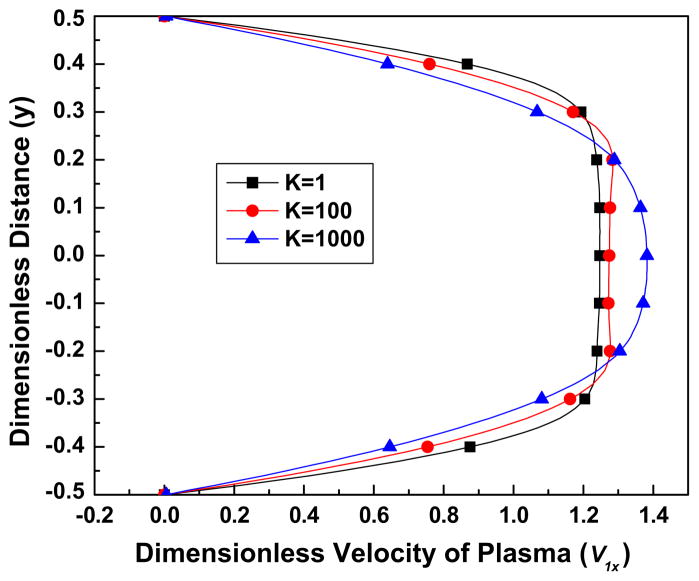
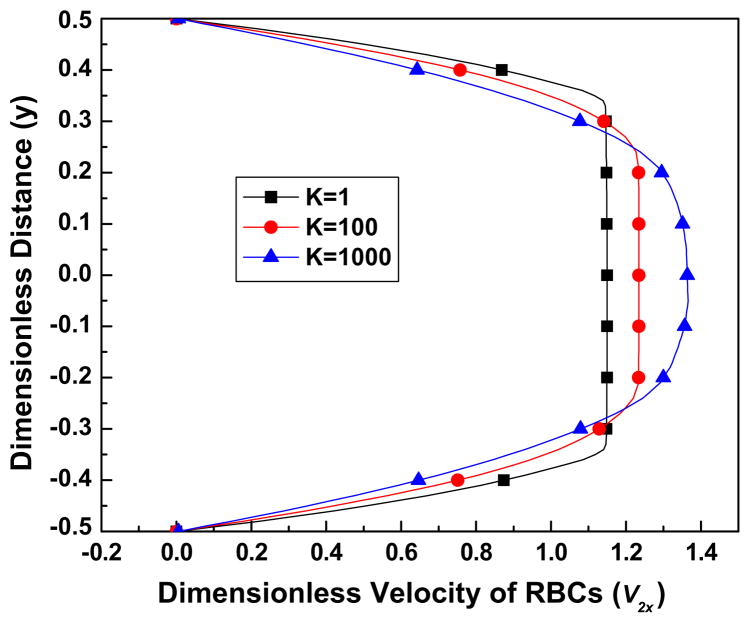
Fig. 4a shows the volume fraction distribution of the RBCs as a function of the RBCs shear thinning parameter K. It can be seen that as K increases, the value of the volume fraction around the center line becomes larger. That might be related to the fact that for larger values of K a more parabolic velocity profile is obtained, implying a region of larger velocity gradient, see Figs. 4(b) and (c). Eq. (12) corroborates that the lift force, which causes the RBCs to migrate from the wall to the center line of the channel is positive and proportional to the plasma velocity gradient.
Figure 4.
Fig. 4a. The effect of the RBCs shear thinning parameter K on the volume fraction of RBCs, for the parameter values Re = 100, B31 = 0.5, B32 = 20, C2 = 10, C3 = 3.
Fig. 4b. The effect of the RBCs shear thinning parameter K on the streamwise (x) velocity of plasma, for the parameter values Re = 100, B31 = 0.5, B32 = 20, C2 = 10, C3 = 3.
Fig. 4c. The effect of the RBCs shear thinning parameter K on the streamwise (x) velocity of RBCs, for the parameter values Re = 100, B31 = 0.5, B32 = 20, C2 = 10, C3 = 3.
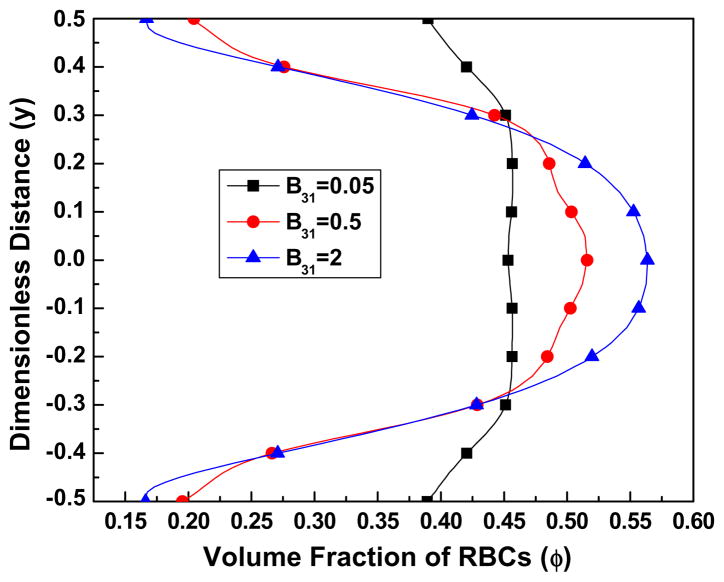
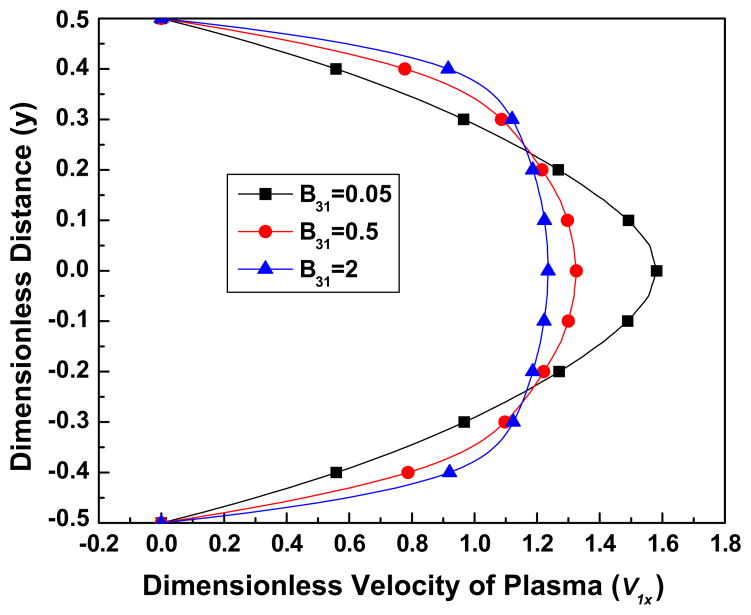
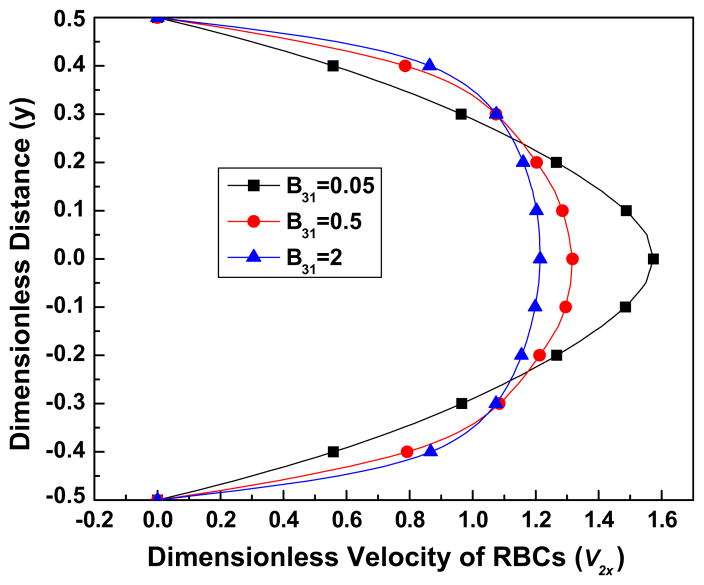
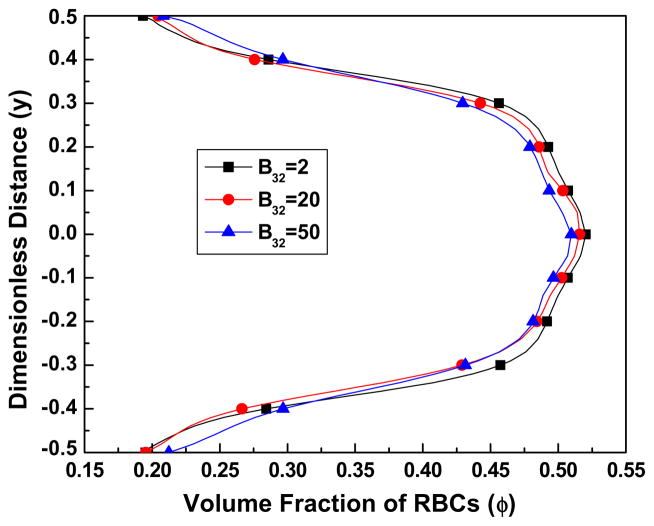
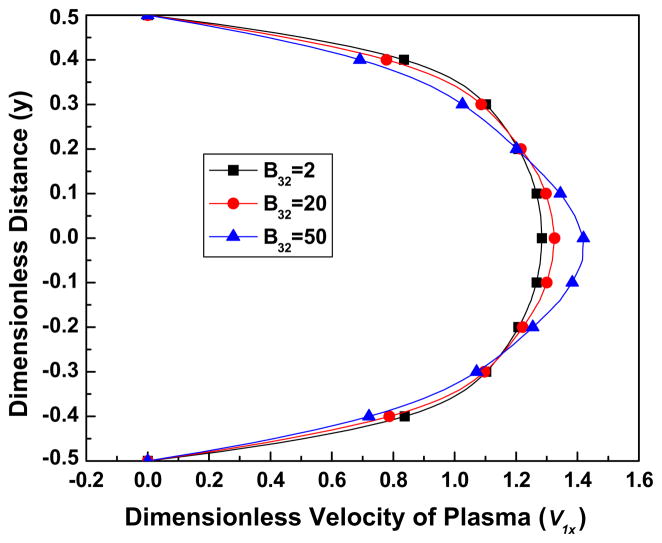
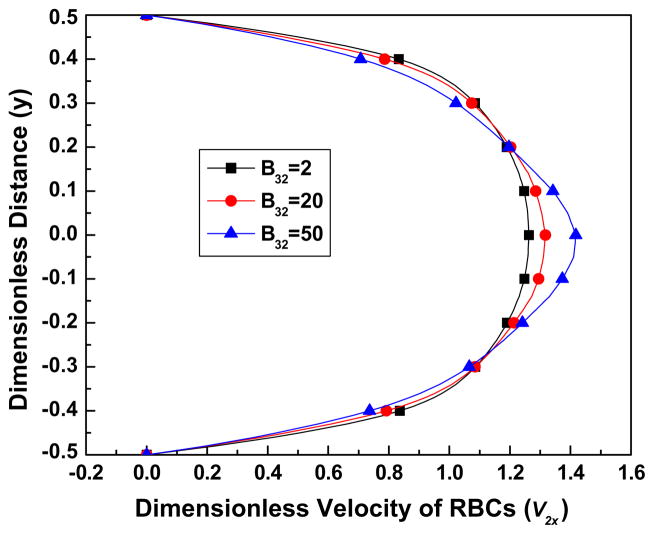
From Figs. 5(b) and (c), we can see that as the parameter B31 decreases, the velocity profile loses its bluntness and becomes more parabolic. When K is very large, the viscosity of the RBCs is influenced more by B31 rather than by B32, and when B31 is small, for example takes the value of 0.05, the viscosity of RBCs has the same order of the magnitude as the plasma viscosity in most parts of the flow ( ). This implies that when B31 is small the plasma influences the flow of the blood significantly. As B31 increases, the velocity profiles deform to adopt a blunt shape. Fig. 5a shows the effect of B31 on the volume fraction distribution of the RBCs. It can be seen that when B31 has a small value, for example 0.05, indicating that the plasma viscosity is comparable to the viscosity of the RBCs, the volume fraction distribution is more uniform; however as B31 increases, the distribution becomes less uniform. Fig. 6a shows the volume fraction distribution as a function of B32 and demonstrates its negligible influence over the range of the values (2–50) studied here. Accordingly, Figs. 6(a) and (c) demonstrate negligible influence of B32 on the velocity fields.
Figure 5.
Fig. 5a. The effect of the parameter B31 on the volume fraction of RBCs, for the parameter values Re = 100, K = 1000, B32 = 20, C2 = 10, C3 = 3.
Fig. 5b. The effect of the parameter B31 on the streamwise (x) velocity of plasma, when Re = 100, K = 1000, B32 = 20, C2 = 10, C3 = 3.
Fig. 5c. The effect of the parameter B31 on the streamwise (x) velocity of RBCs, for the parameter values Re = 100, K = 1000, B32 = 20, C2 = 10, C3 = 3.
Figure 6.
Fig. 6a. The effect of the parameter B32 on the volume fraction of RBCs, for parameter values Re = 100, K = 1000, B31 = 0.5, C2 = 10, C3 = 3.
Fig. 6b. The effect of the parameter B32 on the streamwise (x) velocity of plasma, for parameter values Re = 100, K = 1000, B31 = 0.5, C2 = 10, C3 = 3.
Fig. 6c. The effect of the parameter B32 on the streamwise (x) velocity of the RBCs, when Re = 100, K = 1000, B31 = 0.5, C2 = 10, C3 = 3.
4.2.3. Effect of C2 and C3
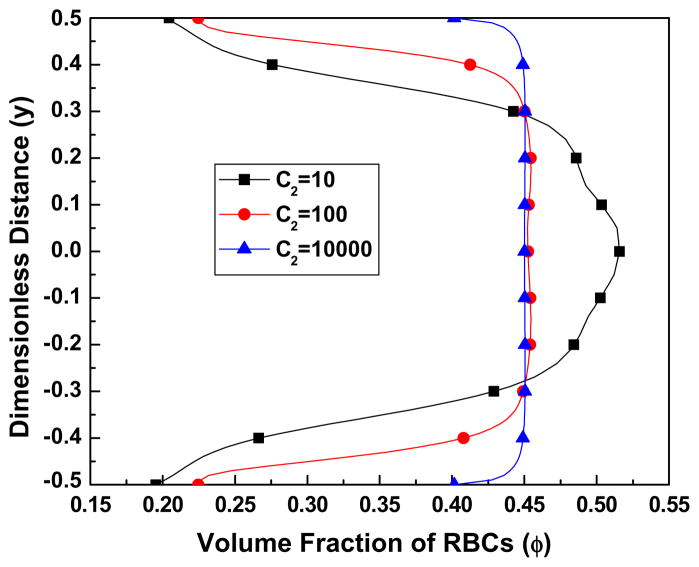
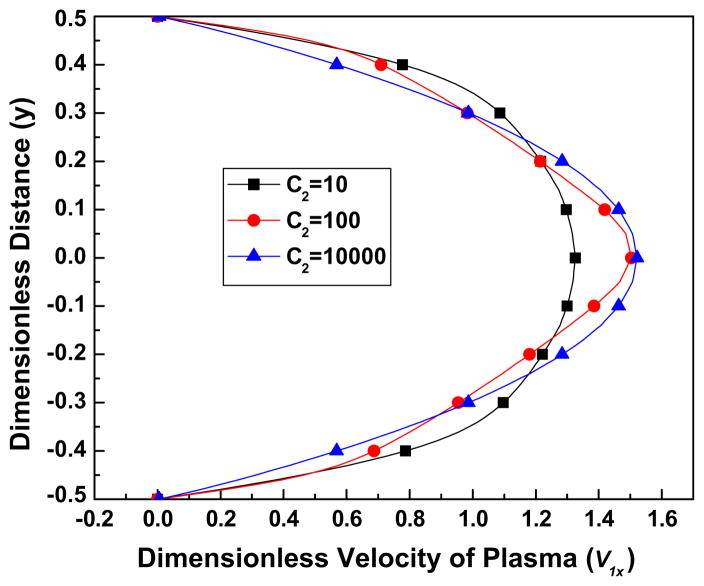
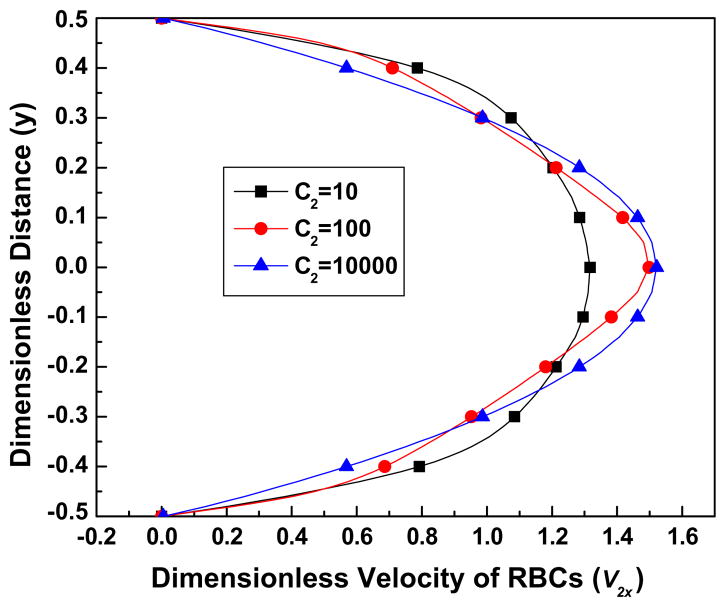
Figs. 7(a)–(c) displays the effect of parameter C2 on the volume fraction distribution and velocity profiles. With increasing C2 by an order of magnitude from 10 to 100, it is seen that the volume fraction becomes dramatically blunter, and the velocity profiles less blunt. However additional increase of C2, by 3 orders of magnitude does not have as much influence on the volume fraction or velocity fields. A slight decrease in velocity difference between the two components is also observed for increasing C2, which leads to a smaller lift force, the main term causing the non-uniform distribution of the volume fraction of the RBCs, [see Eq. (12)]. The shape of the velocity field is inevitably related to the volume fraction: the more uniform the distribution of RBCs, the more uniform the viscosity distribution, [see Eq. (10)], and hence more parabolic the velocity field.
Figure 7.
Fig. 7a. The effect of the parameter C2 on the volume fraction of RBCs, for parameter values Re = 100, K = 1000, B31 = 0.5, B32 = 20, C3 = 3.
Fig. 7b. The effect of the parameter C2 on the streamwise (x) velocity of plasma, for the parameter values Re = 100, K = 1000, B31 = 0.5, B32 = 20, C3 = 3.
Fig. 7c. The effect of the parameter C2 on the streamwise (x) velocity of RBCs, for the parameter values Re = 100, K = 1000, B31 = 0.5, B32 = 20, C3 = 3.
Fig. 8a shows that as C3 becomes larger more RBCs concentrate near the channel center line and the region of low volume fraction of the RBCs expands. This is understandable inasmuch as C3 corresponding to a larger lift force causing the RBCs to migrate away from the wall to the center line of the channel. From Figs. 8(a) and(c), we observe that as C3 increases, near the center line of the channel the velocity of the plasma decreases while the velocity of the RBCs increases, that is, there is a smaller velocity difference between the two components. This may be related to the higher values of the volume fraction near the center line which is caused by larger values of C3. Indeed, a higher volume fraction of the RBCs leads to a higher drag force [see the Batchelor drag function in Eq. (14)] which, in turn, leads to a smaller velocity difference.
5. Conclusions
In this paper, a two-component flow of blood was formulated. The mathematical model was based on the framework of the Mixture Theory. A numerical solver was developed using OpenFOAM®, and used to study a specific problem, namely the flow of blood in a micro-channel. A parametric study was performed, providing further insight into the model by giving additional information on the influence of the material properties. For example, varying the parameters B31 and B32 [see Eq. (11)] led to a wide range of shear dependent properties. Furthermore, by varying C2 and C3 (see Eq. (19), where C2 is related to the drag coefficient, and C3 is related to the lift coefficient) it was found that the interaction force has a strong influence on the RBCs. For certain value of C2 and C3, it was possible to show the RBCs depletion near the wall or plasma skimming (see Fig. 8a). We also notice that the parameters chosen in Fig. 8a might not be relevant to a physical problem, such as the flow of blood in a micro-channel. In order to overcome this, more accurate forms of the coefficients for the interaction forces are needed. Finally, it goes without saying that the model developed here is only appropriate for a healthy human, and it does not capture any blood disorder. To include the formation and growth of clots, and lysis of blood cells in blood, in general, the reaction–convection–diffusion equations are to be solved in conjunction with the balance laws for mass, linear and angular momentum, and energy (for each component). Although we have ignored the biochemical effects of blood in this paper, in principle, the theory is amenable to extension [see Anand et al. (2005)].
Acknowledgments
This research was supported in part by NIH grant 1 R01 HL089456.
Footnotes
In recent years, Rajagopal and colleagues [see for example, Rajagopal and Srinivasa (2000, 2001)] have devised a thermodynamic framework, the Multiple Natural Configuration Theory, by appealing to the maximization of the rate of entropy production to obtain a class of constitutive relations for many different types of materials. Unlike the traditional thermodynamic approach whereby a form for the stress is assumed (or derived) and restriction on the material parameters are obtained by invoking the Clausius–Duhem inequality, in their thermodynamic framework, they assume specific forms for the Helmholtz potential and the rate of dissipation—reflecting on how the energy is stored in the body and the way in which the body dissipates it.
A fundamental difficulty in using Mixture Theory has to do with the boundary conditions and how to split the (total) traction vector, related to the (total) stress tensor, or the (total) velocity vector. In an important paper, Rajagopal, Wineman, and Gandhi (1986) developed a novel scheme to split the total stress for a class of problems, related to diffusion of fluids through non-linear elastic materials such as rubber, in which the boundary of the mixture is assumed to be in a state of saturation. As a result of a thermodynamic restriction, namely the variation of the Gibbs free energy of dilution being zero, a relationship between the total stress tensor, the stretch tensor and the volume fraction of the solid component is obtained. This saturation condition is explained by Rajagopal and Tao (1995, p. 31), as: “…a state in which a small element of the solid adjacent to the fluid is in a state in which it cannot absorb any more fluid, that is whatever fluid enters the elemental volume along the boundary has to exit through the elemental volume so that there is no accumulation of the fluid.” Interestingly it has been shown that under certain conditions the solution is insensitive to the boundary condition [see Prasad and Rajgopal (2006)]. In the two component fluid-particles system that is advocated in our paper, it is not the tractions which are of interest but the velocities [see Massoudi (2010)]. For free surface flows, on the other hand, the splitting of the traction vector remains the main difficulty [see Ravindran, Anand, and Massoudi (2004)]. It should be remarked that in general, sometimes the additional boundary conditions can be provided from experimental data, and sometimes they can be based on other theories, such as kinetic theories, or physical insights. In certain cases, due to the higher order gradients of volume fraction, it is necessary to provide additional boundary conditions for solving practical and simple boundary value problems [see Massoudi (2007) for a discussion of boundary conditions]. For some practical applications, symmetry conditions can be used; in certain cases the values of the unknowns or their derivatives have to be specified as surface conditions at the walls or at the free surface. In some situations slip may occur at the wall, and therefore the classical assumption of adherence boundary condition at the wall no longer applies. In such cases, perhaps a generalization of Navier’s hypothesis can be used. In fact, based on this, Massoudi and Phuoc (2000) proposed that for granular materials the slip velocity is proportional to the stress vector at the wall, i.e. us = g [(Tsn)x, (Ts n)y], where Ts is the stress tensor for the granular component, n is the unit normal vector and g in general could be a function of surface roughness, volume fraction (density), shear rate, etc.
References
- Aarts PA, Steendijk P, Sixma JJ, Heethaar RM. Fluid shear as a possible mechanism for platelet diffusivity in flowing blood. Journal of Biomechanics. 1986;19(10):799–805. doi: 10.1016/0021-9290(86)90130-2. [DOI] [PubMed] [Google Scholar]
- Anand M, Rajagopal KR. A mathematical model to describe the change in the constitutive character of blood flow due to platelet activation. Comptes Rendus Mecanique. 2002;330:557–562. [Google Scholar]
- Anand M, Rajagopal KR. A shear-thinning viscoelastic fluid model for describing the flow of blood. International Journal of Cardiovascular Medicine and Science. 2004;4:59–68. [Google Scholar]
- Anand M, Rajagopal K, Rajagopal KR. A model for the formation and lysis of blood clots. Pathophysiology of Haemostasis and Thrombosis. 2005;34:109–120. doi: 10.1159/000089931. [DOI] [PubMed] [Google Scholar]
- Anand M, Rajagopal K, Rajagopal KR. A viscoelastic fluid model for describing the mechanics of a coarse ligated plasma clot. Theoretical and Computational Fluid Dynamics. 2006;20:239–250. [Google Scholar]
- Anand M, Rajagopal K, Rajagopal KR. A model for the formation, growth, and lysis of clots in quiescent plasma. A comparison between the effects of antithrombin III deficiency and protein C deficiency. Journal of Theoretical Biology. 2008;253(4):725–738. doi: 10.1016/j.jtbi.2008.04.015. [DOI] [PubMed] [Google Scholar]
- Ateshian GA, Likhitpanichkul M, Hung CT. A mixture theory analysis for passive transport in osmotic loading of cells. Journal of Biomechanics. 2006;39:464–475. doi: 10.1016/j.jbiomech.2004.12.013. [DOI] [PMC free article] [PubMed] [Google Scholar]
- Atkin RJ, Craine RE. Continuum theories of mixtures: Applications. IMA Journal of Applied Mathematics. 1976a;17(2):153–207. [Google Scholar]
- Atkin RJ, Craine RE. Continuum theories of mixtures: Basic theory and historical development. The Quarterly Journal of Mechanics and Applied Mathematics. 1976b;29(2):209–244. [Google Scholar]
- Bagchi P. Mesoscale simulation of blood flow in small vessels. Biophysical Journal. 2007;92(6):1858–1877. doi: 10.1529/biophysj.106.095042. [DOI] [PMC free article] [PubMed] [Google Scholar]
- Batchelor GK. Sedimentation in a dilute dispersion of spheres. Journal of Fluid Mechanics. 1972;52(02):245–268. [Google Scholar]
- Batra Romesh C. Elements of continuum mechanics. Reston, VA: American Institute of Aeronautics and Astronautics (AIAA) Inc; 2006. [Google Scholar]
- Bäumler H, Neu B, Donath E, Kiesewetter H. Basic phenomena of red blood cell rouleaux formation. Biorheology. 1999;36(5):439–442. [PubMed] [Google Scholar]
- Bowen RM. Theory of mixtures. In: Eringen AC, editor. Continuum physics. Vol. 3. New York: Academic Press; 1976. p. 1. [Google Scholar]
- Brooks DE, Goodwin JW, Seaman GV. Interactions among erythrocytes under shear. Journal of Applied Physiology. 1970;28(2):172–177. doi: 10.1152/jappl.1970.28.2.172. [DOI] [PubMed] [Google Scholar]
- Carr RT, Wickham LL. Plasma skimming in serial microvascular bifurcations. Microvascular Research. 1990;40(2):179–190. doi: 10.1016/0026-2862(90)90017-l. [DOI] [PubMed] [Google Scholar]
- Chien S. Shear dependence of effective cell volume as a determinant of blood viscosity. Science. 1970;168(3934):977–979. doi: 10.1126/science.168.3934.977. [DOI] [PubMed] [Google Scholar]
- Chien S, Usami S, Dellenback RJ, Bryant CA. Comparative hemorheology–hematological implications of species differences in blood viscosity. Biorheology. 1971;8(1):35. doi: 10.3233/bir-1971-8106. [DOI] [PubMed] [Google Scholar]
- Chien S, Usami S, Taylor HM, Lundberg JL, Gregersen MI. Effects of hematocrit and plasma proteins on human blood rheology at low shear rates. Journal of Applied Physiology. 1966;21(1):81–87. doi: 10.1152/jappl.1966.21.1.81. [DOI] [PubMed] [Google Scholar]
- Clausen JR, Reasor DA, Jr, Aidun CK. Parallel performance of a lattice-Boltzmann/finite element cellular blood flow solver on the IBM Blue Gene/P architecture. Computer Physics Communications. 2010;181(6):1013–1020. [Google Scholar]
- Drew DA. Two-phase flows: constitutive equations for lift and Brownian motion and some basic flows. Archive for Rational Mechanics and Analysis. 1976;62(2):149–163. [Google Scholar]
- Dupin MM, Halliday I, Care CM, Alboul L, Munn LL. Modeling the flow of dense suspensions of deformable particles in three dimensions. Physical Review E. 2007;75(6):066707. doi: 10.1103/PhysRevE.75.066707. [DOI] [PMC free article] [PubMed] [Google Scholar]
- Fåhraeus R. The suspension stability of the blood. Physiological Reviews. 1929;9(2):241–274. [Google Scholar]
- Fåhræus R, Lindqvist T. The viscosity of the blood in narrow capillary tubes. American Journal of Physiology – Legacy Content. 1931;96(3):562–568. [Google Scholar]
- Fung YC. Biomechanics: Mechanical properties of living tissues. 2. New York: Springer-Verlag; 1993. [Google Scholar]
- Garikipati K, Arruda EM, Grosh K, Narayanan H, Calve S. A continuum treatment of growth in biological tissues: The coupling of mass transport and mechanics. Journal of the Mechanics and Physics of Solids. 2004;52:1595–1625. [Google Scholar]
- Goldsmith HL. The microrheology of red blood cell suspensions. JGP. 1968;52(1):5–28. [PMC free article] [PubMed] [Google Scholar]
- Goldsmith HL. Red cell motions and wall interactions in tube flow. Federation Proceedings. 1971;30(5):1578–1590. [PubMed] [Google Scholar]
- Green AE, Naghdi PM. A theory of mixtures. Archive for Rational Mechanics and Analysis. 1967;24(4):243–263. [Google Scholar]
- Green AE, Naghdi PM. A note on mixtures. International Journal of Engineering Science. 1968;6(11):631–635. [Google Scholar]
- Humphrey JD, Rajagopal KR. A constrained mixture model for growth and remodeling of soft tissues. Mathematical Models & Methods in Applied Sciences. 2002;12:407–430. [Google Scholar]
- Ishii M. Thermo-fluid dynamic theory of two-phase flow. NASA STI/Recon Technical Report A. 1975;75:29657. [Google Scholar]
- Johnson G, Massoudi M, Rajagopal KR. DOE Report, DOE/PETC/TR-90/9. 1990. A review of interaction mechanisms in fluid–solid flows. [Google Scholar]
- Johnson G, Massoudi M, Rajagopal KR. Flow of a fluid–solid mixture between flat plates. Chemical Engineering Science. 1991;46(7):1713–1723. [Google Scholar]
- Jung J, Hassanein A, Lyczkowski RW. Hemodynamic computation using multiphase flow dynamics in a right coronary artery. Annals of Biomedical Engineering. 2006;34(3):393–407. doi: 10.1007/s10439-005-9017-0. [DOI] [PubMed] [Google Scholar]
- Kameneva MV, Garrett KO, Watach MJ, Borovetz HS. Red blood cell aging and risk of cardiovascular diseases. Clinical Hemorheology and Microcirculation. 1998;18(1):67–74. [PubMed] [Google Scholar]
- Kim J. PhD Thesis. Carnegie Mellon University; 2012. Multiphase CFD analysis and shape-optimization of blood-contacting medical devices. [Google Scholar]
- Kim J, Massoudi M, Antaki JF, Gandini A. Removal of malaria-infected red blood cells using magnetic cell separators: A computational study. Applied Mathematics and Computation. 2012;218(12):6841–6850. doi: 10.1016/j.amc.2011.12.057. [DOI] [PMC free article] [PubMed] [Google Scholar]
- Klisch SM, Lotz JC. A special theory of biphasic mixtures and experimental results for human annulus fibrosus tested in confined compression. ASME Journal of Biomechanical Engineering. 2000;122:180–188. doi: 10.1115/1.429640. [DOI] [PubMed] [Google Scholar]
- Krogh A. Studies on the physiology of capillaries II. The reactions to local stimuli of the blood-vessels in the skin and web of the frog. The Journal of Physiology. 1921;55(5–6):412–422. doi: 10.1113/jphysiol.1921.sp001985. [DOI] [PMC free article] [PubMed] [Google Scholar]
- Kuharsky AL, Fogelson AL. Surface mediated control of blood coagulation: the role of binding site densities and platelet deposition. Biophysical Journal. 2001;80:1050–1074. doi: 10.1016/S0006-3495(01)76085-7. [DOI] [PMC free article] [PubMed] [Google Scholar]
- Lemon G, King JR, Byrne HM, Jensen OE, Shakesheff KM. Mathematical modelling of engineered tissue growth using a multiphase porous flow mixture theory. Journal of Mathematical Biology. 2006;52:571–594. doi: 10.1007/s00285-005-0363-1. [DOI] [PubMed] [Google Scholar]
- Lih MM. A mathematical model for the axial migration of suspended particles in tube flow. The Bulletin of Mathematical Biophysics. 1969;31(1):143–157. doi: 10.1007/BF02478214. [DOI] [PubMed] [Google Scholar]
- Lima R, Wada S, et al. Confocal micro-PIV measurements of three-dimensional profiles of cell suspension flow in a square microchannel. Measurement Science and Technology. 2006;17(4):797–808. [Google Scholar]
- Liu IS. Continuum mechanics. Berlin: Springer-Verlag; 2002. [Google Scholar]
- Marhefka JN, Zhao R, Wu ZJ, Velankar SS, Antaki JF, Kameneva MV. Drag reducing polymers improve tissue perfusion via modification of the RBC traffic in microvessels. Biorheology. 2009;46(4):281–292. doi: 10.3233/BIR-2009-0543. [DOI] [PMC free article] [PubMed] [Google Scholar]
- Massoudi M. Constitutive relations for the interaction force in multicomponent particulate flows. International Journal of Non-Linear Mechanics. 2003;38(3):313–336. [Google Scholar]
- Massoudi M. Boundary conditions in mixture theory and in CFD applications of higher order models. Computers & Mathematics with Applications. 2007;53:156–167. [Google Scholar]
- Massoudi M. A note on the meaning of mixture viscosity using the classical continuum theories of mixtures. International Journal of Engineering Science. 2008;46(7):677–689. [Google Scholar]
- Massoudi M. A mixture theory formulation for hydraulic or pneumatic transport of solid particles. International Journal of Engineering Science. 2010;48:1440–1461. [Google Scholar]
- Massoudi M. A generalization of Reiner’s mathematical model for wet sand. Mechanics Research Communications. 2011;38(5):378–381. [Google Scholar]
- Massoudi M, Antaki JF. An anisotropic constitutive equation for the stress tensor of blood based on mixture theory. Mathematical Problems in Engineering. 2008;31 Article ID 579172. [Google Scholar]
- Massoudi M, Kim J, Antaki JF. Modeling and numerical simulation of blood flow using the theory of interacting continua. International Journal of Non-Linear Mechanics. 2012;47(5):506–520. doi: 10.1016/j.ijnonlinmec.2011.09.025. [DOI] [PMC free article] [PubMed] [Google Scholar]
- Massoudi M, Phuoc TX. The effect of slip boundary condition on the flow of granular materials: A continuum approach. International Journal of Non-Linear Mechanics. 2000;35:745–761. [Google Scholar]
- Middleman S. Transport phenomena in the cardiovascular system. New York/London/Sydney/Toronto: Wiley-Interscience; 1972. pp. 138–138. [Google Scholar]
- Muller I. A thermodynamic theory of mixtures of fluids. Archive for Rational Mechanics and Analysis. 1968;28:1–39. [Google Scholar]
- Patrick MJ, Chen CY, Frakes DH, Dur O, Pekkan K. Cellular-level near-wall unsteadiness of high-hematocrit erythrocyte flow using confocal μPIV. Experiments in Fluids. 2011;50:887–904. [Google Scholar]
- Popel AS, Johnson PC. Microcirculation and hemorheology. Annual Review of Fluid Mechanics. 2005;37:43. doi: 10.1146/annurev.fluid.37.042604.133933. [DOI] [PMC free article] [PubMed] [Google Scholar]
- Prasad SC, Rajgopal KR. On the diffusion of fluids through solids undergoing large deformations. Mathematics and Mechanics of Solids. 2006;11:291–305. [Google Scholar]
- Pries AR, Neuhaus D, Gaehtgens P. Blood viscosity in tube flow: Dependence on diameter and hematocrit. American Journal of Physiology-Heart and Circulatory Physiology. 1992;263(6):H1770–H1778. doi: 10.1152/ajpheart.1992.263.6.H1770. [DOI] [PubMed] [Google Scholar]
- Rajagopal KR, Srinivasa AR. A thermodynamic frame work for the rate type fluid models. Journal of Non-Newtonian Fluid Mechanics. 2000;88:207–227. [Google Scholar]
- Rajagopal KR, Srinivasa AR. Modeling anisotropic fluids within the framework of bodies with multiple natural configurations. Journal of Non-Newtonian Fluid Mechanics. 2001;99:109–124. [Google Scholar]
- Rajagopal KR, Tao L. Mechanics of mixtures. Vol. 754. Singapore: World scientific; 1995. [Google Scholar]
- Rajagopal KR, Wineman AS, Gandhi MV. On boundary conditions for a certain class of problems in mixture theory. International Journal of Engineering Science. 1986;24:1453–1463. [Google Scholar]
- Ravindran P, Anand NK, Massoudi M. Steady-free surface flow of a fluid–solid mixture down an inclined plane. Particulate Science and Technology, An International Journal. 2004;22:253–273. [Google Scholar]
- Robertson AM, Sequeira A, Kameneva MV. Hemodynamical flows. Basel: Birkhäuser; 2008. Hemorheology; pp. 63–120. [Google Scholar]
- Rourke MD, Ernstene AC. A method for correcting the erythrocyte sedimentation rate for variations in the cell volume percentage of blood. Journal of Clinical Investigation. 1930;8(4):545. doi: 10.1172/JCI100278. [DOI] [PMC free article] [PubMed] [Google Scholar]
- Rusche H. PhD Thesis. Imperial College; 2002. Computational fluid dynamics of dispersed two-phase flows at high phase fractions. [Google Scholar]
- Saffman P. The lift on a small sphere in a slow shear flow. Journal of Fluid Mechanics. 1965;22(02):385–400. [Google Scholar]
- Saffman PG. Corrigendum. Journal of Fluid Mechanics. 1968;31:624. [Google Scholar]
- Skalak R, Ozkaya N, Skalak TC. Biofluid mechanics. Annual Review of Fluid Mechanics. 1989;21(1):167–200. [Google Scholar]
- Sorensen EN, Burgreen GW, Wagner WR, Antaki JF. Computational simulation of platelet deposition and activation: I. Model development and properties. Annals of Biomedical Engineering. 1999;27(4):436–448. doi: 10.1114/1.200. [DOI] [PubMed] [Google Scholar]
- Sugii Y, Okuda R, et al. Velocity measurement of both red blood cells and plasma of in vitro blood flow using high-speed micro PIV technique. Measurement Science and Technology. 2005;16(5):1126–1130. [Google Scholar]
- Tam CKW. Drag on a cloud of spherical particles in low Reynolds number flow. Journal of Fluid Mechanics. 1969;38:537–546. [Google Scholar]
- Tao L, Humphrey JD, Rajagopal KR. A mixture theory for heat-induced alterations in hydration and mechanical properties in soft tissues. International Journal of Engineering Science. 2001;39:1535–1556. [Google Scholar]
- Thompson LO, Loebe M, Noon GP. What price support? Ventricular assist device induced systemic response. ASAIO Journal. 2003;49(5):518–526. doi: 10.1097/01.mat.0000085672.42122.49. [DOI] [PubMed] [Google Scholar]
- Thurston GB. Viscoelasticity of human blood. Biophysical Journal. 1972;12:1205–1217. doi: 10.1016/S0006-3495(72)86156-3. [DOI] [PMC free article] [PubMed] [Google Scholar]
- Thurston GB. Frequency and shear rate dependence of viscoelasticity of blood. Biorheology. 1973;10:375–381. doi: 10.3233/bir-1973-10311. [DOI] [PubMed] [Google Scholar]
- Truesdell C. Sulle basi della thermomeccanica. Rand Lincei, Series. 1957;8:22, 33–38, 158–166. [Google Scholar]
- Truesdell C. Rational thermodynamics. 2. Springer-Verlag; 1984. [Google Scholar]
- Wu W-T, Aubry N, Massoudi M. On the coefficients of the interaction forces in a two-phase flow of a fluid infused with particles. International Journal of Non-Linear Mechanics. 2013b < http://dx.doi.org/10.1016/j.ijnonlinmec.2013.11.006i>.
- Wu W-T, Aubry N, Massoudi M. ASME Paper Number IMECE 2013-65385. 2013. Channel flow of a mixture of granular materials and a fluid. [Google Scholar]
- Yeleswarapu KK. PhD Dissertation. University of Pittsbugh; 1994. Evaluation of continuum models for characterizing the con-stitutive behavior of blood. [Google Scholar]
- Yeleswarapu KK, Kamaneva MV, Rajagopal KR, Antaki JF. The flow of blood in tubes: Theory and experiment. Mechanics Research Communications. 1998;25:257–262. [Google Scholar]
- Zhang J, Johnson PC, Popel AS. Effects of erythrocyte deformability and aggregation on the cell free layer and apparent viscosity of microscopic blood flows. Microvascular Research. 2009;77(3):265–272. doi: 10.1016/j.mvr.2009.01.010. [DOI] [PMC free article] [PubMed] [Google Scholar]


