

Background: Mechanism of impaired H2S signaling in diabetes is not clear.
Results: Livers from type 1 diabetic (T1D) rats and PBMC isolated from T1D patients have lower cystathionine-γ-lyase activity. High glucose and/or high ketone treatment also decreased cystathionine-γ-lyase activity in U937 monocytes and PBMC of healthy subjects.
Conclusion: Uncontrolled glycemia and ketosis down-regulate cystathionine-γ-lyase activity in T1D.
Significance: Impaired cystathionine-γ-lyase can dysregulate H2S signaling in diabetes.
Keywords: Acetoacetate, Diabetes, Glucose, Hydrogen Sulfide, Ketone Bodies
Abstract
The liver plays a major role in the formation of H2S, a novel signaling molecule. Diabetes is associated with lower blood levels of H2S. This study investigated the activities of cystathionine-γ-lyase (CSE, the enzyme that catalyzes H2S formation) in livers of type 1 diabetic (T1D) animals and in peripheral blood mononuclear cells (PBMC) isolated from T1D patients. T1D is associated with both hyperketonemia (acetoacetate and β-hydroxybutyrate) and hyperglycemia. This study also examined the role of hyperglycemia and hyperketonemia per se in decreased CSE activity using U937 monocytes and PBMC isolated from healthy subjects. Livers from streptozotocin-treated T1D rats demonstrated a significantly higher reactive oxygen species production, lower CSE protein expression and activity, and lower H2S formation compared with those of controls. Studies with T1D patients showed a decrease in CSE protein expression and activity in PBMC compared with those of age-matched normal subjects. Cell culture studies demonstrated that high glucose (25 mm) and/or acetoacetate (4 mm) increased reactive oxygen species, decreased CSE mRNA expression, protein expression, and enzymatic activity, and reduced H2S levels; however, β-hydroxybutyrate treatment had no effect. A similar effect, which was also observed in PBMC treated with high glucose alone or along with acetoacetate, was prevented by vitamin D supplementation. Studies with CSE siRNA provide evidence for a relationship between impaired CSE expression and reduced H2S levels. This study demonstrates for the first time that both hyperglycemia and hyperketonemia mediate a reduction in CSE expression and activity, which can contribute to the impaired H2S signaling associated with diabetes.
Introduction
The physiological importance of H2S is gaining acceptance with respect to its beneficial effects on various aspects of cardiovascular pathophysiology (1, 2). Cell culture studies report that H2S supplementation can decrease oxidative stress and the secretion of proinflammatory cytokines, such as MCP-1 and IL-8, and activate insulin signaling pathways using monocytes (3), endothelial cells (4), and adipocytes (5). These studies suggest that H2S potentially regulates the cellular redox balance necessary for the inhibition of oxidative stress and cytoprotection. Supplementation of animals with exogenous forms of H2S have demonstrated very robust protection of various organs after ischemia-reperfusion injury, stroke, inflammatory disorders, and models of ischemia-induced angiogenesis (6–9), atherosclerosis (10), retinopathy (11), hepatic injury (12), and renal dysfunction (13). The molecule is endogenously synthesized from l-cysteine via the action of mainly two enzymes, cystathionine-γ-lyase (CSE)2 and cystathionine-β-synthase (CBS) (6). Using chemical inhibitors, antisense approach, and specific knock-out animals, various experimental studies have demonstrated that CSE is a major participant in the maintenance of cardiovascular function (7, 14–16), whereas CBS plays an important role in the central and peripheral nervous systems (17). Mental retardation is a frequent finding in CBS deficient patients (18). Recent studies have also revealed two other H2S producing enzymes, 3-mercaptopyruvate sulfurtransferase and cysteine aminotransferase, which produce H2S in the brain as well as in the vascular endothelium (19, 20).
Various studies report lower blood levels of H2S in type 1 diabetic (T1D) animals (21–25). Results from both cell culture and animal studies suggest that lower H2S levels may play a role in the pathogenesis of diabetic complications (5, 13, 22, 26–28). Liver is the major tissue responsible for the production of H2S (29). Although Moore and co-workers (23) reported an increase in mRNA expression of both CSE and CBS in the liver tissue of STZ-induced T1D rats, Szabo and co-workers (22) did not find any significant changes in the protein expression of CSE or CBS in the liver tissue of STZ-diabetic rats. Diabetic patients also have lower blood levels of H2S (21, 30). However, no study has been performed examining the CSE expression and activity at the cellular level in diabetic patients. The underlying mechanism that causes impaired H2S homeostasis in diabetes is still not clear. This study tested the hypothesis that CSE expression is lower in the PBMC of diabetic patients and is influenced by hyperglycemia as assessed by HbA1C values. In addition to hyperglycemia, many T1D patients and some T2D patients also encounter hyperketonemia (31–33). This study also examined the molecular mechanism by which high glucose or different ketones may regulate H2S formation. The results of this study from the liver tissue of T1D rats, the PBMC of T1D patients and healthy controls, and a U937 monocyte cell culture model demonstrate that both hyperglycemia and hyperketonemia can down-regulate CSE expression and its activity and reduce H2S formation in diabetic patients.
EXPERIMENTAL PROCEDURES
Materials
Human specific anti-CSE antibody was purchased from Abcam, Inc. (Cambridge, MA). Rat specific anti-CSE antibody was purchased from Sigma. All other chemicals were purchased from Sigma unless otherwise mentioned.
Studies with Type 1 Diabetic Animals
Male Sprague-Dawley rats were purchased at 5 weeks of age (200–220 g) from Charles River (Wilmington, MA) and allowed 2 days for environmental and trainer handling acclimation. The rats were fasted overnight and then injected with STZ in citrate buffer (pH 4.5) intraperitoneally at a dose of 65 mg/kg body weight. Control rats were injected with citrate buffer alone to serve as a normal control group. The rats were tested for hyperglycemia (blood glucose >300 mg/dl) by measuring their blood glucose concentrations at 3 and 7 days after the STZ injections. The rats were maintained under standard housing conditions at 22 ± 2 °C with 12/12-h light/dark cycles and fed with a standard 8640 laboratory chow diet (Harlan, Indianapolis, IN). At the age of 14 weeks, the rats were fasted overnight and then euthanized on the next day for analysis by exposure to isoflurane (Webster Veterinary Supply Inc., Devens, MA). For the assessment of blood glucose levels, blood was obtained via tail incision and measured using an Advantage Accu-Chek glucometer (Roche Applied Science). Blood was collected via heart puncture with a 191/2-gauge needle into EDTA Vacutainer tubes. Plasma was isolated after centrifuging the blood in a 4 °C centrifuge at 3000 rpm for 15 min.
Liver tissues excised from the experimental rats were perfused with cold saline to remove leftover blood, immediately frozen using liquid nitrogen, then ground well into powders and stored at −70 °C until further use. The frozen tissue powders (∼150 mg) were homogenized for further studies following the method described earlier (34). All procedures used in the animal experiments in our study were in accordance with the ethical standards of the institution, and approval was obtained from the institutional Animal Welfare Committee.
Study Enrollment and Blood Collection from Diabetes Patients and Normal Subjects
Written informed consent was obtained from all patients and normal subjects according to the protocol approved by the Louisiana State University Health Sciences Center Institutional Review Board. All subjects included in this study were T1D patients (n = 17) or age-matched normal volunteers (n = 18). T1D patients and healthy controls were excluded from the study if they had any history of cardiovascular disease, sickle cell disease, smoking habits, uncontrolled hypertension, hypothyroidism, or hyperthyroidism. Subjects were also excluded if they showed signs of significant hepatic dysfunction, defined as any underlying chronic liver disease or liver function tests greater than 1.5 times the upper limit of normal value, or renal dysfunction, defined as a serum creatinine value greater than 1.5 mg/dl. Those who were taking any supplemental vitamins or any herbal products were excluded from this study. All patients and normal subjects who gave written informed consent were invited to return to have blood drawn after fasting overnight (8 h). After blood collection, serum tubes for chemistry profile, EDTA tubes for HbA1C, and complete blood counts were promptly delivered to the Louisiana State University Health Sciences Center clinical laboratories. Additional tubes of EDTA blood were brought to the research laboratory. About 2 ml of plasma were separated via centrifugation from blood samples at 3000 rpm for 15 min, transferred to cryovials, and stored at −80 °C for further analysis. The remainder of the blood in the samples was processed for the isolation of PBMC.
Isolation of PBMC from Human Blood
Human peripheral blood, collected in EDTA tubes, was diluted with an equal volume of PBS, mixed by pipetting, layered onto a cushion of Ficoll-Hypaque (1.077 g/ml), and centrifuged at room temperature for 30 min at 400 × g. The mononuclear cells were collected from the interface, washed with PBS, incubated with RBC lysis solution, and centrifuged at room temperature for 8 min at 240 × g. The cells were again resuspended in PBS for a final wash and then centrifuged. PBMC isolated from T1D patients and age-matched normal subjects were lysed in radioimmune precipitation assay buffer supplemented with protease and phosphatase inhibitors. Lysates were cleared by centrifugation, and total protein concentrations were determined using a BCA assay for immunoblotting studies. PBMC isolated from healthy normal individuals were resuspended in complete RPMI 1640 media and counted using a hemocytometer for further studies with high glucose and/or high ketone as described below.
Human Pro-monocytic Cell Line
The human U937 monocytic cell line was obtained from American Type Culture Collection (Manassas, VA). These cells were maintained at 37 °C in RPMI 1640 medium containing 7 mm glucose, 10% (v/v) heat-inactivated FBS, 100 units/ml penicillin, 100 μg/ml streptomycin, 12 mm sodium carbonate, 12 mm HEPES, and 2 mm glutamine in a humidified atmosphere containing 5% (v/v) CO2. For treatments, cells were washed once in plain RPMI 1640 before being suspended in fresh medium (complete) containing serum and other supplements (35).
Treatment of U937 Monocytes and PBMC with High Glucose and High Ketones
Cells were treated with high glucose (HG) and ketones (acetoacetate (AA) and β-hydroxybutyrate (BHB)). In this study cells were treated with four different concentrations (1, 2, 4, or 8 mm) of AA or BHB. Earlier studies in the literature have reported blood levels of AA up to 5 mm and BHB up to 11 mm in diabetic patients (36, 37), so the concentrations used in these experiments can be considered physiologically relevant. For the study with high glucose, cells were exposed to a glucose concentration of 25 mm. Many previous studies have reported that glucose concentrations as high as 50 mm have been found in the blood of patients with uncontrolled diabetes (37). It is true that blood glucose levels in patients are not likely to remain as high as 25 mm for 24 h. However, tissue damage in diabetic patients occurs over many years of countless hyperglycemic episodes. Thus, the glucose concentration of 25 mm used in this cell culture study does not seem unreasonable. After treatment, cell viability was determined using the Alamar Blue reduction bioassay (Alamar Biosciences, Sacramento, CA). This method is based upon Alamar Blue dye reduction by live cells. For immunoblotting studies, cells were lysed in radioimmune precipitation assay buffer (50 mm Tris pH 8, 150 mm NaCl, 1% Nonidet P-40, 0.5% deoxycholic acid, 0.1% SDS) supplemented with protease and phosphatase inhibitors (1 mm PMSF, 5 μg/ml leupeptin, 2 μg/ml aprotinin, 1 mm EDTA, 10 mm NaF, and 1 mm Na3VO4). Lysates were cleared by centrifugation, and total protein concentrations were determined using a BCA assay.
Detection of Intracellular Reactive Oxygen Species (ROS) Levels
Intracellular ROS levels were measured using the fluorescent dye, H2DCFDA (2′,7′-dichlorofluorescein diacetate) following the method described earlier (38). The change in intracellular ROS levels was plotted as mean fluorescence intensity (MFI). For the measurement of tissue ROS production, samples containing 25 μg of protein were diluted in PBS and then incubated with 5.0 μm H2DCFDA in the dark for 15 min at 37 °C. Fluorescence was measured every 15 min for 1 h at excitation and emission wavelengths of 488 and 530 nm, respectively, using a multidetection microplate reader (Synergy HT, Biotek).
Signal Silencing Studies
CSE siRNA and control siRNA were purchased from Santa Cruz Biotechnology (Santa Cruz, CA). Cells were transfected with 25, 50, or 100 nm CSE siRNA using LipofectamineTM2000 as the transfection reagent (Invitrogen) following the method described earlier (3). After incubation the supernatants were collected for the H2S assay, and the cell lysates were used for the immunoblotting study and the measurement of CSE activity.
Analysis of CSE mRNA Expression by Quantitative PCR
Total RNA was extracted from cells using TRIzol reagent (Invitrogen) following the manufacturer's instructions. The quality and the quantity of the extracted RNA were determined on a NanoDrop spectrophotometer (Thermo Scientific). First-strand complementary DNA (cDNA) synthesis was performed using a commercially available High Capacity RNA-To-cDNA kit (Invitrogen) in a final reaction volume of 20 μl. Quantification of mRNA was performed on a 96-well 7900HT Real Time PCR system (Applied Biosystems). PCR conditions were 2 min at 50 °C, 10 min at 95 °C, then 40 cycles of 95 °C for 15 s and 60 °C for 60 s. Taqman-FAM-labeled primer/probe for CSE (# Hs00542284_m1) was used in a final reaction volume of 20 μl. GAPDH (#Hs03929097_g1) was used as a housekeeping gene to normalize threshold cycle (CT) values. To exclude nonspecific amplification and/or the formation of primer dimers, control reactions were performed in the absence of target cDNA. All of the experiments were run in triplicate. The relative amounts of mRNAs were calculated using the relative quantification (ΔΔCT) method.
Determination of CSE Activity
Intracellular CSE activity was determined following the method described earlier (39) using an enzyme-coupled assay with lactate dehydrogenase. Using pyridoxal phosphate as a coenzyme, CSE first catalyzes the α,γ-elimination of cystathionine to give cysteine, which is then converted into pyruvate, ammonia, and H2S by the action of the same enzyme (CSE). Exogenous addition of dehydrogenase then catalyzes the conversion of pyruvate into lactate with concomitant formation of NAD+ from NADH. The oxidation rate of NADH was monitored at 340 nm for 15 min at 37 °C as an index of CSE activity. After treatment, cells or liver tissues were homogenized in 50 mm potassium phosphate buffer (pH 6.9) containing 1 mm EDTA and 1:100 (v/v) protease inhibitor mixture (Calbiochem) followed by centrifugation at 15,000 × g for 30 min at 4 °C. The resulting supernatant was used for CSE activity. The reaction mixture (100 μl) contained 100 mm potassium phosphate buffer (pH 7.4), 4.0 mm l-cystathionine, 0.125 mm pyridoxal-5′-phosphate, 0.32 mm NADH, 1.5 units lactate dehydrogenase, and a 10-μl sample. The decrease in optical density at an absorbance of 340 nm was kinetically monitored with a microplate reader (Spectramax-5; Molecular Devices, Sunnyvale, CA) at 37 °C for 30 min. Blank reactions were performed in the same way except that l-cystathionine was omitted. Maximum velocities were calculated from the linear portion of the graphs, and the results were expressed as nmol·min−1mg of protein−1.
Measurement of H2S Formation
In the human body, sulfur exists in different forms, ranging from a fully reduced divalent state (sulfide) to a fully oxidized hexavalent state (sulfate) (40). The amount of sulfur in a biological sample is estimated by measuring the sulfide concentration, i.e. the reduced divalent state, because it is difficult to accurately measure the concentrations of the other states. However, the reduced divalent form of sulfur is very reactive within biological matrices, resulting in sulfide equivalents being present in various volatile sulfur pools, which includes both free hydrogen sulfide and the bound acid-labile sulfides as well as a sulfane sulfur pool (41). The acid-labile sulfide consists of sulfur present in the iron-sulfur clusters contained in a variety of proteins and enzymes, including rubredoxins, ferredoxins, aconitase, and succinate dehydrogenase (41, 42). The sulfane sulfur, divalent sulfur atoms bound only to other sulfur, includes thiosulfate, persulfides, thiosulfonates, polysulfides, polythionates, and elemental sulfur (43). In this study the H2S levels were measured in the cell culture medium and in liver tissue homogenates using the formation of Methylene Blue. This method is widely used for the measurement of H2S levels (44–48). The acidic conditions associated with the Methylene Blue method determine the amounts of both acid-labile sulfur species and free sulfide. Thus this method monitors not only free H2S but also the liberation of H2S from other forms of sulfide (acid-labile sulfides, i.e. iron-sulfur clusters containing proteins, including rubredoxins, ferredoxins, aconitase, and succinate dehydrogenase). Briefly, 100-μl samples were mixed with 400 μl of potassium phosphate buffer (pH 7.4), and 1% (w/v) zinc acetate (250 μl). The reaction mixture was incubated at 37 °C for 2.5 h. The protein in the plasma was removed by adding 10% trichloroacetic acid (250 μl) to the reaction mixture, which was pelleted by centrifugation. The supernatant was then mixed with 100 μl of N-dimethyl-p-phenylenediamine sulfate (20 mm in 7.2 m HCl) and 100 μl of FeCl3 (30 mm in 1.2 m HCl) in the test tube. The mixture was incubated at room temperature for 15 min. The absorbance of the resulting solution was measured at 670 nm in a 96-well plate with a microplate reader. The concentration of H2S formation was calculated using a calibration curve based on that of standard NaHS (Alfa Aesar, Ward Hill, MA).
AA and BHB Determinations
Levels of AA were determined using the method of Artuch et al. (49) and those of BHB using the method of Koch and Feldbruegge (50).
Immunoblotting
CSE protein expression was investigated using immunoblotting studies with the appropriate anti-CSE antibody following the procedure described earlier (39) and developed using either ECL substrate (Millipore, MA) or Opti-4CN colorimetric substrate (Bio-Rad). The intensity of each immunoblotting band was measured using the histogram tool of Adobe Photoshop CS5.
Statistical Analysis
Data were analyzed statistically using one way analysis of variance with Sigma Stat statistical software (Jandel Scientific, San Rafael, CA). When data passed a normality test, all groups were compared using the Student-Newman-Keuls method. Values are expressed as the mean ± S.E. A difference was considered significant at the p < 0.05 level.
RESULTS
Studies with Type 1 Diabetic Animals
Fig. 1 shows the protein expression as well as the enzymatic activity of CSE, the levels of H2S formation, and ROS production in the liver tissues of normal and T1D rats. Results demonstrate that livers from STZ-treated T1D rats have lower levels of CSE protein expression (Fig. 1A), CSE activity (Fig. 1B), reduced tissue H2S formation (Fig. 1C), and increased ROS production (Fig. 1D) compared with those of controls. We observed that in the T1D group the concentrations of AA and BHB were around 4.5 ± 0.74 and 3.3 ± 0.74 mm, whereas the concentrations in controls were 0.31 ± 0.14 and 0.51 ± 0.19 mm on average, respectively. The blood glucose levels in T1D and controls were around 24.82 ± 1.36 and 7.94 ± 0.36 mm on average, respectively.
FIGURE 1.

Enzymatic activity and protein expression of CSE, the levels of H2S formation, and ROS production in the liver tissue of experimental rats; control (Cont), 14-week-old Sprague-Dawley rats), T1D (STZ-treated 14-week-old Sprague-Dawley rats). A, CSE expression; B, CSE activity; C, tissue H2S levels; D, ROS production. Values are expressed as the mean ± S.E. (n = 6). Blots represent data from three rats in each group.
Studies with PBMC Isolated from Type 1 Diabetic Patients and Age-matched Normal Subjects
Fasting glucose levels (173 ± 19 versus 77 ± 2.16 mg%, p < 0.001) were higher in T1D (n = 17) compared with those in healthy subjects (n = 18). There was no difference in the body weights (128 ± 12 versus 121 ± 6 lb), ages (14 ± 0.81 versus 14 ± 0.89 years), or male/female distribution (10/7 versus 12/6) between T1D and healthy subjects. Fig. 2 shows the CSE activity and protein expression as well as its relation to HbA1C in PBMC isolated from T1D patients and age-matched normal subjects. Results demonstrate a decrease in CSE protein expression (Fig. 2A) and enzyme activity (Fig. 2B) in T1D patients compared with that seen in age-matched normal subjects. Interestingly, a significant negative correlation (r = −0.902, p = 0.001) was observed between CSE protein expression and HbA1C levels (Fig. 3) among the T1D patients. In our earlier studies we observed that, in addition to hyperglycemia, T1D patients also have higher plasma ketone (AA and BHB) levels compared with those seen in age-matched controls (35).
FIGURE 2.
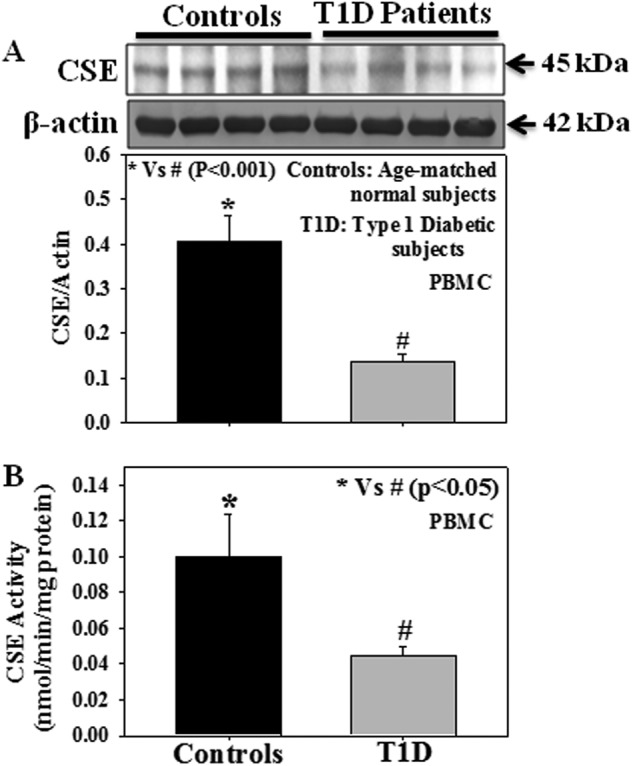
Effect of T1D on the CSE protein expression and its activity in PBMC isolated from T1D patients and age-matched normal subjects. A, CSE expression (controls, n = 18; T1D patients, n = 17). B, CSE activity (controls, n = 10; T1D patients, n = 10). Due to the limited sample size, n values differ between CSE expression and CSE activity studies. Values are expressed as the mean ± S.E.
FIGURE 3.
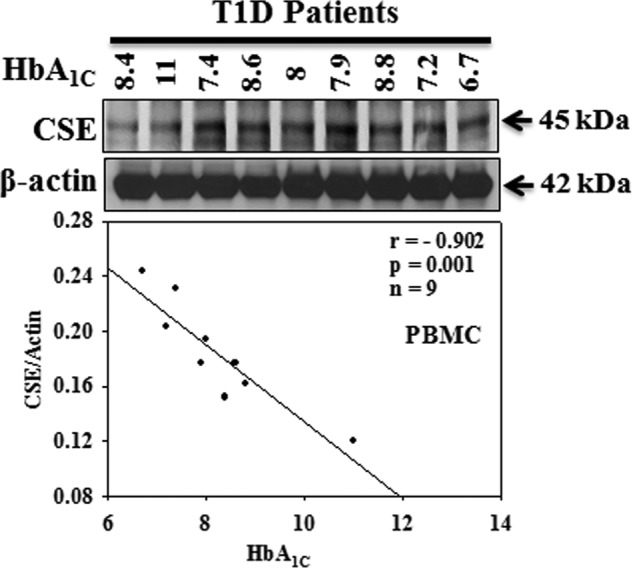
Correlation of CSE protein expression with HbA1C in PBMC isolated from T1D patients. Due to the inconsistent exposure from one blot to another, we included the data from only one blot for the calculation of CSE expression and its relation to HbA1C levels in T1D patients (n value mentioned in the figure).
Role of Hyperketonemia and Hyperglycemia in Impaired CSE Activity
Fig. 4 shows the effect of ketones (AA and BHB) and HG on CSE protein expression as well as on its enzyme activity, H2S levels, and intracellular ROS production in human U937 monocytic cells. Cells were separately treated with different concentrations of AA (1, 2, 4, or 8 mm), BHB (1, 2, 4, or 8 mm), and HG (25 mm) for 20 h, after which CSE protein expression and its activity, H2S levels, and production of intracellular ROS levels were measured. Results showed that treatment with AA (4 or 8 mm) and HG (25 mm) caused a significant decrease in CSE protein expression (Fig. 4A), CSE activity (Fig. 4B), and H2S levels (Fig. 4C) and an increase in intracellular ROS production (Fig. 4D) compared with those in normal controls. However, under the same conditions treatment with BHB did not show any significant effect.
FIGURE 4.

Effect of AA, BHB, and HG on both CSE protein expression and its activity, H2S levels, and the intracellular ROS production in U937 monocytic cells. A, CSE expression. B, CSE activity; C, H2S levels; D, ROS production. Cells were treated with AA (1, 2, 4, or 8 mm) or BHB (1, 2, 4, or 8 mm) or HG (25 mm) for 20 h. Values are expressed as the mean ± S.E. (n = 3).
Fig. 5 shows the effect of AA and HG either alone or in combination on CSE protein expression and its activity, H2S levels, and intracellular ROS production in U937 monocytes. Results suggest that both AA and HG treatment, either individually or in combination, reduced CSE protein expression (Fig. 5A), CSE activity (Fig. 5B), and H2S levels (Fig. 5C) or increased ROS production (Fig. 5D). However, AA and HG treatment in combination caused a significant decrease in CSE protein expression compared with treatment with AA or HG alone.
FIGURE 5.

Effect of AA and HG either alone or in combination on the protein expression and enzyme activity of CSE, H2S levels, and the intracellular ROS production in U937 monocytic cells. A, CSE expression. B, CSE activity. C, H2S levels. D, ROS production. Cells were treated with AA (4 mm) or HG (25 mm) either alone or in combination for 20 h. Values are expressed as the mean ± S.E. (n = 3).
Type 1 diabetes is associated with both hyperglycemia and hyperketonemia. Fig. 6 demonstrates the effect of AA (4 mm), BHB (8 mm), and HG (25 mm) either alone or in combination on CSE mRNA expression, protein expression, and its activity in U937 monocytes. Results suggest that both AA and HG treatment either alone or in combination reduced CSE mRNA expression (Fig. 6B), protein expression (Fig. 6A), and enzyme activity (Fig. 6C). Although treatment with BHB alone caused a decrease in CSE mRNA expression (Fig. 6B) compared with that of control cells, there was no change in CSE protein expression or its activity. Treatment with AA, BHB, and HG altogether also reduced CSE mRNA expression (Fig. 6B), protein expression (Fig. 6A), and enzyme activity (Fig. 6C) compared with those seen in control or BHB-treated cells. No significant difference has been observed between the AA + HG- and AA + BHB + HG-treated groups. Using mannitol as an osmolarity control, our previous study demonstrated that any potential osmotic effect of high glucose does not mediate the observed changes (3). None of the treatments caused any change in monocytic cell viability (Fig. 6D). These results suggest that in addition to hyperglycemia, hyperketonemia also caused a reduction in CSE expression in diabetes. Physiologically, individual ketone body concentration varies in diabetic conditions. In blood, the concentration of BHB is 2–3 times higher than that of AA (33). This study did not observe any significant difference between the effect of AA on CSE mRNA expression, CSE protein expression, or CSE activity in the presence or absence of BHB.
FIGURE 6.

Effect of AA, BHB, and HG either alone or in combination on the mRNA expression, protein expression, and enzyme activity of CSE in U937 monocytic cells. A, CSE protein expression. B, CSE mRNA expression; C, CSE activity. D, cell viability. Cells were treated with AA (4 mm), BHB (8 mm), or HG (25 mm) either alone or in combination for 20 h. Values are expressed as the mean ± S.E. (n = 3).
Role of CSE on the H2S Production
Fig. 7 demonstrates a link between the CSE expression or activity and H2S levels in U937 monocytes. Cells were transfected with control siRNA or different concentrations of CSE siRNA (25, 50, or 100 nm), and CSE protein expression, CSE activity, and H2S levels were measured in the transfected cells. Results showed that a dose-dependent decrease in CSE protein expression (Fig. 7A) and CSE activity (Fig. 7B) is also related to a dose-dependent decrease in H2S levels (Fig. 7C). This study for the first time provides direct evidence for a relationship between impaired CSE expression and reduced H2S levels (r = 0.981, p < 0.05).
FIGURE 7.
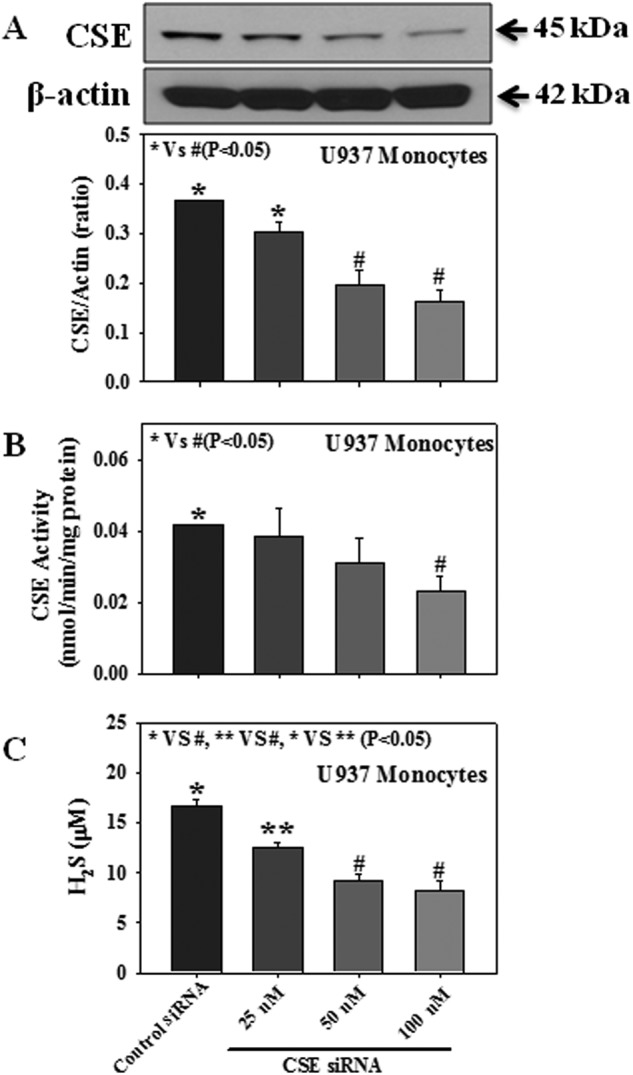
Effect of CSE protein expression, CSE activity, and H2S levels in either CSE siRNA-transfected or control siRNA-transfected U937 monocytes. A, CSE protein expression. B, CSE activity. C, H2S formation. Cells were transfected with either CSE siRNA (25, 50, or 100 nm) or control siRNA, a scrambled nonspecific RNA duplex with no sequence homology with any of the genes. Values are the mean ± S.E. (n = 3).
Role of Oxidative Stress in Impaired CSE Expression
Oxidative stress plays a central role in diabetic pathophysiology. Fig. 8 shows the direct effect of an exogenous reactive oxidant (H2O2) on cellular CSE expression (Fig. 8A), H2S formation (Fig. 8B), and ROS production (Fig. 8C). Monocytes were treated with different concentrations of H2O2 (25 or 50 μm) for 3 h. It was observed that treatment with an exogenous reactive oxidant, H2O2, caused a decrease in CSE protein expression and H2S formation and an increase in intracellular ROS production. None of the treatments with H2O2 caused any change in monocytic cell viability (Fig. 8D).
FIGURE 8.

Effect of the exogenous oxidant H2O2 on the protein expression of CSE, levels of H2S, and the intracellular ROS production in U937 monocytic cells. A, CSE expression. B, H2S levels. C, ROS production. D, cell viability. Cells were treated with H2O2 (25 or 50 μm) for 3 h. Values are expressed as the mean ± S.E. (n = 3).
Role of Hyperglycemia and Hyperketonemia on CSE Expression in Human PBMC
Fig. 9 demonstrates the effect of high glucose alone or in combination with high ketone on CSE protein expression and its activity in PBMC isolated from healthy normal individuals. Results suggest that treatment with HG alone or in combination with AA decreased CSE protein expression (Fig. 9, A and D) as well as its activity (Fig. 9, B and E) and H2S levels (Fig. 9, C and F) in PBMC. Different treatments did not cause any change in cell viability (data not provided here). Type 1 diabetes is associated with hyperketonemia in addition to hyperglycemia. These results suggest for the first time that both hyperketonemia and hyperglycemia play a role in the impaired H2S levels seen in diabetes and mediated via the decrease in CSE activity.
FIGURE 9.

Effect of 1,25-dihydroxyvitamin D3 (1,25(OH)2D3) on the CSE protein expression and its activity and H2S levels in PBMC (isolated from normal healthy volunteers) treated with AA and HG either alone or in combination. A and D, CSE expression. B and E, CSE activity. C and F, H2S levels. Cells were treated with 1,25-dihydroxyvitamin D3 (25 nm, 2 h) followed by incubation with HG (25 mm) alone or in combination with AA (4 mm) for next 16 h. Values are expressed as the mean ± S.E. (n = 4).
Earlier studies suggest that higher concentrations of circulating vitamin D are associated with a decrease in cardiovascular disease, type 2 diabetes, and metabolic syndrome (51). Diabetics have lower plasma vitamin D levels (52, 53). Vitamin D supplementation decreases blood glucose levels and HbA1C in both type 2 and type 1 diabetic patients (53, 54). Vitamin D supplementation has been found to up-regulate the H2S tissue concentration in mouse brain, heart, and kidney tissues (55). Fig. 9 demonstrates that exogenous supplementation with 1,25-dihydroxyvitamin D3, an active form of vitamin D, up-regulates both CSE protein expression and its activity as well as H2S levels in PBMC treated with either HG alone or in combination with AA, suggesting a positive effect of vitamin D on H2S homeostasis in diabetes.
DISCUSSION
H2S is gaining acceptance as an important signaling molecule. It has been reported that diabetic patients and animals have lower blood levels of H2S (21–25, 30). There are conflicting reports in the literature regarding the protein expression of the H2S producing enzyme, CSE, in high glucose-treated cell culture studies. Using murine MIN6 β-cells and isolated pancreatic islets, Kaneko et al. reported that high glucose stimulation causes an increase in CSE protein expression (56, 57). In contrast, high glucose stimulation has been reported to decrease CSE protein expression in rodent INS-1E β-cells (58). Xue et al. (59) reported that siRNA-mediated knockdown of CSE decreased the glucose uptake in 3T3L1 adipocyte and L6 myotube cells supplemented with NaHS (exogenous source of H2S). Our previous studies have also shown that high glucose stimulation decreased the CSE protein expression in both U937 monocytes (3) and 3T3L1 adipocytes (39); in addition, siRNA-mediated CSE knockdown also decreased the glucose utilization compared with that seen in controls (3). The difference in CSE expression among different cell culture models may be due to the different responses of individual systems.
Several in vivo studies also reported different protein expression values for CSE or CBS in various tissues from STZ-treated T1D rats. Studies from Wang and co-workers (47) reported an increase in pancreatic H2S production in STZ-diabetic rats; however, there was no significant change in CSE protein expression compared with that seen in controls. In addition, although supplementation with a pharmacological inhibitor of CSE, dl-propargylglycine, reduced pancreatic H2S production, the effect on CSE protein expression remained unaltered compared with that seen in controls (47). Studies from Szabo and co-workers (22) also did not find any significant changes in the protein expression of CSE or CBS in the brain, heart, kidney, lung, liver, or thoracic aorta of STZ-diabetic rats. Studies with CSE knock-out mice subjected to STZ administration showed a delayed onset of diabetic status (47). Moore and co-workers (23) reported an increase in mRNA expression for both CSE and CBS in livers and CBS mRNA in pancreatic tissue in STZ-induced T1D rats. On the other hand, Yamamoto et al. (60) reported a decrease in CSE protein expression in the kidney tissue from animals in a transgenic diabetic animal model (calmodulin overexpressing) compared with those of controls. Yuan et al. (24) also observed a decrease in both CSE protein expression and CSE mRNA expression in the renal cortex of STZ-diabetic rats. The difference in CSE expression seen among different organisms may be due to the different responses of each organ.
H2S is endogenously synthesized from l-cysteine mainly via the action of the enzymes CSE, CBS, and 3-MST (6). Several experimental studies have demonstrated that CSE is a major participant in the maintenance of cardiovascular function (7, 14–16). Liver is the central regulator of endogenous H2S production (29). Recent studies demonstrated that in liver the abundance of CSE is 60-fold higher than that of CBS, and their results showed that although CSE accounts for 97–99% of the hepatic H2S output, CBS accounts for only 3% of hepatic H2S generation capacity (61). Therefore, this study investigated the protein expression as well as the activity of CSE in the liver tissue of control and T1D rats. Our study demonstrates lower protein expression and enzyme activity of CSE along with reduced tissue H2S formation in the livers of STZ-treated TID rats compared with those of control rats. In this study we used a small portion of the whole liver tissue, similar to what was done in earlier studies in the literature (22, 23). It has been reported that ∼70–80% of hepatic cells are parenchymal hepatocytes, whereas the others are non-parenchymal cells (62). Kupffer cells represent ∼35% of the non-parenchymal cells in liver, and although they are distributed throughout the entire liver, there are differences in the population density (63). There is no study in the literature investigating the role played by isolated hepatocytes or Kupffer cells in the impaired H2S homeostasis observed in T1D. Kupffer cells are involved in the metabolism of various compounds, immunological responses, and inflammatory reactions (64). Kupffer cells constitute 80–90% of the tissue macrophages present in the body, which suggests a central role for the liver in the regulation of systemic as well as regional defense action (63). Kupffer cells appear to be derived from the circulating monocytes (63). T1D is an inflammatory autoimmune disease. No previous study has been done in human beings to investigate CSE protein expression and its activity in T1D. Thus our next aim was to investigate the status of the CSE protein expression and its activity in the PBMC isolated from normal and T1D patients. PBMC consist of a large population of blood immune cells, ∼30% of which is monocytic cells (65, 66). Both CSE protein expression and activity were significantly lower in PBMC isolated from T1D patients compared with those of age-matched normal subjects. Interestingly, a significant negative correlation was seen between the CSE protein expression and HbA1C levels (r = −0.814, p = 0.001) among the T1D patient population. These results suggest that a significant decrease in CSE protein expression is associated with the glycemia observed in T1D.
Type 1 diabetes is associated with both hyperglycemia and hyperketonemia. To dissect the molecular mechanism underlying the effect of hyperglycemia and hyperketonemia on the impaired H2S homeostasis in T1D we used a U937 monocytic cell culture model. There are three main ketone bodies produced when glucose is not readily available: AA and BHB, which are the most abundant, and acetone, which is the least abundant (33). In severe cases, levels of circulating ketone bodies can reach up to 25 mm compared with normal levels of less than 0.5 mm (33, 67). It is known that diabetic subjects with frequent episodes of hyperketonemia experience an increased incidence of vascular disease, morbidity, and mortality (37, 68–70). Several earlier lines of investigation have indicated a role for impaired H2S homeostasis in the development of cardiovascular pathophysiology (1, 2). Using a human U937 monocytic cell culture model and PBMC isolated from healthy individuals, this study demonstrates the effect of hyperketonemia and hyperglycemia on cellular CSE activity, H2S formation, and production of intracellular reactive intermediates. It is well established that oxidative stress plays an important role in the pathogenesis of both type 1 and type 2 diabetic episodes (71). Results demonstrate that both HG and AA exposure caused a significant decrease in CSE mRNA expression, CSE protein expression, CSE enzymatic activity, and H2S formation and an increase in intracellular ROS production. Treatment with BHB alone caused a decrease in CSE mRNA expression, but there was no change in CSE protein expression or its activity. Treatment with AA, BHB, and HG in combination also caused a decrease in CSE mRNA expression, CSE protein expression, and CSE activity compared with those seen in control or BHB-treated cells. Signal silencing studies demonstrate that depletion of CSE by RNA interference caused a decrease in CSE protein expression, CSE activity, and H2S levels; a significant relationship (r = 0.981, p < 0.05) has also been observed between reduced CSE protein expression and lowered H2S formation. Interestingly, treatment with an exogenous reactive oxygen substrate, H2O2, also caused a significant decrease in CSE protein expression and an increase in ROS production. Earlier studies in our laboratory demonstrated that the ketone body AA, but not BHB, can generate superoxide radicals (72–75). Many other investigators have also shown that AA, but not BHB, increases fatty acid peroxidation (76), down-regulates the insulin receptor phosphorylation (77), and activates ERK1/2 and MAPK signaling mediated by oxidative stress (78). This study suggests that increased ROS formation may mediate the effect of AA on impaired CSE activity and H2S levels in contrast to that of BHB. In further studies with PBMC isolated from healthy individuals, we also observed a significant decrease in CSE protein expression and its activity as well as lower H2S levels in HG or HG + AA-treated PBMC. Results from these in vitro studies reveal that both hyperketonemia and hyperglycemia can contribute to the decrease in CSE activity mediated by oxidative stress.
Diabetes is associated with a higher incidence of cardiovascular disease (79). Recent studies report a role for elevated homocysteine levels in the development of cardiovascular diseases in diabetic patients (80). Diabetic patients with a higher incidence of renal dysfunction exhibit elevated plasma homocysteine levels (81, 82). On the other hand, type 1 diabetic patients with normal renal function exhibit lower homocysteine levels (83). These studies suggest that homocysteine levels in diabetic patients appear to depend on the presence or absence of renal dysfunction. In further studies with STZ-treated T1D rats, Jacobs et al. (84) suggested that the hepatic trans-sulfuration pathway plays a major role in the regulation of plasma homocysteine levels. Elevated homocysteine levels can impair H2S homeostasis via inhibition of the activities of the H2S-producing enzymes (85, 86). In our study the effects of hyperglycemia and hyperketonemia on the reduced activities of CSE may be mediated through the increase in homocysteine kinetics.
Several experimental approaches that either increase endogenous levels of H2S or add exogenous H2S have demonstrated its beneficial effects on various aspects of diabetic complications (5, 13, 22, 26–28). Diabetics have lower plasma vitamin D levels (53, 87), and supplementation with exogenous vitamin D has been found to be beneficial in regulating body glucose homeostasis (54). Vitamin D supplementation has been found to up-regulate the tissue concentration of H2S (55). This study provided evidence that vitamin D supplementation up-regulates both CSE protein expression as well as its activity in either HG- or HG + AA-treated PBMC isolated from healthy individuals, which may up-regulate the tissue concentration of H2S as reported previously in studies of vitamin D-supplemented mice (55).
Using the liver tissue from STZ-treated T1D rats, PBMC isolated from T1D patients as well as age-matched controls, and a U937 monocytic cell culture model, this study demonstrates that both hyperglycemia and hyperketonemia cause a decrease in both CSE protein expression and CSE activity, which can lead to impaired H2S homeostasis in T1D mediated by increased ROS formation. Cell culture studies show that supplementation with vitamin D, a ROS scavenger (52, 88), causes an increase in CSE protein expression as well as its activity and H2S levels in HG or HG + AA-treated PBMC isolated from healthy individuals. Whether up-regulation of CSE exerts a beneficial effect on biomarkers of vascular inflammation needs to be investigated in diabetic patients.
Acknowledgment
We thank Georgia Morgan for excellent editing of this manuscript.
This work was supported, in whole or in part, by a National Institutes of Health grant (NIDDK) and Office of Dietary Supplements of the National Institutes of Health Grant RO1 DK072433. This work was also supported by the Malcolm Feist Endowed Chair in Diabetes and by a fellowship from the Malcolm Feist Cardiovascular Research Endowment, LSU Health Sciences Center, Shreveport.
- CSE
- cystathionine-γ-lyase
- CBS
- cystathionine-β-synthase
- T1D
- type 1 diabetic
- ROS
- reactive oxygen species
- HG
- high glucose
- AA
- acetoacetate
- BHB
- β-hydroxybutyrate
- H2DCFDA
- 2′,7′-dichlorofluorescein diacetate
- MFI
- mean fluorescence intensity
- PBMC
- peripheral blood mononuclear cells
- STZ
- streptozotocin.
REFERENCES
- 1. Elsey D. J., Fowkes R. C., Baxter G. F. (2010) Regulation of cardiovascular cell function by hydrogen sulfide (H2S). Cell Biochem. Funct. 28, 95–106 [DOI] [PubMed] [Google Scholar]
- 2. Liu Y. H., Lu M., Hu L. F., Wong P. T., Webb G. D., Bian J. S. (2012) Hydrogen sulfide in the mammalian cardiovascular system. Antioxid. Redox Signal.. 17, 141–185 [DOI] [PubMed] [Google Scholar]
- 3. Manna P., Jain S. K. (2013) l-Cysteine and hydrogen sulfide increase PIP3 and AMPK/PPARγ expression and decrease ROS and vascular inflammation markers in high glucose-treated human U937 monocytes. J. Cell Biochem. 114, 2334–2345 [DOI] [PubMed] [Google Scholar]
- 4. Pan L. L., Liu X. H., Gong Q. H., Wu D., Zhu Y. Z. (2011) Hydrogen sulfide attenuated tumor necrosis factor-α-induced inflammatory signaling and dysfunction in vascular endothelial cells. PLoS ONE 6, e19766. [DOI] [PMC free article] [PubMed] [Google Scholar] [Retracted]
- 5. Manna P., Jain S. K. (2011) Hydrogen sulfide and l-cysteine increase phosphatidylinositol 3,4,5-trisphosphate (PIP3) and glucose utilization by inhibiting phosphatase and tensin homolog (PTEN) protein and activating phosphoinositide 3-kinase (PI3K)/serine/threonine protein kinase (AKT)/protein kinase Cζ/λ (PKCζ/λ) in 3T3l1 adipocytes. J. Biol. Chem. 286, 39848–39859 [DOI] [PMC free article] [PubMed] [Google Scholar]
- 6. Szabó C. (2007) Hydrogen sulphide and its therapeutic potential. Nat. Rev. Drug Discov. 6, 917–935 [DOI] [PubMed] [Google Scholar]
- 7. Yang G., Wu L., Jiang B., Yang W., Qi J., Cao K., Meng Q., Mustafa A. K., Mu W., Zhang S., Snyder S. H., Wang R. (2008) H2S as a physiologic vasorelaxant. Hypertension in mice with deletion of cystathionine-γ-lyase. Science 322, 587–590 [DOI] [PMC free article] [PubMed] [Google Scholar]
- 8. Nicholson C. K., Calvert J. W. (2010) Hydrogen sulfide and ischemia-reperfusion injury. Pharmacol. Res. 62, 289–297 [DOI] [PMC free article] [PubMed] [Google Scholar]
- 9. Lefer D. J. (2007) A new gaseous signaling molecule emerges. Cardioprotective role of hydrogen sulfide. Proc. Natl. Acad. Sci. U.S.A. 104, 17907–17908 [DOI] [PMC free article] [PubMed] [Google Scholar]
- 10. Wang Y., Zhao X., Jin H., Wei H., Li W., Bu D., Tang X., Ren Y., Tang C., Du J. (2009) Role of hydrogen sulfide in the development of atherosclerotic lesions in apolipoprotein E knockout mice. Arterioscler. Thromb. Vasc. Biol. 29, 173–179 [DOI] [PubMed] [Google Scholar]
- 11. Biermann J., Lagrèze W. A., Schallner N., Schwer C. I., Goebel U. (2011) Inhalative preconditioning with hydrogen sulfide attenuated apoptosis after retinal ischemia/reperfusion injury. Mol. Vis. 17, 1275–1286 [PMC free article] [PubMed] [Google Scholar]
- 12. Zhang Q., Fu H., Zhang H., Xu F., Zou Z., Liu M., Wang Q., Miao M., Shi X. (2013) Hydrogen sulfide preconditioning protects rat liver against ischemia/reperfusion injury by activating Akt-GSK-3β signaling and inhibiting mitochondrial permeability transition. PLoS ONE 8, e74422. [DOI] [PMC free article] [PubMed] [Google Scholar]
- 13. Lee H. J., Mariappan M. M., Feliers D., Cavaglieri R. C., Sataranatarajan K., Abboud H. E., Choudhury G. G., Kasinath B. S. (2012) Hydrogen sulfide inhibits high glucose-induced matrix protein synthesis by activating AMP-activated protein kinase in renal epithelial cells. J. Biol. Chem. 287, 4451–4461 [DOI] [PMC free article] [PubMed] [Google Scholar]
- 14. Pan L. L., Liu X. H., Gong Q. H., Yang H. B., Zhu Y. Z. (2012) Role of cystathionine-γ-lyase/hydrogen sulfide pathway in cardiovascular disease. A novel therapeutic strategy? Antioxid. Redox Signal. 17, 106–118 [DOI] [PMC free article] [PubMed] [Google Scholar]
- 15. Yan H., Du J., Tang C. (2004) The possible role of hydrogen sulfide on the pathogenesis of spontaneous hypertension in rats. Biochem. Biophys. Res. Commun. 313, 22–27 [DOI] [PubMed] [Google Scholar]
- 16. Yanfei W., Lin S., Junbao D., Chaoshu T. (2006) Impact of L-arginine on hydrogen sulfide/cystathionine-γ-lyase pathway in rats with high blood flow-induced pulmonary hypertension. Biochem. Biophys. Res. Commun. 345, 851–857 [DOI] [PubMed] [Google Scholar]
- 17. Qu K., Lee S. W., Bian J. S., Low C. M., Wong P. T. (2008) Hydrogen sulfide. Neurochemistry and neurobiology. Neurochem. Int. 52, 155–165 [DOI] [PubMed] [Google Scholar]
- 18. Mudd S. H., Skovby F., Levy H. L., Pettigrew K. D., Wilcken B., Pyeritz R. E., Andria G., Boers G. H., Bromberg I. L., Cerone R. (1985) The natural history of homocystinuria due to cystathionine β-synthase deficiency. Am. J. Hum. Genet. 37, 1–31 [PMC free article] [PubMed] [Google Scholar]
- 19. Shibuya N., Tanaka M., Yoshida M., Ogasawara Y., Togawa T., Ishii K., Kimura H. (2009) 3-Mercaptopyruvate sulfurtransferase produces hydrogen sulfide and bound sulfane sulfur in the brain. Antioxid. Redox Signal. 11, 703–714 [DOI] [PubMed] [Google Scholar]
- 20. Shibuya N., Mikami Y., Kimura Y., Nagahara N., Kimura H. (2009) Vascular endothelium expresses 3-mercaptopyruvate sulfurtransferase and produces hydrogen sulfide. J. Biochem. 146, 623–626 [DOI] [PubMed] [Google Scholar]
- 21. Jain S. K., Bull R., Rains J. L., Bass P. F., Levine S. N., Reddy S., McVie R., Bocchini J. A. (2010) Low levels of hydrogen sulfide in the blood of diabetes patients and streptozotocin-treated rats causes vascular inflammation? Antioxid. Redox Signal. 12, 1333–1337 [DOI] [PMC free article] [PubMed] [Google Scholar]
- 22. Suzuki K., Olah G., Modis K., Coletta C., Kulp G., Gerö D., Szoleczky P., Chang T., Zhou Z., Wu L., Wang R., Papapetropoulos A., Szabo C. (2011) Hydrogen sulfide replacement therapy protects the vascular endothelium in hyperglycemia by preserving mitochondrial function. Proc. Natl. Acad. Sci. U.S.A. 108, 13829–13834 [DOI] [PMC free article] [PubMed] [Google Scholar]
- 23. Yusuf M., Kwong Huat B. T., Hsu A., Whiteman M., Bhatia M., Moore P. K. (2005) Streptozotocin-induced diabetes in the rat is associated with enhanced tissue hydrogen sulfide biosynthesis. Biochem. Biophys. Res. Commun. 333, 1146–1152 [DOI] [PubMed] [Google Scholar]
- 24. Yuan P., Xue H., Zhou L., Qu L., Li C., Wang Z., Ni J., Yu C., Yao T., Huang Y., Wang R., Lu L. (2011) Rescue of mesangial cells from high glucose-induced over-proliferation and extracellular matrix secretion by hydrogen sulfide. Nephrol. Dial. Transplant. 26, 2119–2126 [DOI] [PubMed] [Google Scholar]
- 25. Brancaleone V., Roviezzo F., Vellecco V., De Gruttola L., Bucci M., Cirino G. (2008) Biosynthesis of H2S is impaired in non-obese diabetic (NOD) mice. Br. J. Pharmacol. 155, 673–680 [DOI] [PMC free article] [PubMed] [Google Scholar]
- 26. Szabo C. (2012) Roles of hydrogen sulfide in the pathogenesis of diabetes mellitus and its complications. Antioxid. Redox Signal. 17, 68–80 [DOI] [PMC free article] [PubMed] [Google Scholar]
- 27. Taniguchi S., Kang L., Kimura T., Niki I. (2011) Hydrogen sulphide protects mouse pancreatic β-cells from cell death induced by oxidative stress, but not by endoplasmic reticulum stress. Br. J. Pharmacol. 162, 1171–1178 [DOI] [PMC free article] [PubMed] [Google Scholar]
- 28. El-Seweidy M. M., Sadik N. A., Shaker O. G. (2011) Role of sulfurous mineral water and sodium hydrosulfide as potent inhibitors of fibrosis in the heart of diabetic rats. Arch. Biochem. Biophys. 506, 48–57 [DOI] [PubMed] [Google Scholar]
- 29. Norris E. J., Culberson C. R., Narasimhan S., Clemens M. G. (2011) The liver as a central regulator of hydrogen sulfide. Shock 36, 242–250 [DOI] [PMC free article] [PubMed] [Google Scholar]
- 30. Whiteman M., Gooding K. M., Whatmore J. L., Ball C. I., Mawson D., Skinner K., Tooke J. E., Shore A. C. (2010) Adiposity is a major determinant of plasma levels of the novel vasodilator hydrogen sulphide. Diabetologia 53, 1722–1726 [DOI] [PubMed] [Google Scholar]
- 31. Newton C. A., Raskin P. (2004) Diabetic ketoacidosis in type 1 and type 2 diabetes mellitus. Clinical and biochemical differences. Arch. Intern. Med. 164, 1925–1931 [DOI] [PubMed] [Google Scholar]
- 32. Umpierrez G. E., Kitabchi A. E. (2003) Diabetic ketoacidosis. Risk factors and management strategies. Treat Endocrinol. 2, 95–108 [DOI] [PubMed] [Google Scholar]
- 33. Laffel L. (1999) Ketone bodies. A review of physiology, pathophysiology and application of monitoring to diabetes. Diabetes Metab. Res. Rev. 15, 412–426 [DOI] [PubMed] [Google Scholar]
- 34. Manna P., Jain S. K. (2012) Decreased hepatic phosphatidylinositol-3,4,5-triphosphate (PIP3) levels and impaired glucose homeostasis in type 1 and type 2 diabetic rats. Cell Physiol. Biochem. 30, 1363–1370 [DOI] [PubMed] [Google Scholar]
- 35. Jain S. K., Kannan K., Lim G., McVie R., Bocchini J. A., Jr. (2002) Hyperketonemia increases tumor necrosis factor-α secretion in cultured U937 monocytes and type 1 diabetic patients and is apparently mediated by oxidative stress and cAMP deficiency. Diabetes 51, 2287–2293 [DOI] [PubMed] [Google Scholar]
- 36. Stephens J. M., Sulway M. J., Watkins P. J. (1971) Relationship of blood acetoacetate and 3-hydroxybutyrate in diabetes. Diabetes 20, 485–489 [DOI] [PubMed] [Google Scholar]
- 37. Candiloros H., Muller S., Zeghari N., Donner M., Drouin P., Ziegler O. (1995) Decreased erythrocyte membrane fluidity in poorly controlled IDDM. Influence of ketone bodies. Diabetes Care 18, 549–551 [DOI] [PubMed] [Google Scholar]
- 38. Rubinstein R., Genaro A. M., Motta A., Cremaschi G., Wald M. R. (2008) Impaired immune responses in streptozotocin-induced type I diabetes in mice. Involvement of high glucose. Clin. Exp. Immunol. 154, 235–246 [DOI] [PMC free article] [PubMed] [Google Scholar]
- 39. Manna P., Jain S. K. (2012) Vitamin D up-regulates glucose transporter 4 (GLUT4) translocation and glucose utilization mediated by cystathionine-γ-lyase (CSE) activation and H2S formation in 3T3L1 adipocytes. J. Biol. Chem. 287, 42324–42332 [DOI] [PMC free article] [PubMed] [Google Scholar]
- 40. Kabil O., Banerjee R. (2010) Redox biochemistry of hydrogen sulfide. J. Biol. Chem. 285, 21903–21907 [DOI] [PMC free article] [PubMed] [Google Scholar]
- 41. Ogasawara Y., Isoda S., Tanabe S. (1994) Tissue and subcellular distribution of bound and acid-labile sulfur, and the enzymic capacity for sulfide production in the rat. Biol. Pharm. Bull 17, 1535–1542 [DOI] [PubMed] [Google Scholar]
- 42. Ubuka T., Abe T., Kajikawa R., Morino K. (2001) Determination of hydrogen sulfide and acid-labile sulfur in animal tissues by gas chromatography and ion chromatography. J. Chromatogr. B Biomed. Sci. Appl. 757, 31–37 [DOI] [PubMed] [Google Scholar]
- 43. Westley A. M., Westley J. (1991) Biological sulfane sulfur. Anal. Biochem. 195, 63–67 [DOI] [PubMed] [Google Scholar]
- 44. Wang K., Ahmad S., Cai M., Rennie J., Fujisawa T., Crispi F., Baily J., Miller M. R., Cudmore M., Hadoke P. W., Wang R., Gratacós E., Buhimschi I. A., Buhimschi C. S., Ahmed A. (2013) Dysregulation of hydrogen sulfide producing enzyme cystathionine-γ-lyase contributes to maternal hypertension and placental abnormalities in preeclampsia. Circulation 127, 2514–2522 [DOI] [PubMed] [Google Scholar]
- 45. Szabo C., Coletta C., Chao C., Módis K., Szczesny B., Papapetropoulos A., Hellmich M. R. (2013) Tumor-derived hydrogen sulfide, produced by cystathionine-β-synthase, stimulates bioenergetics, cell proliferation, and angiogenesis in colon cancer. Proc. Natl. Acad. Sci. U.S.A. 110, 12474–12479 [DOI] [PMC free article] [PubMed] [Google Scholar]
- 46. Wu L., Yang W., Jia X., Yang G., Duridanova D., Cao K., Wang R. (2009) Pancreatic islet overproduction of H2S and suppressed insulin release in Zucker diabetic rats. Lab. Invest. 89, 59–67 [DOI] [PubMed] [Google Scholar]
- 47. Yang G., Tang G., Zhang L., Wu L., Wang R. (2011) The pathogenic role of cystathionine-γ-lyase/hydrogen sulfide in streptozotocin-induced diabetes in mice. Am. J. Pathol. 179, 869–879 [DOI] [PMC free article] [PubMed] [Google Scholar]
- 48. Zhao W., Zhang J., Lu Y., Wang R. (2001) The vasorelaxant effect of H2S as a novel endogenous gaseous K(ATP) channel opener. EMBO J. 20, 6008–6016 [DOI] [PMC free article] [PubMed] [Google Scholar]
- 49. Artuch R., Vilaseca M. A., Farré C., Ramon F. (1995) Determination of lactate, pyruvate, β-hydroxybutyrate, and acetoacetate with a centrifugal analyser. Eur. J. Clin. Chem. Clin. Biochem. 33, 529–533 [PubMed] [Google Scholar]
- 50. Koch D. D., Feldbruegge D. H. (1987) Optimized kinetic method for automated determination of β-hydroxybutyrate. Clin. Chem. 33, 1761–1766 [PubMed] [Google Scholar]
- 51. Grant W. B., Peiris A. N. (2010) Possible role of serum 25-hydroxyvitamin D in black-white health disparities in the United States. J. Am. Med. Dir. Assoc. 11, 617–628 [DOI] [PubMed] [Google Scholar]
- 52. Jain S. K., Manna P., Micinski D., Lieblong B. J., Kahlon G., Morehead L., Hoeldtke R., Bass P. F., 3rd, Levine S. N. (2013) In African American type 2 diabetic patients, is vitamin D deficiency associated with lower blood levels of hydrogen sulfide and cyclic adenosine monophosphate, and elevated oxidative stress? Antioxid. Redox Signal. 18, 1154–1158 [DOI] [PMC free article] [PubMed] [Google Scholar]
- 53. Schwalfenberg G. (2008) Vitamin D and diabetes. Improvement of glycemic control with vitamin D3 repletion. Can. Fam. Physician 54, 864–866 [PMC free article] [PubMed] [Google Scholar]
- 54. Aljabri K. S., Bokhari S. A., Khan M. J. (2010) Glycemic changes after vitamin D supplementation in patients with type 1 diabetes mellitus and vitamin D deficiency. Ann. Saudi Med. 30, 454–458 [DOI] [PMC free article] [PubMed] [Google Scholar]
- 55. Wilinski B., Wilinski J., Somogyi E., Piotrowska J., Opoka W. (2012) Vitamin D3 (cholecalciferol) boosts hydrogen sulfide tissue concentrations in heart and other mouse organs. Folia Biol. (Prague) 60, 243–247 [DOI] [PubMed] [Google Scholar]
- 56. Kaneko Y., Kimura Y., Kimura H., Niki I. (2006) l-Cysteine inhibits insulin release from the pancreatic β-cell. Possible involvement of metabolic production of hydrogen sulfide, a novel gasotransmitter. Diabetes 55, 1391–1397 [DOI] [PubMed] [Google Scholar]
- 57. Kaneko Y., Kimura T., Taniguchi S., Souma M., Kojima Y., Kimura Y., Kimura H., Niki I. (2009) Glucose-induced production of hydrogen sulfide may protect the pancreatic β-cells from apoptotic cell death by high glucose. FEBS Lett. 583, 377–382 [DOI] [PubMed] [Google Scholar]
- 58. Yang G., Yang W., Wu L., Wang R. (2007) H2S, endoplasmic reticulum stress, and apoptosis of insulin-secreting β cells. J. Biol. Chem. 282, 16567–16576 [DOI] [PubMed] [Google Scholar]
- 59. Xue R., Hao D. D., Sun J. P., Li W. W., Zhao M. M., Li X. H., Chen Y., Zhu J. H., Ding Y. J., Liu J., Zhu Y. C. (2013) Hydrogen sulfide treatment promotes glucose uptake by increasing insulin receptor sensitivity and ameliorates kidney lesions in type 2 diabetes. Antioxid. Redox Signal. 19, 5–23 [DOI] [PMC free article] [PubMed] [Google Scholar]
- 60. Yamamoto J., Sato W., Kosugi T., Yamamoto T., Kimura T., Taniguchi S., Kojima H., Maruyama S., Imai E., Matsuo S., Yuzawa Y., Niki I. (2013) Distribution of hydrogen sulfide (H2S)-producing enzymes and the roles of the H2S donor sodium hydrosulfide in diabetic nephropathy. Clin. Exp. Nephrol. 17, 32–40 [DOI] [PMC free article] [PubMed] [Google Scholar]
- 61. Kabil O., Vitvitsky V., Xie P., Banerjee R. (2011) The quantitative significance of the transsulfuration enzymes for H2S production in murine tissues. Antioxid. Redox Signal. 15, 363–372 [DOI] [PMC free article] [PubMed] [Google Scholar]
- 62. Kmiec Z. (2001) Cooperation of liver cells in health and disease. Adv. Anat. Embryol. Cell Biol. 161, III-XIII, 1–151 [DOI] [PubMed] [Google Scholar]
- 63. Bilzer M., Roggel F., Gerbes A. L. (2006) Role of Kupffer cells in host defense and liver disease. Liver Int. 26, 1175–1186 [DOI] [PubMed] [Google Scholar]
- 64. Parker G. A., Picut C. A. (2005) Liver immunobiology. Toxicol. Pathol. 33, 52–62 [DOI] [PubMed] [Google Scholar]
- 65. Zucker-Franklin D. (1974) The percentage of monocytes among “mononuclear” cell fractions obtained from normal human blood. J. Immunol. 112, 234–240 [PubMed] [Google Scholar]
- 66. Denholm E. M., Wolber F. M. (1991) A simple method for the purification of human peripheral blood monocytes. A substitute for Sepracell-MN. J. Immunol. Methods 144, 247–251 [DOI] [PubMed] [Google Scholar]
- 67. Jain S. K., Rains J. L., Croad J. L. (2007) High glucose and ketosis (acetoacetate) increases, and chromium niacinate decreases, IL-6, IL-8, and MCP-1 secretion and oxidative stress in U937 monocytes. Antioxid. Redox Signal. 9, 1581–1590 [DOI] [PubMed] [Google Scholar]
- 68. Roe T. F., Crawford T. O., Huff K. R., Costin G., Kaufman F. R., Nelson M. D., Jr. (1996) Brain infarction in children with diabetic ketoacidosis. J. Diabetes Complications 10, 100–108 [DOI] [PubMed] [Google Scholar]
- 69. White N. H. (2000) Diabetic ketoacidosis in children. Endocrinol. Metab. Clin. North Am. 29, 657–682 [DOI] [PubMed] [Google Scholar]
- 70. White N. H. (2003) Management of diabetic ketoacidosis. Rev. Endocr. Metab. Disord. 4, 343–353 [DOI] [PubMed] [Google Scholar]
- 71. Rains J. L., Jain S. K. (2011) Oxidative stress, insulin signaling, and diabetes. Free Radic. Biol. Med. 50, 567–575 [DOI] [PMC free article] [PubMed] [Google Scholar]
- 72. Jain S. K., Kannan K., Lim G. (1998) Ketosis (acetoacetate) can generate oxygen radicals and cause increased lipid peroxidation and growth inhibition in human endothelial cells. Free Radic. Biol. Med. 25, 1083–1088 [DOI] [PubMed] [Google Scholar]
- 73. Jain S. K., Kannan K., Lim G., Matthews-Greer J., McVie R., Bocchini J. A., Jr. (2003) Elevated blood interleukin-6 levels in hyperketonemic type 1 diabetic patients and secretion by acetoacetate-treated cultured U937 monocytes. Diabetes Care 26, 2139–2143 [DOI] [PubMed] [Google Scholar]
- 74. Jain S. K., McVie R. (1999) Hyperketonemia can increase lipid peroxidation and lower glutathione levels in human erythrocytes in vitro and in type 1 diabetic patients. Diabetes 48, 1850–1855 [DOI] [PubMed] [Google Scholar]
- 75. Jain S. K., McVie R., Jackson R., Levine S. N., Lim G. (1999) Effect of hyperketonemia on plasma lipid peroxidation levels in diabetic patients. Diabetes Care 22, 1171–1175 [DOI] [PubMed] [Google Scholar]
- 76. Harrison J. E., Saeed F. A. (1981) Acetoacetate is an electron donor to myeloperoxidase and a promoter of myeloperoxidase-catalyzed fatty acid peroxidation. Biochem. Med. 26, 339–355 [DOI] [PubMed] [Google Scholar]
- 77. Yokoo H., Saitoh T., Shiraishi S., Yanagita T., Sugano T., Minami S., Kobayashi H., Wada A. (2003) Distinct effects of ketone bodies on down-regulation of cell surface insulin receptor and insulin receptor substrate-1 phosphorylation in adrenal chromaffin cells. J. Pharmacol. Exp. Ther. 304, 994–1002 [DOI] [PubMed] [Google Scholar]
- 78. Abdelmegeed M. A., Kim S. K., Woodcroft K. J., Novak R. F. (2004) Acetoacetate activation of extracellular signal-regulated kinase 1/2 and p38 mitogen-activated protein kinase in primary cultured rat hepatocytes. role of oxidative stress. J. Pharmacol. Exp. Ther. 310, 728–736 [DOI] [PubMed] [Google Scholar]
- 79. Brand F. N., Abbott R. D., Kannel W. B. (1989) Diabetes, intermittent claudication, and risk of cardiovascular events. The Framingham Study. Diabetes 38, 504–509 [DOI] [PubMed] [Google Scholar]
- 80. Shaikh M. K., Devrajani B. R., Shaikh A., Shah S. Z. A., Shaikh S., Singh D. (2012) Plasma homocysteine level in patients with diabetes mellitus. World Applied Sciences Journal 16, 1269–1273 [Google Scholar]
- 81. Hultberg B., Agardh E., Andersson A., Brattström L., Isaksson A., Israelsson B., Agardh C. D. (1991) Increased levels of plasma homocysteine are associated with nephropathy, but not severe retinopathy in type 1 diabetes mellitus. Scand. J. Clin. Lab. Invest. 51, 277–282 [DOI] [PubMed] [Google Scholar]
- 82. Hoogeveen E. K., Kostense P. J., Beks P. J., Mackaay A. J., Jakobs C., Bouter L. M., Heine R. J., Stehouwer C. D. (1998) Hyperhomocysteinemia is associated with an increased risk of cardiovascular disease, especially in non-insulin-dependent diabetes mellitus. A population-based study. Arterioscler. Thromb. Vasc. Biol. 18, 133–138 [DOI] [PubMed] [Google Scholar]
- 83. Robillon J. F., Canivet B., Candito M., Sadoul J. L., Jullien D., Morand P., Chambon P., Freychet P. (1994) Type 1 diabetes mellitus and homocyst(e)ine. Diabete. Metab. 20, 494–496 [PubMed] [Google Scholar]
- 84. Jacobs R. L., House J. D., Brosnan M. E., Brosnan J. T. (1998) Effects of streptozotocin-induced diabetes and of insulin treatment on homocysteine metabolism in the rat. Diabetes 47, 1967–1970 [DOI] [PubMed] [Google Scholar]
- 85. Chang L., Geng B., Yu F., Zhao J., Jiang H., Du J., Tang C. (2008) Hydrogen sulfide inhibits myocardial injury induced by homocysteine in rats. Amino Acids 34, 573–585 [DOI] [PubMed] [Google Scholar]
- 86. Tang X. Q., Shen X. T., Huang Y. E., Chen R. Q., Ren Y. K., Fang H. R., Zhuang Y. Y., Wang C. Y. (2011) Inhibition of endogenous hydrogen sulfide generation is associated with homocysteine-induced neurotoxicity. Role of ERK1/2 activation. J. Mol. Neurosci. 45, 60–67 [DOI] [PubMed] [Google Scholar]
- 87. Rosen C. J., Adams J. S., Bikle D. D., Black D. M., Demay M. B., Manson J. E., Murad M. H., Kovacs C. S. (2012) The nonskeletal effects of vitamin D. An Endocrine Society scientific statement. Endocr. Rev. 33, 456–492 [DOI] [PMC free article] [PubMed] [Google Scholar]
- 88. Jain S. K., Micinski D. (2013) Vitamin D up-regulates glutamate cysteine ligase and glutathione reductase and GSH formation and decreases ROS and MCP-1 and IL-8 secretion in high-glucose exposed U937 monocytes. Biochem. Biophys. Res. Commun. 437, 7–11 [DOI] [PMC free article] [PubMed] [Google Scholar]