

Background: Interacting proteins modulate the activity of NF-κB/RelA transcription factor and expression of its targets.
Results: By analyzing gene expression, protein binding, and DNA binding, we inferred and characterized 8349 such modulations.
Conclusion: Different modulator groups affect separate pathways.
Significance: We provide new insight into the activity of NF-κB/RelA. Our inference model can be applied to other processes and pathways.
Keywords: Computational Biology, Functional Genomics, Gene Expression, NF-κB Transcription Factor, Proteomics, Transcription Regulation, Transcription Target Genes, Action Mode of Modulation, Modulatory Network
Abstract
Modulators (Ms) are proteins that modify the activity of transcription factors (TFs) and influence expression of their target genes (TGs). To discover modulators of NF-κB/RelA, we first identified 365 NF-κB/RelA-binding proteins using liquid chromatography-tandem mass spectrometry (LC-MS/MS). We used a probabilistic model to infer 8349 (M, NF-κB/RelA, TG) triplets and their modes of modulatory action from our combined LC-MS/MS and ChIP-Seq (ChIP followed by next generation sequencing) data, published RelA modulators and TGs, and a compendium of gene expression profiles. Hierarchical clustering of the derived modulatory network revealed functional subnetworks and suggested new pathways modulating RelA transcriptional activity. The modulators with the highest number of TGs and most non-random distribution of action modes (measured by Shannon entropy) are consistent with published reports. Our results provide a repertoire of testable hypotheses for experimental validation. One of the NF-κB/RelA modulators we identified is STAT1. The inferred (STAT1, NF-κB/RelA, TG) triplets were validated by LC-selected reaction monitoring-MS and the results of STAT1 deletion in human fibrosarcoma cells. Overall, we have identified 562 NF-κB/RelA modulators, which are potential drug targets, and clarified mechanisms of achieving NF-κB/RelA multiple functions through modulators. Our approach can be readily applied to other TFs.
Introduction
NF-κB is a key human transcription factor for stress-associated processes. It is involved in many cellular processes including innate immunity (1), inflammation (2), stress response (3), regulation of apoptosis (4), and regulation of proliferation and differentiation (5). Dysregulation of NF-κB activity is linked to inflammatory disorders (6), autoimmune diseases (7), metabolic diseases (8), and cancers (9). Such multiple NF-κB functions are achieved through modulation (10, 11) and cooperative binding with other transcription factors (12). RelA (p65) is one of five components of the NF-κB transcription factor complex in mammals (10). Because of the importance and complexity of the cellular processes regulated by NF-κB pathways, elucidating and characterizing modulators of NF-κB will provide important insights into the role of modulation in fine-tuning transcriptional regulations and conferring specificity as well as identify potentially promising drug targets.
Gene expression profiles measured under various conditions provide important information on the regulatory relations between genes. Gene regulatory networks have been constructed using reverse engineering methods based on correlation of gene expression profiles (13). These methods include conditional information (13, 14), correlation coefficient, machine learning (15), and statistical models (16). Recently, heterogeneous data integration of promoter sequence and gene expression profiles has also been used to infer gene regulation patterns (17, 18).
Modulators (Ms)2 are proteins that modify the activity of a transcription factor (TF). Modulators often act by binding directly to the TFs to affect the expression of a target gene. The outcome of modulation can be classified into the six possible action modes: inhibition attenuation, inhibition enhancement, inhibition inversion, activation inversion, activation enhancement, and activation attenuation (19). Including analysis of the modulators facilitates elucidation of a biologically realistic regulatory network. Therefore, instead of pairs (TF, TG) that lead to traditional regulatory networks, triplets (M, TF, TG) and the more complex regulatory and modulatory networks inferred based on significant triplets should be considered.
Several computational methods for inferring (M, TF, TG) triplets from gene expression profiles have been developed in recent years including three-way mutual information (20), MINDy (21), GEM (19), MIMOSA (22), and MONSTER (23). MINDy uses the difference between conditional mutual information at low and high modulator expression and has been applied to identify genome-wide modulators of MYC. However, it has a major limitation in that it cannot identify modulators with more than one mode of activity (activator or repressor). MIMOSA applies a mixture model and maximum expectation method to predict modulators of signal transducers and activators of transcription 1 (STAT1). The method is computationally intensive and cannot differentiate between modulators and targets of the TF. Finally, MONSTER only considers kinases as potential modulator candidates. Neither MIMOSA nor MONSTER has been experimentally validated. GEM (19) aims to identify modulators of the androgen receptor by constructing a non-linear model of the three-way interaction between the activity levels of the two “inputs” (TF and M) and the “output” (TG).
In this work, we predicted modulators and the corresponding TGs of the NF-κB/RelA transcription factor based on the approach described previously (19). As input for modulatory triplet inference, we used de novo identified RelA-binding proteins and its target genes identified, respectively, by affinity tandem mass spectrometry (LC-MS/MS) and chromatin immunoprecipitation followed by next generation sequencing (ChIP-Seq). The new data were supplemented with published data on binding proteins and target genes of the NF-κB/RelA pathway.
EXPERIMENTAL PROCEDURES
Probabilistic Models for Triplet Prediction
The probabilistic model is similar to Babur et al. (19). The expected expression of the target gene TG, E(TG), in continuous value is modeled as follows.
Here, F, M, and TG are the transcription factor, its modulator, and the affected target gene, respectively. Hc is the basal expression level of the TG, Hf and Hm represent the effect of F and M alone on TG, respectively. G represents the effect of interaction between M and F on TG and varies for different genes. Its magnitude may be interpreted as the modulation effect. Our task was to find genes with G significantly different from zero. Accordingly, we approximated the probability that TG is highly expressed, p(TG = 1), as follows.
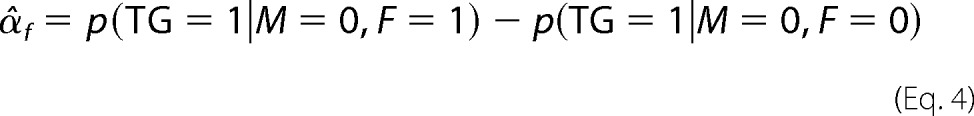
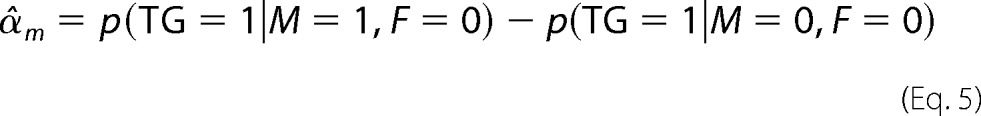
where αc represents the basal expression of TG, αf is the effect of F only (when M is low), αm is the effect of M only (at low F), and γ is the interaction effect of F and M when both are highly expressed. F, M, and TG are equal to 1 if the ranked expression of the corresponding gene is in the upper tertile. Conversely, if it is in the lower tertile, F, M, and TG are set to zero. If γ is not statistically significantly different from zero, the data do not have enough evidence to support the hypothesis that M modulates the effect of F on the target TG.
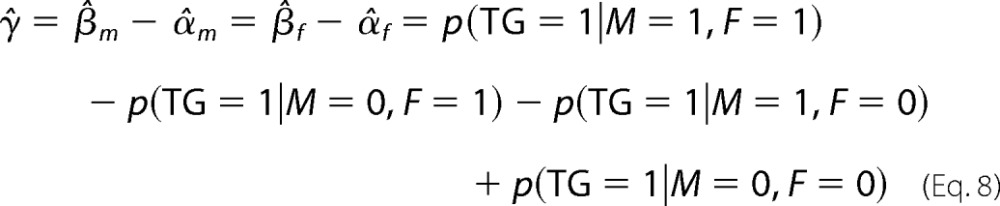
To estimate αc, αf, αm, and γ, we first calculated p(TG = 1|M, F), the proportions of TG = 1 with different combination of states of M and F. Specifically, p(TG = 1|M = 1, F = 1) where TG = 1 with M = 1 and F = 1 serves as the observed case, whereas p(TG = 1|M = 1, F = 0), p(TG = 1|M = 0, F = 1), and p(TG = 1|M = 0, F = 0) are the respective control cases with low M, F, or both. α, β, and γ were then estimated by Equation 3.
Here, α̂c corresponds to the proportion of TG = 1 to TG = 1 plus TG = 0 when expression of both M and F is low.
 |
 |
 |
 |
 |
Estimation of the above parameters can be found in Babur et al. (19).
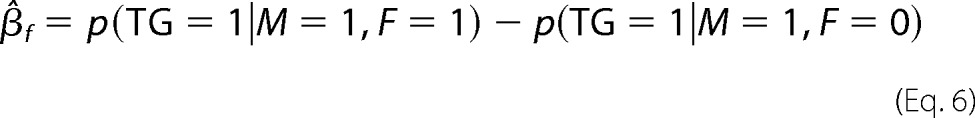
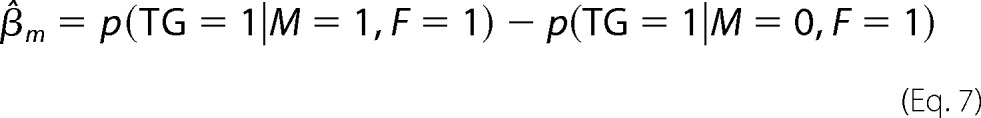
Assuming that M influences TG via M, M must act on TG when F is highly expressed; i.e. γ̂ and β̂m must be non-zero, whereas β̂m is greater in absolute value or has a different sign than α̂m.
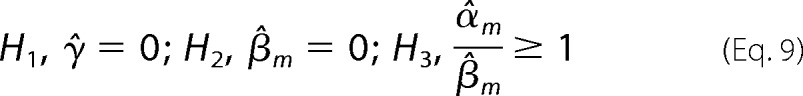 |
The estimation of the variance and p value for rejecting the above three null hypotheses H1, H2, and H3 can be found in Babur et al. (19). The predicted triplets are ordered according to the p values of γ̂ and β̂m; the smaller the p value, the higher the significance of the predicted triplet. The requirement for a significant γ̂ is crucial for detecting the interaction effect as opposed to a combination of independent actions of M and F separately.
Classification of the Triplet Action
Unmodulated TF activity was classified into three categories according to α̂f: activation if positive, inhibition if negative, and inactive if zero. By comparing α̂and β̂, modulators are also classified into three categories of action: enhance, attenuate, or invert the activity of the TF. Specifically, if α̂f is non-negative and the β̂f value is greater than α̂f, the action mode is activation enhancement. If α̂f is positive and β̂f is less than α̂f and non-negative, it signifies activation attenuation, and if α̂f is positive and β̂f is negative, it signifies activation inversion. If α̂f is non-positive and the β̂f value is smaller than α̂f, the action mode is inhibition enhancement. If α̂f is negative and β̂f is greater than α̂ and non-positive, the action mode is inhibition attenuation, and if α̂f is negative and β̂f is positive, the action mode is inhibition inversion (see Table 1).
TABLE 1.
Interpretation of the categories of modulation and the constraints that the categories satisfy
“+” and “−,” significantly positive and negative values, respectively; “0/−,” not significantly different from zero or significantly negative values; “0/+,” not significantly different from zero or significantly positive values; “+/−” and “−/+,” non-zero values. Moreover, the classification is for triplets where the null hypotheses in Equation 10 were also rejected.
| Modulation classification | Explanation | γ̂ | α̂f | β̂f | β̂m | α̂f + β̂m |
|---|---|---|---|---|---|---|
| Inhibition attenuation | TF, alone, inhibits TG; M attenuates TF activity | + | − | 0/− | −/+ | 0/− |
| Inhibition enhancement | Modulated TF inhibits TG | − | 0/− | − | − | − |
| Inhibition inversion | TF, alone, inhibits TG; M inverts TF activity | + | − | + | + | + |
| Activation inversion | TF, alone, activates TG; M inverts TF activity | − | + | − | − | − |
| Activation enhancement | Modulated TF activates TG | + | 0/+ | + | + | + |
| Activation attenuation | TF, alone, activates TG; M attenuates TF activity | − | + | 0/+ | +/− | 0/+ |
A Pass Strategy Based on Shannon Entropy Filter
We further filtered the predicted modulators by the Shannon entropy of the distribution across the six action modes by each modulator respectively predicted from binding data. Modulators with Shannon entropy significantly smaller than expected from random distribution were classified as specific. The null distribution of the Shannon entropy depends on the number of targets and is obtained by generating the six action modes given the number of TGs in a simulation repeated 10,000 times. The modulators were ranked according to the largest number of TGs. The calculation of the Shannon entropy of the action mode distribution for each modulator is as follows.
 |
where pi is the proportion of the number of targets in each action mode i, and H is the entropy of action mode distribution for each modulator.
Hierarchical Clustering of M-TG Networks
To identify the modules of the network composed by RelA modulators and their affected target genes, we applied hierarchical clustering (24) to matrices of modulator-target interactions. Hierarchical clustering has been chosen to reflect the coincidence between the modular structure of the modulation network and the multiple levels of functional annotations of the genes involved (see also “Results”). The matrix entries correspond to the value of γ̂, which represents the effect of M when F is highly expressed, and β̂m, the interaction effect of M and F when both are highly expressed. Here we used the Matlab clustergram function with default parameters and parsed the M-TG network into a hierarchy of groups according to the similarity of the value of γ̂ (the effect of M-F interaction) and the value of β̂m (the effect of M when F is high) that measures the common neighbors of M and T, respectively. The hierarchical clustering is agglomerative because we proceeded through the algorithm by adding links to the network. We applied the clustering procedure to triplets satisfying (−log10 p value of γ̂) > 4 and (−log10 p value of β̂m) > 4. To obtain the clustering presented in Fig. 4, we only used the modulators and TGs involved in significant predicted interactions and not involved in feedback loops. Specifically, we only used the 861 TGs for which there was at least one triplet satisfying the p value thresholds. The modulators have been selected analogously with at least one significant triplet, giving 493 candidate modulators of RelA.
FIGURE 4.

The mode distribution of the 10 modulators analyzed. The six numbers in each bin chart represent the numbers of triplets of the corresponding six color-coded action modes.
Gene Expression Profiles
We used gene expression profiles of 2158 tumor samples published by the Expression Project for Oncology (expO) to characterize each gene. expO is based on the GeneChip Human Genome U133 Plus 2.0 array platform. The variety of the tumor samples guarantees enough perturbation for studying three-point (M, NF-κB/RelA, TG) interaction.
Because gene expression is noisy as reported (25), unsupervised discretization methods were usually used to discretize the gene expression profiles in gene regulatory network construction including equal width discretization, equal frequency discretization, K-means, column K-means discretization, and bidirectional K-means discretization. We discretized the expression values by rank ordering across genes and dividing the ranked 2158 expression values of each gene across experiments into three bins, labeled as “1” (upper 719 experiments where the gene ranked highest), “0” (lower 719 experiments where the gene ranked lowest), and “middle” (720 remaining experiments). Based on the areas under receiver-operator curve and precision-recall curve in predicting RelA modulators (see Fig. 1), we found that varying the bin size only weakly affected the prediction of RelA triplets. Thus, we used tertiles as bins. Unless specified otherwise, we predicted triplets from probe set profiles with the above discretization. For some of the genes, multiple probe sets are available on the U133 Plus 2.0 microarray. Because the individual probe sets may correspond to different isoforms of the gene and thus be responsible for different functions, we treated each probe set of modulators and target genes separately in the prediction algorithm. Also, there are three probe sets corresponding to RelA on the array platform: 201783_s_at, 209878_s_at, and 230202_at. We considered the first two individually and ignored the third one, 230202_at, because of its low expression in the expO experiments.
FIGURE 1.
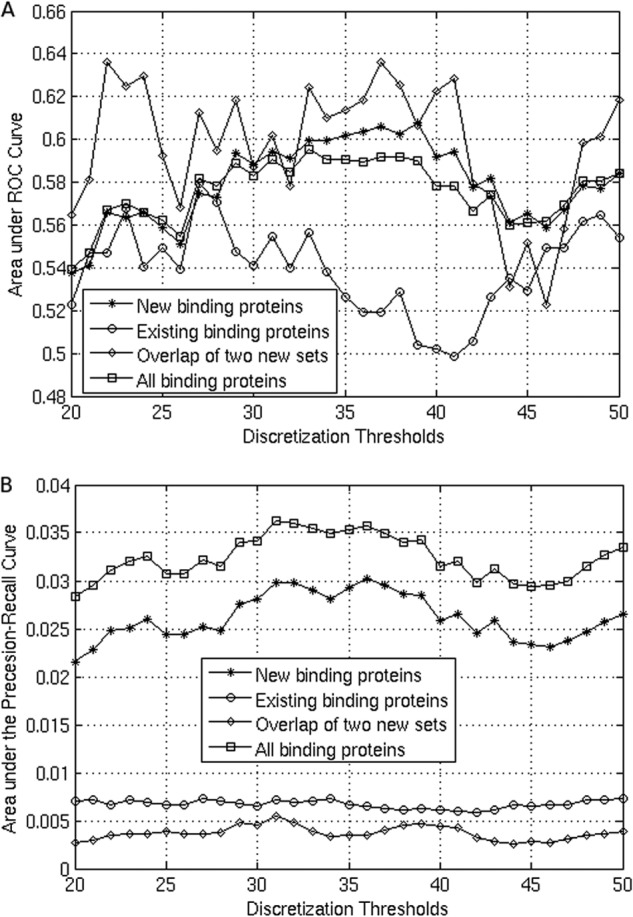
Receiver-operator curve and precision-recall curve in predicting RelA modulators. A, area under the receiver-operator curve (ROC) of modulator prediction by varying the thresholds of bins (see “Experimental Procedures”) with four types of proteins as benchmark positives: new binding proteins (newly identified binding proteins of RelA in this study), existing binding proteins (binding proteins collected from the PIANA database and other sources), overlap of two new sets (overlapping binding proteins of RelA from our two LC-MS/MS experiments), and all binding proteins (combined binding proteins of RelA of newly identified binding proteins in this study and those collected from the database). B, area under the precision-recall curve of modulator prediction by varying the thresholds of bins (see “Experimental Procedures”) with all binding proteins.
Collection of Binding Proteins and Target Genes of RelA from Literature
We have obtained the list of RelA-binding proteins from the Protein Interactions and Network Analysis (PIANA) database. 287 of those 297 proteins (supplemental Data File S1, Sheet 1) have probe sets available in the expO database. Here, we refer to these previously reported binding proteins as “existing” as opposed to the newly identified proteins that bind to RelA. Similarly, the existing RelA targets (TGs) were collected.3 424 TGs (supplemental Data File S2, Sheet 2) have been obtained with available probe sets and expression values in the expO database. These existing binding proteins and TGs combined with the newly detected proteins serve as our primary set of candidate genes involved in the modulatory network of RelA-regulated transcription. The functional annotations of the modulators and TGs were characterized using BiNGO software (26) in Cytoscape (27).
Identification of RelA-binding Protein by Affinity Tandem Mass Spectrometry
Materials
All reagents were American Chemical Society grade or higher. All solvents used including water, methanol, and acetonitrile (ACN) were LC/MS grade. Sequence grade modified trypsin was purchased from Promega (Madison, WI). Recombinant TNFα was from PeproTech (Rocky Hill, NJ). The antibody used was rabbit anti-NF-κB/RelA (sc-372) antibody from Santa Cruz Biotechnology (Santa Cruz, CA).
Cell Culture
Human A549 pulmonary epithelial cells (American Type Culture Collection (ATCC)) were grown in F12K medium (Invitrogen) with 10% fetal bovine serum, 100 units/ml penicillin, and 100 μg/ml streptomycin at 37 °C in a 5% CO2 incubator as described previously (28).
Co-immunoprecipitation
4–6 × 10⁶ A549 cells were transfected by electroporation in suspension with 10 mg/ml poly(I:C) (Sigma) according to the manufacturer's recommendation (Amaxa). After 4 h, cells were washed twice with phosphate-buffered saline (PBS; 137 mm NaCl, 10 mm phosphate, 2.7 mm KCl, pH 7.4), and nuclei were prepared by lysis in hypotonic buffer (29). Protein-chromatin cross-linking was performed using an optimized two-step protocol with disuccinimidyl glutarate (Pierce) followed by formaldehyde (30). The nuclei were lysed in Lysis Buffer (1% SDS, 50 mm Tris, pH 8.0, protease inhibitor mixture).
Equal amounts of cross-linked protein were immunoprecipitated overnight at 4 °C with 4 μg of rabbit anti-RelA antibody diluted 1:4 in ChIP dilution buffer (50 mm Tris-HCl, pH 7.5, 1 mm EGTA, 1 mm EDTA, 1% Triton X-100, 0.27 m sucrose, 0.1% (v/v) β-mercaptoethanol, 1 mm sodium orthovanadate, 50 mm sodium fluoride, 5 mm sodium pyrophosphate, Complete proteinase inhibitor mixture, 1 mm phenylmethylsulfonyl fluoride). Immunoprecipitates were then collected with 40 μl of protein A magnetic beads (Dynal Inc.) that were preblocked in 200 μl of acetylated casein (0.2 mg/ml) at room temperature for 2 h (31). Nonspecific IgG was used as a negative control. Immunoprecipitates were washed five times in PBS.
On-bead Tryptic Digestion
The beads were resuspended in 30 μl of 50 mm ammonium hydrogen carbonate, pH 7.8. 20 μl of 0.1 μg/μl trypsin was added. The samples were mixed and trypsinized by gentle shaking overnight at 37 °C. After digestion, the supernatant was collected. The beads were washed with 50 μl of 50% ACN three times, and the supernatant was pooled and dried (4).
In-gel Tryptic Digestion
The protein mixtures obtained from immunoprecipitation of anti-RelA antibody and nonspecific IgG were separated by SDS-PAGE. The proteins were visualized by SYPRO® Ruby staining. The protein bands were cut from the gel and subjected to in-gel trypsin digestion as described previously (5). Briefly, the gel slice was cut into small particles (∼1 mm3) using a scalpel. The resulting gel particles were destained in 1 ml of water/methanol solution (50:50, v/v) containing 25 mm NH4HCO3, pH 8.0 three times with the solution changed every 10 min. The destained gel was washed in 1 ml of an acetic solution (acetic acid/methanol/water, 10:40:50, v/v/v) for 3 h with the solution changed every 1 h. The resulting gel was soaked in 1 ml of water twice with the solvent changed every 20 min. The gel was then transferred to a 0.5-ml microcentrifuge tube and dehydrated by soaking the gel in 100% ACN until it became opaque white. The solution was removed, and the gel was dried in a SpeedVac for 20–30 min. The dried gel was rehydrated with an adequate amount of trypsin digestion solution (10 ng of trypsin/μl in 50 mm NH4HCO3, pH 8.0). The digestion was carried out at 37 °C overnight. To extract the tryptic digest, the gel was soaked in 40 μl of extraction solution (ACN/TFA/water, 50:5:45, v/v/v) for 60 min with a Vortex, and the extraction solution was carefully removed with a gel-loading pipette tip. Extraction was repeated once. The extracts were pooled and dried with a SpeedVac.
LC-MS/MS
HPLC/MS/MS analyses were performed in an LTQ Velos Orbitrap mass spectrometer (Thermo Scientific, San Jose, CA) coupled on line to a nano-HPLC system (Agilent 1100 Nano Pump, Agilent Technologies, San Jose, CA) and nanospray source. Three microliters of the peptide solution in buffer A (5% acetonitrile, 94.9% water, 0.1% acetic acid; v/v/v) was manually injected and separated in a nano-HPLC C18 column (100-mm length × 75-μm inner diameter, 5-μm particle size, 100-Å pore diameter). The peptides were eluted from the column with a linear gradient of 5–70% buffer B (99.9% acetonitrile, 0.1% acetic acid; v/v/v) in buffer A over 45 min. The eluted peptides were electrosprayed directly into the mass spectrometer. The MS/MS spectra were acquired in a data-dependent mode. The full MS scan was performed in the Orbitrap with a mass resolution of 60,000. The six strongest ions in each MS spectrum were automatically selected for collision-induced dissociation and analyzed by the LTQ Velos.
Protein Identification and Spectral Counting
The resulting spectra were used to identify protein candidates in the target-decoy Swiss-Prot human protein database (downloaded on August 25, 2011) with the Proteome Discoverer 1.1 search engine (Thermo Scientific). The cutoff of the false discovery rate of peptide identifications was 1%. The normalized spectral abundance factor (NSAF) value for each protein was calculated as described (6).
 |
in which the total number of tandem MS spectra matching peptides from protein k (SpC) was divided by the protein length (L) and then divided by the sum of SpC/L for all uniquely identified proteins in the data set.
LC-Selected Reaction Monitoring (SRM)-MS
The LC-SRM-MS analysis was performed with a TSQ Vantage triple quadrupole mass spectrometer equipped with a nanospray source (Thermo Scientific). The on-line desalting and chromatography were performed using an Eksigent NanoLC-2D HPLC system (AB SCIEX, Dublin, CA). An aliquot of 10 μl of each tryptic digest was injected on a C18 peptide trap (Agilent Technologies) and desalted with 0.1% formic acid at a flow rate of 2 μl/min for 45 min. Peptides were eluted from the trap and separated on a reversed phase nano-HPLC column (PicoFritTM; 75 μm × 10 cm; tip inner diameter, 15 μm) packed in house using Zorbax SB-C18 (5-μm-diameter particles; Agilent Technologies). Separations were performed using a flow rate of 500 nl/min with a 20-min linear gradient from 2 to 40% mobile phase B (0.1% formic acid, 90% ACN) in mobile phase A (0.1% formic acid) followed by a 0.1-min gradient from 40 to 90% mobile phase B and 5 min at 90% mobile phase B. The TSQ Vantage was operated in high resolution SRM mode with Q1 and Q3 set to 0.2- and 0.7-Da full-width half-maximum. All acquisition methods used the following parameters: 1800 V ion spray voltage, a 275 °C ion transferring tube temperature, a collision-activated dissociation pressure at 1.5 millitorrs, and the S-lens voltage used the values in the S-lens table generated during MS calibration (4).
Identification of RelA Target Genes by ChIP-Seq
We prepared the list of candidate target genes of RelA based on the result of our previous ChIP-Seq experiment (32). To identify DNA sequences binding to RelA, covalent cross-linking, segmentation of DNA, and anti-RelA antibody precipitation was performed in A549 cells. ChIP-Seq data of RelA were obtained by Illumina sequencing, resulting in two fastq files, one for the TNF treatment at 0 min (TNF-0) and one for the TNF treatment at 30 min (TNF-30). As reported (32), our in-house Instant Sequencing software was used to trim the reads at the location where one base was called with a confidence interval greater than 99% (corresponding to a phred score ≥20 and p value of 0.01) (33), and only reads that were at least 35 bp long were preserved in the corresponding fasta file. The TNF-0 and TNF-30 samples contained 17,862,626 and 12,624,879 quality filtered reads, respectively. We used Bowtie v0.12 software (34) to map the filtered reads to the human genome assembly GRCh37/hg19. We rejected reads that had mismatches or were non-uniquely mappable, leaving 77% of reads in the TNF-0 sample and 81% for the TNF-30 sample. ChIP-Seq binding peaks were called using MACS v0.14 (35) with parameters for calling peaks in human data with the TNF-0 sample as the control and the TNF-30 sample as the treatment. In total, 20,733 peaks were called.
After parsing by Instant Sequencing, we selected the best 4195 peaks with a MACS significance score of at least 200. For gene assignment, Instant Sequencing was then used to find transcription start sites of known human genes proximal to ChIP-Seq peaks using annotations from the GENCODE v12 database (36, 37). Peaks whose summits were within a distance of 3 kb upstream or downstream of a known transcription start site of a gene were identified. For each ChIP-Seq peak, a list of transcription start sites was ranked by the increasing order of their distance from the summit of a ChIP-Seq peak. Next, the gene with its transcription start site closest to the summit of a peak was found and reported along with the MACS significance score of that peak. When multiple peaks were proximal to the same gene, the MACS significance scores for each peak were added together, and the sum was reported as a single score for that gene. Finally, a list of proximal genes ordered by their combined significance scores (supplemental Data File S2, Sheet 1) was generated for finding enriched gene ontology (GO) functions.
Enrichment Analysis of Predicted TGs Composing the Predicted Triplets
Enrichment of the predicted TGs in newly identified and existing TGs was assessed by hypergeometric cumulative distribution function (CDF) using the hygecdf function in Matlab. The function computes the hypergeometric CDF given the size of the population, the number of items with the desired characteristic, and the number of samples. The final p value is calculated by 1 − CDF.
Experimental Validation on (STAT1, NF-κB/RelA, TG) Triplets
An interaction between STAT1 and RelA has been previously implicated by co-localization experiments based on confocal fluorescence microscopy (38). To verify the interaction between RelA and STAT1, we used immunoprecipitation and quantitative stable isotope dilution-SRM-MS to measure the enrichment of STAT1 in the sample obtained from the immunoprecipitation of anti-RelA antibody. The nuclear extract of A549 cells were incubated with anti-RelA antibody and nonspecific IgG (negative control), respectively, as depicted under “Experimental Procedures.” The proteins associated with the antibodies were pulled down and subjected to LC-SRM-MS to quantify the level of STAT1 in each sample.
Targets of the STAT1-RelA interaction were validated by STAT1 knock-out and poly(I:C) stimulation. Specifically, the real action modes of the predicted triplets of (STAT1, NF-κB/RelA, TGs) were validated by comparing the expression level of a target gene candidate in four conditions consisting of STAT1 wild-type human 2f (STAT1+/+) cell line and knock-out U3A (STAT1−/−) combined with the absence or presence of poly(I:C) stimulation in human fibrosarcoma cells. The experimental action modes were then compared with the predicted action modes.
RESULTS
Implementation of the Probabilistic Model for (M, TF, TG) Triplet Prediction
We implemented an algorithm for predicting (M, TF, TG) triplets based on a compendium of 2158 expression profiles. The underlying probabilistic model (19) of triplet action depends on four basic parameters, αc, αf, αm, and γ, that correspond to the basal level of a TG, the dependence of TG expression on TF, the dependence on the M, and the interactive effect of the M and TF on the TG. For accurately predicting (M, TF, TG) triplets, two partial effects and one total effect of the M and TF on the TG were also estimated, respectively, by the parameters βm, βf, and αf + βm (“Experimental Procedures”). The existence of a functional (M, TF, TG) triplet is inferred if both γ̂ (the estimate of γ) and β̂m (the estimate of β̂m) are significantly different from zero. The corresponding p values were estimated as described under “Experimental Procedures.”
According to the estimated values of the parameters γ, αf, βf, and βm for the given triplet that correspond to the effect of TF on TG and the interactive effect of M and TF, the inferred triplets were categorized into one of six action modes: inhibition attenuation, inhibition enhancement, inhibition inversion, activation inversion, activation enhancement, and activation attenuation. Approximately 2% of the triplets did not have an assigned category because the estimated parameters did not pass the adopted significance thresholds. The unclassified triplets were not considered in further analysis. Among the modulators of NF-κB/RelA, 36% have prevalent action modes of their triplets, whereas other modulators act in many or all action modes. We formalized the distinction between specific and general modulators using the entropy of the distribution of the action modes as a measure of specificity. The entropy is compared with the entropy expected of a nonspecific modulator with the same number of affected targets (“Experimental Procedures”).
In three of the six action modes (inhibition attenuation, inhibition inversion, and activation enhancement), the parameter γ̂ is significantly positive, and the TG is predominantly up-regulated by M; that is, M is a dominant activator. Conversely, for inhibition enhancement, activation inversion, and activation attenuation, γ̂ is significantly negative, and the modulator is a dominant inhibitor.
Moreover, a modulator is classified as an agonist of NF-κB/RelA if it prevalently regulates the TGs in the same direction as NF-κB/RelA (up-up- or down-down-regulation), i.e. with inhibition enhancement and activation enhancement modes. Conversely, if M regulates its TGs prevalently in the opposite direction to NF-κB/RelA (up-down- or down-up-regulation) it is considered an antagonist. Note that a dominant activator can be an agonist or antagonist of NF-κB/RelA and likewise an inhibitor. For all four cases (activator, inhibitor, agonist, and antagonist), we used the hypergeometric test to assess the significance of the dominant category.
Input Data for Inferring NF-κB/RelA Modulatory Network
Our goal was to characterize the dependences between the modulators and corresponding target genes of NF-κB/RelA. We expected that the most significant (M, NF-κB/RelA, TG) triplets would contain modulators and TGs with prior association with NF-κB/RelA. Therefore, we focused on triplets in which the candidate modulator was independently indicated as an NF-κB/RelA interactor and the candidate target was a target gene of NF-κB/RelA. Using such restricted sets of candidate Ms and TGs allowed minimizing the false discovery rate in inferred triplets. Before the triplet prediction and the following modulatory network inference, NF-κB/RelA modulators (NF-κB/RelA-binding proteins) and the TG candidates were first collected as follows.
Candidate Modulators
We postulated that the modulators of NF-κB/RelA would be enriched in proteins physically interacting with the NF-κB/RelA protein. To identify candidate NF-κB/RelA modulators, we performed two independent LC-MS/MS experiments in which 365 NF-κB/RelA-associated proteins were identified (supplemental Data File S1, Sheets 2–4). Additional RelA interactors were found by mining the PIANA database resource (see “Experimental Procedures”) containing literature and other sources of data including the HPRD (39) and BioGRID databases (40) and existing RelA targets (TGs).3 We thus collected 297 proteins that have been previously reported to interact with NF-κB/RelA (supplemental Data File S1, Sheet 1). We refer to these 297 proteins as “previously known binding proteins” of NF-κB/RelA. There are 31 proteins present in both our LC-MS/MS data and the PIANA data set.
The functional categories enriched in the newly identified NF-κB/RelA-associated proteins are shown in Table 2. The mapped protein network of all newly identified NF-κB/RelA-associated proteins is shown in Fig. 2. Mapping the newly identified 365 NF-κB/RelA-associated proteins into the global protein-protein interaction network from the IntAct database (41) by PPI spider (42) shows that the most enriched pathways are TNF receptor signaling pathway and TNFα/NF-κB (supplemental Data File S3). It demonstrates the relevance of the experimentally identified proteins to the biological context of RelA association. Functional analysis of the newly identified RelA-binding proteins (supplemental Data File S3) confirms the established biological functions of NF-κB/RelA, such as enrichment in the following GO categories: response to DNA damage stimulus; cell cycle progress; post-transcriptional regulation of gene expression; regulation of translation; and regulation of protein ubiquitination, microtubule cytoskeleton, and chromatin organization.
TABLE 2.
Representative enriched functional categories of the new identified RelA associated proteins
| Functional categories | Protein name | p value | -Fold ratio |
|---|---|---|---|
| DNA binding factors and enzymes | |||
| DNA metabolic process | XRCC5, SSRP1, AIFM1, XRCC6, SMC3, MCM5, NONO, RFC5, TFAM, SET, MCM7, PPIA, SFPQ, TOP2A | 0.013 | 2.6 |
| DNA recombination | NONO, XRCC5, PPIA, SFPQ, XRCC6 | 0.044 | 4.6 |
| DNA integration | XRCC5, PPIA, XRCC6 | 0.009 | 16.9 |
| Response to DNA damage stimulus | RFC5, NONO, XRCC5, SSRP1, MCM7, MYO6, AIFM1, SFPQ, XRCC6, TOP2A, SMC3 | 0.032 | 2.7 |
| DNA ligation | XRCC6, TOP2A | 0.036 | 21.2 |
| DNA-dependent ATPase activity | RFC5, XRCC5, G3BP1, XRCC6, TOP2A | 0.002 | 10.0 |
| DNA helicase activity | XRCC5, MCM7, G3BP1, XRCC6 | 0.009 | 9.8 |
| RNA binding factors and enzymes | |||
| RNA binding | RALY, FUS, SRSF1, HNRPF, PNPT1, SRP68, HNRPR, RBP56, ELAV1, NEB1, HNRPM, HNRPL, FUBP1, NONO, FUBP2, FUBP3, DDX17, DDX28, DDX3X, PCBP1, PCBP2, DDX21, HNRPC, G3BP1, PTBP1, DDX1, NPM, TIM50, ILF3, NXF1, DDX5, RBMX, FXR1, SRSF2, PA2G4, PTRF, ILF2, SRSF6, SFPQ, PABP1, RBM39, MATR3, PUF60, THOC1 | 3.6e−19 | 5.8 |
| RNA metabolic process | RALY, FUS, SRSF1, HCD2, HNRPF, PNPT1, HNRPR, SMD2, ELAV1, NEB1, HNRPM, HNRPL, SF3B2, FUBP1, NONO, TFAM, FUBP2, SRRT, SF3B1, DDX17, PCBP1, PCBP2, DHX15, DDX21, CCAR1, HNRPC, PTBP1, DDX1, DDX5, RBMX, SF3A3, SRSF2, PA2G4, PTRF, SRSF6, SFPQ, PABP1, CPSF6, RBM39, PUF60, THOC1 | 6.6e−13 | 4.1 |
| RNA helicase activity | DDX17, DDX3X, G3BP1, DHX15, DDX1, DDX21, DDX5 | 2.6e−07 | 25.7 |
| Establishment of RNA localization | FUBP2, NUP93, NPM, NXF1, THOC1 | 3.9e−02 | 4.7 |
| Nuclear matrix and cytoskeleton components | |||
| Cytoskeleton | TARA, TLN1, LIMA1, ENAH, LMNB1, LMNB2, CBX3, TPM4, KIFC3, NUMA1, MACF1, ARPC3, KRT85, MYOF, KRT86, KIF2A, KIF11, MYO6, MYO1E, MAP1B, FLOT1, LMNA, NPM, RAI14, PALLD, KRT34, SMC3, VASP, DCTN1, DAPK1, MPRIP, H4, KRT36, CALM, SVIL, TMOD3, RBM39, ANX11, MYH10 | 4.5e−07 | 2. 7 |
| Cytoskeleton organization | TARA, LIMA1, TLN1, KIF11, CNN3, MAP1B, NPM, DOCK7, PALLD, SMC3, VASP, SVIL, EHD2, KRT86, BUB3, KIF2A | 4.6e−4 | 3.4 |
| Ribosome biogenesis | |||
| Ribosome biogenesis | PDCD11, GTPBP10, RPL24, SIRT1, FBL, RPS7, EIF4A3, PA2G4, RPS28, RPS16, RPL7, RPLP0, RPS14, NPM1, RPS15, DDX21 | 1.2e−2 | 3.6 |
| Ribosome | RPL18, RPL13, SRP68, CANX, MRPS31, RPS3, RPS3A, RPLP0, MRPL37, MRPL39, MRPL1, MRPL4, MRPL9, RPS4X, MRPS2, MRPS9, RPS16, RPS14, RPS15, MRPL49, RPS13, MRPL47, MRPL48, MRPL46, MRPL44, RPS15A, RPL38, GCN1L1, MRPL11, MRPL13, RPS28, MRPL12, RPL7, MRPL15, MRPL14, RPL9, MRPL17, NPM1, RPL3, RPS21, MRPS27, MRPS23, MRPS22, RPL27, RPL24, MRPS21, RPS7, RPL23, MRPL27, DAP3 | 3.0e−28 | 7.7 |
| Protein degradation | |||
| Proteasomal ubiquitin-dependent protein catabolic process | PCBP2, RPN1, GRP78, PSMD3, NPL4, BUB3 | 0.035 | 4.1 |
| Ubiquitin-protein ligase binding | TARA, PA2G4, PCBP2, GRP78 | 0.049 | 5.6 |
| Mitochondrial proteins | |||
| Mitochondrion | HCD2, CMC1, GPDM, PNPT1, SFXN3, SFXN1, PRDX3, PRDX1, COX5B, TFAM, ECHA, DDX28, MTCH2, PGAM5, QCR1, LACTB, ATP5H, ECHB, DNM1L, AIFM1, IMMT, THIL, IDH3B, TIM50, ILF3, VDAC2, IDH3A, ATAD1, P5CS, EFTU, LETM1, C1QBP, PTRF, PTCD3, PHB2, ATPO, CLPP, ADAS | 1.3e−7 | 2.9 |
FIGURE 2.

Mapped protein network of the newly identified RelA-associated proteins. The proteins are color-coded according to their corresponding functions or pathways.
The combined set of LC-MS/MS data and existing RelA-associated proteins contains 632 unique proteins. Within this group, the mRNA expression profiles are available for 620 of the proteins, and these were selected for further analysis (supplemental Data File S1, Sheet 5). Several factors may be responsible for the relatively small overlap (10%) between the literature-derived set and our LC-MS/MS experiments. Our experimental identification of NF-κB/RelA interactors was restricted to nuclear extract, and the results may have been affected by different experimental techniques, interaction sampling variety, and indirect binders of NF-κB/RelA identified by LC/MS spectrometry. However, as discussed above, the newly discovered set of RelA interactors exhibits properties characteristic of those previously known, expanding the set of experimentally verified NF-κB/RelA interactors by more than 2.5 times. We are confident that our work will be a very valuable contribution to elucidating NF-κB/RelA regulatory and modulatory networks.
Candidate Target Genes
The set of target genes used for triplet prediction has been compiled from two sources, our NF-κB/RelA ChIP-Seq experiments and literature mining. Our ChIP-Seq experiments (“Experimental Procedures” and Ref. 32) have identified 830 TGs of NF-κB/RelA. These newly identified TGs, ranked by confidence scores, are provided in supplemental Data File S2, Sheet 1. The literature search (“Experimental Procedures”) conducted to uncover possible additional TGs yielded 424 targets of NF-κB/RelA (supplemental Data File S2, Sheet 2). In total, 1194 unique NF-κB/RelA TGs were collected. 1182 of them had expression profiles available (supplemental Data File S2, Sheet 3). GO analysis of the newly identified NF-κB/RelA TGs confirmed that they have functional properties and are involved in biological processes that are characteristic for NF-κB/RelA target genes, such as response to stress, regulation of apoptosis, cell proliferation, differentiation, and intracellular signaling pathways.
Triplets Predicted Using the Candidate NF-κB/RelA Modulators and TGs of NF-κB/RelA
Using the above described sets of candidate NF-κB/RelA modulators and TGs of NF-κB/RelA, we inferred the 8349 (M, NF-κB/RelA, TG) regulatory triplets of the six action modes (supplemental Data File S4). At the current threshold, for the triplets that satisfy the three hypotheses H1, H2, and H3, there are 2% (196) outliers among the predicted triplets that do not belong to any of the six action modes. In these cases, α̂f and α̂f + β̂f are not significantly different from zero, whereas β̂f, γ, and β̂m are significantly different from zero. The modulators have main and interactive effects in the presence of the transcription factor, whereas the total effect is zero. Confounding factors may explain these cases. We excluded these types of modulators from all analyses and only considered the triplets with one of the six action modes. There is at least one predicted TG for 562 of the 620 binding proteins. The triplets and their parameters are listed in supplemental Data File S4. The action modes among the 8349 triplets are 1179 inhibition attenuation, 839 inhibition enhancement, 1042 inhibition inversion, 724 activation inversion, 2580 activation enhancement, and 1985 activation attenuation. The modulators act as agonists of RelA in 3419 triplets (839 inhibition enhancement plus 2580 activation enhancement) and as antagonists in 4930 triplets (inhibition attenuation, inhibition inversion, activation inversion, and activation attenuation). Similarly, in 4801 triplets, modulators up-regulate TGs, whereas in the remaining 3548 triplets, the modulators act as repressors to down-regulate TGs.
The 20 modulators with the greatest number of TGs and their targets are shown in Fig. 3. Among them, the top 10 specific modulators (filtered by the entropy of their action modes and not TGs of NF-κB/RelA themselves) are 1) glyceraldehyde-3-phosphate dehydrogenase (GAPDH), 2) estrogen receptor α (ESR1), 3) phosphatidylinositol-binding clathrin assembly protein (PICALM), 4) actin γ1 (ACTG1), 5) radixin (RDX), 6) transcription factor 4 (TCF4), 7) heterogeneous nuclear ribonucleoproteins C1/C2 (hnRNPC), 8) ribosome protein L38 (RPL38), 9) microtubule-actin connecting factor 1 (MACF1), and 10) and ATP synthase subunit γ (ATP5C1). The top 10 specific modulators and their distributions of action modes are visualized in Fig. 4.
FIGURE 3.

The triplets and action modes of the top 20 specific modulators. The color-coded edges denote the action mode. The pink ovals indicate the top 20 modulators, which include all the listed top 10 specific modulators in the main text.
We closely examined these top 10 NF-κB/RelA modulators and found that there are reports in the literature in support of each of them as bona fide NF-κB/RelA modulators. Moreover, the literature generally supports the prevalent action modes identified here.
Specifically, GAPDH participates in NF-κB signaling (43, 44). Recently, it has been reported that the mechanism is related to the role of GAPDH in TNF-induced NF-κB activation (45). This function may be disrupted during pathogen infection as an important virulence strategy used by attaching/effacing pathogens to inhibit the host NF-κB-dependent innate immune responses. Consistently, the predicted triplets demonstrate that as a modulator GAPDH predominantly activates NF-κB TGs. Specifically, 155 triplets are of activation enhancement mode and 101 are inhibition inversion.
ESR1 and NF-κB have been found to repress each other in a cell type-specific manner in several contexts (46, 47). Among the predicted 211 (ESR1, NF-κB/RelA, TG) triplets, 91 are activation attenuation (p = 1.1e−10), consistent with the observed repression of NF-κB activity by ESR1.
In a yeast Alzheimer disease model induced by secretory amyloid-β, a PICALM ortholog is involved in cellular toxicity by interacting with mitochondrion. Activation of the NF-κB pathway has been linked to amyloid-β neurotoxicity (48, 49) in both neuronal cells and microglial cells. Consistently, we predicted that the PICALM ortholog is a modulator of NF-κB with prevalent activation enhancement.
ACTG1 is one of the three isoforms of actin, and MACF1 is a microtubule and actin connecting factor involved in cytoskeleton dynamics homeostasis. Perturbation of cytoskeleton dynamics activates NF-κB (50, 51), which can be mediated by IκB degradation, p38 mitogen-activated protein kinase activation (51), or NADPH oxidase-dependent pathways (51).
RDX encodes radixin, a component of the ezrin-radixin-moesin (ERM) complex that acts as a linker between the actin cytoskeleton and plasma membrane proteins and signal transducers involved in cytoskeletal remodeling (52). In colon cancer cells, ERM is essential for L1 cell adhesion molecule (L1CALM)-mediated metastasis through activation of NF-κB (53). In THP-1 monocytes treated with TNFα, ERM rapidly translocates the RhoA small GTPase to the plasma membrane and induces actin polymerization through NF-κB (54). The predicted triplets of RDX demonstrate that it is an agonist of NF-κB transcriptional activity of which 38 exhibit inhibition enhancement and 31 exhibit activation enhancement (p = 1.9e−6).
TCF4 encodes the E2-2 protein, a member of the E2 box protein family, that is an essential and specific regulator of plasmacytoid dendritic cell development (55). One of the E2-2-associated proteins, Spi-B, regulates plasmacytoid dendritic cell survival through direct induction of the antiapoptotic gene BCL2A1 (56), which is also an important target gene of NF-κB. Consistently, TCF4 predominantly activates NF-κB in 51 of 106 predicted triplets with activation enhancement (p = 3.1e−8).
HNRNPC encodes hnRNPC1/C2, which mainly mediate nuclear mRNA retention in 40 S hnRNP particles by competing with exporting proteins as an mRNA length ruler (57). Direct modulation of hnRNPC1/C2 has not been reported. However, there are reports on modulation of NF-κB by alternative hnRNPs: hnRNPA1 enhances NF-κB activity through the mRNA stability of the modulator cIAP1 of NF-κB in HeLa cells (58). hnRNPU stabilizes the mRNA of the TGs regulated by NF-κB in the Toll-like receptor signaling pathway in macrophages (59). hnRNPU/hnRNPA1 are also involved in the stress response as components of a stress sensor complex, B23-hnRNPU-hnRNPA1 (60). hnRNPA1 attenuates NF-κB activity through demobilizing the mRNA level of cIAP1.
RPL38 was reported to be predominantly expressed in pancreatic ductal epithelium (61) and to perform transcript-specific translational control of HOX mRNA translation in mouse tissue patterning (62). No direct proof exists that RPL38 directly regulates NF-κB TGs. However, RPLS3 protein has been found to selectively regulate NF-κB TGs (63). Also, other ribosomal subunits have been previously implicated in selectively regulating NF-κB TGs. RPL38, in our prediction, prevalently attenuates the NF-κB TGs where 65 of 76 triplets are of activation attenuation (p = 0).
Direct binding of ATP5C1 and RelA has not been reported. Nevertheless, there is indirect evidence of an interaction including that both ATP5C1 and RelA were reported to interact with mediator complex subunit 15 (MED15/ARC105), an RNA polymerase II transcription cofactor activity involved in transcription initiation. These interactions were detected by yeast two-hybrid and pulldown assays, respectively, in Stelzl et al. (64) and Näär et al. (65). In a recent study of the transcriptional response to relaxation training, ATP5C1 was one of the top up-regulated critical molecule, and served as a hub in the interactive network of the relaxation response-affected pathway. At the same time, NF-κB TGs were the top down-regulated hubs (66). Consistently, 48 of 65 (ATP5C1, NF-κB/RelA, TG) triplets showed ATP5C1 to be a repressor, including 15 inhibition enhancement, 9 activation inversion, and 24 activation enhancement (p = 6.6e−8) (Fig. 4).
Thus, for most of the predicted modulators, the functional association with NF-κB/RelA is supported by the literature. These modulators may constitute key links in the cross-talk pathways modulating RelA/NF-κB activity in virus and bacterial infection, stress, immunity, and cancer. The pathways include mitochondrion (ATP5C1), estrogen receptor pathway, actin cytoskeleton organization (ACTG1, MACF1, and RDX), clathrin-mediated endocytosis (PICALM), and hnRNPC1/C2-mediated mRNA nuclear retention and genomic integrity.
The NF-κB/RelA Modulatory Network and Its Functional Characterization
Many of the above triplets may be intertwined in the same pathway. To unravel the organization of transcription regulated by NF-κB/RelA and its modulators, we constructed a modulatory network in which one type of nodes was modulators and the other was TGs of RelA. This modulator-target interaction network can be represented as a matrix whose rows are modulators and columns are TGs. The matrix elements correspond to the edges in the modulatory network, represented by the main effect of a modulator on a specific TG, βm. In this way, the association between any pair of modulators can be evaluated by their similar effect on all the TGs, and conversely, the association between two TGs can be assessed by their similar modulation by all the modulators. Subsequently, we used hierarchical biclustering to uncover the global organization of the modulatory network. The hierarchical approach to clustering was chosen because we expect that modulator-target interactions would reflect biological functions related to the NF-κB transcriptional activity, and such functions are known to form a nested structure. Such multilevel structure cannot be reflected by flat clustering methods, such as K-means, and most affinity propagation algorithms. Also, model-based clustering did not apply in this case because no a priori model of the complex and diverse interaction network is known.
Specifically, the rows and columns of this matrix were clustered using the agglomerative clustergram function from Matlab with default parameters. The M-TG network was parsed into a hierarchy of groups according to the similarity of the value of βm. The hierarchical clustering dendrograms and the heat maps for the βm matrix (Fig. 5) show obvious large modules. As shown in Fig. 5, modulators contain three dense clusters, A, B, and C. Also, the TGs show three main clusters (I, II, and III in Fig. 4). The lists of genes in these clusters are presented in supplemental Data File S5. Clustering according to γ̂ did not produce modules as obvious as βm, and using both βm and γ̂ did not improve the results (data not shown). Therefore, we based further analysis on clustering according to βm.
FIGURE 5.

Hierarchical clustering of the M-TG network. The dendrograms of both modulators (left) and target genes (top) are generated according to the values of β̂m (heat map). Outlined rectangles correspond to functional modules. The top enriched GO terms for clusters (A, B, C, I, II, and III) and modules (A-I, A-II, etc.) are listed in the insets.
The module composition and the significant triplets in each module are provided in supplemental Data File S5. We found that modulators in the positive correlation network modules tended to up-regulate the TGs in the same module, whereas the modulators in the negatively correlated network modules down-regulated the TGs in the same module (selected modules are presented in Fig. 6). To identify the function associated with each module, we analyzed the enrichment of GO terms within clusters found in the network of all binding proteins and all RelA TGs. First, we considered the network modules that show dominant positive correlations between the modulators from clusters A, B, and C and TGs from clusters I, II, and III (A-II, B-II, C-I, and C-III in Fig. 5), termed positive correlation network modules. For each positive correlation network module, we found GO terms enriched in both the set of modulators and TGs; this demonstrates the functionality of the module (Table 3). The functional annotations were characterized using BiNGO software (26) in Cytoscape (27).
FIGURE 6.

Action modes of the significant triplets in network modules A-I, A-II, B-I, and B-III. Rows represent modulators, and columns are TGs. Small squares are color-coded according to the action mode of the triplet composed by the corresponding modulator and the TG (the color scheme is the same as in Figs. 2 and 3: dark green, inhibition attenuation; light green, inhibition enhancement; yellow, inhibition inversion, light orange, activation inversion; dark orange, activation enhancement; red, activation attenuation). The numeric value in each square is the p value of β̂m. Only statistically significant triplets are provided.
TABLE 3.
Modules and their representatives of enriched GO categories
| Modules | Representatives of enriched GO categories |
|---|---|
| C-I | Regulation of cell death, positive regulation of apoptosis, response to chemical stimulus, regulation of TGFβ receptor pathway, aging |
| C-I-1 | Regulation of apoptosis, aging, cellular component organization, positive regulation of apoptosis |
| C-I-2 | Regulation of apoptosis, response to chemical stimulus |
| C-II | Regulation of cell death, cellular response to stimulus, regulation of cell cycle, multiorganism process, regulation of protein metabolic process, positive regulation of apoptosis |
| C-II-1 | Regulation of apoptosis, positive regulation of gene expression, protein modification process, response to organic substance |
| C-II-1a | Regulation of gene-specific transcription, positive regulation of molecular function, positive regulation of protein modification process, cellular response to stimulus |
| C-II-1b | Regulation of apoptosis, multiorganism process, positive regulation of apoptosis, regulation of cell cycle, regulation of cellular protein metabolic process |
| C-II-2 | Regulation of apoptosis, positive regulation of gene expression, protein modification process, response to organic substance |
| C-III | Cell cycle, mitotic cell cycle, cell cycle process, negative regulation of macromolecule biosynthetic process |
| B-I | Response to wounding, cell fat differentiation |
| B-II | Response to wounding, response to stress, positive regulation of biosynthetic process, organ development, regulation of cell differentiation, antiapoptosis |
| B-III | Negative regulation of biosynthetic process, negative regulation of gene expression |
| A-I | Regulation of transcription from polymerase II promoter |
| A-II | Positive regulation of transcription, regulation of primary metabolic process, protein metabolic process, multiorganism process |
As shown in Fig. 5 and supplemental Data File S6, the largest such module (C-I) consists of 296 annotated modulators and 261 positively modulated TGs (Fig. 5). 34 of 50 enriched GO terms of the TGs overlap with 385 enriched GO terms of modulators. For the 296 modulators in module C-I, the most significantly enriched biological processes with enrichment -fold ratio greater than 3.0, p < 0.001, and more than 20 modulators include RNA processing and splicing, translation, interspecies interaction between organisms, protein complex biogenesis and assembly, response to DNA damage stimuli (29 genes, 3.5-fold), cellular macromolecular complex assembly, generation of precursor metabolites and energy, regulation of cell cycle (28 genes, 5.5-fold), and positive regulation of protein metabolic process. In many cases, the enrichments for modulators are consistent with the observed functional enrichments of TGs in this module. First, a number of significant GO terms of TGs are also enriched for modulators (see supplemental Data File S6). These GO terms include regulation of cell death (42 TGs, 2.7-fold and 37 Ms, 2.1-fold), regulation of transcription from RNA polymerase II promoter, positive regulation of apoptosis (22 TGs and 24 Ms), positive regulation of transcription from RNA polymerase II promoter, response to chemical stimulus (46 TGs and 44 Ms), regulation of transforming growth factor β receptor signaling pathway (6 TGs and 5 Ms), response to stress (52 TGs and 55 Ms), cell death (26 TGs and 25 Ms), and regulation of binding and aging (9 TGs and 9 Ms). Additional consistency exists between the functions of Ms and TGs in the same modules even if not represented by the same GO term. For example, response to DNA damage stimuli (enriched in modulators) may result in cell death and affected cell proliferation, which are the most enriched GO terms of the regulated TGs mediated by gene-specific transcription, RNA splicing, and protein metabolism (supplemental Data File S6) (67) in NF-κB pathways.
For module C-III, which is composed of the same cluster of the 296 Ms, the most enriched GO categories are cell cycle, mitotic cell cycle, cell cycle process, and negative regulation of macromolecule biosynthetic process. Modules A-II and B-II are, respectively, composed of 44 and 32 annotated modulators as shown on the top of the map in Fig. 4. These modulators have a prevalent effect opposite to cluster C: the TGs down-regulated by cluster C (115 TGs in A-II and 165 TGs in B-II) are up-regulated here. For module A-II, cluster A is most enriched in translation, multiorganism process, ribosome biogenesis, cellular localization, and RNA processing. The 115 TGs of A-II are most enriched in antiapoptosis, cell activation, and cell proliferation in immunity and inflammation processes. Consistently, the overlap between the categories enriched by the Ms and TGs composing module A-II includes positive regulation of transcription, regulation of primary metabolic process, protein metabolic process, and multiorganism process. For module B-II, cluster B (in green in Fig. 5) is most enriched in antiapoptosis, glucose homeostasis, fat cell differentiation, embryonic development, response to wounding, cell cycle arrest, response to stress, and organ development. The 165 annotated TGs of B-II are mostly enriched in response to wounding, immune system process, defense response, cell migration, motility, and adhesion. Consistently, the overlap between the categories enriched by the Ms and TGs composing module A-II include response to wounding, positive regulation of biosynthetic process, organ development, regulation of cell differentiation, and antiapoptosis.
The constructed modulation network also contains four main negatively correlated network modules, C-II, A-I, B-I, and B-III, that were also analyzed. The modulator clusters are negatively correlated with the respective TG clusters (Table 3 and supplemental Data File S6). Among the overlapping GO categories that are the top significant categories for the TGs for C-II are regulation of cell death (rank 52), cellular response to stimulus, regulation of cell cycles, multiorganism process, regulation of protein metabolic process, and positive regulation of apoptosis. Besides, C-II is also enriched in other processes including immune system development, cellular response to chemical stimulus, hemopoiesis, regulation of protein metabolic process, regulation of cell cycle, multiorganism process, cell cycle arrest, placenta development, initiation of viral infection, maintenance of location, and phosphorylation.
As seen in Fig. 5 and Table 3, a finer hierarchy of submodules can be observed if deeper levels of clustering are considered for the modulation matrix. The functional annotations of these submodules do not differ significantly from their parent modules. Specifically, module C-II splits into C-II-1 and C-II-2 and further into C-II-1a and C-II-1b. The enriched GO categories for C-II-1 and C-II-2 are very similar and are consistent with the sub-submodules. For C-II-1a, the enriched GO categories are regulation of gene-specific transcription, positive regulation of molecular function and protein modification process, and cellular response to stimulus. For C-II-1b, the enriched GO categories are regulation of apoptosis, multiorganism process, positive regulation of apoptosis, regulation of cell cycle, and regulation of cellular protein metabolic process. Functional analysis shows that A-I is most enriched in transcription regulation, B-I is most enriched in response to wounding and fat cell differentiation, whereas B-III is most enriched in negative regulation of gene expression. Representative overlapping GO terms of A-I, B-I, and B-III can be found in supplemental Data File S6 and Fig. 5. Our analysis suggests that the functional organization of the modulatory network may reflect the mechanisms of the cooperation between different processes.
Validation of the Prediction Using Triplets Predicted from the Unconstrained TG Candidates
To validate the prediction method, we tested whether the predicted triplets were enriched in target genes obtained independently from the prediction. To this end, we applied the model allowing all genes as candidate targets of modulated regulation by NF-κB/RelA. Next, we selected all inferred target genes that had significant γ̂ and β̂m in at least one predicted triplet. Using p value thresholds between 1e−6 (for a low false positive rate) and 1e−3 (for a low false negative rate), we obtained between 4785 and 19,115 candidate genes dependent on the modulated regulation by NF-κB/RelA. Over the entire range, the predicted TGs are significantly enriched in the 830 targets of RelA identified by ChIP-Seq (Table 4). Also, the enrichments in the literature-derived and combined target lists are significant (see Tables 5 and 6).
TABLE 4.
Enrichment of the predicted TGs in the newly identified TGs from ChIP-Seq at different triplet detection thresholds
| −log10 (the p value of the model parameters γ̂ and β̂m) | p value of the enrichment | No. overlap | No. predicted TGs | Enrichment -fold ratio |
|---|---|---|---|---|
| 0.001 | 0 | 811 | 19,115 | 1.07 |
| 0.00032 | 0 | 780 | 16,941 | 1.17 |
| 0.0001 | 0 | 709 | 14,180 | 1.27 |
| 3.2e−05 | 0 | 608 | 11,263 | 1.37 |
| 1.0e−05 | 0 | 472 | 8,570 | 1.40 |
| 3.2e−06 | 4e−13 | 348 | 6,413 | 1.38 |
| 1.0e−06 | 1.3e−07 | 251 | 4,785 | 1.33 |
TABLE 5.
Enrichment of the predicted TGs in the existing TGs collected from database and literature at different triplet detection thresholds
| −log10 (the p value of the model parameters γ̂ and β̂m) | p value of the enrichment | No. overlap | No. predicted TGs | Enrichment -fold ratio |
|---|---|---|---|---|
| 0.001 | 1.2e−05 | 407 | 19,115 | 1.06 |
| 0.00032 | 0.0014 | 364 | 16,941 | 1.07 |
| 0.0001 | 0.0057 | 309 | 14,180 | 1.08 |
| 3.2e−05 | 0.0043 | 253 | 11,263 | 1.12 |
| 1.0e−05 | 0.024 | 192 | 8,570 | 1.11 |
| 3.2e−06 | 0.042 | 145 | 6,413 | 1.12 |
| 1.0e−06 | 0.031 | 112 | 4,785 | 1.16 |
TABLE 6.
Enrichment of the predicted TGs in the combined TGs at different triplet detection thresholds
| −log10 (the p value of the model parameters γ̂ and β̂m) | p value of the enrichment | No. overlap | No. predicted TGs | Enrichment -fold ratio |
|---|---|---|---|---|
| 0.001 | 0 | 1,148 | 19,115 | 1.07 |
| 0.00032 | 0 | 1,080 | 16,941 | 1.14 |
| 0.0001 | 0 | 961 | 14,180 | 1.21 |
| 3.2e−05 | 0 | 811 | 11,263 | 1.28 |
| 1.0e−05 | 0 | 630 | 8,570 | 1.31 |
| 3.2e−06 | 6.3e−12 | 466 | 6,413 | 1.29 |
| 1.0e−06 | 4.6e−08 | 345 | 4,785 | 1.28 |
Experimental Validation of the (STAT1, NF-κB/RelA, TG) Triplets from the Unconstrained TG Candidates
STAT1 is an important modulator of RelA as a proinflammatory effector. Acetylated STAT1 will repress the expression of antiapoptosis NF-κB target genes via binding RelA and nuclear export (38) as revealed by in situ immunofluorescence analysis. To verify the interaction between RelA and STAT1 in the nucleus, we used immunoprecipitation and quantitative stable isotope dilution-SRM-MS (31) in the samples obtained from the immunoprecipitation by anti-RelA antibody and nonspecific IgG (negative control) from the nuclear extract of A549 cells. The proteins associated with the antibodies were captured on protein A beads and subjected to LC-SRM-MS to quantify the level of STAT1 in each sample. Compared with the negative control sample, STAT1 was enriched ∼3.2-fold in the sample obtained from the immunoprecipitation of the anti-RelA antibody, indicating that STAT1 was directly associated with RelA. Thus, the interaction between STAT1 and RelA is confirmed by our SRM experiment (Fig. 7).
FIGURE 7.
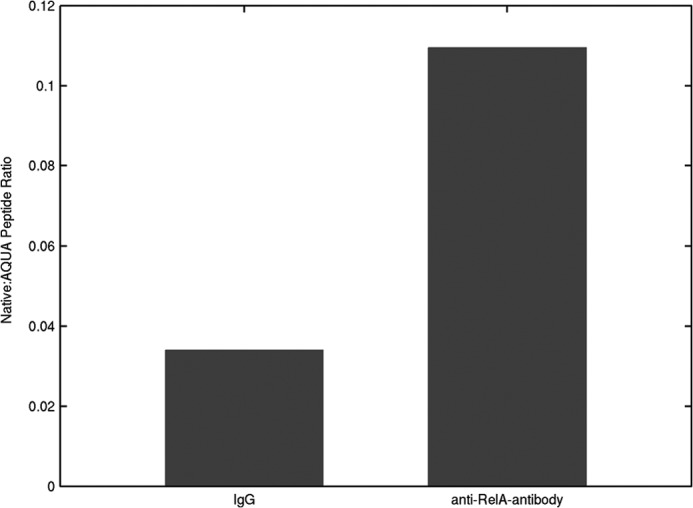
Validation of the association of STAT1 with RelA by SRM experiment. AQUA represents absolute protein quantitation using stable isotope-labeled synthetic peptides and HPLC-MS. AQUA peptide is a synthetic tryptic peptide corresponding to a peptide of interest.
As a modulator of NF-κB/RelA-regulated expression, STAT1 is also predicted to modulate 2450 genes at a threshold of p value of γ̂ and p value of β̂m smaller than 1e−2 in this study. We found that STAT1 modulates RelA-dependent gene transcription with multiple action modes depending on the TGs. To validate the predicted (STAT1, NF-κB/RelA, TG) triplets and their corresponding action modes, we selected 12 of the predicted TGs covering four action modes and p values of γ̂ and β̂m in the range from 0 to 1e−2 (see supplemental Data File S7). We predicted 31 triplets. The corresponding estimated false discovery rate is 0.19 at the thresholds. We conducted quantitative PCR experiments measuring mRNA expression of the 12 TGs in STAT1-deleted (U3A, STAT1−/−) and STAT1 wild-type cells (2f) stimulated with poly(I:C) as described under “Experimental Procedures.” We performed three independent quantitative PCR experiments for each triplet. 32% of the predicted triplets (10 of 31 triplets as shown in supplemental Data File S7) were validated by the experiment (p = 0.016 with binomial distribution test). The validated 10 triplets involve six TGs: EGF receptor kinase substrate 8 (EPS8), integrin αE (ITGA6), short stature homeobox 2 (SHOX2), and CCCH-type containing 7B (ZC3H7B), neurotrophin 4 (NTF4), and O-sialoglycoprotein endopeptidase-like (OSGEPL1). Considering that the estimated -fold discovery ratio at the model thresholds is 0.19, our prediction approach is effective. Because each gene has several probe sets, multiple triplets with different action modes may be predicted for each TG (supplemental Data File S7). For each TG, only the most significant triplet was kept. In this way, four of the 12 TGs were validated by the experiment with the same action mode. As shown in Fig. 8, four predicted TGs were fully confirmed along with the exact same action modes: EPS8, ITGA6, SHOX2, and ZC3H7B. Interestingly, the fully validated four TGs were among the highest ranked according to their p values of the probabilistic model parameter with ranks 1, 2, 4, and 6 (the prevalence of the highest ranking TGs is significant: p = 0.049 with rank sum test). The experimental results here justify our lower p value thresholds in triplet prediction from all the TGs and binding proteins of RelA.
FIGURE 8.

Experimental validation of the STAT1-modulated RelA-dependent genes and the corresponding action modes. Error bars represent S.E.
Although STAT1 is both a binding protein and TG of RelA as newly identified by us and thus involved in a feedback pathway, our analysis validated the predicted triplet action modes of STAT1-RelA. Considering the high noise of the candidate targets, which actually are quantified by gene expression profiles from the genome-wide genes, our proposed computational model is effective in generating testable general triplet hypotheses.
DISCUSSION
We used a combination of experimental and computational approaches to characterize the modulation of transcription regulated by NF-κB/RelA. We selected candidate modulators of NF-κB/RelA using LC-MS/MS and identified 365 binding proteins including 334 not previously reported. The identified modulators are functionally enriched in categories previously identified as related to NF-κB/RelA activity as well as novel ones, such as ATP synthesis-coupled electron transport, DNA helicase activity and conformation change, Ku70-Ku80 complex, RNA transport, oxidation-reduction, and cytoskeleton organization. Among the most significant enriched GO functions of the newly identified binding proteins and of the existing modulators are RNA processing (alternative splicing), cell cycle, mitochondrion, and ribosome biogenesis, which may be candidate alternative processes interdependent with the NF-κB/RelA pathways.
We implemented a probabilistic model for modulatory network inference that combines an earlier approach of GEM (19) with Shannon entropy filtering. Our method is selective for modulators with well defined prevalent action modes. Using this probabilistic model, we generated a network of 8349 (M, NF-κB/RelA, TG) triplets. The results have been validated by enrichments of predicted TGs in NF-κB/RelA targets identified in a ChIP-Seq experiment and by functional analysis of the identified regulations.
We discovered modules by hierarchical clustering of the regulatory network built from all the binding proteins and TGs. Some modulators might affect the rate of transcription of genes of all or any of NF-κB/RelA complex proteins themselves. In this case, the corresponding modified modulators are target genes themselves. We removed the feedback loop to avoid this type of modulator in our network analysis. Additional validation of the method comes from literature-based analysis of the functions of the top predicted modulators.
One of the predicted RelA modulators is STAT1, a member of the STAT family of transcription factors, which modulate NF-κB-mediated regulatory pathways in response to many cell stimuli and pathogens (38). Considering the important role of STAT1 in modulating RelA activity, we analyzed the predicted (STAT1, NF-κB/RelA, TG) triplets and validated their action modes by STAT1 deletion and quantitative real time PCR in human fibrosarcoma cells.
In conclusion, collecting all candidate binding proteins and the TGs of RelA (the main component of NF-κB complex) and predicting the (M, NF-κB/RelA, TG) triplets resulted in an integrated functional interaction network containing potential new mechanisms of NF-κB activity and specificity. Analysis of module organization of the modulation network may reveal mechanisms involved in the cooperation between different biological processes in immune responses, inflammation, cancer, and others. Identification of new mechanisms of RelA-dependent gene expression and related signaling pathways that cross-talk with NF-κB may provide guidance for the design of targeted therapeutics. The newly discovered 562 NF-κB/RelA modulators with distinct profiles of TGs may be potential drug targets. The modulatory network and its clusterings clarify mechanisms of achieving NF-κB/RelA specificity through modulators. Our computational and statistical approach can be readily applied to elucidate modulation of other transcription factors.
Supplementary Material
Acknowledgments
This study was conducted with the support of the Institute for Translational Sciences at the University of Texas Medical Branch. We thank Thomas Wood for performing the sequencing experiments. We thank Heather Lander for comments and editing of the manuscript.
This work was supported, in whole or in part, by National Institutes of Health Grants UL1TR000071, a clinical and translational science award from the National Center for Advancing Translational Sciences; N01-HV-00245 from the NHLBI; and AI062885 from the NIAID (to A. R. B.). This work was also supported by National Natural Science Foundation of China Grants 31271412 and 31371340 and Anhui Provincial Natural Science Foundation Grant 1208085MF96 (to X. L.).

This article contains supplemental Data Files S1–S7.
T. Gilmore, personal communication.
- M
- modulator
- TF
- transcription factor
- TG
- target gene
- ChIP-Seq
- chromatin immunoprecipitation followed by massively parallel DNA sequencing
- SRM
- selected reaction monitoring
- expO
- Expression Project for Oncology
- ACN
- acetonitrile
- GO
- gene ontology
- CDF
- cumulative distribution function
- PICALM
- phosphatidylinositol-binding clathrin assembly protein
- RDX
- radixin
- ESR1
- estrogen receptor α
- ACTG1
- actin γ1
- TCF4
- transcription factor 4
- hnRNP
- heterogeneous nuclear ribonucleoprotein
- RPL38
- ribosome protein L38
- MACF1
- microtubule-actin connecting factor 1
- ATP5C1
- ATP synthase subunit γ
- ERM
- ezrin-radixin-moesin
- EPS8
- EGF receptor kinase substrate 8
- ITGA6
- integrin αE
- SHOX2
- short stature homeobox 2
- ZC3H7B
- CCCH-type containing 7B
- PIANA
- Protein Interactions and Network Analysis.
REFERENCES
- 1. Baeuerle P. A., Henkel T. (1994) Function and activation of NF-κB in the immune system. Annu. Rev. Immunol. 12, 141–179 [DOI] [PubMed] [Google Scholar]
- 2. Barnes P. J., Karin M. (1997) Nuclear factor-κB: a pivotal transcription factor in chronic inflammatory diseases. N. Engl. J. Med. 336, 1066–1071 [DOI] [PubMed] [Google Scholar]
- 3. Wang T., Zhang X., Li J. J. (2002) The role of NF-κB in the regulation of cell stress responses. Int. Immunopharmacol. 2, 1509–1520 [DOI] [PubMed] [Google Scholar]
- 4. Jennewein C., Karl S., Baumann B., Micheau O., Debatin K. M., Fulda S. (2012) Identification of a novel pro-apoptotic role of NF-κB in the regulation of TRAIL- and CD95-mediated apoptosis of glioblastoma cells. Oncogene 31, 1468–1474 [DOI] [PubMed] [Google Scholar]
- 5. Parker M. H., von Maltzahn J., Bakkar N., Al-Joubori B., Ishibashi J., Guttridge D., Rudnicki M. A. (2012) MyoD-dependent regulation of NF-κB activity couples cell-cycle withdrawal to myogenic differentiation. Skelet. Muscle 2, 6. [DOI] [PMC free article] [PubMed] [Google Scholar] [Retracted]
- 6. Tak P. P., Firestein G. S. (2001) NF-κB: a key role in inflammatory diseases. J. Clin. Investig. 107, 7–11 [DOI] [PMC free article] [PubMed] [Google Scholar]
- 7. Dale E., Davis M., Faustman D. L. (2006) A role for transcription factor NF-κB in autoimmunity: possible interactions of genes, sex, and the immune response. Adv. Physiol. Educ. 30, 152–158 [DOI] [PubMed] [Google Scholar]
- 8. Lumeng C. N., Saltiel A. R. (2011) Inflammatory links between obesity and metabolic disease. J. Clin. Investig. 121, 2111–2117 [DOI] [PMC free article] [PubMed] [Google Scholar]
- 9. Karin M., Cao Y., Greten F. R., Li Z. W. (2002) NF-κB in cancer: from innocent bystander to major culprit. Nat. Rev. Cancer 2, 301–310 [DOI] [PubMed] [Google Scholar]
- 10. Oeckinghaus A., Hayden M. S., Ghosh S. (2011) Crosstalk in NF-κB signaling pathways. Nat. Immunol. 12, 695–708 [DOI] [PubMed] [Google Scholar]
- 11. Ghosh S., Hayden M. S. (2008) New regulators of NF-κB in inflammation. Nat. Rev. Immunol. 8, 837–848 [DOI] [PubMed] [Google Scholar]
- 12. Ravasi T., Suzuki H., Cannistraci C. V., Katayama S., Bajic V. B., Tan K., Akalin A., Schmeier S., Kanamori-Katayama M., Bertin N., Carninci P., Daub C. O., Forrest A. R., Gough J., Grimmond S., Han J. H., Hashimoto T., Hide W., Hofmann O., Kamburov A., Kaur M., Kawaji H., Kubosaki A., Lassmann T., van Nimwegen E., MacPherson C. R., Ogawa C., Radovanovic A., Schwartz A., Teasdale R. D., Tegnér J., Lenhard B., Teichmann S. A., Arakawa T., Ninomiya N., Murakami K., Tagami M., Fukuda S., Imamura K., Kai C., Ishihara R., Kitazume Y., Kawai J., Hume D. A., Ideker T., Hayashizaki Y. (2010) An atlas of combinatorial transcriptional regulation in mouse and man. Cell 140, 744–752 [DOI] [PMC free article] [PubMed] [Google Scholar]
- 13. Margolin A. A., Wang K., Lim W. K., Kustagi M., Nemenman I., Califano A. (2006) Reverse engineering cellular networks. Nat. Protoc. 1, 662–671 [DOI] [PubMed] [Google Scholar]
- 14. Zhang X., Zhao X. M., He K., Lu L., Cao Y., Liu J., Hao J. K., Liu Z. P., Chen L. (2012) Inferring gene regulatory networks from gene expression data by path consistency algorithm based on conditional mutual information. Bioinformatics 28, 98–104 [DOI] [PubMed] [Google Scholar]
- 15. Bauer T., Eils R., König R. (2011) RIP: the regulatory interaction predictor—a machine learning-based approach for predicting target genes of transcription factors. Bioinformatics 27, 2239–2247 [DOI] [PubMed] [Google Scholar]
- 16. Küffner R., Petri T., Tavakkolkhah P., Windhager L., Zimmer R. (2012) Inferring gene regulatory networks by ANOVA. Bioinformatics 28, 1376–1382 [DOI] [PubMed] [Google Scholar]
- 17. Marbach D., Roy S., Ay F., Meyer P. E., Candeias R., Kahveci T., Bristow C. A., Kellis M. (2012) Predictive regulatory models in Drosophila melanogaster by integrative inference of transcriptional networks. Genome Res. 22, 1334–1349 [DOI] [PMC free article] [PubMed] [Google Scholar]
- 18. Cheng C., Yan K.-K., Hwang W., Qian J., Bhardwaj N., Rozowsky J., Lu Z. J., Niu W., Alves P., Kato M., Snyder M., Gerstein M. (2011) Construction and analysis of an integrated regulatory network derived from high-throughput sequencing data. PLoS Comput. Biol. 7, e1002190. [DOI] [PMC free article] [PubMed] [Google Scholar]
- 19. Babur O., Demir E., Gönen M., Sander C., Dogrusoz U. (2010) Discovering modulators of gene expression. Nucleic Acids Res. 38, 5648–5656 [DOI] [PMC free article] [PubMed] [Google Scholar]
- 20. Luo W., Hankenson K. D., Woolf P. J. (2008) Learning transcriptional regulatory networks from high throughput gene expression data using continuous three-way mutual information. BMC Bioinformatics 9, 467. [DOI] [PMC free article] [PubMed] [Google Scholar]
- 21. Wang K., Saito M., Bisikirska B. C., Alvarez M. J., Lim W. K., Rajbhandari P., Shen Q., Nemenman I., Basso K., Margolin A. A., Klein U., Dalla-Favera R., Califano A. (2009) Genome-wide identification of post-translational modulators of transcription factor activity in human B cells. Nat. Biotechnol. 27, 829–839 [DOI] [PMC free article] [PubMed] [Google Scholar]
- 22. Hansen M., Everett L., Singh L., Hannenhalli S. (2010) Mimosa: mixture model of co-expression to detect modulators of regulatory interaction. Algorithms Mol. Biol. 5, 4. [DOI] [PMC free article] [PubMed] [Google Scholar]
- 23. Everett L. J., Jensen S. T., Hannenhalli S. (2011) Transcriptional regulation via TF-modifying enzymes: an integrative model-based analysis. Nucleic Acids Res. 39, e78. [DOI] [PMC free article] [PubMed] [Google Scholar]
- 24. Girvan M., Newman M. E. (2002) Community structure in social and biological networks. Proc. Natl. Acad. Sci. U.S.A. 99, 7821–7826 [DOI] [PMC free article] [PubMed] [Google Scholar]
- 25. Li Y., Liu L., Bai X., Cai H., Ji W., Guo D., Zhu Y. (2010) Comparative study of discretization methods of microarray data for inferring transcriptional regulatory networks. BMC Bioinformatics 11, 520. [DOI] [PMC free article] [PubMed] [Google Scholar]
- 26. Maere S., Heymans K., Kuiper M. (2005) BiNGO: a Cytoscape plugin to assess overrepresentation of gene ontology categories in biological networks. Bioinformatics 21, 3448–3449 [DOI] [PubMed] [Google Scholar]
- 27. Smoot M. E., Ono K., Ruscheinski J., Wang P. L., Ideker T. (2011) Cytoscape 2.8: new features for data integration and network visualization. Bioinformatics 27, 431–432 [DOI] [PMC free article] [PubMed] [Google Scholar]
- 28. Brasier A. R., Tian B., Jamaluddin M., Kalita M. K., Garofalo R. P., Lu M. (2011) RelA Ser 276 phosphorylation-coupled Lys 310 acetylation controls transcriptional elongation of inflammatory cytokines in RSV infection. J. Virol. 85, 11752–11769 [DOI] [PMC free article] [PubMed] [Google Scholar]
- 29. Forbus J., Spratt H., Wiktorowicz J., Wu Z., Boldogh I., Denner L., Kurosky A., Brasier R. C., Luxon B., Brasier A. R. (2006) Functional analysis of the nuclear proteome of human A549 alveolar epithelial cells by HPLC-high resolution 2D gel electrophoresis. Proteomics 6, 2656–2672 [DOI] [PubMed] [Google Scholar]
- 30. Tian B., Yang J., Brasier A. R. (2012) Two-step crosslinking for analysis of protein-chromatin interactions. Methods Mol. Biol. 809, 105–120 [DOI] [PMC free article] [PubMed] [Google Scholar]
- 31. Zhao Y., Widen S. G., Jamaluddin M., Tian B., Wood T. G., Edeh C. B., Brasier A. R. (2011) Quantification of activated NF-κB/RelA complexes using ssDNA aptamer affinity-stable isotope dilution-selected reaction monitoring-mass spectrometry. Mol. Cell. Proteomics 10, M111.008771. [DOI] [PMC free article] [PubMed] [Google Scholar]
- 32. Yang J., Mitra A., Dojer N., Fu S., Rowicka M., Brasier A. R. (2013) A probabilistic approach to learn chromatin architecture and accurate inference of the NF-κB/RelA regulatory network using ChIP-Seq. Nucleic Acids Res. 41, 7240–7259 [DOI] [PMC free article] [PubMed] [Google Scholar]
- 33. Ewing B., Hillier L., Wendl M. C., Green P. (1998) Base-calling of automated sequencer traces using phred. I. Accuracy assessment. Genome Res. 8, 175–185 [DOI] [PubMed] [Google Scholar]
- 34. Langmead B., Trapnell C., Pop M., Salzberg S. (2009) Ultrafast and memory-efficient alignment of short DNA sequences to the human genome. Genome Biol. 10, R25. [DOI] [PMC free article] [PubMed] [Google Scholar]
- 35. Zhang Y., Liu T., Meyer C. A., Eeckhoute J., Johnson D. S., Bernstein B. E., Nusbaum C., Myers R. M., Brown M., Li W., Liu X. S. (2008) Model-based analysis of ChIP-Seq (MACS). Genome Biol. 9, R137. [DOI] [PMC free article] [PubMed] [Google Scholar]
- 36. Flicek P., Amode M. R., Barrell D., Beal K., Brent S., Chen Y., Clapham P., Coates G., Fairley S., Fitzgerald S., Gordon L., Hendrix M., Hourlier T., Johnson N., Kähäri A., Keefe D., Keenan S., Kinsella R., Kokocinski F., Kulesha E., Larsson P., Longden I., McLaren W., Overduin B., Pritchard B., Riat H. S., Rios D., Ritchie G. R., Ruffier M., Schuster M., Sobral D., Spudich G., Tang Y. A., Trevanion S., Vandrovcova J., Vilella A. J., White S., Wilder S. P., Zadissa A., Zamora J., Aken B. L., Birney E., Cunningham F., Dunham I., Durbin R., Fernández-Suarez X. M., Herrero J., Hubbard T. J., Parker A., Proctor G., Vogel J., Searle S. M. (2011) Ensembl 2011. Nucleic Acids Res. 39, D800–D806 [DOI] [PMC free article] [PubMed] [Google Scholar]
- 37. Harrow J., Denoeud F., Frankish A., Reymond A., Chen C. K., Chrast J., Lagarde J., Gilbert J. G., Storey R., Swarbreck D., Rossier C., Ucla C., Hubbard T., Antonarakis S. E., Guigo R. (2006) GENCODE: producing a reference annotation for ENCODE. Genome Biol. 7, Suppl. 1, S4.1–9 [DOI] [PMC free article] [PubMed] [Google Scholar]
- 38. Krämer O. H., Baus D., Knauer S. K., Stein S., Jäger E., Stauber R. H., Grez M., Pfitzner E., Heinzel T. (2006) Acetylation of Stat1 modulates NF-κB activity. Genes Dev. 20, 473–485 [DOI] [PMC free article] [PubMed] [Google Scholar]
- 39. Keshava Prasad T. S., Goel R., Kandasamy K., Keerthikumar S., Kumar S., Mathivanan S., Telikicherla D., Raju R., Shafreen B., Venugopal A., Balakrishnan L., Marimuthu A., Banerjee S., Somanathan D. S., Sebastian A., Rani S., Ray S., Harrys Kishore C. J., Kanth S., Ahmed M., Kashyap M. K., Mohmood R., Ramachandra Y. L., Krishna V., Rahiman B. A., Mohan S., Ranganathan P., Ramabadran S., Chaerkady R., Pandey A. (2009) Human Protein Reference Database—2009 update. Nucleic Acids Res. 37, D767–D772 [DOI] [PMC free article] [PubMed] [Google Scholar]
- 40. Stark C., Breitkreutz B. J., Reguly T., Boucher L., Breitkreutz A., Tyers M. (2006) BioGRID: a general repository for interaction datasets. Nucleic Acids Res. 34, D535–D539 [DOI] [PMC free article] [PubMed] [Google Scholar]
- 41. Kerrien S., Aranda B., Breuza L., Bridge A., Broackes-Carter F., Chen C., Duesbury M., Dumousseau M., Feuermann M., Hinz U., Jandrasits C., Jimenez R. C., Khadake J., Mahadevan U., Masson P., Pedruzzi I., Pfeiffenberger E., Porras P., Raghunath A., Roechert B., Orchard S., Hermjakob H. (2012) The IntAct molecular interaction database in 2012. Nucleic Acids Res. 40, D841–D846 [DOI] [PMC free article] [PubMed] [Google Scholar]
- 42. Antonov A. V., Dietmann S., Rodchenkov I., Mewes H. W. (2009) PPI spider: a tool for the interpretation of proteomics data in the context of protein-protein interaction networks. Proteomics 9, 2740–2749 [DOI] [PubMed] [Google Scholar]
- 43. Bouwmeester T., Bauch A., Ruffner H., Angrand P. O., Bergamini G., Croughton K., Cruciat C., Eberhard D., Gagneur J., Ghidelli S., Hopf C., Huhse B., Mangano R., Michon A. M., Schirle M., Schlegl J., Schwab M., Stein M. A., Bauer A., Casari G., Drewes G., Gavin A. C., Jackson D. B., Joberty G., Neubauer G., Rick J., Kuster B., Superti-Furga G. (2004) A physical and functional map of the human TNF-α/NF-κB signal transduction pathway. Nat. Cell Biol. 6, 97–105 [DOI] [PubMed] [Google Scholar]
- 44. Mookherjee N., Lippert D. N., Hamill P., Falsafi R., Nijnik A., Kindrachuk J., Pistolic J., Gardy J., Miri P., Naseer M., Foster L. J., Hancock R. E. (2009) Intracellular receptor for human host defense peptide LL-37 in monocytes. J. Immunol. 183, 2688–2696 [DOI] [PubMed] [Google Scholar]
- 45. Gao X., Wang X., Pham T. H., Feuerbacher L. A., Lubos M. L., Huang M., Olsen R., Mushegian A., Slawson C., Hardwidge P. R. (2013) NleB, a bacterial effector with glycosyltransferase activity, targets GAPDH function to inhibit NF-κB activation. Cell Host Microbe 13, 87–99 [DOI] [PMC free article] [PubMed] [Google Scholar]
- 46. Stein B., Yang M. X. (1995) Repression of the interleukin-6 promoter by estrogen receptor is mediated by NF-κB and C/EBPβ. Mol. Cell. Biol. 15, 4971–4979 [DOI] [PMC free article] [PubMed] [Google Scholar]
- 47. Gionet N., Jansson D., Mader S., Pratt M. A. (2009) NF-κB and estrogen receptor α interactions: differential function in estrogen receptor-negative and -positive hormone-independent breast cancer cells. J. Cell. Biochem. 107, 448–459 [DOI] [PubMed] [Google Scholar]
- 48. Casal C., Serratosa J., Tusell J. M. (2004) Effects of β-AP peptides on activation of the transcription factor NF-κB and in cell proliferation in glial cell cultures. Neurosci. Res. 48, 315–323 [DOI] [PubMed] [Google Scholar]
- 49. Longpré F., Garneau P., Christen Y., Ramassamy C. (2006) Protection by EGb 761 against β-amyloid-induced neurotoxicity: involvement of NF-κB, SIRT1, and MAPKs pathways and inhibition of amyloid fibril formation. Free Radic. Biol. Med. 41, 1781–1794 [DOI] [PubMed] [Google Scholar]
- 50. Németh Z. H., Deitch E. A., Davidson M. T., Szabó C., Vizi E. S., Haskó G. (2004) Disruption of the actin cytoskeleton results in nuclear factor-κB activation and inflammatory mediator production in cultured human intestinal epithelial cells. J. Cell. Physiol. 200, 71–81 [DOI] [PubMed] [Google Scholar]
- 51. Kustermans G., El Benna J., Piette J., Legrand-Poels S. (2005) Perturbation of actin dynamics induces NF-κB activation in myelomonocytic cells through an NADPH oxidase-dependent pathway. Biochem. J. 387, 531–540 [DOI] [PMC free article] [PubMed] [Google Scholar]
- 52. Ivetic A., Ridley A. J. (2004) Ezrin/radixin/moesin proteins and Rho GTPase signalling in leucocytes. Immunology 112, 165–176 [DOI] [PMC free article] [PubMed] [Google Scholar]
- 53. Gavert N., Ben-Shmuel A., Lemmon V., Brabletz T., Ben-Ze'ev A. (2010) Nuclear factor-κB signaling and ezrin are essential for L1-mediated metastasis of colon cancer cells. J. Cell Sci. 123, 2135–2143 [DOI] [PMC free article] [PubMed] [Google Scholar]
- 54. Lim S., Ryu J., Shin J. A., Shin M. J., Ahn Y. K., Kim J. J., Han K. H. (2009) Tumor necrosis factor-α potentiates RhoA-mediated monocyte transmigratory activity in vivo at a picomolar level. Arterioscler. Thromb. Vasc. Biol. 29, 2138–2145 [DOI] [PubMed] [Google Scholar]
- 55. Cisse B., Caton M. L., Lehner M., Maeda T., Scheu S., Locksley R., Holmberg D., Zweier C., den Hollander N. S., Kant S. G., Holter W., Rauch A., Zhuang Y., Reizis B. (2008) Transcription factor E2-2 is an essential and specific regulator of plasmacytoid dendritic cell development. Cell 135, 37–48 [DOI] [PMC free article] [PubMed] [Google Scholar]
- 56. Karrich J. J., Balzarolo M., Schmidlin H., Libouban M., Nagasawa M., Gentek R., Kamihira S., Maeda T., Amsen D., Wolkers M. C., Blom B. (2012) The transcription factor Spi-B regulates human plasmacytoid dendritic cell survival through direct induction of the antiapoptotic gene BCL2-A1. Blood 119, 5191–5200 [DOI] [PubMed] [Google Scholar]
- 57. McCloskey A., Taniguchi I., Shinmyozu K., Ohno M. (2012) hnRNP C tetramer measures RNA length to classify RNA polymerase II transcripts for export. Science 335, 1643–1646 [DOI] [PubMed] [Google Scholar]
- 58. Zhao T. T., Graber T. E., Jordan L. E., Cloutier M., Lewis S. M., Goulet I., Côté J., Holcik M. (2009) hnRNP A1 regulates UV-induced NF-κB signalling through destabilization of cIAP1 mRNA. Cell Death Differ. 16, 244–252 [DOI] [PubMed] [Google Scholar]
- 59. Zhao W., Wang L., Zhang M., Wang P., Qi J., Zhang L., Gao C. (2012) Nuclear to cytoplasmic translocation of heterogeneous nuclear ribonucleoprotein U enhances TLR-induced proinflammatory cytokine production by stabilizing mRNAs in macrophages. J. Immunol. 188, 3179–3187 [DOI] [PubMed] [Google Scholar]
- 60. Yao Z., Duan S., Hou D., Wang W., Wang G., Liu Y., Wen L., Wu M. (2010) B23 acts as a nucleolar stress sensor and promotes cell survival through its dynamic interaction with hnRNPU and hnRNPA1. Oncogene 29, 1821–1834 [DOI] [PubMed] [Google Scholar]
- 61. Sahin F., Qiu W., Wilentz R. E., Iacobuzio-Donahue C. A., Grosmark A., Su G. H. (2005) RPL38, FOSL1, and UPP1 are predominantly expressed in the pancreatic ductal epithelium. Pancreas 30, 158–167 [DOI] [PMC free article] [PubMed] [Google Scholar]
- 62. Kondrashov N., Pusic A., Stumpf C. R., Shimizu K., Hsieh A. C., Xue S., Ishijima J., Shiroishi T., Barna M. (2011) Ribosome-mediated specificity in Hox mRNA translation and vertebrate tissue patterning. Cell 145, 383–397 [DOI] [PMC free article] [PubMed] [Google Scholar]
- 63. Wan F., Anderson D. E., Barnitz R. A., Snow A., Bidere N., Zheng L., Hegde V., Lam L. T., Staudt L. M., Levens D., Deutsch W. A., Lenardo M. J. (2007) Ribosomal protein S3: a KH domain subunit in NF-κB complexes that mediates selective gene regulation. Cell 131, 927–939 [DOI] [PubMed] [Google Scholar]
- 64. Rao S., Lee S. Y., Gutierrez A., Perrigoue J., Thapa R. J., Tu Z., Jeffers J. R., Rhodes M., Anderson S., Oravecz T., Hunger S. P., Timakhov R. A., Zhang R., Balachandran S., Zambetti G. P., Testa J. R., Look A. T., Wiest D. L. (2012) Inactivation of ribosomal protein L22 promotes transformation by induction of the stemness factor, Lin28B. Blood 120, 3764–3773 [DOI] [PMC free article] [PubMed] [Google Scholar]
- 65. Näär A. M., Beaurang P. A., Zhou S., Abraham S., Solomon W., Tjian R. (1999) Composite co-activator ARC mediates chromatin-directed transcriptional activation. Nature 398, 828–832 [DOI] [PubMed] [Google Scholar]
- 66. Bhasin M. K., Dusek J. A., Chang B. H., Joseph M. G., Denninger J. W., Fricchione G. L., Benson H., Libermann T. A. (2013) Relaxation response induces temporal transcriptome changes in energy metabolism, insulin secretion and inflammatory pathways. PLoS One 8, e62817. [DOI] [PMC free article] [PubMed] [Google Scholar]
- 67. Schwerk C., Schulze-Osthoff K. (2005) Regulation of apoptosis by alternative pre-mRNA splicing. Mol. Cell 19, 1–13 [DOI] [PubMed] [Google Scholar]
Associated Data
This section collects any data citations, data availability statements, or supplementary materials included in this article.