

Abstract
Stem cell activation and development is central to skeletal development, maintenance, and repair, as it is for all tissues. However, an integrated model of stem cell proliferation, differentiation, and transit between functional compartments has yet to evolve. In this paper, the authors review current concepts in stem cell biology and progenitor cell growth and differentiation kinetics in the context of bone formation. A cell-based modeling strategy is developed and offered as a tool for conceptual and quantitative exploration of the key kinetic variables and possible organizational hierarchies in bone tissue development and remodeling, as well as in tissue engineering strategies for bone repair.
THE PARADIGM OF STEM CELLS AND PROGENITOR CELLS
Stem cells and progenitors are essentially present in all normal tissues [1, 2, 3, 4, 5, 6, 7]. “Stem cells” are defined, in general, as resting cells (not actively proliferating) that are present in small numbers in normal tissues. They share one important feature: the capacity for “asymmetric” cell division and “self-renewal” [8, 9]. In this process, a stem cell is activated by some signal or event to leave its normal resting state and to divide. However, the result of this cell division provides two daughter cells that are not identical. One daughter cell proliferates symmetrically, often for many cell divisions, to produce an abundance of progeny referred to as progenitors. These progenitors subsequently differentiate to form a mature tissue. In contrast, the second daughter cell returns to the original resting state of the mother cell until a new activating signal or event occurs. It retains a stem cell phenotype and all of the capabilities of the original mother cell in a process referred to as “self-renewal.” This process is critically important to the preservation of the stem cell compartment. If both daughter cells were to become progenitors, then the pool of stem cells would be progressively depleted with each activation event. Such an outcome would rapidly deplete the stem cell population that is necessary to support ongoing tissue remodeling and repair required for long-term health.
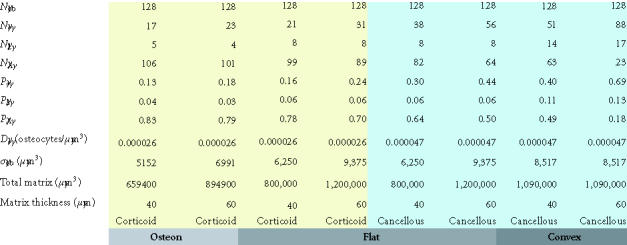
Table 2.
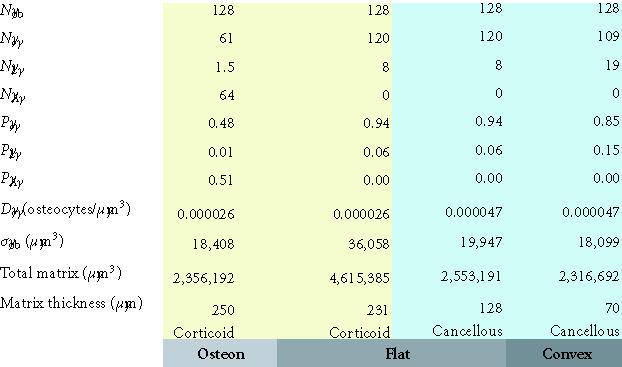
Maximum matrix thickness of new bone formation on a concave, flat, or convex surface. This table illustrates the maximum theoretical thickness of new bone formation for the 128 cells illustrated in each geometric configuration shown in Figures 8a, 8b, and 8c. For flat and convex surfaces, the limit occurs when osteoblasts become osteocytes and lining cells and no osteoblast undergoes apoptosis (ρA = 0). In contrast, in the concave configuration of an osteon, the thickness is limited by the maximum diameter of a cylinder that can be occupied by a single row of 128 osteoblasts (∼ 250 μm). In this case, approximately half of the initial osteoblasts must still undergo apoptosis if the observed osteocyte density is to be maintained at or near the normal osteocyte density in cortical bone.
During embryonic development, cells of the inner mass of the blastocyst retain the capability to regenerate an entire individual, and are therefore “totipotent” in their differentiation potential. However, convention has held that as the progeny of these totipotent stem cells become dispersed throughout the organism and localized within specific tissues or organs, the stem cells in each of these tissues become progressively determined and confined transiently or permanently within defined stem cell compartments or niches. Stem cell populations initially become committed as “pleuripotent” stem cells confined to selected groups of tissues within a developing embryo (endoderm, ectoderm, or mesoderm). As development proceeds, some stem cell populations may remain “multipotent,” capable of differentiation along one of several cell lineages (eg, cell populations in the neural tube, neural crest cells, hemangioblasts, and the mesenchymal mass of fetal limb buds). Other stem cell populations become intrinsically limited to the generation of only one mature cell type (eg, intestinal endothelium or skin keratinocytes). Such monopotent or unipotent stem cells were considered to be “committed,” “restricted,” or “determined” as a result of irreversible changes in the cell nucleus.
The transient pleuripotent and multipotent stem cell populations of embryonic and fetal life have appeared to disappear in postnatal life, leaving behind populations of more restricted adult stem cells that support virtually every organ system (eg, skin, intestinal mucosa, liver, vascular endothelium, the central nervous system, hematopoietic stem cells in bone marrow, and connective tissue or mesenchymal stem cells) [1, 2, 3, 4, 5, 6, 7]. These adult stem cell populations are of central importance in adult health and in all settings requiring tissue repair, remodeling, or regeneration. In fact, the health of a given tissue might even be defined by the state and kinetics of the supporting infrastructure of stem cells and progenitors.
The progressive restriction of stem cells from embryonic stem cells, to fetal stem cells to adult stem cells, to terminally differentiating cells, and to eventual cell death can be seen as a series of progressive transitions as cells move from one defined population to another. Cell proliferation is an integral part of this process. The period of residence or life-span of cells within each compartment or the process of transition or “transit” between compartments is often associated with cycles of cell division, and proliferation is not always followed by terminal differentiation. The dramatic and rapid expansion of tissue mass and stem cell diversity that is associated with embryonic development, as well as fetal and postnatal growth, also requires expansion of stem cell populations as much as diversification. Therefore, stem cells must not be limited to only asymmetric cell division. Stem cell expansion requires “symmetric” stem cell division or “self-expansion,” as discussed below.
Challenges to the traditional stem cell paradigm
In recent years, a number of lines of observation have challenged some of the traditional views of lineage restriction among adult stem cell pools. For example, cloning by transfer of somatic nuclei into activated oocytes provides evidence that the apparent restriction of somatic cells may be regulated by factors that are extrinsic to the nucleus [10]. However, the mechanism of reversibility induced by the cytoplasmic environment of an activated oocyte may not be relevant to events in normal stem cell physiology.
Of more physiologic relevance, are a number of observations that suggest that adult mammals may retain one or more stem cell populations which either retain the multipotent or pleuripotent biological potential or can be induced to exhibit such potential. Several reports have demonstrated that, following transplantation of marrow-derived cells or enriched marrow-derived hematopoietic stem cells (HSC), donor-derived cells can be detected contributing to hepatocyte and biliary epithelium [11, 12, 13], cardiac myocytes [14, 15], skeletal myocytes [16, 17], lung, intestinal, and skin epithelium [18], and neuroectoderm [19, 20, 21, 22]. Others have shown that neural-derived [23, 24] or muscle-derived [25, 26] cells can contribute to hematopoiesis. Similarly, several reports have demonstrated that culture-expanded bone marrow-derived cells [27] may contribute to a broad range of tissues [28, 29], such as skeletal muscle [29, 30], cardiac muscle [31, 32], liver [12, 33, 34], intestinal mucosa [35], lung [36], vascular endothelial cells [37, 38, 39, 40], bone and cartilage [41, 42], glial and neuronal tissues [43, 44], and other sites [45]. Multipotentiality has also been reported in cells derived from muscle [46, 47] and fat [7].
Most recently, a multipotent adult progenitor cell (MAPC) has been proposed [18], based on evidence that some cells from adult marrow can be expanded for over 80 population doublings, and if transplanted into a blastocyst will contribute to the tissue of all three germ layers. Furthermore, these authors report that cells expanded in this way can be infused into a mouse host and can be found to engraft and contribute to blood, bone marrow, spleen as well as epithelium in lung, liver, and intestine.
These results all suggest that adult mammals may retain one or more populations of adult progenitor cells that retain the intrinsic biological potential to generate progeny which can potentially differentiate into many endodermally, mesodermally, and/or ectodermally derived mature tissues. However, several possible mechanisms could contribute to these observations. One possibility is that a small number of intrinsically multipotential cells may persist in marrow and other tissue niches. These cells might be quiescent in adults or may function upstream of more easily identified stem cell pools. If so, they might be present in very low abundance and function with a very low turnover rate and still feed into or supplement more restricted downstream adult stem cell populations. It is also possible that the apparent restriction of most, if not all, stem cells in marrow and in other tissues, may be imposed by factors extrinsic to the stem cell. The stem cell niche and milieu within each organ system may define the phenotype(s) expressed by the local stem cell pool, as a result of the unique signaling environment from the local matrix, cytokines, and cell-cell interactions in each tissue. Changing the niche of a stem cell pool, by transplantation into a new niche or exposing a stem cell to unique tissue culture conditions, may unmask a broader intrinsic biological potential. Finally, it is possible that the observed properties of a stem cell pool might be changed through selective pressures that exist during prolonged in vitro culture or during radical procedures such as transplantation.
Regardless of the mechanism(s) that are at work, these recent observations are of tremendous interest for those who would seek to develop stem cell therapy strategies using adult cells [48]. All of the diverse stem cell populations that reside in or can be derived from adult tissues have potential value in therapeutic efforts to regenerate, preserve, or repair tissues. This fact also presents a challenge to the stem cell field to define practical strategies for characterizing and modeling the kinetics of stem cell function and various stem cell populations during normal tissue formation and remodeling, as well as in settings of repair. These models must include means of accommodating additional and as yet uncharacterized pools of stem cells as well as more fluid relationships between stem cell pools than have previously been recognized.
Recognizing this need, this paper presents the rationale for and development of a practical model system relevant to investigation of the kinetics of the stem cell populations contributing to the formation and remodeling of bone tissue. The conceptual starting point for this discussion is the relatively traditional vision of the life cycle of a stem cell and its progeny; it is illustrated in Figure 1. In this model, functionality of stem cell and its progeny is regulated by five primary events or behaviors: activation, proliferation, migration, differentiation, and survival (or death). Once introduced, the model is then further developed to incorporate strategies that accommodate concepts of multiple stem cell pools or transit populations and the relationships between these stem cells and transit cell pools.
Figure 1.
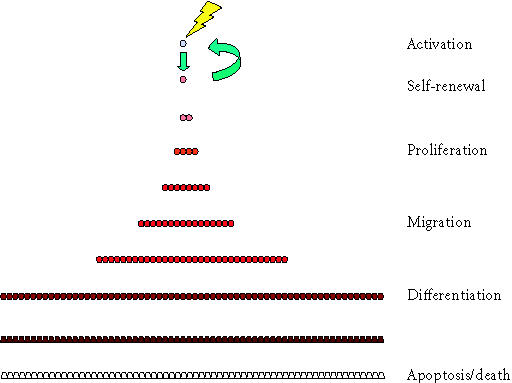
Six stages in the stem cell life cycle. In the simplest scenario, the life cycle of cells in a stem cell system involves at least six stages. This begins with the cycle of stem cell activation and cell division producing a progenitor cell and self-renewal of the stem cell, but is continuous with the process of proliferation of progenitors, migration, differentiation, and eventual apoptosis or cell death.
Bone formation and the connective tissue stem cell system
Background and terminology
In the 1960s, Burwell showed that the bone formation induced by implantation of cancellous bone grafts was derived from primitive osteogenic cells in bone marrow [49, 50, 51]. Friedenstein et al [52] showed that new bone was formed by proliferative fibroblast-like marrow cells and that the number of these proliferative cells could be assayed by counting the number of fibroblastic colony forming units (CFU-Fs) in vitro. It was later shown that, at least some of these colony forming cells are multipotent and can differentiate into bone, cartilage, fibrous tissue, fat, or muscle [41, 42]. Several reviews nicely summarize the many contributions in this field [42, 53, 54, 55, 56, 57].
Many names have been used to describe the colony forming cells found in bone marrow, periosteum, or trabecular bone, in addition to CFU-Fs. These terms include mechanocytes, bone marrow stromal cells, and mesenchymal stem cells, although the precise definition and biologic capabilities ascribed by these terms are not entirely synonymous. A large subset of the colony forming population has been suggested to be resident in tissue in a quiescent (Go) state in vivo, supporting the concept that these cells may have stem cell-like function and self-renewal potential [58].
We have previously proposed and provided the rationale for the term connective tissue progenitors (CTPs) for the heterogeneous population of proliferative cells that can be harvested from bone marrow and other tissues, and can be shown to differentiate into one or more connective tissue phenotypes [59]. (See Figure 2.) We use the term CTP throughout the following discussion. This term recognizes that these tissue-derived cells are not a pure or uniform population, and may be derived from more than one pool of stem cells and progenitors in native tissues. These cells may include true resting multipotent stem cells that become activated after harvest and are capable of self-renewal. However, colonies may also be formed by cells that are already proliferating in vivo, that lack self-renewal capabilities and may exhibit intrinsic commitment to various stages of diverse lineages [53, 57, 60]. This diversity can be a source of frustration for those looking for homogeneous purified populations of cells. However, this diversity can also be a source of valuable information which can be dissected experimentally using in vitro CFU assays to understand variation in intrinsic properties, the prevalence and kinetics of various connective tissue stem cell populations, and how these populations change with aging, gender, disease states, pharmacologic intervention, and tissue engineering strategies [59, 61, 62, 63].
Figure 2.
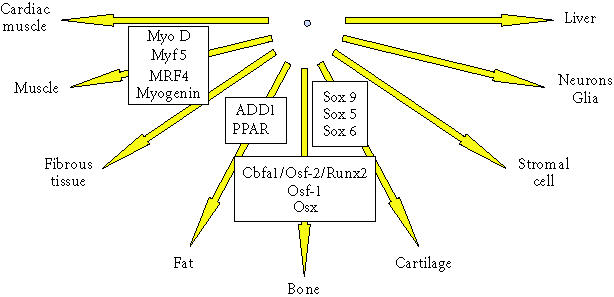
Differentiation pathways for connective tissue progenitors. This diagram illustrates the potential differentiation pathways available to connective tissue progenitor cells. Some of the transcription factors that regulate these pathways are shown in associated boxes.
Adult connective tissue progenitor populations
Multipotent CTPs are resident in many musculoskeletal locations. The osteogenic and chondrogenic potential of periosteum, as recognized long ago [64], is derived from cells resident in the outer cambial layer of periosteum [65, 66, 67]. Multipotent CTPs are present on the surface of bone trabeculae, in peritrabecular soft tissues, within haversian canals of cortical bone, and in the bone marrow space, including bone marrow harvested by aspiration [62]. Recently, CTPs have also been demonstrated to be resident in adipose tissue [7, 68] and muscle [46].
A potentially unifying concept to explain the presence of CTPs in fat, muscle, and other tissues is the presence in each of vascular pericytes. The pericyte, a unique cell found outside the basement membrane of small blood vessels, is present in all vascularized tissues. Several investigators have found that pericytes isolated from many tissues can be induced to differentiate into various connective tissue phenotypes [69, 70], suggesting that pericytes may represent a widely distributed population of multipotent CTPs. In bone marrow, pericytes may give rise to the Westen-Bainton cells, fibroblast-like marrow stromal cells associated with the outer surface of marrow sinusoids expressing alkaline phosphatase [71]. Bianco et al [72, 73, 74] have suggested that pericytes and Westen-Bainton cells are part of an integrated system of stem and progenitor cells in bone marrow. They argue that these two cell types contribute to the formation of the fibroblastic stromal network in marrow that supports hematopoiesis and to the formation and remodeling of marrow fat as well as of cortical and trabecular bone (Figure 3). However, the pericyte alone does not account for all the progenitors outside bone. Satellite cells harvested by digestion of isolated skeletal muscle fibers can undergo connective tissue differentiation independent of the pericyte population [6, 75].
Figure 3.

Schematic diagram of the osteoblastic stem cell system. This conceptual drawing illustrates the primary candidate populations of stem cells and transit cells thought to be associated with bone formation and remodeling. Vascular pericytes (green), Westen-Bainton cells (orange), type I or pre-osteoblasts (pink), secretory osteoblasts (maroon), osteocytes (brown), lining cells (purple), and adipocytes (yellow). Vascular pericytes may give rise to the Westen-Bainton cells. Pericytes and Westen-Bainton cells may contribute to the formation of pre-osteoblasts and also adipocytes. New osteoblast are added in the region immediately behind the advancing front of osteoclastic resorption. Secretory osteoblasts produce new bone matrix until they become quiescent on the surface of bone as a lining cells (purple) or become embedded in the matrix as osteocytes (brown), or die via apoptosis. Osteoclast formation is also illustrated. A fraction of the monocytes population in systemic circulation (blue) will become resident in the bone marrow space. Osteoclasts are formed by fusion of monocytes resident in bone marrow to form multinucleated functional units. The nuclei in active osteoclasts continue to be turned over as a result of nuclear loss and ongoing fusion events with new marrow-derived monocytes [103]. The black arrow indicates the direction of bone resorption by the osteoclastic front, followed by bone formation.
The widespread distribution of multipotent CTPs is particularly relevant to the field of orthopedic tissue engineering. It provides many potential sources of stem cells and progenitors that can be harvested, selected, concentrated, and manipulated or “engineered” to improve clinical outcomes. This system also provides many potential biologic targets for specialized matrix materials and locally or systemically active pharmaceuticals, hormones, growth factors, and cytokines. Moreover, it offers a fertile system in which to explore possible intrinsic differences between CTPs in these disparate and distinct stem cell/progenitor cell compartments, as well as the unique features of the stem cell niches within each compartment.
THE MATRIX-BASED MODEL FOR BONE TISSUE FORMATION AND REMODELING
A remarkable set of histologic observations and the application of innovative and painstaking methods of quantitative histomorphometry pioneered by Parfitt and Frost have provided a robust understanding of the functional and dynamic parameters associated with bone formation and remodeling at the tissue level [76, 77, 78, 79, 80]. In adult bone remodeling, these processes of bone formation and bone resorption generally take place in the context of the basic multicellular unit (BMU) described by Frost [81]. A conceptual illustration of one BMU is presented in Figure 3.
In an average BMU, a group of 6–10 osteoclasts moves forward resorbing bone at a linear rate of approximately 20–40 μm per day. This group of osteoclasts constitutes a “cutting cone” and will continue to erode bone for a period of as long as 100 days. The deepest point in the eroded surface marks the trailing edge of the osteoclast front, and is usually about 200 μm behind the first osteoclast.
The wave of bone resorption is followed immediately by a wave of bone formation that is mediated by osteoblasts. Osteoblasts are rapidly added to the newly eroded bone surface very near the trailing edge of the osteoclast front at a rate that is sufficient to cover the surface of the newly eroded bone. Osteoblasts begin secreting matrix within a day, and matrix synthesis increases over several days to a maximum rate of approximately 1.5 μm per day over an area of approximately 150 μm2 per osteoblast, resulting in a maximal rate of synthesis of approximately 225 μm3 per day per osteoblast. The wave of osteogenesis fills in the defect created by the osteoclasts, a depth of about 40–60 μm, over a period of about 50 days. The total matrix synthesis per osteoblast is therefore approximately 6000–9000 μm3, or 3–5 times its cell volume. Areas of increased osteoblast density (smaller surface area per osteoblast) are associated with proportionately increased linear rates of matrix synthesis [82]. In a fully active BMU, approximately 2000 active osteoblasts will be assembled as a functional unit behind the bone resorption front, trailing over a distance of 1600–2000 μm.
During the process of bone formation, some osteoblasts become embedded in the newly synthesized matrix as osteocytes. These osteocytes reside within cavities known as lacunae and interconnect with one another through multiple processes extending through an interconnected plexus of channels called canaliculi. Some osteoblasts also undergo apoptosis. The osteoblasts remaining on the bone surface gradually cease making new matrix and spread out as lining cells to occupy a surface area of approximately 2500 μm2, or about 16 times the area of a secretory osteoblast. Therefore, the mean life-span of an osteoblast is slightly less than the 50 days needed to complete the wave of bone formation, probably about 40 days. However, published estimates of mean osteoblast life-span vary widely from 10 to 100 days [59, 83, 84].
In contrast, both the lining cells and the osteocytes created in this process appear to survive for a long period, usually until the next wave of bone remodeling moves through the region. The mean life-span of osteocytes has been estimated to be 15 years in cancellous bone (∼ 5000 days) [85] and 25 years in cortical bone (∼ 9000 days) [86, 87], with a range of 3 to 30 years (1000–10,000 days). However, osteocytes can be lost before remodeling occurs, leaving lacunae empty through processes of osteonecrosis or micropetrosis [88].
In general, after skeletal maturity, bone formation does not occur without the prior stimulus of bone resorption. Therefore, the gain or loss of bone in a region of tissue is dependent primarily on the balance of resorption and formation in the individual BMUs. However, new bone formation can occur without bone resorption on periosteal surfaces and occasionally within nonbone sites in soft tissues (heterotopic bone formation) and even in perivascular tissues (Gorski JP and Midura RJ, unpublished data).
The number of BMUs within any region of bone tissue will depend on the rate of activation events in that tissue volume, and varies widely from region to region, bone to bone, and individual to individual, but can be estimated using techniques of fluorochrome double labeling, described first by Frost [78]. The number of osteoblasts per unit volume of bone will also vary widely, but can be estimated based on measurements of the surface to volume ratio in the region of interest, the area fraction of the surface that is occupied by osteoblasts, and the mean area of an osteoblast. Similarly, the number of osteocytes per unit volume can be estimated based on the volume fraction of bone in a region and the mean osteocyte density in the region.
Data with respect to osteocyte density (Do) is available with increasing precision. An age-related decline in osteocyte viability was observed long ago [87], as well as the possibility that many canaliculi and some empty lacunae may become filled with mineralized debris (micropetrosis) [87]. A study of iliac cancellous bone samples taken from skeletally healthy white women (age 20–73), found no evidence of age-related changes in osteocyte density near the surface of bone (< 25 μm), while an age-related decline was seen in deeper regions in bone [89].
The osteocyte density (Do) is reported to be greater in cancellous bone (0.000047 osteocytes/μm3) [90] than in cortical bone (0.000026 osteocytes/μm3) [91]. Estimates of osteocyte density as low as 0.000013 osteocytes/μm3 have been reported in the human iliac crest [92] and it has been suggested that osteocyte density may be increased in the setting of osteoporosis [93, 94]. However, as a first approximation, based on a mean bone volume of 11 to 25% in cancellous bone, one can estimate the number of osteocytes in one cubic centimeter of cancellous bone to be in the range of 5 to 10 million.
A concise review of these concepts and mechanisms involved in the regulation of cellular activity in bone remodeling has been provided recently by Manolagas [84].
A THEORETICAL CELL-BASED MODEL FOR BONE TISSUE FORMATION AND REMODELING
Available knowledge of the likely stem cell and progenitor cell populations in bone and the biologic pathways that are available to progenitors of osteoblasts and osteoclasts provides a useful structure in which to explore the biologic events using a cell-based approach, focusing on the key variables in stem cell kinetics associated with bone remodeling. A cell-based approach has been the starting point for many other stem cell systems where the volume of matrix and matrix turnover does not dominate organ function. However, application of these strategies in the skin, intestinal mucosa, and the cartilaginous growth plate in long bones has been facilitated by the relative ease of histologic assessment in these systems, the limited number of cell types in these tissues, and the close physical proximity of the stem cell compartment and maturing cells in these systems [95, 96, 97, 98, 99, 100].
A cell-based mathematical model system requires a functional understanding of the stem cell and progenitor cell populations in the system in order to generate a mathematical strategy that has fidelity to the objective hierarchy and kinetic parameters governing the cell populations involved. The cellular heterogeneity and three-dimensional complexity of bone have hindered this kind of investigation in bone. However, the extensive literature in bone morphology and the established matrix-based model for the kinetics of bone matrix turnover, provide a robust set of data and parameters that facilitate this approach, despite its apparent complexity.
Exploration using a cell-based strategy is necessary in order to provide insight into the kinetics of stem cell and progenitor cell populations upstream and downstream of osteoblasts and osteoclasts. This approach will also be critical as a platform for rational analysis of the CTP population present in bone and other tissues, for understanding the response of CTPs tissue in injury and repair, and in the rational design of strategies to use CTPs therapeutically to augment or induce the repair and regeneration of bone and other tissues.
In a previous publication, we introduced a cell-based modeling strategy for bone formation, and applied this model to explore the likely range of some kinetic parameters in the setting of bone grafting and bone remodeling [59]. In this paper, we expand upon this approach to further explore key variables in bone formation and remodeling, and particularly the relationship between stem cell pools in bone and the transit of cells from one pool to another. Although the discussion below is particularly focused on bone, it is expected that similar concepts will apply to the regeneration or repair of any tissue that might be derived from connective tissue stem cells and CTPs, and may also find application in modeling of stem cell pools in other organ systems.
Tissue formation and remodeling
In any region of tissue regeneration, repair, or remodeling, the quantity of new tissue formed (T) will represent the difference between the amount of tissue formed (F) and the amount of tissue simultaneously lost due to resorption or removal (R):
 |
(1) |
This balance between formation and resorption of bone in an idealized system of tissue remodeling is a central theme in the pathogenesis of age-related bone loss and postmenopausal osteoporosis. Similarly, the balance of tissue formation or the rate of tissue formation (or loss) can be represented as difference between the rate of tissue formation and the rate of tissue loss:
 |
(2) |
Under steady state conditions, the rate of formation will equal the rate of resorption and there will be no net change in the amount of tissue present over time (dT/dt = 0). Furthermore, the total amount of any given tissue within an organism at any time will equal the integral of dT/dt over the life of the organism (0 to t ), beginning at the fertilized egg.
Bone tissue formation
All bone formation occurs as the result of work performed by active mature osteoblasts. Taking this paradigm, the rate of bone tissue formation within a given tissue volume (dFb/dt) can be represented as the product of the total number of active osteoblasts in that volume (Nob) and the mean rate of bone tissue formation per cell (dσob/dt), in units of volume (both bone matrix plus the volume of osteocytes and canaliculi) per unit time:
 |
(3) |
Under steady state conditions, the number of active osteoblasts in a region (Nob) of tissue will be determined by the rate at which osteoblasts are formed in this region (Nob/dt) and the mean life-span of an osteoblast (lob) in that region, where
 |
(4) |
Furthermore, under steady state conditions, the mean amount of bone matrix produced by single osteoblast during its lifetime (σob) can be expressed as the product of the mean rate of bone formation per osteoblast and the mean life-span of an active osteoblast:
 |
(5) |
This strategy has practical utility. Since histomorphometric measurements can be used to directly measure the rate of bone formation (using double labeling techniques) and to estimate the amount of bone matrix formed per osteoblast [101], allowing the mean life-span of an osteoblast to be calculated [76, 77, 78, 79, 80, 84, 102]. With the addition of reliable means of directly measuring the total number of osteoblasts within a tissue region, the rate of formation of new osteoblasts in the region (Nob/dt) could be readily estimated.
Tissue removal
The same approach can be taken to describe the removal of bone tissue, mediated by osteoclastic bone resorption. The rate of bone resorption can be expressed as
 |
(6) |
where Noc is the number of active osteoclasts and dσoc/dt is the mean rate of bone resorption for an osteoclast, and the number of active osteoclasts is determined by the relationship:
 |
(7) |
where Noc/dt is the rate of formation of osteoclasts and l oc is the mean life-span of an osteoclast.
Overall balance of bone tissue formation
Substituting values from (3), (4), (6), and (7) into (2) provides a representation of the overall rate of bone tissue mass in any tissue volume as
 |
(8) |
Based on this model, the balance of bone tissue formation is dependent on only the rate of formation of osteoblasts and osteoclasts, the life-span of osteblasts and osteoclasts, and the rate of bone formation or resorption of bone tissue per osteoblast or osteoclast, respectively. This strategy provides the opportunity to explore the possible range of variation in these parameters, and to define those parameters that are likely to be most important, or that exert greatest effects on variation in bone formation and removal.
Many variables will influence the life-span of these cells (lx) and the rate or efficiency with which they form or remove matrix (σx). However, these variables are functions of mature cells, therefore they are outside of the focus of this paper, which is stem cell kinetics. Therefore, the remainder of this discussion will focus on dissecting the variables related to the rate of formation of osteoblasts (Nob/dt), and the rate of formation of osteoclasts (Noc/dt).
The rate of formation of new osteoblasts
In a previous publication, we proposed and developed the rationale for a mathematical model to describe the rate of osteoblast formation (Nob/dt) under steady state conditions [59]. This relationship is expressed as
 |
(9) |
For the purposes of this paper, it is desirable to use nomenclature that clearly distinguishes between connective tissue stem cells (CTS) and the HSC that give rise to osteoclasts. Therefore, we offer a modified nomenclature, as follows:
 |
(10) |
where
(i) both Ns and NCTS = the number of cells in the stem cell pool upstream of the osteoblast,
(ii) h = the frequency of stem cell activation events in the defined tissue volume,
(iii) ɛ = the efficiency of stem cell activation events in the defined tissue volume,
(iv) μ = the effective number of symmetric mitotic cycles between the time of stem cell activation and the time of differentiation into mature secretory osteoblasts.
The factor Pob represents the cumulative probability that the progeny of an initial stem cell activation would retain an osteoblastic phenotype during the period of clonal expansion:
 |
(11) |
where ρob x= the probability after each mitotic cycle “x” that the progeny created will retain osteoblastic potential. The application of this equation to the progeny and commitment events of one hypothetical stem cell is shown in Figure 4.
Figure 4.
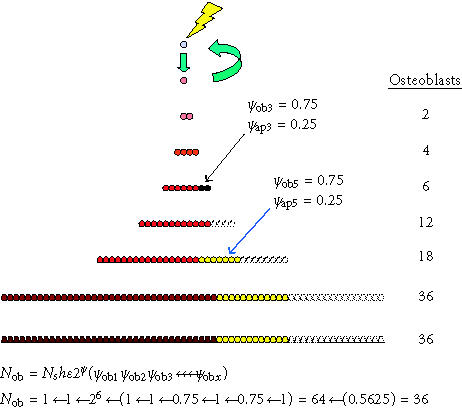
Competing differentiation options and events. The effect of alternative commitment events on the number of mature osteoblasts produced after the activation of one connective tissue stem cell is shown. In this example, the probability of retaining an osteoblastic phenotype (ρob) was 1 after all mitotic events, with the exception of the third and fifth symmetric mitosis. After the third mitosis, 25% of the cells undergo apoptosis (ρob 3 = 0.75). As a result, 16 fewer cells are produced. After the fifth mitosis, 25% of the cells commit to adipocytic differentiation (ρob 5 = 0.75). Twelve adipocytes are the result. These events leave an overall probability of osteoblastic differentiation (Pob) among the possible progeny of 0.5625 (0.75 × 0.75). The result is an approximately 44% reduction in the total number of osteoblasts produced, from 64 to 36. Even if these progenitors continue to proliferate for many more cell divisions before differentiating without further commitment to nonosteoblastic phenotypes, these two events related to the third and fifth mitosis effectively limit the number of mature osteoblasts to only 56% of the theoretical maximum.
It is useful to note that under ideal circumstances, ρob will be equal to 1.0 for each sequential symmetrical mitosis and therefore Pob will equal 1.0. However, this probability will be reduced by the fraction of progeny after any mitotic event that undergo apoptosis, or the fraction of cells that irreversibly commit to an alternative mature phenotype (eg, an adipocyte). The contribution of any incremental increase in the number of symmetric mitoses (μ) to additional osteoblast formation depends on maintaining a value for ρob that is greater than 0.5. Similarly, few osteoblasts will be formed unless the overall value of Pob remains substantially greater than 2−μ.
It is also useful to note that product of ɛh can also be represented as the activation rate (AR) or the inverse of the mean cycle time of the stem cell population (tCTS) being modeled. Therefore,
 |
(12) |
The rate of formation of new osteoclasts
An analogous strategy can be applied to modeling the steady state rate of formation of osteoclastic progenitors. However, this requires a two-step approach. The precursor cells that form the osteoclast are derived from the HSC, but also transit through the compartment of circulating monocytes before fusing to contribute nuclei to mature multinucleated osteoclasts [103]. By analogy to (10), the systemic rate of formation of mature monocytes (dsNm/dt) can be described as
 |
(13) |
where
(i) sNHSC = the total number of HSC available for activation, systemically,
(ii) ARHSC = the mean HSC activation rate,
(iii) μHSC = the effective number of symmetric mitotic cycles between the time of HSC activation and the time of differentiation into mature monocytes,
(iv) Pm = the cumulative probability that the progeny of the initial stem cell activation will retain monocyte phenotype during the period of clonal expansion.
Similarly, the total number of systemic monocytes (sNm) available to contribute to osteoclast formation by cell fusion can be defined by the product of the rate of monocyte formation (dsNm/dt) and the mean life-span of a monocyte (lm ):
 |
(14) |
However, only a fraction of the monocytes that are present systemically will contribute to osteoclast formation. To accommodate this variable, the probability that any individual systemic monocyte will be activated to contribute to osteoclast formation within a defined region of bone in a defined unit of time can be assigned a value, Pm→oc/dt. Furthermore, since multiple monocytes must contribute to form a mature multinucleated osteoclast (a mean of ∼ 8 cells) [103], a factor of n must be introduced, equal to the mean number of monocytes contributing to a mature osteoclast. Using these two additional factors, the rate of formation of osteoclasts at steady state in a defined region of bone (dNoc/dt) can be expressed as
 |
(15) |
Combined expression for bone tissue formation and remodeling
Substituting factors for the rate of formation of osteoblasts and osteoclasts from (10) and (15) into (8) provides the following combined expression for the overall balance of bone tissue formation within a given region of bone:
 |
(16) |
Limitations of the model
All models are inevitably based on simplifying assumptions, which may not (and likely are not) universally true. Several of these assumptions require exploration. Some assumptions require further refinement as discussed below.
One of the assumptions in the model, as presented thus far, is that the stem cell activation and new osteoblast formation both take place within the same region of interest or observation. In contrast, the activation of the HSC need not to occur within the region where the mature progeny are active. The validity of this assumption for bone is dependent upon the relative size of the region of observation or sampling and the mean distance between the site of connective tissue stem cell activation and the site of mature osteoblast function. If this distance is on the order of 100–5000 μm, then data available from conventional histomorphometry is likely to offer wide enough sampling. However, there is a possibility that this distance between the initiating stem cell niche and the site of osteoblast function might be much larger than the field of sampling. For example, it has been suggested that, like osteoclasts, some or all of the precursors of mature osteoblasts may migrate for relatively long distances [104, 105, 106] or even circulate in blood as an osteoblastic transit cell population (OT) [107]. If this is the case, it would be necessary to accommodate a systemically distributed osteoblastic transit cell population. Taking this strategy, the expression for overall bone tissue formation within a region of tissue could be written as
 |
(17) |
where
(i) Pot = the systemic cumulative probability that the progeny of an activated connective tissue stem cell would become an osteoblastic transit cell,
(ii) lot = the mean life-span of an osteoblastic transit cell,
(iii) Pot→ob/dt = the mean probability that any individual osteoblastic transit cell will become an active osteoblast within the region of interest per unit time.
Another limitation in generalizing this strategy is the fact that bone formation in different locations and settings may be derived from different stem cell populations having different intrinsic capabilities and pathways. Trabecular bone remodeling, cortical haversian remodeling, periostial new bone formation, myositis ossificans, ossification of a fracture callus, endochondral ossification of primary and secondary ossification centers, ossification of an advancing growth plate, and ossification within an atherosclerostic plaque may each rely on the activation of a different pool or pools of connective tissue stem cells having different intrinsic attributes and extrinsic modulating factors. Each stem cell pool may have intrinsically different activating signals, different thresholds for activation, and different activation rates. Each pool may give rise to progeny that have intrinsically different patterns of proliferation or/and probabilities of differentiation along an osteoblastic pathway. Furthermore, each pool of stem cells will also be exposed to a different set of extrinsic influences (ie, biochemical, cytokine, matrix, and mechanical environment) that is imposed by each tissue and location or each stem cell niche. These differing sets of intrinsic and extrinsic attributes would combine to create differences in mean activation frequency (h) and efficiency (ɛ), cycle time (t), and activation rate (AR) for each stem cell population and setting, as well as differences in number of symmetrical mitoses in the clonal expansion phase (μ) and the cumulative probability that an osteoblastic phenotype would be preserved at the completion of clonal expansion (Pob). Recognizing this limitation calls attention to the fact that settings in which this strategy is applied must be carefully defined. Parameters determined in one setting may not be generalizable in another (eg, trabecular versus cortical remodeling).
The model, as described above, has at least three other major limitations. One limitation, and perhaps the greatest, is that this model assumes that the pathway leading to osteoblast development is associated with a single stem cell activation event and a single stem cell population. In fact, as discussed above, there is abundant evidence to suggest that bone formation in trabecular bone and likely other settings is associated with transit of cells through more than one cell phenotype or transit cell compartment. These transit steps likely involve a series of activation events. Recognizing this hierarchy of osteoblastic cell development, the model is expanded below to accommodate multiple transit cell populations.
A second limitation is that this model does not consider the fate of the osteoblast population after they contribute to the population of active secretory osteoblasts. The transit of these cells into the downstream populations of osteocytes and trabecular and osteonal lining cells and ultimate cell death also has important implications in the process of bone formation and skeletal health, and should be included in a cell-based modeling approach.
Finally, the model does not address the issue of stem cell renewal and expansion, which is clearly a critical variable in the development, regeneration, and long-term health of the connective tissue stem cell system.
The remainder of this paper will attempt to address these three issues: upstream transit cell populations, the downstream fate of osteoblasts, and stem cell renewal and expansion.
THE TRANSIT CELL PARADIGM
The concept of transit cell populations has been applied to several models of stem cell kinetics, particularly in the stem cell systems in dermal epithelium and in small intestinal mucosa [98, 99, 108, 109, 110, 111, 112]. Transit populations have generally been defined as cell populations or stages of differentiation that are intermediate between stem cells and mature cells. Transit cell populations can be defined as compartments of either proliferating cells or nonproliferating cells. It is generally assumed that the cells in each compartment are intrinsically different from the cells in another compartment, and the cells in all transit compartments tend to progress irreversibly toward the mature phenotype.
The concept of “proliferating transit populations” is used most commonly. A proliferating transit population is generally envisioned to have the capacity for proliferation, and some capacity for self-renewal or self-maintenance, reducing the demand required for further activation of an upstream stem cell compartment. However, if there is any ongoing contribution from an upstream compartment, stable regulation of cell numbers requires that the rate of self-renewal in a proliferating transit population must be less than 100% [111]. When a proliferating transit population exists, it provides a means of cellular expansion. A proliferating transit cell population is also inevitably associated with a physical migration of cells away from the site of the upstream stem cell, since new cells must move away or be pushed away from the site of cell division as cell expansion occurs.
A highly simplified model involving three proliferating transit cell populations (T2, T3, and T4) in a contiguous linear array feeding a population of mature cells (M/T5) is illustrated in Figure 5. For simplicity, this is a model composed entirely of asymmetric cell division. The stem cell (S/T1) divides to renew itself and to produce a T2 cell. The T2 cell divides as a transiently self-renewing cell with a cycle time (t2) and life-span (l2) for a number of cycles (μ2) giving rise to a number of T3 transit cells (also equal to μ 2) before its death. The T2 cell that dies is then replaced by a new T2 cell generated by a subsequent division of the upstream stem cell. The T3 population of transit cells feeds the T4 population in the same way. For each Tx compartment, μx = lx/tx . Ultimately, the T4 population gives rise to only cells that mature without dividing (M/T5). These mature cells live out their functional life-span (l5) and die. The table within Figure 5 illustrates hypothetical values for tx, lx, μx, and the resulting number of cells in each transit compartment (Nx) at steady state.
Figure 5.
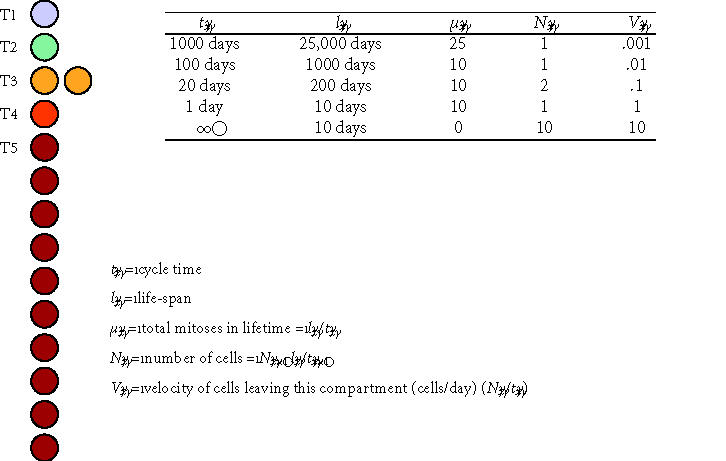
Conceptual model of transit cell amplification. This schematic diagram and associated table illustrate several central concepts in the proliferating transit cell paradigm. A stem cell (T1) and three proliferating transit cell populations (T2, T3, and T4) are modeled at steady state in a contiguous linear array supporting a population of mature cells (M/T5). All cell division is modeled as asymmetric events associated with renewal of the founding cell. The table illustrates hypothetical values for the cycle time (tx), life-span for cells in each compartment (lx), the effective mean number of cell divisions in each compartment (μx), the resulting number of cells resident in each transit compartment (Nx), and a velocity or rate at which cells leave each compartment (Vx). In this model, the originating stem cell survives throughout the life of the individual (l1 = 25,000 days ∼ 68 years), cycling as a slow rate of one cell division every 1000 days (t1 = 1000 days). During the life of the stem cell, it divides a total of 25 times (μ1 = 25). The velocity of cells leaving the stem cell compartment and entering the T2 compartment is 1 cell per 1000 days, or V1 = 0.001 cells/day. Cells in the T2 compartment function similarly to feed the T3 compartment, and so on. Cells in downstream populations (T2, T3, and T4) divide more rapidly than cells in upstream compartments. In contrast to the originating stem cells, the cells in downstream compartments also have limited self-renewal capacity, resulting in decreasing functional life-span for cells in each compartment. Note that, in the absence of any transit populations, the upstream stem cell would need to divide 25,000 times to generate the same number of mature cells over the life of the individual.
Figure 5 illustrates several features of the transit cell paradigm. First, the change in any one parameter will have secondary effects on the number of cells in each compartment (Nx), which is determined by the product of the rate of cells entering that compartment (dNx/dt) and the life-span of cells within that compartment (lx):
 |
(18) |
It is also possible to define a velocity of cells leaving each compartment in this linear model (Vx ), where
 |
(19) |
Figure 5 and the associated table also illustrate the number of cell divisions that the stem cells in each compartment will be burdened with over the life of a hypothetical individual (25,000 days, ∼ 68.5 years). This demonstrates the principle value of proliferating transit populations, which is the protection of the original stem cell from the burden and genetic risk associated with direct generation of each mature cell. In the case of the system illustrated in Figure 5, in the absence of any transit populations, the T1 stem cell would have needed to divide 25,000 times, rather than 25 times, to generate the same number of mature cells over the life of the individual.
The transit cell model above is based on contiguous unidimensional single-file cell to cell displacement. These conditions are appropriate to models in the skin and in the intestinal lining cell systems. A similar system might also be relevant to modeling the progression of cell compartments in the active growth plate, in articular cartilage, in the setting of periosteal new bone formation.
In the case of organizationally complex and heterogeneous tissues, such as bone, a contiguous physical chain of cells beginning at the stem cell is not applicable. Given the requirement in bone for episodic formation of new sites of bone tissue formation in response to local tissue signals in marrow or near the bone surface, it would appear that the transit cell pools upstream of the osteoblast must include one or more migratory transit populations that provide a mechanism of physical migration and homing of progenitor cells from the (as yet uncharacterized) upstream stem cell niche to a site near where they will activated to leave the transit compartment and further differentiate.
Any system involving one or more transit populations also requires some means of regulating of the total number of transit cells in each compartment. This regulation could be mediated through modulation of the AR of the upstream stem cell or rate of entry of upstream transit cells. However, feedback regulation in this setting would need to occur over significant and potentially impractical distances. As a result, regulation of the size of the local transit population (ie, a function of the rate of entry, proliferation, and residence time of cells within each compartment) is more likely to be mediated by the effect of local signals on the activation/migration AR, proliferation kinetics (μ), differentiation (P), or life-span (lx).
Transit populations can also serve to distribute the progeny of stem cells beyond the limited domain of the upstream stem cell niche. This may occur by migration of transit cells through tissue or by transport within systemic circulation, as is the case with the transit monocyte population that contributes to osteoclast formation. A broadly distributed migratory transit population, having the potential for proliferation, also provides advantages in the setting of tissue injury and repair. Locally resident transit cells are better positioned to respond to changes in local tissue conditions and signaling events, and potentially avoid the inevitable delay that would result if tissue repair was to require the activation, proliferation, and migration of cells from a remote upstream stem cell niche.
Transit populations upstream of the osteoclast compartment
A diagram of transit cell compartments upstream of the osteoclast is relatively simple to illustrate conceptually. (See Figure 6.) The diagram begins with the small population of adult pluripotent hematopoietic stem cells that have long-term repopulating potential (HSC-LT) [113, 114]. These are activated to divide and their nonstem cell progeny undergo symmetric clonal expansion, passing through a series of downstream “proliferating transit populations.” These downstream transit cell pools include a small population of cells that have limited self-renewal capacity, resulting in short-term repopulating activity (HSC-ST) but still give rise to multipotent progeny. Further downstream are a population of common myeloid progenitors followed by granulocyte macrophage precursors (CFU-GM) and finally committed macrophage forming progenitors (CFU-M).
Figure 6.
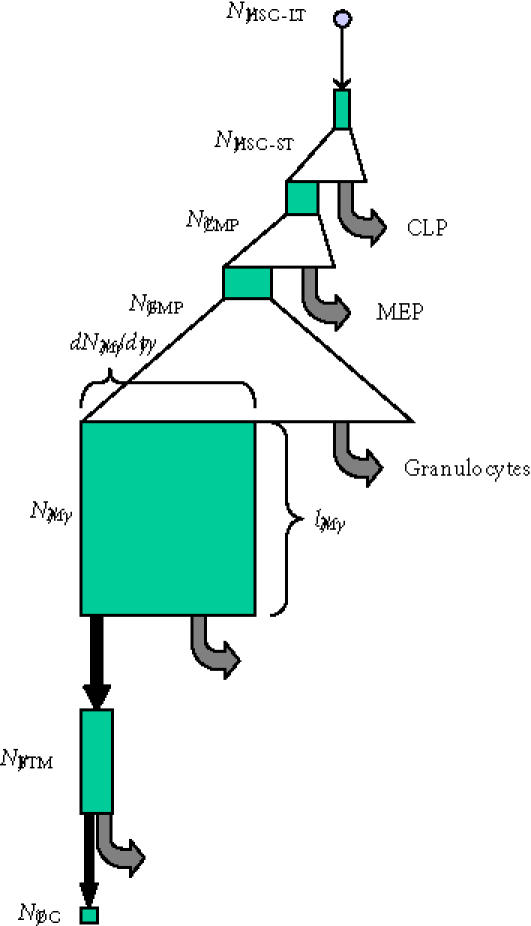
Transit cell populations in osteoclast formation. The conceptual hierarchy of transit cell populations upstream of the osteoclast is illustrated. Triangles indicate phases of clonal expansion arising from proliferating transit populations. Black arrows indicate transit events in which cells move from one compartment to another associated with changes in their intrinsic biological properties. Grey arrows indicate departure of cells from the upstream compartment to other cell compartments. Green boxes illustrate the conceptual size of each cell population, where the width of the box represents the rate at which cells are added to or leave each compartment at steady state, and the height of each box represents the mean life-span or residence time of cells within each compartment. (Abbreviations: HSC-LT, long-term repopulating hematopoietic stem cell; HSC-ST, short-term repopulating hematopoietic stem cell; CMP, common myeloid progenitor; CLP, common lymphoid progenitor; MEP, megakaryocyte erythroid progenitor; GMP, myelomonocytic progenitor; M, monocyte; BMT, bone tissue monocyte; OC, osteoclast nuclei [114].)
Cells in the CFU-M compartment in marrow exit from the marrow space and enter into a “nonproliferating transit population,” as circulating monocytes, with some probability (PM). Monocytes are then distributed systemically in circulation, making them accessible to local activation signals for a period of time (lM). These local signals can result in their subsequent activation to move into other cell compartments, including tissue monocytes and macrophages. The third transit compartment in the osteoclast lineage is the tissue monocyte that has left circulation to reside in the bone marrow or osteonal compartment of bone. The fourth and final transit compartment is the osteoclast compartment, where monocyte-derived nuclei fuse to transiently contribute to the osteoclast population. The osteoclast population persists throughout the life of the cutting cone of a BMU. However, this population is continually fed by the addition of new nuclei through new fusion events, balancing the simultaneous turnover of other nuclei. The transit time for nuclei in the osteoclast compartment has been estimated to be approximately 12.5 days [115].
Each of these transit compartments is associated with and defined by an overall AR, mean number of effective mitoses (μ), mean life-span (l), and probability of transit to the downstream population (P). The process of monocytes nuclei contributing as a transit population to osteoclast generation is rather unique. In terms of absolute cell number, transition from monocyte to osteoclast represents a reverse amplification event, requiring several monocytes (∼ eight) to make one osteoclast (ie, μ ∼ −3).
Using this model concept, access to quantitative information about the number of cells (nuclei) in each compartment and the mean life-span of cells within each compartment can be used to gain significant insight into the possible range of kinetic parameters governing the transit processes leading to osteoclast development.
Transit populations downstream of the osteoblast compartment
Using the transit cell paradigm described above, it is also possible to begin to build a model system of transit cell compartments that contribute upstream to osteoblast formation, and to model the downstream transit cell compartments that contribute to the removal of osteoblasts.
Much more is known about the downstream transit compartments, as illustrated in Figure 7, than about compartments that are upstream of the osteoblast. Removal of osteoblasts from a region (ie, the transit of cells out of the osteoblast compartment) occurs through three primary pathways or transit events: formation of an osteocyte, formation of a lining cell, and cell death via apoptosis. These variables are absent from the model developed above, because the model was based on the variables influencing the rate of bone tissue formation and removal, and the contribution of osteoblasts to bone matrix volume ends when they transit out of the osteoblast compartment. However, the transit of osteoblasts into the downstream populations of osteocytes and lining cells, while not a determinant of the rate at which new bone tissue is formed, is a critical variable determining the density and distribution of osteocytes and lining cells, and therefore the histologic features, biologic environment, and long-term health of the newly formed bone tissue. The distribution of these cells in bone tissue is likely to have significant effects on the function and maintenance of the newly formed bone and on the initiation and propagation of future cycles of bone resorption and bone formation in that tissue volume.
Figure 7.
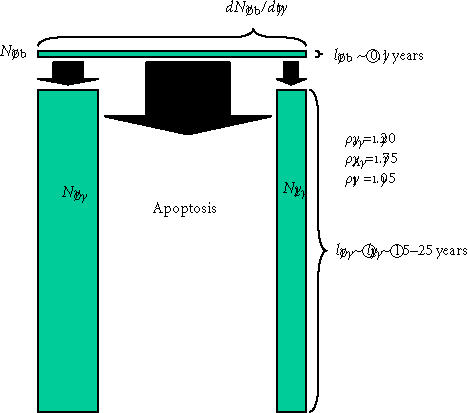
Transit cell populations downstream of the osteoblast. The three differentiation pathways available to osteoblasts and the two transit populations downstream of the osteoblast are illustrated, using the same illustration strategy described in Figure 6. Probability values that would be common in cortical osteonal bone remodeling are illustrated.
The mean probability that any given osteoblast will follow one of these pathways can be represented as
 |
(20) |
where
(i) ρo = the probability of forming an osteocyte,
(ii) ρl = the probability of forming a lining cell,
(iii) ρap = the probability of apoptosis.
Based on this concept, and substituting the expression for the rate of osteoblast formation (Nob/dt) into (10), the rate of formation of new osteocytes (No/dt) can be expressed as
 |
(21) |
Assuming steady state conditions, then the total number of osteocytes in a region (No) will expressed as
 |
(22) |
where, lo = the mean life-span of an osteocyte.
Similarly, at steady state, the relative number of osteocytes and osteoblasts in a given region of bone can be expressed as
 |
(23) |
Based on rough estimates of these values (ρo ∼ 0.2, lo ∼ 20 years, lob ∼ 0.1 years) [85, 86], the mean ratio of osteocytes to active osteoblasts should be in the range of 40 to 1. However, this is expected to vary significantly between sites. The difference in remodeling rate between cortical and cancellous bone results in a generally longer life-span of osteocytes in cortical bone than in trabecular bone. Similarly, ρo will change significantly with the geometry of the site of bone formation, as discussed below.
The rate of formation of new osteoblasts (Nob/dt) can also be investigated beginning with data available from histomorphometric measurements. At steady state, this rate will be equal to the rate at which osteoblasts transit out of the osteoblast compartment (rNob/dt). The rate of removal will be related to the total number of osteoblasts in the region of interest (Nob) and life-span of the osteoblast, based upon the relationship derived from (4):
 |
(24) |
Since the rate of removal of osteoblasts (rNob/dt) can also be expressed as a sum of the rate of the three pathways, or
 |
(25) |
where,
No/dt = the rate of formation of new osteocytes
Nl/dt = the rate of formation of new lining cells
Nap/dt = the rate of osteoblast loss due to apoptosis,
the relative velocity of the three rates is determined by the relative probability that a mature osteoblast will follow each of the pathways (ρo, ρl, and ρap).
Finally, the density of osteocytes within the newly formed bone matrix (Do) will be determined by the rate of formation of new osteocytes (No/dt), the number of active osteoblasts (Nob), and the rate of formation of new bone matrix per osteoblast (dσob/dt), according to the relationship
 |
(26) |
Substituting terms for No/dt and Nob from (21) and (4), respectively, provides that
 |
(27) |
It is interesting to note that, osteocyte (lacunar) density has been reported to be higher in females than in males [116], and higher in osteoporosis subjects than in age-matched normal subjects [94]. These findings would suggest that the pathomechanics of osteoporosis may be associated with a decreased rate of matrix synthesis per osteoblast (dσob/dt), a decrease in osteoblast life-span (lob), and/or an increase in the probability of osteocyte formation (ρo).
It is also interesting to note that the anatomic site or geometry of the BMU will have an profound influence over the likely fate of an osteoblast with respect to the probability of apoptosis or differentiation as a lining cell [90]. Figures 8a through 8c and data presented in Table 1 illustrate the predicted range of variation in the probability factors regulating the fate of osteoblasts with geometry of the site (ie, the contour and thickness of the new bone formed) and with osteocyte density (eg, cortical versus trabecular cancellous bone). Increasing matrix thickness and increased osteocyte density are associated with an increased probability (ρo) of osteocyte formation, and a decrease in the allowable probability of apoptosis (ρA). Similarly, the transition from concave surfaces (such as the interior of an osteon in Figure 8a) to formation of new bone on a flat surface (such as a periosteal surface or trabecular plate as shown in Figure 8b) or to formation of new bone on a convex surface (such as the cylindrical section of a trabecular strut illustrated in Figure 8c) is associated with increasing demands and probability of transit to lining cell and osteocyte population, and a decreasing allowable range of apoptosis. These changes are also associated with an increase in the mean volume of new bone synthesis required per starting osteoblast (σob). The need for osteoblast retention as osteocytes and lining cells effectively limits the maximal thickness of new bone matrix production with each remodeling cycle, particularly on convex surfaces.
Figure 8.
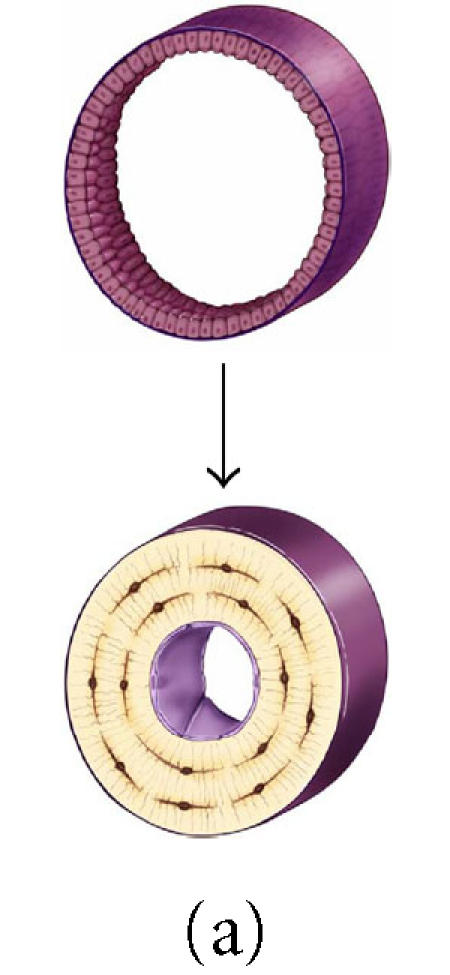
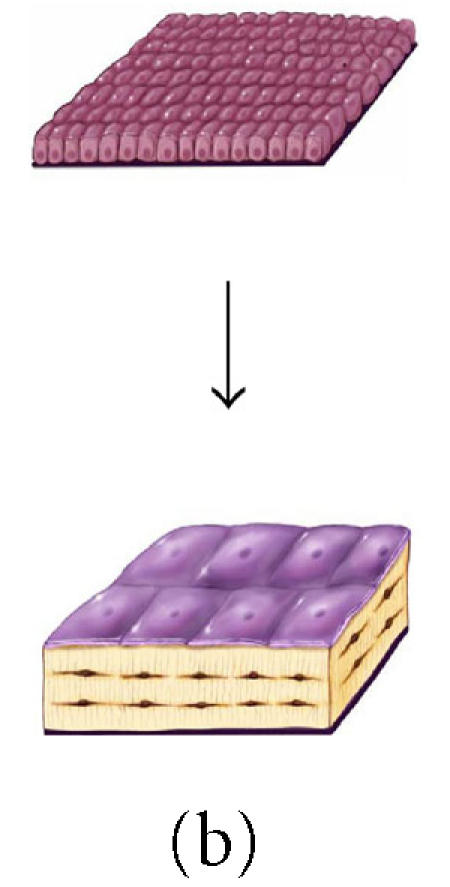
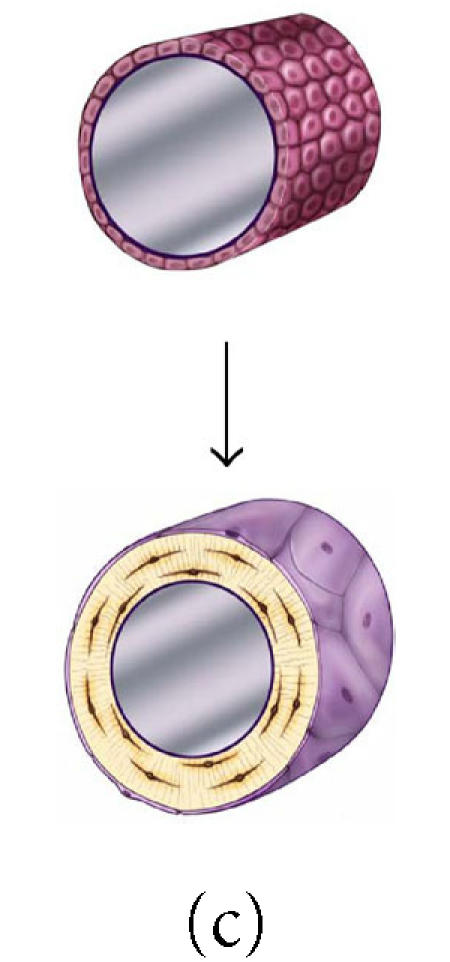
The effect of surface geometry on the fate of 128 osteoblasts. A cell-based model is shown representing bone formation on three different surface geometries: (a) a concave segment of a 200 μm diameter osteon in cortical bone, (b) a flat surface in cortical or cancellous bone, and (c) the convex surface of a 100 μm diameter trabecula in cancellous bone. In each case, a set of 128 osteoblasts is shown at t =0 as ∼ 12.5 μ cuboidal cells covering an appropriate segment of the bone surface. Below, the same surface and the new bone formed by this set of 128 osteoblasts are shown. In each case, some fraction of cells must become embedded in the matrix as osteocytes to maintain an appropriate osteocyte density and some osteoblasts must be retained as lining cells covering the remaining surface. Cells that are not required as osteocytes or lining cells are presumed to be lost through apoptosis. The probability of osteoblast transit into the osteocyte or lining cell population, and the probability of apoptosis are dependent on surface geometry, the density of osteocytes in the matrix, and the thickness of the new bone that is formed at the site.
Table 1.
The effect of osteocyte density and surface geometry on osteoblast fate and function. This table provides a quantitative assessment of the end result in each geometric configuration illustrated in Figures 8a, 8b, and 8c. Each geometry calculations are based on formation of 40 μm or 60 μm thick volume new bone. The table illustrates the fate of the initial set of 128 osteoblasts, identifying the number of osteocytes (No) and lining cells (NL) that are required and the probability of an initial osteoblast form an osteocyte (ρo), a lining cell (ρl), or to undergo apoptisis (ρA). Calculations for cortical and trabecular cancellous bone differ based on published values for osteocyte density in cortical and trabecular bone. Note that the required probability for osteocyte formation (ρo) increases dramatically in these examples from 0.13 to 0.69 as the surface geometry changes from concave to convex, as the osteocyte density changes from cortical to cancellous bone, and as the thickness of new bone increases.
Transit populations upstream of the osteoblast compartment
Direct objective information upon which to build a conceptual model for transit cell compartments upstream of the osteoblast is much more difficult. Regardless of this, there is a significant volume of data and observation that can be assembled in an attempt to strategically dissect questions related to the likely size, hierarchy, and kinetics of transit populations upstream of the osteoblast.
As discussed above, Bianco et al [72, 73] have presented histologic observations to support the concept that osteoblasts in bone may be derived from a population of fibroblastic cells in bone marrow known as Westin-Bainton cells. Other evidence indicates that cells derived from the perivascular compartment (vascular pericytes) have the capacity to contribute to the osteoblast compartment [69, 70]. There is also recent evidence suggests that osteogenic cells may also transit through peripheral blood [107, 117]. As a result, it is necessary for any model of osteogenic transit populations to include not only an upstream stem cell niche, but also possible transit compartments of circulating cells, vascular pericytes, and Westin-Bainton cells.
Detailed histologic analysis of BMUs in cortical bone and radioactive labeling studies has also suggested the presence of another small compartment of proliferating cells that is located very close to the junction of the osteoclasts in the cutting cone of the BMU and the region where all new osteoblasts are incorporated. Radionucleotide labeling is seen within this population of cells early after injection, suggesting a high proliferation rate. Furthermore, by 1–1.5 days after labeling, radiolabel remains evident in the type I population and is also seen in the new osteoblastic cells that are added to the advancing front of osteoblasts. This unique population of cells, about 8 cells per BMU, has been referred to as type I osteoblasts [102, 118]. Based on these observations, we interpret this population of cells to represent a small proliferating transit population that is immediately upstream of the secretory osteoblast which has some self-renewal capacity, similar to the transit populations illustrated in Figure 5.
Many possible models could be proposed to linking these compartments into a hierarchy. However, in the absence of compelling data to the contrary, the simplest possible model involving all of these compartments is a model of linear progression of cells through these compartments in an order that is based on physical proximity to the bone forming surface analogous to the previous model for osteoclast formation, as illustrated in Figure 9. In this model, osteogenic cells may be envisioned to transit through a stem cell and progenitor cell system with up to five compartments upstream of the mature secretory osteoblast. This model begins with a true initiating stem cell population (NS or T1), followed by a circulating transit cells (NC or T2), the pericyte compartment (NP or T3), the Westin-Bainton compartment (NWB or T4), Type I osteoblasts (NobI or T5), and secretory osteoblasts (Nob or T6).
Figure 9.
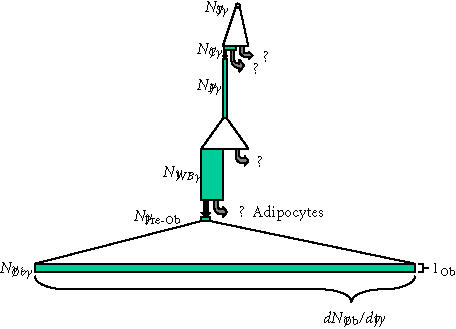
Transit cell populations upstream of osteoblasts. The putative transit cell populations that are upstream of the osteoblast are shown, using the same illustration strategy described in Figures 6 and 7. The upstream originating stem cell, the pericyte, and the pre-osteoblast (type I osteoblast) are all presumed to be proliferating transit populations. Precise features of this diagram (the magnitude of expansion, the life-span, the rate of transit, and even pathways of transit between these potential populations) must be considered highly speculative, though it is consistent with available data and prevailing theory. Regardless of this speculation, it is useful to compare this diagram to that illustrating the events that occur downstream of the osteoblast shown in Figure 7. This comparison illustrates the very small rate of cell division and small rate of transit that must be expected in transit populations upstream of the osteoblast, relative to downstream events. Similarly, it also illustrates that one or more of these upstream populations (eg, the Westin-Bainton cell) might be present in comparable numbers to the active osteoblast population, if the life-span of cells in these transit compartments significantly greater that was the life-span of the secretory osteoblast. (Abbreviations: S, upstream stem cell; C, circulating stem cell; P, vascular pericytes; WB, Westen-Bainton Cells; Pre-Ob, Pre-osteoblast (Type I osteoblast); Ob, mature secretory osteoblast.)
With the exception of the type I osteoblast compartment, there is no objective data to demonstrate the transit of cells between these compartments, nor proliferation within any one compartment, including the relatively abundant population of Westin-Bainton cells. As a result, the transit of cells between these compartments and the stem cell kinetics associated with these compartments (proliferating or non-proliferating transit) under normal remodeling conditions is entirely speculative. It seems reasonable to assume with some confidence that the originating stem cell compartment represents a proliferating transit population, though the kinetics of this compartment is entirely unknown. Similarly, given the capacity of pericytes to be cultured in vitro to produce a proliferating population of osteogenic cells, it seems reasonable to expect that the pericyte compartment also represents a proliferating transit population, as illustrated in Figure 9. Also represented in Figure 9 is the seemingly reasonable assumption that the life-span of a pericyte and of a Westin-Bainton cell is quite long in comparison to the life-span in the compartments containing the circulating osteoblastic progenitor, type I osteoblast, or osteoblasts themselves, though the actual life-span of cells in these compartments is not known. The number of symmetric mitoses in the stem cell compartment or pericyte compartment is also entirely speculative. The same is true for the probability that the cells leaving each of these compartments will transit to the next, though for graphic purposes Figure 9 arbitrarily illustrates a probability (P) of transit to the next compartment of ∼ 0.5.
Despite these limitations, this organizational hierarchy provides a starting point from which to explore and test assumptions regarding the relative size of these compartments, the presence or absence of transit events between these compartments, and the rate and kinetics that may be associated with these events in order to support bone remodeling and/or in settings of injury or repair. This is illustrated below.
In accord with the previous discussion, for each compartment, the rate at which cells are added to a compartment (dNx/dt) is also equal to the rate at which cells move from the upstream compartment to the next, and can be represented as
 |
(28) |
where
(i) Nx−1 = number of cells in the upstream (x−1) population,
(ii) AR x−1 = mean activation rate of cells in the upstream (x−1) population,
(iii) μx−1 = mean number of symmetric mitoses in the upstream (x−1) population,
(iv) Px = the probability of cells generated in the upstream (x−1) population to become a transit cell in the x population.
Based on this relationship, with the exception of the initiating stem cell population (T1), the total number of cells in each compartment (Nx) can be represented as
 |
(29) |
where lx = mean life-span of a cell in the x population.
Note. If the upstream compartment is composed of only nonproliferating transit cells (ie, μ = 0), the term AR is equal to the rate at which cells in this compartment are activated to leave their current state and transit to another compartment.
Based upon the relationship described in (29), the ratio of the number of cells observed in one compartment and the number of cells observed in an adjacent compartment becomes a tool in the assessment of the kinetics between two adjacent compartments, since
 |
(30) |
The logical starting point to begin to evaluate the utility of this theoretical relationship is in an exploration of the kinetic interface between the T5 population of type I osteoblasts and the T6 compartment of active secretory osteoblasts, where at least some objective data exists. This data suggests that the ratio of type I osteoblasts to secretory osteoblasts is approximately 1 : 125 (∼ 8 type I osteoblasts to 2000 secretory osteoblasts in a fully active cutting cone) [102, 118] and that this population proliferates relatively rapidly, allowing cells to exit this compartment within about 24–36 hours. Beyond this information, the remainder of a first-order analysis must be based on a set of assumptions. One set of possible parameters that is useful for a first-order exploration includes the following three assumptions: (1) all type I osteoblasts become osteoblasts (PobI = 1), (2) the activation rate of the cells in the type I compartment is approximately one cell division per day (ARobI = 1, ie, a cycle time of 24 hours), and (3) the total number of asymmetric mitoses per cell during residence within the type I osteoblast compartment is in the range of 13 (lobI ∼ 13 days).
If these assumptions are correct, then two other parameters follow. First, based on substitution into (30), the effective number of symmetric mitotic events (μobI) predicted among the progeny of an activated type I osteoblast would slightly be greater than 3, resulting in approximately 10 new osteoblasts for each activation event. Second, the rate at which new type I osteoblasts would need to be added from the upstream compartment would be approximately 0.6 cells per day (dNobI/dt = NobI/lobI = 8/13).
While these assumptions and the calculated kinetic parameters resulting from this example are internally consistent and within the range of predicted biological feasibility, this example must not be over interpreted. Current markers for stem cell and progenitor cell populations and histomorphometric methods for counting cells and measuring proliferation rates in vivo, have not yet provided the means of reliably testing the validity and utility of this approach. Without these data, the model is primarily useful as a conceptual tool for interpretation of increasingly rich and quantitative histologic and histomorphometric data.
Application of cell-based modeling to the clinical and experimental settings
While the quantitative data to support the full application of a cell-based modeling strategy is not yet available, an increasing number of publications are providing data that will allow these kinds of analysis. For example, in the setting of estrogen deficiency, there is recent evidence of a decreased life-span among both osteoblasts and osteocytes [119]. Systemic exposure to corticosteroids also has these effects [120]. These findings are consistent with the observed contraction of both of these transit cell compartments in both settings.
Cell-based modeling may also be useful in interpretation of the apparent accumulation of Westin-Bainton-like alkaline phosphatase-positive cells within the areas of intramedullary fibrosis that is observed in hyperparathyroidism [121]. In this context, an increase in size of a Westin-Bainton-like compartment would be attributed to increased activation (AR P) or proliferation (μP) in the upstream compartment (eg, pericytes), an increased probability that cells from the upstream compartment will enter the WB compartment (PWB), or an increase in life-span of cells within the WB compartment (lWB). An increase in life-span could in turn be mediated by a decrease in the rate with which cells in the WB population are activated to transit downstream compartments (ARWB). The accumulation of intramedullary fibrous tissue in the setting of fibrous dysplasia, a condition resulting from constitutive activation of a Gα S-protein, similar to the pathway activated by tonic PTH stimulation, may also be interpreted in this way [106, 122, 123].
Cell-based modeling may also be instructive in the design and selection of experimental strategies. For example, the model predicts that the magnitude or velocity of transit events into the type I osteoblast pool does not need to be very large in order to support ongoing bone remodeling activity. This would imply a low basal activation rate in the upstream compartment. Activation in the Westin-Bainton population (ARWB) could be particularly rare in light of the relative abundance of Westin-Bainton cells in bone marrow. As a result, observation of these transit events during normal bone remodeling would be highly unlikely. The setting of intramedullary trauma or fracture healing might be expected to be very different, however, since the Westin-Bainton population (and/or the pericyte population) would appear to be the osteogenic transit compartments that are most effectively positioned to respond in the rapid regional mobilization of the bone healing response that is required in these settings.
Finally, as it is further developed, cell-based modeling will offer many new capabilities for interpretation and investigation of in vivo phenomenon in the setting of embryonic development, tissue remodeling, disease states, responses to targeted drug and cell therapies, the tissue level effects of targeted mutations and knockouts. For example, if a pharmacologic agent, disease, mutation, or knockout was found to be associated with a significant increase in the number and prevalence of type I osteoblasts, then targeted assessment of the ARobI, lobI, μobI, Pob, or lob should reveal the underlying kinetic process that is affected and responsible for this change.
Ultimately, the utility and validity of cell-based models must be tested against experimental data involving direct measurement of the number of cells in the relevant compartment and their associated kinetic parameters. This will require significant improvement in the cell specific markers and methods that are currently available.
STEM CELL AND TRANSIT CELL SELF-RENEWAL AND SELF-EXPANSION
Cell-based modeling also requires strategies which describe the origin, expansion, and maintenance of the stem cell and transit cell populations throughout the life of an individual, via the biologically essential process referred to commonly as self-renewal. An extensive literature is available on this subject [99, 111], which cannot be reviewed here. However, some exploration of these concepts is appropriate to the development of the current model.
When a stem cell is activated, at any stage of development, there are conceptually three possible outcomes, as illustrated in Figure 10. The classic mechanism for self-renewal is “asymmetric division” producing one daughter cell that is identical to the mother cell and one daughter cell that is intrinsically different than the mother cell and goes on to proliferate and mature. For the purpose of this discussion, and to remain consistent with a previous publication, we referred to this as an “α” division [59]. This mechanism by itself would be sufficient to maintain the stem cell population in adults. However, at least two other options are possible. Two stem cells that are identical to the mother could also be produced (a “2α” cell division in Figure 10). Alternatively, two daughters could result which are both different than the mother cell, which we have referred to as a “μ” division. As a result, in any population of stem cells, any individual activation event would have some probability of each of these three pathways (pα, p2α , and pμ, respectively), where
 |
(31) |
Each of these pathways must be possible. In adult life, when maintenance of stem cell populations would seem to be the goal, one might expect that the α division would be strongly favored, and that the frequency of the other two pathways would be small (pα ≫ p2α, pμ). However, this situation is not required for stem cell maintenance. A stem cell population can be maintained even if the probability of α division is low, provided that the probability of 2α and μ divisions were equal over time (p2α = pμ).
Figure 10.
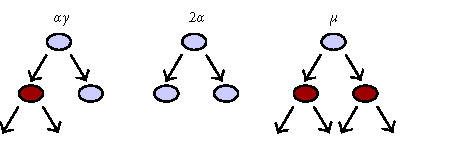
Three options for stem cell division. Three possible outcomes of stem cell activation and cell division are illustrated: an “α” division represents the classic asymmetric cell division with renewal of the mother cell and generation of a daughter that enters a downstream transit population. A “2α” cell division generates two identical stem cells, increasing the number of total stem cells by one. Finally, a “μ” division generates two cells that enter a downstream transit population, depleting the number of stem cells by one. The balance between “2α” and “μ” events determines whether a given stem cell pool will increase or decrease in number.
The mechanism by which each stem cell population maintains functional self-renewal is therefore uncertain, and may vary greatly depending upon the population. What is definite, however, is that the probabilities of these different stem cell division pathways shift significantly during growth and development. Embryonic growth and development must be accompanied by a significant expansion in the number of stem cells. Therefore, during development, stem cell activation must be associated with a high probability of a 2α cell division over μ (p2alpha; > pμ), and possibly of α divisions as well. Similarly, there are settings in which stem cell populations become depleted or even extinguished. Examples include the loss of hematopoiesis in the liver and peripheral skeleton, and the apparent loss of embryonic stem cells and hemangioblasts during development. In settings of stem cell depletion or extinction, “μ” division of stem cells must occur with increased probability (pμ > p2α), unless one hypothesizes direct stem cell death as a mechanism for stem cell reduction.
It is possible to speculate with some justification that self-renewal, in the form of either α or 2α divisions, involves activation of genes linked to cell cycle regulation [124, 125, 126]. However, our ability to observe, detect, or distinguish between these events and mechanisms in activated stem cells is limited to very few settings [127].
Recognizing current limitations in dissecting these events at the level of individual cells within a population, we suggested in our previous publication [59] the concept of a global index variable (α) to characterize the status of self-renewal in a population, where α is equal to the mean number of stem cells remaining after each stem cell activation. In the context of the previous discussion, α can be represented as
 |
(32) |
and α will have a range of possible values from 0 to 2.
Using this index, the rate at which stem cells are added or removed from a stem cell population by variation in self-renewal probability (dNs→s/dt) can be represented as
 |
(33) |
where
(i) AR s = the activation rate for the stem cell population in question,
(ii) αs = the self-renewal index for the stem cell population.
This same strategy can be used to describe the rate at which new cells are added by a self-renewal mechanism within any downstream proliferating transit cell population. However, in the case of a downstream transit compartment, the total rate at which new cells are added (dNxTOTAL/dt) is equal to the sum of the cells added by self-renewal within that compartment (dNx→x/dt) and the rate at which cells are added by progression of cells from the compartment that is immediately upstream (dNx/dt), from (28) above. Therefore,
 |
(34) |
As a condition of steady state, it is necessary that dNxTOTAL/dt equal to zero. Therefore, it follows that:
 |
(35) |
This relationship illustrates several interesting features of the concept of proliferating transit cell compartments with self-renewal potential. First, in order to avoid instability, that is, uncontrolled increase in the size of a proliferating transit population, the self-renewal capability of a proliferating transit cell population must be limited (ie, the value of αx must be < 1). Sustained values αx ≥ 1 will result in a condition of uncontrolled expansion of the “X” compartment. The potential links between mechanisms of self-renewal in stem cell and transit cell compartments and the development and progression of cancers have been recently discussed, both in concept and in relation to disregulation of specific common pathways (eg, wnt, bcl-2, notch, sonic hedgehog, and cell cycle regulators p53, p21, etc) [113, 126].
Furthermore, if the number of cells entering the “X” compartment from an upstream source (dNx/dt) increases, the only mechanisms of accommodation to maintain steady state (other than direct cell depletion by apoptosis) is to increase the activation rate of the transit population (a counter intuitive response), or to further decrease the value of αx in the transit compartment. Finally, it is interesting to note that if dNx/dt does fall to zero as a result of loss of function in the upstream compartment, αx must increase to 1 to maintain the proliferating transit cell pool. This increase in αx is the functional equivalent of the transit cell population in the “X” compartment functionally occupying the upstream stem cell niche, even if it does not physically move into the anatomic niche of the upstream compartment. Both the requirement for limited self-renewal in proliferating transit cell populations and the possibility of downstream populations functionally “refilling” the loss of function in an upstream stem cell niche have been proposed by previous authors [98].
CONCLUSIONS
This manuscript presents the rational development of a cell-based modeling strategy for exploring the kinetic relationships within and between stem cell compartments and transit compartments within the musculoskeletal system, particularly in bone formation and remodeling. We believe that these tools can be effectively applied to defining and understanding events of tissue formation, repair, and remodeling, throughout embryonic and fetal development and adult life. This modeling strategy is built around quantifiable variables that can be used to define the behavior of stem cell sets: cell number, activation rate, migration, proliferation, and probabilities of differentiation (or transit), self-renewal, and survival. These variables are integrally related to, and in fact may be used to, define the state of function and control the expansion, contraction, and distribution of cell populations within each cell compartment and tissue throughout life. In fact, these variables may be useful in defining the function or “state of health” of each stem cell or tissue compartment.
Current techniques of quantitative histomorphometry in bone provide access to much of the cell-based data that is required for this approach. However, current methods are dominated by predominantly matrix-based information defined by assays of matrix volume, surface area, and mineralization rate. Transition to a more cell-based approach is currently time consuming, laborious, and is limited by the lack of validated and reproducible tools for identification and quantitative assessment of low abundance cell populations and their kinetic properties in three dimensions. However, the difficulty associated with collecting and analyzing data of this type does not diminish the central importance and fundamental biological relevance of cell-level population kinetics to a quantitative mechanistic understanding of settings of bone tissue formation, remodeling, and regeneration. In fact, similar strategies should be applicable to all tissues.
High-resolution digital imaging modalities are rapidly expanding the set of tools that are available for quantitative assay of cell sets in two dimensions (eg, digital microscopy) and also three-dimensional tissue volumes (eg, confocal microscopy, microCT, microPET, and microMRI) [128, 129]. Similarly, image processing tools for rapid and reproducible quantitative characterization of cell sets within these images are increasingly accessible. We hope that presentation of this modeling strategy will help to stimulate innovation and the development of tools to optimize cell-based kinetic analysis. Of particular relevance are unique markers (eg, presentation of unique surface ligands or antigens, morphologic features, and gene expression patterns) to assay cells within defined tissue volumes and compartments (Nx), and tools to determine the life-span (or half-life) of cells (lx) in these populations. These parameters alone will allow calculation of the theoretical rate at which new cells enter or leave each cell compartment (dNx/dt). Knowledge of the number and identity of cells in the upstream compartment (Nx−1) allows further insight into the kinetic parameters operating between the two compartments (ie, the product ARx−1 2μx−1Px). The relationship defined by this product can in turn be further exploited and also tested for validity by assessment of the mitotic rate and prevalence of apoptosis and markers of differentiation among cells within the upstream compartment.
Coupled with a cell-based kinetic framework, histologic analysis at a tissue level can become a powerful vehicle with which to extract clinically relevant information regarding the mechanism underlying the action of pharmacologic agents with osteotropic effects, and to characterize these effects in terms of quantitative changes in AR, proliferation kinetics (μ), or differentiation (Pob) within specific osteoblastic stem cell and transit cell compartments. The effects of extrinsic physical parameters (eg, mechanical unloading or electromagnetic stimulation), genomic variation, or targeted genetic engineering may be similarly assessed. Investigation of time-oriented changes in regional stem cell kinetics during embryonic and postnatal development should also be accessible.
Finally, this strategy may be useful in analysis of musculoskeletal tissue engineering strategies for the regeneration, augmentation, or repair of bone and other tissues. In settings where a starting point is defined by a tissue containing a defined set of seeded or local cells and the desired endpoint is a tissue containing a different set of cells, the quantitative cell-based conceptual framework can be used to define the specific functional biologic requirements needed from the seeded or local stem cell population to achieve the desired result (ie, cell number, activation, proliferation, migration, differentiation, and survival). Similar concepts may also be applicable to tissue engineering in other organ systems outside of bone and musculoskeletal tissues.
References
- de Wynter E A, Emmerson A J, Testa N G. Properties of peripheral blood and cord blood stem cells. Baillieres Best Pract Res Clin Haematol. 1999;12(1-2):1–17. doi: 10.1053/beha.1999.0003. [DOI] [PubMed] [Google Scholar]
- Deans R J, Moseley A B. Mesenchymal stem cells: Biology and potential clinical uses. Exp Hematol. 2000;28(8):875–884. doi: 10.1016/s0301-472x(00)00482-3. [DOI] [PubMed] [Google Scholar]
- Dua H S, Azuara-Blanco A. Limbal stem cells of the corneal epithelium. Surv Ophthalmol. 2000;44(5):415–425. doi: 10.1016/s0039-6257(00)00109-0. [DOI] [PubMed] [Google Scholar]
- Rao M S. Multipotent and restricted precursors in the central nervous system. Anat Rec. 1999;257(4):137–148. doi: 10.1002/(SICI)1097-0185(19990815)257:4<137::AID-AR7>3.0.CO;2-Q. [DOI] [PubMed] [Google Scholar]
- Sainio K, Raatikainen-Ahokas A. Mesonephric kidney—a stem cell factory? Int J Dev Biol. 1999;43(5):435–439. [PubMed] [Google Scholar]
- Seale P, Rudnicki M A. A new look at the origin, function, and “stem-cell” status of muscle satellite cells. Dev Biol. 2000;218(2):115–124. doi: 10.1006/dbio.1999.9565. [DOI] [PubMed] [Google Scholar]
- Zuk P A, Zhu M, Mizuno H, et al. Multilineage cells from human adipose tissue: implications for cell-based therapies. Tissue Eng. 2001;7(2):211–228. doi: 10.1089/107632701300062859. [DOI] [PubMed] [Google Scholar]
- Hawkins N, Garriga G. Asymmetric cell division: from a to z. Genes Dev. 1998;12(23):3625–3638. doi: 10.1101/gad.12.23.3625. [DOI] [PubMed] [Google Scholar]
- Lin H. The self-renewing mechanism of stem cells in the germline. Curr Opin Cell Biol. 1998;10(6):687–693. doi: 10.1016/s0955-0674(98)80108-7. [DOI] [PubMed] [Google Scholar]
- Wilmut I, Schnieke A E, McWhir J, Kind A J, Campbell K H. Viable offspring derived from fetal and adult mammalian cells. Nature. 1997;385(6619):810–813. doi: 10.1038/385810a0. [DOI] [PubMed] [Google Scholar]
- Lagasse E, Connors H, Al-Dhalimy M, et al. Purified hematopoietic stem cells can differentiate into hepatocytes in vivo. Nat Med. 2000;6(11):1229–1234. doi: 10.1038/81326. [DOI] [PubMed] [Google Scholar]
- Petersen B E, Bowen W C, Patrene K D, et al. Bone marrow as a potential source of hepatic oval cells. Science. 1999;284(5417):1168–1170. doi: 10.1126/science.284.5417.1168. [DOI] [PubMed] [Google Scholar]
- Theise N D, Badve S, Saxena R, et al. Derivation of hepatocytes from bone marrow cells in mice after radiation-induced myeloablation. Hepatology. 2000;31(1):235–240. doi: 10.1002/hep.510310135. [DOI] [PubMed] [Google Scholar]
- Jackson K A, Majka S M, Wang H, et al. Regeneration of ischemic cardiac muscle and vascular endothelium by adult stem cells. J Clin Invest. 2001;107(11):1395–1402. doi: 10.1172/JCI12150. [DOI] [PMC free article] [PubMed] [Google Scholar]
- Orlic D, Kajstura J, Chimenti S, et al. Bone marrow cells regenerate infarcted myocardium. Nature. 2001;410(6829):701–705. doi: 10.1038/35070587. [DOI] [PubMed] [Google Scholar]
- Ferrari G, Cusella-De Angelis G, Coletta M, et al. Muscle regeneration by bone marrow-derived myogenic progenitors. Science. 1998;279(5356):1528–1530. doi: 10.1126/science.279.5356.1528. [DOI] [PubMed] [Google Scholar]
- Gussoni E, Soneoka Y, Strickland C D, et al. Dystrophin expression in the mdx mouse restored by stem cell transplantation. Nature. 1999;401(6751):390–394. doi: 10.1038/43919. [DOI] [PubMed] [Google Scholar]
- Jiang Y, Jahagirdar B N, Reinhardt R L, et al. Pluripotency of mesenchymal stem cells derived from adult marrow. Nature. 2002;418(6893):41–49. doi: 10.1038/nature00870. [DOI] [PubMed] [Google Scholar]
- Brazelton T R, Rossi F M, Keshet G I, Blau H M. From marrow to brain: expression of neuronal phenotypes in adult mice. Science. 2000;290(5497):1775–1779. doi: 10.1126/science.290.5497.1775. [DOI] [PubMed] [Google Scholar]
- Kopen G C, Prockop D J, Phinney D G. Marrow stromal cells migrate throughout forebrain and cerebellum, and they differentiate into astrocytes after injection into neonatal mouse brains. Proc Natl Acad Sci USA. 1999;96(19):10711–10716. doi: 10.1073/pnas.96.19.10711. [DOI] [PMC free article] [PubMed] [Google Scholar]
- Mezey E, Chandross K J, Harta G, Maki R A, McKercher S R. Turning blood into brain: cells bearing neuronal antigens generated in vivo from bone marrow. Science. 2000;290(5497):1779–1782. doi: 10.1126/science.290.5497.1779. [DOI] [PubMed] [Google Scholar]
- Sanchez-Ramos J, Song S, Cardozo-Pelaez F, et al. Adult bone marrow stromal cells differentiate into neural cells in vitro. Exp Neurol. 2000;164(2):247–256. doi: 10.1006/exnr.2000.7389. [DOI] [PubMed] [Google Scholar]
- Bjornson C R, Rietze R L, Reynolds B A, Magli M C, Vescovi A L. Turning brain into blood: a hematopoietic fate adopted by adult neural stem cells in vivo. Science. 1999;283(5401):534–537. doi: 10.1126/science.283.5401.534. [DOI] [PubMed] [Google Scholar]
- Morshead C M, Benveniste P, Iscove N N, van der Kooy D. Hematopoietic competence is a rare property of neural stem cells that may depend on genetic and epigenetic alterations. Nat Med. 2002;8(3):268–273. doi: 10.1038/nm0302-268. [DOI] [PubMed] [Google Scholar]
- Jackson K A, Mi T, Goodell M A. Hematopoietic potential of stem cells isolated from murine skeletal muscle. Proc Natl Acad Sci USA. 1999;96(25):14482–14486. doi: 10.1073/pnas.96.25.14482. [DOI] [PMC free article] [PubMed] [Google Scholar]
- Kawada H, Ogawa M. Bone marrow origin of hematopoietic progenitors and stem cells in murine muscle. Blood. 2001;98(7):2008–2013. doi: 10.1182/blood.v98.7.2008. [DOI] [PubMed] [Google Scholar]
- Lemischka I. The power of stem cells reconsidered? Proc Natl Acad Sci USA. 1999;96(25):14193–14195. doi: 10.1073/pnas.96.25.14193. [DOI] [PMC free article] [PubMed] [Google Scholar]
- Magli M C, Levantini E, Giorgetti A. Developmental potential of somatic stem cells in mammalian adults. J Hematother Stem Cell Res. 2000;9(6):961–969. doi: 10.1089/152581600750062426. [DOI] [PubMed] [Google Scholar]
- Prockop D J. Marrow stromal cells as stem cells for nonhematopoietic tissues. Science. 1997;276(5309):71–74. doi: 10.1126/science.276.5309.71. [DOI] [PubMed] [Google Scholar]
- Grigoriadis A E, Heersche J N, Aubin J E. Differentiation of muscle, fat, cartilage, and bone from progenitor cells present in a bone-derived clonal cell population: effect of dexamethasone. J Cell Biol. 1988;106(6):2139–2151. doi: 10.1083/jcb.106.6.2139. [DOI] [PMC free article] [PubMed] [Google Scholar]
- Makino S, Fukuda K, Miyoshi S, et al. Cardiomyocytes can be generated from marrow stromal cells in vitro. J Clin Invest. 1999;103(5):697–705. doi: 10.1172/JCI5298. [DOI] [PMC free article] [PubMed] [Google Scholar]
- Quaini F, Urbanek K, Beltrami A P, et al. Chimerism of the transplanted heart. N Engl J Med. 2002;346(1):5–15. doi: 10.1056/NEJMoa012081. [DOI] [PubMed] [Google Scholar]
- Alison M R, Poulsom R, Jeffery R, et al. Hepatocytes from non-hepatic adult stem cells. Nature. 2000;406(6793):257. doi: 10.1038/35018642. [DOI] [PubMed] [Google Scholar]
- Theise N D, Nimmakayalu M, Gardner R, et al. Liver from bone marrow in humans. Hepatology. 2000;32(1):11–16. doi: 10.1053/jhep.2000.9124. [DOI] [PubMed] [Google Scholar]
- Krause D S, Theise N D, Collector M I, et al. Multi-organ, multi-lineage engraftment by a single bone marrow-derived stem cell. Cell. 2001;105(3):369–377. doi: 10.1016/s0092-8674(01)00328-2. [DOI] [PubMed] [Google Scholar]
- Pereira R F, Halford K W, O'Hara M D, et al. Cultured adherent cells from marrow can serve as long-lasting precursor cells for bone, cartilage, and lung in irradiated mice. Proc Natl Acad Sci USA. 1995;92(11):4857–4861. doi: 10.1073/pnas.92.11.4857. [DOI] [PMC free article] [PubMed] [Google Scholar]
- Asahara T, Murohara T, Sullivan A, et al. Isolation of putative progenitor endothelial cells for angiogenesis. Science. 1997;275(5302):964–967. doi: 10.1126/science.275.5302.964. [DOI] [PubMed] [Google Scholar]
- Choi K, Kennedy M, Kazarov A, Papadimitriou J C, Keller G. A common precursor for hematopoietic and endothelial cells. Development. 1998;125(4):725–732. doi: 10.1242/dev.125.4.725. [DOI] [PubMed] [Google Scholar]
- Shalaby F, Ho J, Stanford W L, et al. A requirement for Flk1 in primitive and definitive hematopoiesis and vasculogenesis. Cell. 1997;89(6):981–990. doi: 10.1016/s0092-8674(00)80283-4. [DOI] [PubMed] [Google Scholar]
- Shi Q, Rafii S, Wu M H, et al. Evidence for circulating bone marrow-derived endothelial cells. Blood. 1998;92(2):362–367. [PubMed] [Google Scholar]
- Owen M. Lineage of osteogenic cells and their relationship to the stromal system. Bone Miner Res. 1985;3:1–25. [Google Scholar]
- Owen M, Friedenstein A J. Stromal stem cells: marrow-derived osteogenic precursors. Ciba Found Symp. 1988;136:42–60. doi: 10.1002/9780470513637.ch4. [DOI] [PubMed] [Google Scholar]
- Azizi S A, Stokes D, Augelli B J, DiGirolamo C, Prockop D J. Engraftment and migration of human bone marrow stromal cells implanted in the brains of albino rats—similarities to astrocyte grafts. Proc Natl Acad Sci USA. 1998;95(7):3908–3913. doi: 10.1073/pnas.95.7.3908. [DOI] [PMC free article] [PubMed] [Google Scholar]
- Woodbury D, Schwarz E J, Prockop D J, Black I B. Adult rat and human bone marrow stromal cells differentiate into neurons. J Neurosci Res. 2000;61(4):364–370. doi: 10.1002/1097-4547(20000815)61:4<364::AID-JNR2>3.0.CO;2-C. [DOI] [PubMed] [Google Scholar]
- Sandhu J S, Clark B R, Boynton E L, et al. Human hematopoiesis in SCID mice implanted with human adult cancellous bone. Blood. 1996;88(6):1973–1982. [PubMed] [Google Scholar]
- Bosch P, Musgrave D S, Lee J Y, et al. Osteoprogenitor cells within skeletal muscle. J Orthop Res. 2000;18(6):933–944. doi: 10.1002/jor.1100180613. [DOI] [PubMed] [Google Scholar]
- Levy M M, Joyner C J, Virdi A S, et al. Osteoprogenitor cells of mature human skeletal muscle tissue: an in vitro study. Bone. 2001;29(4):317–322. doi: 10.1016/s8756-3282(01)00585-3. [DOI] [PubMed] [Google Scholar]
- Fuchs E, Segre J A. Stem cells: a new lease on life. Cell. 2000;100(1):143–155. doi: 10.1016/s0092-8674(00)81691-8. [DOI] [PubMed] [Google Scholar]
- Burwell R G. The function of bone marrow in the incorporation of a bone graft. Clin Orthop. 1985;200:125–141. [PubMed] [Google Scholar]
- Burwell R G. Studies in the transplantation of bone. 8. Treated composite homograft-autografts of cancellous bone: an analysis of inductive mechanisms in bone transplantation. J Bone Joint Surg Br. 1966;48(3):532–566. [PubMed] [Google Scholar]
- Burwell R G. Studies in the transplantation of bone. VII. The composite homograft-autograft of cancellous bone. An analysis of factors leading to osteogenesis in marrow transplants and marrow containing bone graft. J Bone Joint Surg Am. 1964;46B:110. [PubMed] [Google Scholar]
- Friedenstein A J. Precursor cells of mechanocytes. Int Rev Cytol. 1976;47:327–359. doi: 10.1016/s0074-7696(08)60092-3. [DOI] [PubMed] [Google Scholar]
- Aubin J E. Advances in the osteoblast lineage. Biochem Cell Biol. 1998;76(6):899–910. [PubMed] [Google Scholar]
- Beresford J N. Osteogenic stem cells and the stromal system of bone and marrow. Clin Orthop. 1989;240:270–280. [PubMed] [Google Scholar]
- Bruder S P, Fox B S. Tissue engineering of bone. Cell based strategies. Clin Orthop. 1999;367 Suppl:S68–S83. doi: 10.1097/00003086-199910001-00008. [DOI] [PubMed] [Google Scholar]
- Caplan A I. Mesenchymal stem cells. J Orthop Res. 1991;9:641–650. doi: 10.1002/jor.1100090504. [DOI] [PubMed] [Google Scholar]
- Pittenger M F, Mackay A M, Beck S C, et al. Multilineage potential of adult human mesenchymal stem cells. Science. 1999;284(5411):143–147. doi: 10.1126/science.284.5411.143. [DOI] [PubMed] [Google Scholar]
- Conget P A, Minguell J J. Phenotypical and functional properties of human bone marrow mesenchymal progenitor cells. J Cell Physiol. 1999;181(1):67–73. doi: 10.1002/(SICI)1097-4652(199910)181:1<67::AID-JCP7>3.0.CO;2-C. [DOI] [PubMed] [Google Scholar]
- Muschler G F, Midura R J. Connective tissue progenitors: practical concepts for clinical applications. Clin Orthop. 2002;395:66–80. doi: 10.1097/00003086-200202000-00008. [DOI] [PubMed] [Google Scholar]
- Aubin J E. Osteoprogenitor cell frequency in rat bone marrow stromal populations: role for heterotypic cell-cell interactions in osteoblast differentiation. J Cell Biochem. 1999;72:396–410. [PubMed] [Google Scholar]
- Dobson K, Reading L, Scutt A. A cost-effective method for the automatic quantitative analysis of fibroblastic colony-forming units. Calcif Tissue Int. 1999;65(2):166–172. doi: 10.1007/s002239900677. [DOI] [PubMed] [Google Scholar]
- Muschler G F, Boehm C, Easley K. Aspiration to obtain osteoblast progenitor cells from human bone marrow: the influence of aspiration volume. J Bone Joint Surg Am. 1997;79(11):1699–1709. doi: 10.2106/00004623-199711000-00012. [DOI] [PubMed] [Google Scholar]
- Muschler G F, Nitto H, Boehm C, Easley K. Age-and gender-related changes in the cellularity of human bone marrow and the prevalence of osteoblastic progenitors. J Orthop Res. 2001;19(1):117–125. doi: 10.1016/S0736-0266(00)00010-3. [DOI] [PubMed] [Google Scholar]
- Fell H B. The osteogenic capacity in vitro of periosteum and endosteum isolated from the limb skeleton of fowl embryos and young chiks. J Anat. 1932;66:157–180. [PMC free article] [PubMed] [Google Scholar]
- Nakahara H, Dennis J E, Bruder S P, Haynesworth S E, Lennon D P, Caplan A I. In vitro differentiation of bone and hypertrophic cartilage from periosteal-derived cells. Exp Cell Res. 1991;195(2):492–503. doi: 10.1016/0014-4827(91)90401-f. [DOI] [PubMed] [Google Scholar]
- Nakahara H, Goldberg V M, Caplan A I. Culture-expanded human periosteal-derived cells exhibit osteochondral potential in vivo. J Orthop Res. 1991;9(4):465–476. doi: 10.1002/jor.1100090402. [DOI] [PubMed] [Google Scholar]
- O'Driscoll S W. Articular cartilage regeneration using periosteum. Clin Orthop. 1999;367 SUPPLE:S186–S203. doi: 10.1097/00003086-199910001-00020. [DOI] [PubMed] [Google Scholar]
- Gimble J M, Robinson C E, Wu X, Kelly K A, et al. The function of adipocytes in the bone marrow stroma: an update. Bone. 1996;19(5):421–428. doi: 10.1016/s8756-3282(96)00258-x. [DOI] [PubMed] [Google Scholar]
- Brighton C T, Lorich D G, Kupcha R, Reilly T M, Jones A R, Woodbury R A. The pericyte as a possible osteoblast progenitor cell. Clin Orthop. 1992;275:287–299. [PubMed] [Google Scholar]
- Reilly T M, Seldes R, Luchetti W, Brighton C T. Similarities in the phenotypic expression of pericytes and bone cells. Clin Orthop. 1998;346:95–103. [PubMed] [Google Scholar]
- Westen H, Bainton D F. Association of alkaline-phosphatase-positive reticulum cells in bone marrow with granulocytic precursors. J Exp Med. 1979;150(4):919–937. doi: 10.1084/jem.150.4.919. [DOI] [PMC free article] [PubMed] [Google Scholar]
- Bianco P, Boyde A. Confocal images of marrow stromal (Westen-Bainton) cells. Histochemistry. 1993;100(2):93–99. doi: 10.1007/BF00572894. [DOI] [PubMed] [Google Scholar]
- Bianco P, Bradbeer J N, Riminucci M, Boyde A. Marrow stromal (Western-Bainton) cells: identification, morphometry, confocal imaging and changes in disease. Bone. 1993;14(3):315–320. doi: 10.1016/8756-3282(93)90158-7. [DOI] [PubMed] [Google Scholar]
- Bianco P, Cossu G. Uno, nessuno e centomila: searching for the identity of mesodermal progenitors. Exp Cell Res. 1999;251(2):257–263. doi: 10.1006/excr.1999.4592. [DOI] [PubMed] [Google Scholar]
- Huard J, Fu F H. Birkhauser; Cambridge, Mass: 2000. Gene Therapy and Tissue Engineering in Orthopaedic and Sports Medicine. Methods in Bioengineering. [Google Scholar]
- Frost H M. Skeletal structural adaptations to mechanical usage (SATMU): 2. Redefining Wolff's law: the remodeling problem. Anat Rec. 1990;226(4):414–422. doi: 10.1002/ar.1092260403. [DOI] [PubMed] [Google Scholar]
- Frost H M. Bone histomorphometry: Correction of the labeling “escape error”. In: Recker R R, editor. CRC Press; Boca Raton, Fla: 1983. pp. 133–142. Bone Histomorphometry: Techniques and Interpretation. [Google Scholar]
- Frost H M. Tetracycline-based histological analysis of bone remodeling. Calcif Tissue Res. 1969;3(3):211–237. doi: 10.1007/BF02058664. [DOI] [PubMed] [Google Scholar]
- Parfitt A M. Osteonal and hemi-osteonal remodeling: the spatial and temporal framework for signal traffic in adult human bone. J Cell Biochem. 1994;55(3):273–286. doi: 10.1002/jcb.240550303. [DOI] [PubMed] [Google Scholar]
- Parfitt A M, Drezner M K, Glorieux F H, et al. Bone histomorphometry: standardization of nomenclature, symbols, and units. Report of the ASBMR histomorphometry nomenclature committee. J Bone Miner Res. 1987;2(6):595–610. doi: 10.1002/jbmr.5650020617. [DOI] [PubMed] [Google Scholar]
- Frost H M. CRC press; Boca Raton, Fla: 1986. Intermediary Organization of the Skeleton. [Google Scholar]
- Marotti G, Ferretti M, Muglia M A, Palumbo C, Palazzini S. A quantitative evaluation of osteoblast-osteocyte relationships on growing endosteal surface of rabbit tibiae. Bone. 1992;13(5):363–368. doi: 10.1016/8756-3282(92)90452-3. [DOI] [PubMed] [Google Scholar]
- Jaworski Z F, Hooper C. Study of cell kinetics within evolving secondary Haversian systems. J Anat. 1980;131(1):91–102. [PMC free article] [PubMed] [Google Scholar]
- Manolagas S C. Birth and death of bone cells: basic regulatory mechanisms and implications for the pathogenesis and treatment of osteoporosis. Endocr Rev. 2000;21(2):115–137. doi: 10.1210/edrv.21.2.0395. [DOI] [PubMed] [Google Scholar]
- Parfitt A M, Kleerekoper M, Villanueva A R. Osteopress; Copenhagen: 1987. Increased bone age: mechanisms and consequences; pp. 301–308. Osteoporosis . [Google Scholar]
- Frost H M. Charles C. Thomas; Springfield, IL: 1963. Bone Remodeling Dynamics. [Google Scholar]
- Frost H M. In vivo osteocyte death. J Bone Joint Surg Am. 1960;42A:138–143. [PubMed] [Google Scholar]
- Frost H M. Micropetrosis. J Bone Joint Surg Am. 1960;42A:144–150. [PubMed] [Google Scholar]
- Qiu S, Rao D S, Palnitkar S, Parfitt A M. Age and distance from the surface but not menopause reduce osteocyte density in human cancellous bone. Bone. 2002;31(2):313–318. doi: 10.1016/s8756-3282(02)00819-0. [DOI] [PubMed] [Google Scholar]
- Howard V, Reid S, Baddeley A, Boyde A. Unbiased estimation of particle density in the tandem scanning reflected light microscope. J Microsc. 1985;138(pt 2):203–212. doi: 10.1111/j.1365-2818.1985.tb02613.x. [DOI] [PubMed] [Google Scholar]
- Cane V, Marotti G, Volpi G, et al. Size and density of osteocyte lacunae in different regions of long bones. Calcif Tissue Int. 1982;34(6):558–563. doi: 10.1007/BF02411304. [DOI] [PubMed] [Google Scholar]
- Mullender M G, Huiskes R, Versleyen H, Buma P. Osteocyte density and histomorphometric parameters in cancellous bone of the proximal femur in five mammalian species. J Orthop Res. 1996;14(6):972–979. doi: 10.1002/jor.1100140618. [DOI] [PubMed] [Google Scholar]
- Favus M, editor. 4th ed Lippincott Williams and Wilkins; Philadelphia, Pa: 1999. Primer on the Metabolic Bone Diseases and Disorders of Mineral Metabolism. [Google Scholar]
- Mullender M G, van der Meer D D, Huiskes R, Lips P. Osteocyte density changes in aging and osteoporosis. Bone. 1996;18(2):109–113. doi: 10.1016/8756-3282(95)00444-0. [DOI] [PubMed] [Google Scholar]
- Farnum C E, Wilsman N J. Determination of proliferative characteristics of growth plate chondrocytes by labeling with bromodeoxyuridine. Calcif Tissue Int. 1993;52(2):110–119. doi: 10.1007/BF00308319. [DOI] [PubMed] [Google Scholar]
- Loeffler M, Wichmann H E. A comprehensive mathematical model of stem cell proliferation which reproduces most of the published experimental results. Cell Tissue Kinet. 1980;13(5):543–561. doi: 10.1111/j.1365-2184.1980.tb00494.x. [DOI] [PubMed] [Google Scholar]
- Potten C S, Lajtha L G. Stem cells versus stem lines. Ann N Y Acad Sci. 1982;397:49–61. doi: 10.1111/j.1749-6632.1982.tb43416.x. [DOI] [PubMed] [Google Scholar]
- Potten C S, Loeffler M. Stem cells: attributes, cycles, spirals, pitfalls and uncertainties. Lessons for and from the crypt. Development. 1990;110(4):1001–1020. doi: 10.1242/dev.110.4.1001. [DOI] [PubMed] [Google Scholar]
- Potten C S, Morris R J. Epithelial stem cells in vivo. J Cell Sci Suppl. 1988;10:45–62. doi: 10.1242/jcs.1988.supplement_10.4. [DOI] [PubMed] [Google Scholar]
- Wilsman N J, Farnum C E, Green E M, Lieferman E M, Clayton M K. Cell cycle analysis of proliferative zone chondrocytes in growth plates elongating at different rates. J Orthop Res. 1996;14(4):562–572. doi: 10.1002/jor.1100140410. [DOI] [PubMed] [Google Scholar]
- Sato M, Zeng G Q, Turner C H. Biosynthetic human parathyroid hormone (1-34) effects on bone quality in aged ovariectomized rats. Endocrinology. 1997;138(10):4330–4337. doi: 10.1210/endo.138.10.5440. [DOI] [PubMed] [Google Scholar]
- Parfitt A M. Bone-forming cells in clinical conditions. In: Hall B K, editor. Telford Press; Caldwell, NJ: 1990. pp. 351–429. Bone. A Treatise. The Osteoblast and Osteocyte . [Google Scholar]
- Toyosaki-Maeda T, Takano H, Tomita T, et al. Differentiation of monocytes into multinucleated giant bone-resorbing cells: two-step differentiation induced by nurse-like cells and cytokines. Arthritis Res. 2001;3(5):306–310. doi: 10.1186/ar320. [DOI] [PMC free article] [PubMed] [Google Scholar]
- Bianco P, Riminucci M, Gronthos S, Robey P G. Bone marrow stromal stem cells: nature, biology, and potential applications. Stem Cells. 2001;19(3):180–192. doi: 10.1634/stemcells.19-3-180. [DOI] [PubMed] [Google Scholar]
- Bianco P, Riminucci M, Kuznetsov S, Robey P G. Multipotential cells in the bone marrow stroma: regulation in the context of organ physiology. Crit Rev Eukaryot Gene Expr. 1999;9(2):159–173. doi: 10.1615/critreveukargeneexpr.v9.i2.30. [DOI] [PubMed] [Google Scholar]
- Bianco P, Robey P. Diseases of bone and the stromal cell lineage. J Bone Miner Res. 1999;14(3):336–341. doi: 10.1359/jbmr.1999.14.3.336. [DOI] [PubMed] [Google Scholar]
- Kuznetsov S A, Mankani M H, Gronthos S, Satomura K, Bianco P, Robey P G. Circulating skeletal stem cells. J Cell Biol. 2001;153(5):1133–1140. doi: 10.1083/jcb.153.5.1133. [DOI] [PMC free article] [PubMed] [Google Scholar]
- Cairns J. Mutation selection and the natural history of cancer. Nature. 1975;255(5505):197–200. doi: 10.1038/255197a0. [DOI] [PubMed] [Google Scholar]
- Lajtha L G. Stem cell concepts. Nouv Rev Fr Hematol. 1979;21(1):59–65. [PubMed] [Google Scholar]
- Lajtha L G. Stem cell concepts. Differentiation. 1979;14(1-2):23–34. doi: 10.1111/j.1432-0436.1979.tb01007.x. [DOI] [PubMed] [Google Scholar]
- Potten C S, Loeffler M. 4. Vol. 110. Academic Press; London: 1990. Stem cells: attributes, cycles, spirals, pitfalls and uncertaintie Lessons for and from the crypt; pp. 1001–1020. Stem Cells . [DOI] [PubMed] [Google Scholar]
- Wichmann H E, Loeffler M, Schmitz S. A concept of hemopoietic regulation and its biomathematical realization. Blood Cells. 1988;14(2-3):411–429. [PubMed] [Google Scholar]
- Reya T, Morrison S J, Clarke M F, Weissman I L. Stem cells, cancer, and cancer stem cells. Nature. 2001;414(6859):105–111. doi: 10.1038/35102167. [DOI] [PubMed] [Google Scholar]
- Weissman I L. Stem cells: units of development, units of regeneration, and units in evolution. Cell. 2000;100(1):157–168. doi: 10.1016/s0092-8674(00)81692-x. [DOI] [PubMed] [Google Scholar]
- Jaworski Z F, Duck B, Sekaly G. Kinetics of osteoclasts and their nuclei in evolving secondary Haversian systems. J Anat. 1981;133(pt 3):397–405. [PMC free article] [PubMed] [Google Scholar]
- Vashishth D, Fyhrie D P. Orthopaedic Research Society; San Francisco, Calif: 2001. The correlation between osteocyte number and microdamage density is not universal. Proceedings of the Orthopaedic Research Society 47th Annual Meeting . [Google Scholar]
- Bianco P, Robey P G. Stem cells in tissue engineering. Nature. 2001;414(6859):118–121. doi: 10.1038/35102181. [DOI] [PubMed] [Google Scholar]
- Villanueva A R, Matthews C.H E, Parfitt A M. Relationship between the size and shape of osteoblasts and the width of the osteoid seams in bone. In: Takahashi H, editor. Handbook of Bone Morphometry. Nishimura; Niigata, Japan: 1983. pp. 191–196. [Google Scholar]
- Tomkinson A, Reeve J, Shaw R W, Noble B S. The death of osteocytes via apoptosis accompanies estrogen withdrawal in human bone. J Clin Endocrinol Metab. 1997;82(9):3128–3135. doi: 10.1210/jcem.82.9.4200. [DOI] [PubMed] [Google Scholar]
- Weinstein R S, Jilka R L, Parfitt A M, Manolagas S C. Inhibition of osteoblastogenesis and promotion of apoptosis of osteoblasts and osteocytes by glucocorticoids. Potential mechanisms of their deleterious effects on bone. J Clin Invest. 1998;102(2):274–282. doi: 10.1172/JCI2799. [DOI] [PMC free article] [PubMed] [Google Scholar]
- Bianco P, Bonucci E. Endosteal surfaces in hyperparathyroidism: an enzyme cytochemical study on low-temperature-processed, glycol-methacrylate-embedded bone biopsies. Virchows Arch A Pathol Anat Histopathol. 1991;419(5):425–431. doi: 10.1007/BF01605077. [DOI] [PubMed] [Google Scholar]
- Riminucci M, Fisher L W, Shenker A, et al. Fibrous dysplasia of bone in the Mccune-Albright syndrome: abnormalities in bone formation. Am J Pathol. 1997;151(6):1587–1600. [PMC free article] [PubMed] [Google Scholar]
- Wang A, Martin J A, Lembke L A, Midura R J. Reversible suppression of in vitro biomineralization by activation of protein kinase A. J Biol Chem. 2000;275(15):11082–11091. doi: 10.1074/jbc.275.15.11082. [DOI] [PubMed] [Google Scholar]
- Merok J R, Sherley J L. Breaching the kinetic barrier to in vitro somatic stem cell propagation. J Biomed Biotechnol. 2001;1(1):25–27. doi: 10.1155/S1110724301000067. [DOI] [PMC free article] [PubMed] [Google Scholar]
- Rambhatla L, Bohn S A, Stadler P B, Boyd J T, Coss R A, Sherley J L. Cellular senescence: ex vivo p53-dependent asymmetric cell kinetics. J Biomed Biotechnol. 2001;1(1):28–37. doi: 10.1155/S1110724301000079. [DOI] [PMC free article] [PubMed] [Google Scholar]
- Sherley J L. Asymmetric cell kinetics genes: the key to expansion of adult stem cells in culture. Stem Cells. 2002;20(6):561–572. doi: 10.1634/stemcells.20-6-561. [DOI] [PubMed] [Google Scholar]
- Lamprecht J. Symmetric and asymmetric cell division in rat corneal epithelium. Cell Tissue Kinet. 1990;23(3):203–216. doi: 10.1111/j.1365-2184.1990.tb01116.x. [DOI] [PubMed] [Google Scholar]
- Jinnai H, Watashiba H, Kajihara T, et al. Surface curvatures of trabecular bone microarchitecture. Bone. 2002;30(1):191–194. doi: 10.1016/s8756-3282(01)00672-x. [DOI] [PubMed] [Google Scholar]
- Wachter N J, Krischak G D, Mentzel M, et al. Correlation of bone mineral density with strength and microstructural parameters of cortical bone in vitro. Bone. 2002;31(1):90–95. doi: 10.1016/s8756-3282(02)00779-2. [DOI] [PubMed] [Google Scholar]