Abstract
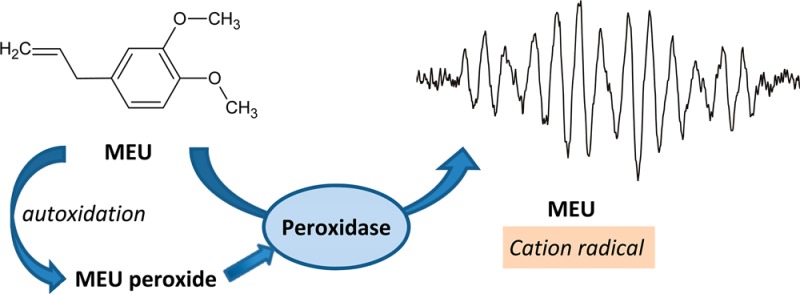
Methyleugenol, the methyl ether of eugenol, both of which are flavorant constituents of spices, has been listed by the National Toxicology Program’s Report on Carcinogens as reasonably anticipated to be a human carcinogen. This finding is based on the observation of increased incidence of malignant tumors at multiple tissue sites in experimental animals of different species. By contrast, eugenol is not listed. In this study, we show that both methyleugenol and eugenol readily undergo peroxidative metabolism in vitro to form free radicals with large hyperfine interactions of the methylene allylic hydrogen atoms. These large hyperfine splittings indicate large electron densities adjacent to those hydrogen atoms. Methyleugenol undergoes autoxidation such that the commercial product contains 10–30 mg/L hydroperoxide and is capable of activating peroxidases without the presence of added hydrogen peroxide. Additionally, the hydroperoxide is not a good substrate for catalase, which demonstrates that these antioxidant defenses will not be effective in protecting against methyleugenol exposure.
Introduction
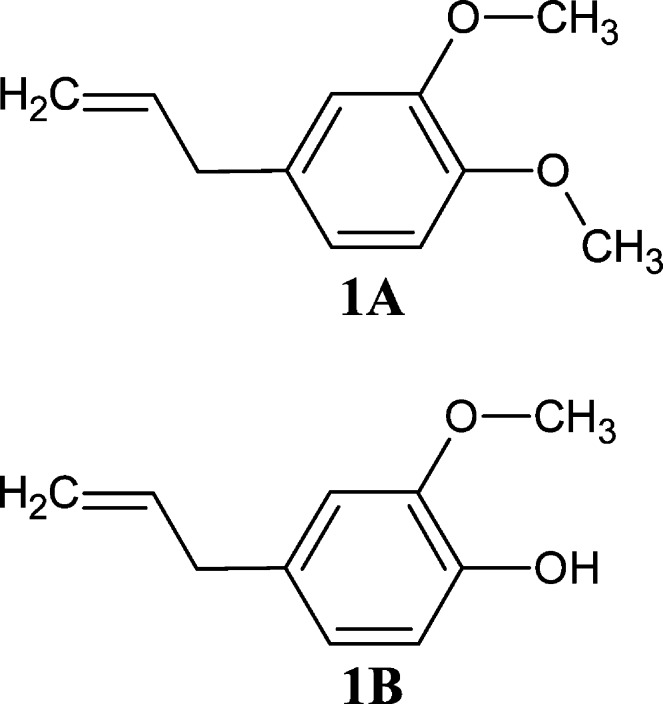
Methyleugenol (Chart 1A, CAS # 93-15-2) is the methyl ether of eugenol (Chart1B, CAS # 97-53-0), which is itself a major constituent of spices such as clove, allspice, and bay leaves1 and is known to induce contact allergies.2,3 Methyleugenol (MEU) and eugenol (EUG) are allylalkoxybenzene derivatives that are present as flavoring constituents in foodstuffs or are added as flavor extenders. Their chemical structures resemble those of safrole, a known carcinogen, and estragole.4 A safety assessment of allylalkoxybenzene derivatives was prepared by the Expert Panel of the Flavor and Extract Manufacturers’ Association, which summarized previous findings about the safety of MEU. They conclude that the present human exposure to MEU does not pose a significant cancer risk.5
Chart 1. Chemical Structures of Methyleugenol (MEU, 4-Allyl-1,2-dimethoxybenzene [CAS 93-15-2], 1A) and Eugenol (EUG, 4-Allyl-2-methoxyphenol [CAS 97-53-0], 1B).
By contrast, the Twelfth Report on Carcinogens of the National Toxicology Program concludes that MEU is reasonably anticipated to be a human carcinogen.6 This finding is based on the observation of increased incidence of malignant tumors in the liver, bile duct, glandular stomach, kidney, mesothelium, mammary gland, and skin in experimental animals.6 The mechanism of hepatic carcinogenesis appears to result from the bioactivation of MEU to DNA-reactive intermediates via hydroxylation of the 1′ position of the allylic side chain and subsequent sulfation to generate 1′-sulfoxymethyleugenol,7−9 conversions that can occur in the liver and that have also been demonstrated to occur in the human liver.10In vitro studies have identified the human liver cytochrome P450 1A2 as the enzyme that is the likely bioactivator of MEU.11 A 5-fold difference in activities occurred among 15 human microsome samples in a correlation study, which suggested that individual differences, arising from lifestyle factors such as smoking or drug use, can influence the likelihood that MEU exposure will lead to harmful effects.11 Additionally, the European Commission’s Scientific Committee on Food formulated an opinion on MEU, based largely on the rodent studies,12 concluding it to be a multisite, multispecies genotoxin and carcinogen for which no threshold could be assumed and for which no safe exposure limit could be established.12 The use of pure MEU has been banned in the European Union but not in the U.S.A.
The biological and biochemical mechanisms by which alkenylbenzenes cause mutagenesis and carcinogenesis are areas of active research. Bioactivation of these molecules to their ultimate carcinogens takes place through cytochromes P450 and sulfotransferases.13 Kinetic studies in vitro of [14C]MEU and [14C]EUG in human, mouse, and rat liver and lung tissue fractions showed that the compounds are metabolized differently: MEU is converted to significant amounts of the 1-hydroxy proximate carcinogen, but EUG is glucuronidated, thus avoiding the formation of 1-hydroxyeugenol.8 In a study of MEU and its oxidative metabolites in Chinese hamster lung fibroblasts, marginal cytotoxic effects were not observed, but MEU and 1′-hydroxymethyleugenol at concentrations of ≥10 μM caused DNA strand breaks.14 MEU bioactivation and detoxification were studied by a physiologically based kinetic approach comparing human and rat models, and the results obtained revealed that there were no substantial species differences in the formation of the reactive ultimate carcinogenic l′-sulfoxymethyleugenol metabolite.15,16
MEU is a ubiquitous environmental component with annual use in excess of 30,000 kg in the United States’ food, perfume, and pesticide industries.17 It is present in soaps and perfumes as a fragrance, in commercial food products as a flavorant, and in pesticides as an insect attractant.12 High resolution mass spectrometric analyses of serum samples from 213 nonfasting adult participants in the Third National Health and Nutrition Examination Survey detected methyleugenol in 98% of samples at a mean concentration of 24 pg/g (range <3.1–390 pg/g).18 Fasted human volunteers who consumed controlled amounts of MEU had prefeeding serum concentrations averaging 16.2 pg/g MEU. Mean serum levels increased following MEU consumption and then decreased over time with metabolism: 53.9 pg/g (15 min); 42.9 (30 min); 37.0 (60 min); and 25.2 (120 min) with an elimination half-life of ca. 90 min.18,19 The total human oral intake of MEU has been estimated as 0.77 μg/kg-bw/d, of which 14% is added MEU.20
Since MEU is carcinogenic in extrahepatic tissues which have lower levels of cytochrome P450s and sulfotransferases, we decided to investigate the oxidation of MEU and the related EUG by peroxidases, which are widely distributed in extrahepatic tissues.
Although phenoxyl radicals of EUG have been investigated by electron paramagnetic resonance spectroscopy (EPR), no reports of MEU radicals have appeared. Atsumi et al., Okada, et al., Satoh et al., and Fujisawa et al. observed phenoxyl radicals of EUG in alkaline solution but do not report any EPR hyperfine analysis.21−24 Nakagawa et al. reported resolved and assigned EPR spectra for sesmolyl and related phenoxyl radicals that were generated by continuous UV-irradiation of benzene solutions of the corresponding phenols.25 Thompson et al. oxidized EUG to its phenoxyl radical using HRP in a fast-flow system26 and report EPR parameters similar to those for related methoxy-substituted phenoxyl radicals.27
Although there have been no previous reports of EPR observations of MEU radical cations, there have been literature reports of chemical or electrochemical production of methoxybenzene radical cations. Zweig and co-workers used controlled potential electrolysis to generate methoxy-substituted benzene cation radicals in situ for EPR studies. They also produced radicals of pentamethoxybenzene and 1,4-dimethoxybenzene in 96% sulfuric acid.28 Siero and co-workers observed highly resolved EPR spectra of radical cations generated by phenyl iodine(III)bis(trifluoroacetate) [PIFA] as the electron acceptor in a charge transfer complex formed by methoxybenzenes and PIFA in hexafluoropropanol solution.29 Also Kersten and co-workers reported the biochemical generation of methoxybenzene radical cations of 10 of the 12 possible methoxybenzene congeners, including cis- and trans-1,4-dimethoxybenzene, 1,2,3,4-tetramethoxybenzene, and 1,2,4,5-tetramethoxybenzene by ligninase peroxidase and hydrogen peroxide.30−32 By contrast, HRP was only able to oxidize the four congeners with the lowest half-wave oxidation potentials. Biochemical oxidation of these molecules produced methoxy-substituted benzoquinones and methanol and demonstrated that the quinone oxygen atoms were derived from the solvent water.
In this study, we report the first observation of radical cations of MEU produced by HRP metabolism. Observation of radical cations of several related compounds is also reported, and the EPR spectral assignments for this series of radicals form a consistent pattern. Free radical metabolites have been widely implicated as contributing to disease states and may be involved in MEU carcinogenicity in extrahepatic tissues.
Materials and Methods
Chemicals and Biochemicals
Methyleugenol (4-allyl-1,2-dimethoxybenzene); eugenol (4-allyl-2-methoxyphenol); 3,4-dimethoxytoluene; 2-methoxy-4-methylphenol; 3,4-dimethoxyphenol; cerium(IV) sulfate; sulfuric acid; DTPA; hemoglobin; and HRP (Type VI) were purchased from Sigma-Aldrich (St. Louis, MO). Reagents were generally of the highest purity available and were used as received. The buffer for those reactions using it was 50 mM, pH 7.4, phosphate buffer prepared by diluting a 500 mM solution treated with Chelex 100 resin (Bio-Rad, Hercules, CA) to remove adventitious transition metal ions. These solutions also contained either 1.0 mM or 0.1 mM DTPA to further hinder trace metal catalysis. The H2O2 concentration was confirmed by absorbance measurements at 240 nm (ε240 = 39.4 M–1 cm–1).40 In some experiments, the commercial preparation of HRP was loaded onto a PD-10 gel filtration column and eluted with 50 mM phosphate buffer, pH 7.4, treated with chelex before use. This was done primarily to remove reducing impurities from the sample. The concentration of HRP was determined from the Soret maximum at 412 nm (εnative HRP = 102 mM–1 cm–1).41
EPR Experiments
EPR spectroscopic measurements were used to detect and identify free radical intermediates. Unstable intermediates were detected by means of fast-flow EPR experiments performed in a manner similar to that in our previous reports.33,34 Reagents placed in solution reservoirs were pumped though plastic hoses by means of a Masterflex L/S microprocessor-controlled peristaltic pump (Cole-Parmer, Vernon Hills, IL) to a quartz fast-flow mixing chamber flat cell (Type WG-804, 10 mm width, Wilmad Glass Co., Buena, NJ). Flow rates for each solution could be selected from 10 mL/min to greater than 100 mL/min.
EPR measurements were made using an Elexsys EPR spectrometer operated at a frequency near 9.7 GHz and a magnetic field near 348 mT (Bruker Biospin, Billerica, MA). The magnetic field at the ER4122 super hi-Q microwave cavity was modulated at 100 kHz, affording the first-derivative EPR spectra that were recorded as computer files using Bruker’s software. Subsequent analysis, interpretation, and simulation of the spectra used locally produced software.35
UV–Visible Spectroscopic Experiments
Absorption spectra were recorded on a Cary 100 UV–visible spectrometer (Varian, Victoria, Australia) using 1.0 cm-path length quartz cuvettes.
Miscellaneous
Hydroperoxide tests used Quantofix peroxide test strips (Sigma-Aldrich, Inc., Milwaukee, WI) that have a sensitivity reported to detect a lower limit of 1 mg/L peroxide. Figures were prepared using the Origin (Origin Lab, Inc., Northampton, MA) or CorelDraw (Corel Corporation, Ottawa, Canada) software packages.
Results
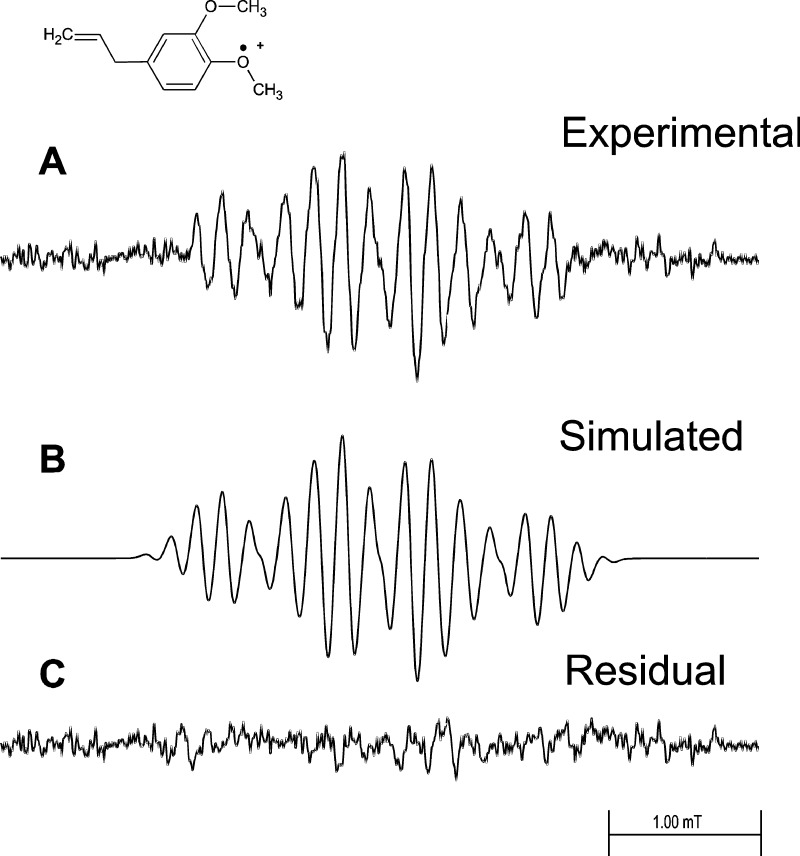
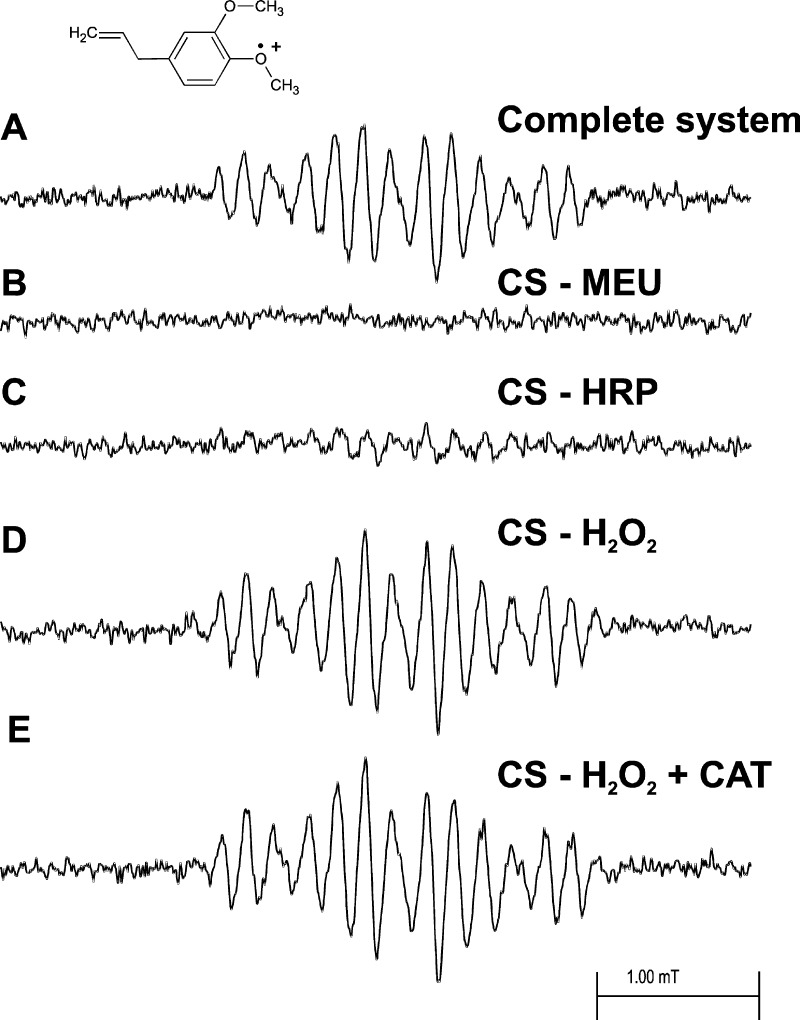
MEU oxidized by HRP activated by hydrogen peroxide in a fast-flow system produced a well-resolved EPR spectrum of the corresponding radical cation (Figure 1A). Essentially the same spectrum resulted when MEU was oxidized chemically by Ce(IV) in sulfuric acid solution (data not shown). The same spectrum was also produced when MEU was oxidized by hemoglobin and hydrogen peroxide in a fast-flow system (data not shown). Control experiments (Figure 2) produced an anomalous result. When either MEU (Figure 2B) or HRP (Figure 2C) was omitted, no EPR spectrum was observed, as expected. However, when hydrogen peroxide was omitted, a strong EPR signal was still observed (Figure 2D), and the same spectrum was observed in the presence of catalase at a concentration 70 times that of the peroxidase (Figure 2E).
Figure 1.
EPR fast-flow spectra of the MEU radical produced in a system of MEU, H2O2, and HRP. The concentrations of MEU, H2O2, and HRP in the flat cell were 1.75 mM, 13 mM, and 0.46 μM, respectively. Oxygen was removed from the reagent solutions by bubbling 99.9999% pure nitrogen gas through them. Equal volumes of a solution of MEU/H2O2 and a solution of HRP in 100 mM phosphate buffer, pH 7.4, were mixed milliseconds before they entered the flat cell at a total flow rate of 40 mL/min. The final solution also contained 10% v/v ethanol and 0.10 mM DTPA. (A) Complete system with MEU, H2O2, and HRP. (B) Simulated EPR spectrum with the coupling constants given in Table 1. (C) Residual plot produced when simulated spectrum B is subtracted from experimental spectrum A. EPR spectra were recorded at 20 mW microwave power, 0.10 mT field modulation, 5.0 mT field sweep width, 164 ms time constant, 82 ms conversion time, and 33 scans of 1024 data points.
Figure 2.
EPR fast-flow spectra of the MEU radical produced in a system of MEU, H2O2, and HRP. The concentrations of MEU, H2O2, and HRP in the flat cell were 1.75 mM, 13 mM, and 0.46 μM, respectively. Oxygen was removed from the reagent solutions by bubbling 99.9999% pure nitrogen gas through them. Equal volumes of a solution of MEU/H2O2 and a solution of HRP in 100 mM phosphate buffer, pH 7.4, were mixed milliseconds before they entered the flat cell at a total flow rate of 40 mL/min. The final solution also contained 10% v/v ethanol and 0.10 mM DTPA. (A) Complete system with MEU, H2O2, and HRP. (B) As in panel A but with no MEU. (C) As in panel A but with no HRP. (D) As in panel A but with no H2O2. (E) As in panel A but with no H2O2 and 32 μM catalase added. The spectrometer operating conditions were the same as those described in Figure 1.
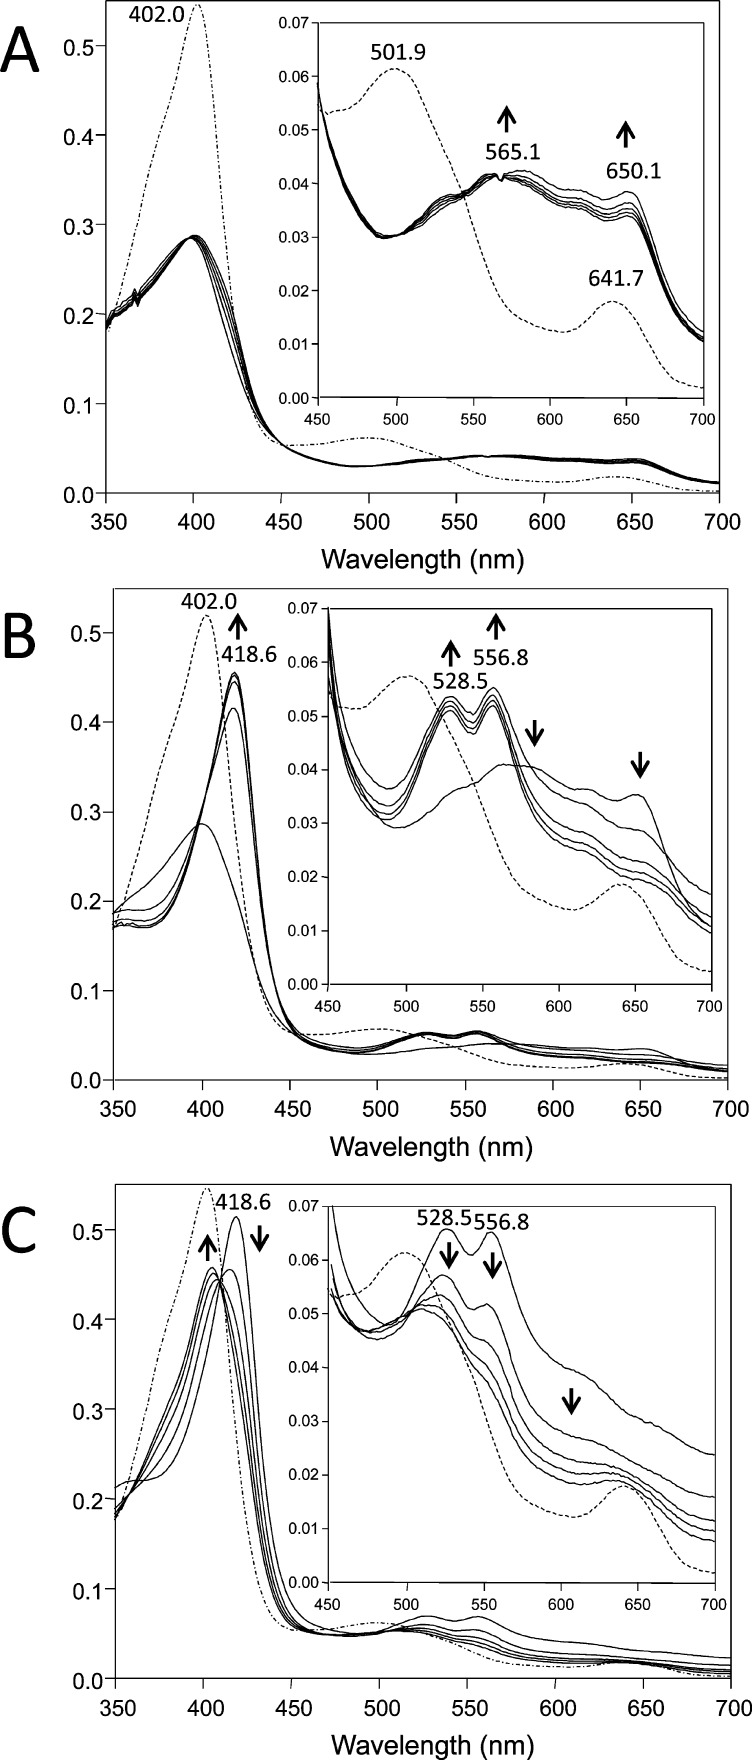
Alkenylbenzenes, such as MEU, with allylic hydrogen atoms are known to be susceptible to autoxidation reactions that produce organic hydroperoxides.36−38 The Quantofix test strip assay of stock MEU indicated the presence of hydroperoxides in the range of 10 to 30 mg/L. The presence of endogenous hydroperoxides in stock MEU and the ability of hydroperoxide to activate HRP and sustain the oxidation of MEU to its radical were established by UV–visible spectroscopic measurements. The spectrum obtained for native HRP before the addition of H2O2 and/or MEU exhibits two characteristic bands at 502 and 642 nm and the Soret band at 402 nm (Figure 3A). The addition of H2O2 resulted in the immediate decrease in absorbance of the Soret band and the appearance of peaks with maxima at approximately 565 and 650 nm, which are associated with the formation of Compound I. The addition of 1.75 mM MEU 2 min after the addition of H2O2 caused a shift of the Soret peak from 402 to 419 nm and the appearance of two peaks at 528 and 557 nm that are characteristic of Compound II (Figure 3B). During the first 4 min following the addition of MEU, the Soret intensity increased quickly, after which it remained at a constant level.
Figure 3.
UV–visible detection of enzymatic intermediates produced in a system of MEU, H2O2, and HRP. The reaction mixtures consisted of HRP (5.3 μM) in 50 mM phosphate buffer, pH 7.4, at 25 °C. The dotted lines are for native HRP before the addition of H2O2 and/or MEU. Absorption spectra were recorded every 2 min after the initiation of the reaction. Spectral changes are indicated by arrows. (A) Spectral changes from native HRP to Compound I. The reaction was initiated by the addition of 10 μM H2O2. (B) Spectral changes from Compound I to Compound II. Compound I was prepared as described in A, and 1.75 mM MEU was added 2 min after the addition of peroxide. (C) Formation and spontaneous decomposition of Compound II in the absence of exogenously added H2O2. In this case, the reaction was initiated by the addition of 2.5 mM MEU, and scans were recorded every 2 min.
The presence of endogenous hydroperoxide in the stock of MEU was investigated by incubating HRP with MEU in the absence of exogenously added H2O2. The spectral variation observed between 2 and 10 min after the addition of MEU is presented in Figure 3C. The first scan following the addition of MEU to the native enzyme showed the formation of species similar to Compound II, with absorption maxima at 419, 528, and 557 nm. The subsequent spectra showed that Compound II slowly reverted to the native form. None of the spectra observed showed the dramatic decrease in absorbance of the Soret band and the absorption peaks at 565 and 650 nm that are characteristic of Compound I, in accordance with the instability of this intermediate in the presence of one-electron reductants.40,41
That an endogenous hydroperoxide was effectively responsible for the accumulation of Compound II in the reaction system has been tested by the addition of catalase. Similar changes in spectra were obtained when catalase was added immediately before the injection of MEU in the above reaction mixture (not shown). However, in the presence of the H2O2 scavenger, slightly less Compound II was generated, but the effect was small, indicating that the endogenous hydroperoxide did not react well with catalase (data not shown).
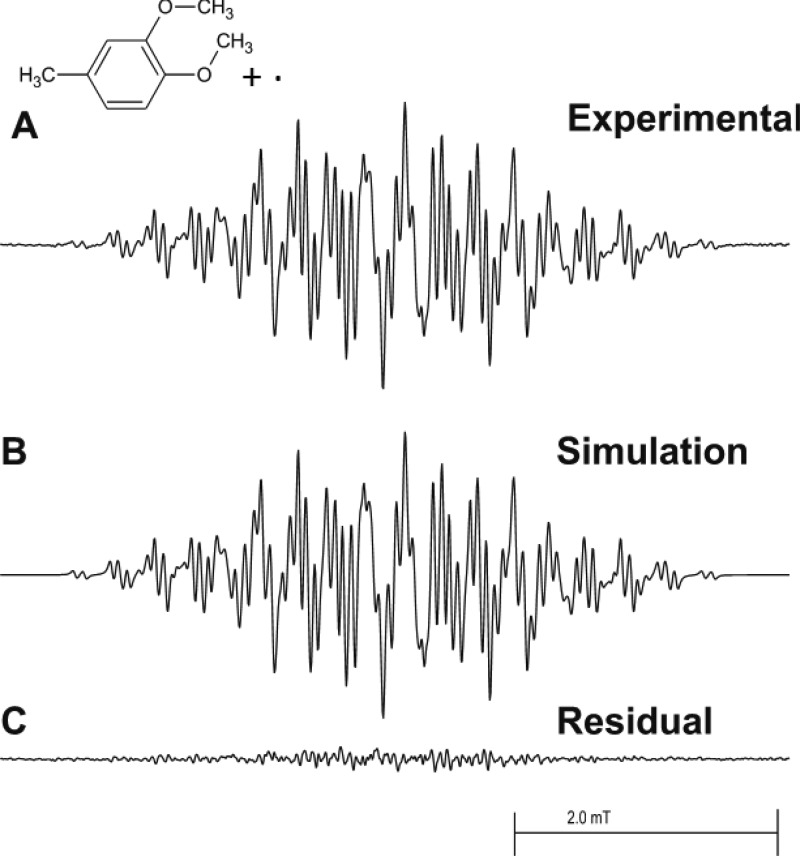
The EPR spectrum of the 3,4-dimethoxytoluene radical cation (Figure 4) was recorded and interpreted to assist the assignment of EPR hyperfine coupling constants in the MEU radical cation with Ce(IV) in 0.23 M sulfuric acid solution serving as the oxidizing agent. Oxidation of 3,4-dimethoxytoluene by HRP and hydrogen peroxide produced only a very weak EPR signal under our fast flow conditions (data not shown).
Figure 4.
EPR fast-flow spectra of the 3,4-dimethoxytoluene radical cation produced in a system of 3,4-dimethoxytoluene, cerium(IV) sulfate, and H2SO4 at concentrations in the flat cell of 1.0 mM, 0.9 mM, and 0.225 M, respectively. Oxygen was removed from the reagent solutions by bubbling 99.9999% pure nitrogen gas through them. Equal volumes of 3,4-dimethoxytoluene and Ce(IV) solutions were mixed milliseconds before entering the flat cell at a total flow rate of 20 mL/min. The final solution also contained 10% v/v ethanol. (A) Complete system with 3,4-dimethoxytoluene and Ce(IV). (B) Simulated EPR spectrum with the coupling constants given in Table 1. (C) Residual plot produced when simulated spectrum B is subtracted from experimental spectrum A. EPR spectra were recorded at 20 mW microwave power, 0.025 mT field modulation, 6.0 mT field sweep width, 1.3 s time constant, 655 ms conversion time, and 36 scans of 1024 data points.
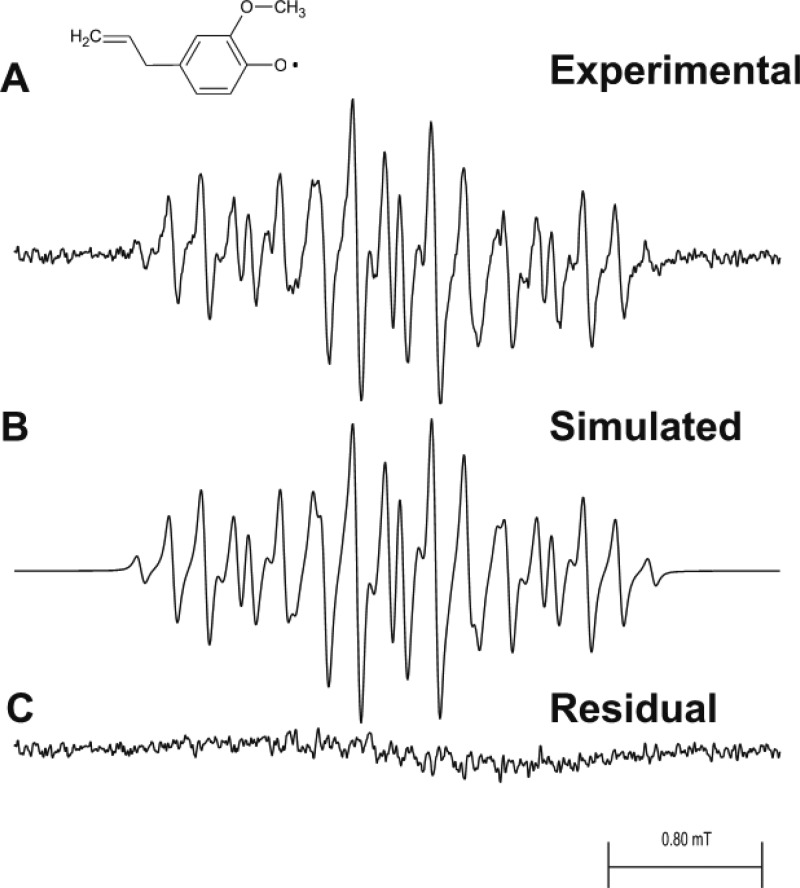
A well-resolved EPR spectrum of eugenol phenoxyl radical, reported in Figure 5, was observed when eugenol was oxidized by reaction with HRP and hydrogen peroxide in a fast flow system. This spectrum was recorded with somewhat better signal-to-noise and resolution than that reported previously.26 Essentially the same spectrum was observed when eugenol was oxidized chemically by Ce(IV) in 0.23 M sulfuric acid solution (data not shown).
Figure 5.
EPR fast-flow spectra of the eugenol phenoxyl radical produced in a system of eugenol, H2O2, and HRP at concentrations in the flat cell of 1.0 mM, 13 mM, and 0.23 μM, respectively. Oxygen was removed from the reagent solutions by bubbling 99.9999% pure nitrogen gas through them. Equal volumes of a solution of eugenol/H2O2 and a solution of HRP in 100 mM, pH 7.4, phosphate buffer were mixed milliseconds before entering the flat cell at a total flow rate of 60 mL/min. The final solution also contained 10% v/v ethanol and 0.10 mM DTPA. (A) Complete system with eugenol, H2O2, and HRP. (B) Simulated EPR spectrum with the coupling constants given in Table 1. (C) Residual plot produced when simulated spectrum B is subtracted from experimental spectrum A. EPR spectra were recorded at 20 mW of microwave power, 0.025 mT of field modulation, 5.0 mT of field sweep width, 164 ms time constant, 82 ms conversion time, and 12 scans of 1024 data points.
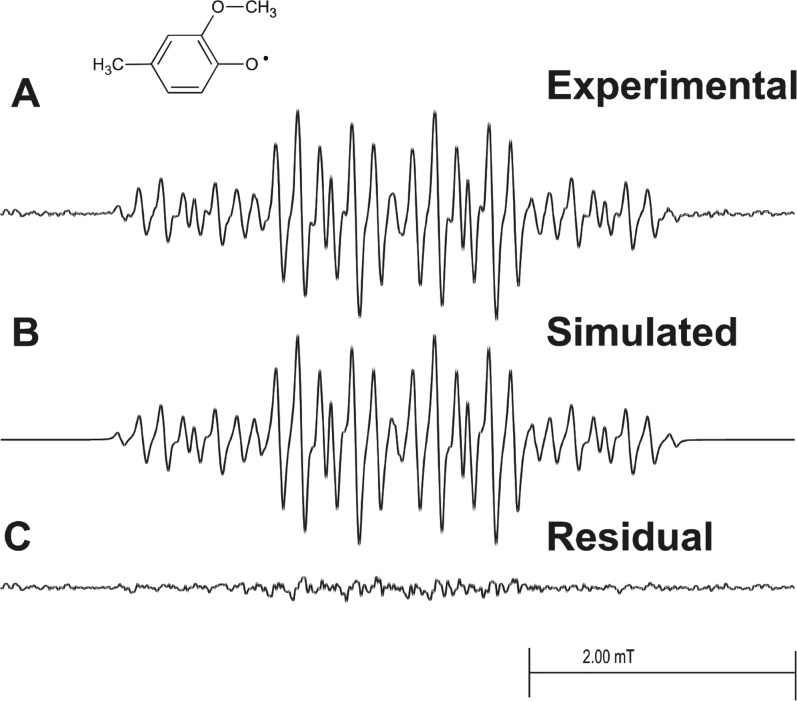
The EPR spectrum of 2-methoxy-4-methylphenol phenoxyl radical (Figure 6) was recorded and interpreted to assist the assignment of EPR hyperfine coupling constants in the eugenol phenoxyl radical. Ce(IV) in 0.23 M sulfuric acid served as the oxidizing agent.
Figure 6.
EPR fast-flow spectra of the 2-methoxy-4-methylphenol radical cation produced in a system of 2-methoxy-4-methylphenol, cerium(IV) sulfate, and H2SO4 at concentrations in the flat cell of 1.0 mM, 0.9 mM, and 0.225 M, respectively. Oxygen was removed from the reagent solutions by bubbling 99.9999% pure nitrogen gas through them. Equal volumes of 2-methoxy-4-methylphenol and Ce(IV) solutions were mixed milliseconds before they entered the flat cell at a total flow rate of 40 mL/min. The final solution also contained 10% v/v ethanol. (A) Complete system with 2-methoxy-4-methylphenol and Ce(IV). (B) Simulated EPR spectrum with the coupling constants given in Table 1. (C) Residual plot produced when simulated spectrum B is subtracted from experimental spectrum A. EPR spectra were recorded at 20 mW of microwave power, 0.050 mT of field modulation, 6.0 mT of field sweep width, 164 ms time constant, 82 ms conversion time, and 33 scans of 1024 points.
Discussion
Kersten et al. were unable to oxidize any of the dimethoxybenzene compounds (or any related compounds with oxidation potentials greater than about 1.36 V) with the HRP-hydrogen peroxide system.30 (All oxidation potentials have been corrected to volts vs the standard hydrogen electrode.) The oxidation potential of 1,2-dimethoxybenzene is reported as 1.69 V,28 while that for allylbenzene is about 2.6 V.39 The structurally similar compound (3,4-dimethoxy)methylcinnamate has an oxidation potential of 1.7 V.42 The oxidation potential of HRP Compounds I and II is about 0.9 V near pH 7.4 depending on the isozyme,43 which suggests that MEU might be oxidized successfully by HRP.
The MEU radical cation has a well resolved EPR spectrum (Figures 1A and 2A) and is accurately simulated (Figure 1B) by the hyperfine coupling constants reported in Table 1. Subtraction of the simulation from the experimental spectrum results in a residual pattern that is essentially noise (Figure 1C). When either MEU (Figure 2B) or HRP (Figure 2C) is omitted from the incubation, no EPR spectrum is recorded. However, even when H2O2 is omitted from the incubation, a strong MEU EPR signal is seen (Figure 2D), and the same spectrum is observed when the incubation lacks H2O2 but contains 32 μM catalase (Figure 2E). These observations are consistent with the presence of an organic hydroperoxide in MEU; this was confirmed by peroxide test strips that provided a semiquantitative estimate of 10–50 mg/L peroxide concentration. Treating MEU with alumina to remove the peroxide reduced the concentration of peroxide but did not eliminate it.
Table 1. EPR Hyperfine Coupling Constants for Methyleugenol Radical Cation and Related Radicals.
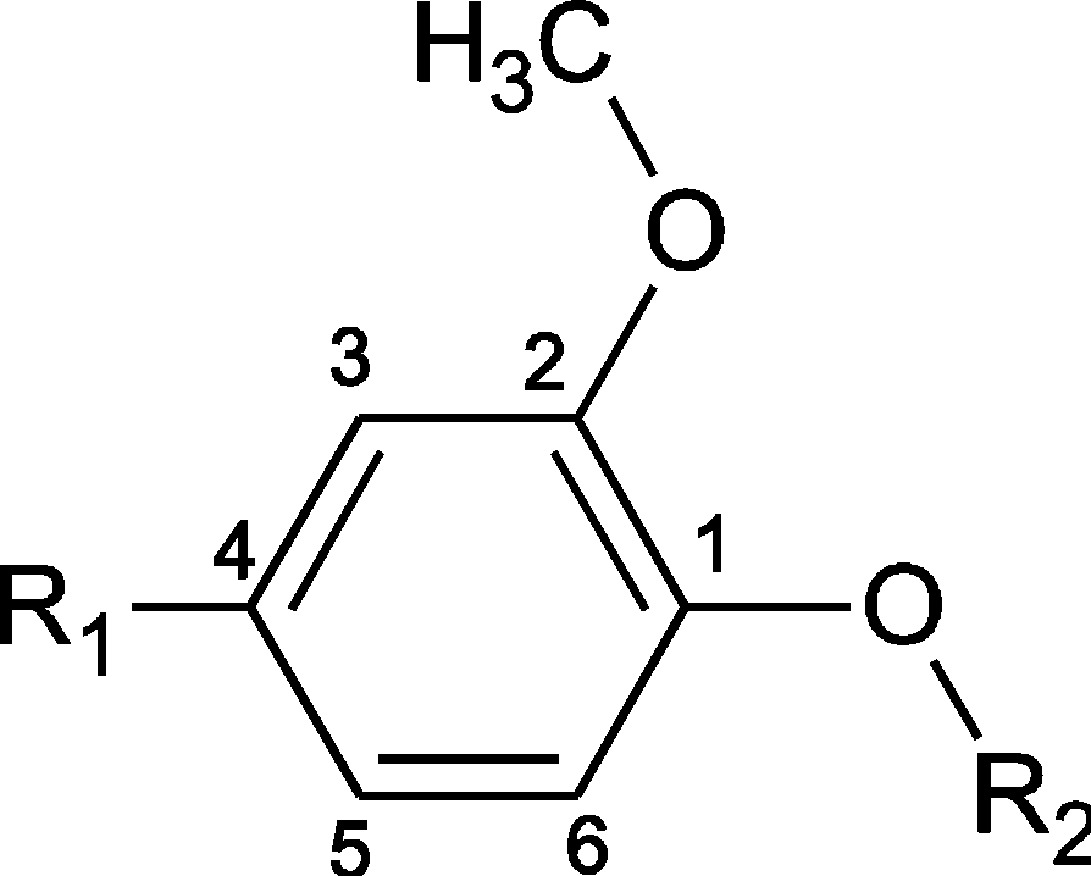
| compd | R1– | R2– | aR2a,b | aOCH3 | a3 | aR1 | a5 | a6 |
|---|---|---|---|---|---|---|---|---|
| methyleugenol | CH2=CH–CH2- | CH3- | 0.167c (3H) | 0.169c (3H) | 0.025 | 0.794 (2H) | 0.416 | ∼0 |
| 3,4-dimethoxy-toluene | CH3- | CH3- | 0.282c (3H) | 0.335c (3H) | 0.073 | 0.808 (3H) | 0.498 | ∼LWd |
| eugenol | CH2=CH–CH2- | H- | ---e [---]f |
0.163 (3H) [0.162] |
0.181 [0.19] |
0.790 (2H) [0.797] |
0.411 [0.415] |
∼LW [---] |
| 2-methoxy-4-methylphenol | CH3- | H- | --- | 0.169 (3H) | 0.153 | 1.032 (3H) | 0.408 | 0.026 |
Coupling constants are in mT (1 mT = 10 gauss).
Numbers in parentheses are numbers of equivalent hydrogen atoms contributing to the stated hyperfine coupling.
Coupling constants assigned arbitrarily and may be interchanged.
Coupling constants were not resolved and are less than the linewidths of EPR lines, ca. < 0.020 mT.
Coupling constants were not observed or not reported.
Coupling constants in square brackets are literature values reported by ref (26).
Data presented in Figure 3A and B are the first clear spectral evidence that the oxidation of MEU proceeds by a cycle typical of peroxidase involving Compounds I and II. HRP Compound II was the predominant form of peroxidase observed in the presence of a high concentration of MEU, and this intermediate was detected even in the absence of exogenously added H2O2. The intensity of the characteristic absorption peaks of HRP Compound II decreases over time as the reaction proceeds, and the resting state of HRP is regenerated (Figure 3C). A similar experiment with catalase added to the incubation demonstrated that the hydroperoxide is not affected by the presence of catalase, a result that is consistent with the EPR observation (Figure 2E). This indicates that the hydroperoxide formed by autoxidation of MEU is not a good substrate for catalase and explains why inclusion of catalase in the EPR incubation of MEU had no effect (Figure 2E). Presumably glutathione peroxidase, which is nonspecific, will reduce this unknown hydroperoxide and thereby inhibit oxidation of MEU.
The MEU radical EPR spectrum hyperfine pattern arises from large hyperfine couplings of the two hydrogens of the methylene group attached at the 4 position and one hydrogen atom attached at the 5 position, as would be predicted from the simple model of benzene molecular orbital ordering that results from two ortho-methoxy electron-releasing substituents.44,45 (See Table 1 for the numbering scheme.) That the methylene hyperfine couplings are large is also evident from the EPR spectrum of the 3,4-dimethoxytoluene radical cation (see Figure 4A). This EPR spectrum is simulated successfully (Figure 4B) with hyperfine parameters quite close to those for MEU (see Table 1), and the residual pattern that results from subtracting the simulated from experimental spectrum is essentially noise (Figure 4C). Successful simulation of the spectra of both radicals also requires the inclusion of hyperfine coupling from two sets of methoxy hydrogen atoms, which indicates that we are seeing the initial free radical species before any demethoxylation reaction can occur.
The EPR spectrum of the EUG phenoxyl radical (Figure 5A) has been reported previously but recorded at somewhat lower resolution and poorer S/N.26 Hyperfine coupling constants for this radical and for the 2-methoxy-4-methylphenol phenoxyl radical (Figure 6A) are reported in Table 1 and are consistent with the related radicals. They are characterized by large hyperfine couplings to two and three hydrogen atoms, respectively, substituted at the number 4 carbon of the aromatic ring. Both spectra are accurately simulated by the assigned hyperfine parameters (Figures 5B and 6B) and have residuals that are essentially noise (Figures 5C and 6C).
Methyleugenol undergoes autoxidation such that the commercial product contains 10–30 mg/L hydroperoxide and is capable of activating peroxidases without the presence of added hydrogen peroxide. Our spectroscopic studies show that the hydroperoxide is not a good substrate for catalase, which suggests that glutathione peroxidase may be important in the inhibition of this pathway in vivo. Thus, we suggest that peroxidase metabolism may contribute to the observed carcinogenicity of MEU in extrahepatic tissues. Whether the peroxidase metabolism may contribute to the observed carcinogenicity of MEU in extrahepatic tissues remains to be investigated.
Acknowledgments
H.J.S. gratefully acknowledges the Committee on Professional Development of Hampden-Sydney College for sabbatical leave support.
Glossary
Abbreviations
- MEU
methyleugenol
- EUG
eugenol
- EPR
electron paramagnetic resonance
- HRP
horseradish peroxidase
- PIFA
phenyl iodine(III) bistrifluoroacetate
- DTPA
diethylenetriaminepentaacetic acid
Author Present Address
† (H.J.S.) Department of Chemistry, Hampden-Sydney College, Hampden-Sydney, VA 23943.
Author Present Address
‡ (O.M.L.) Department of Medicine, School of Medicine, University of North Carolina, Chapel Hill, NC 27599.
This research was supported by the Intramural Research Program of the NIH, National Institute of Environmental Health Sciences.
The authors declare no competing financial interest.
Funding Statement
National Institutes of Health, United States
References
- Coultate T. P. (2002) Food: The Chemistry of Its Components, 4th ed., pp 101, 238, Royal Society of Chemistry, Cambridge, U.K. [Google Scholar]
- Sinki G. S., and Schlegel W. A. F. (1990) Flavoring Agents, in Food Additives (Branen A. L., Davidson P. M., and Salminen S., Eds.) p 201, Marcel Dekker, Inc., New York. [Google Scholar]
- Haahtela T., and Hannuksela M. (1990) Food Additives and Hypersensitivity, in Food Additives (Branen A. L., Davidson P. M., and Salminen S., Eds.) p 631, Marcel Dekker, Inc., New York. [Google Scholar]
- (2000) Final Report on Carcinogens Background Document for Methyleugenol, Meeting of the NTP Board of Scientific Counselors, Report on Carcinogens Subcommittee, U.S. Department of Health and Human Services, Public Health Service, National Toxicology Program, Research Triangle Park, NC.
- Smith R. L.; Adams T. B.; Doull J.; Feron V. J.; Goodman J. I.; Marnett L. J.; Portoghese P. S.; Waddell W. J.; Wagner B. M.; Rogers A. E.; Caldwell J.; Sipes I. G. (2002) Safety assessment of allylalkoxybenzene derivatives used as flavouring substances – methyl eugenol and estragole. Food Chem. Toxicol. 40, 851–870. [DOI] [PubMed] [Google Scholar]
- (2012) Report on Carcinogens, 12th ed., pp 267–268, National Toxicology Program, Public Health Service, U. S. Department of Health and Human Services, http://ntp.niehs.nih.gov/ntp/roc/twelfth/roc12.pdf.
- Cartus A. T.; Herrmann K.; Weishaupt L. W.; Merz K.-H.; Engst W.; Glatt H.; Schrenk D. (2012) Metabolism of methyleugenol in liver microsomes and primary hepatocytes: Pattern of metabolites, cytotoxicity, and DNA-adduct formation. Toxicol. Sci. 129, 21–34. [DOI] [PubMed] [Google Scholar]
- Minet E. F.; Daniela G.; Meredith C.; Massey E. D. (2012) A comparative in vitro kinetic study of [14C]-eugenol and [14C]-methyleugenol activation and detoxification in human, mouse, and rat liver and lung fractions. Xenobiotica 42, 429–441. [DOI] [PubMed] [Google Scholar]
- Luo G.; Guenthner T. M. (1995) Metabolism of allylbenzene 2′,3′-oxide and estragole 2′,3′oxide in the isolated perfused rat liver. J. Pharmacol. Exp. Ther. 272, 588–596. [PubMed] [Google Scholar]
- Herrmann K.; Schumacher F.; Engst W.; Appel K. E.; Klein K.; Zanger U. M.; Glatt H. (2013) Abundance of DNA adducts of methyleugenol, a rodent hepatocarcinogen, in human liver samples. Carcinogenesis 34, 1025–1030. [DOI] [PubMed] [Google Scholar]
- Jeurissien S. M. F.; Bogaards J. J. P.; Boersma M. G.; ter Horst J. P. F.; Awad H. M.; Fiamegos Y. C.; van Beek T. A.; Alink G. M.; Sudholter E. J. R.; Cnubben N. H. P.; Rietjens I. M. C. M. (2006) Human Cytochrome P450 enzymes of importance for the bioactivation of methyleugenol to the proximate carcinogen 1′-hydroxymethyleugenol. Chem. Res. Toxicol. 19, 111–116. [DOI] [PubMed] [Google Scholar]
- European Commission, Scientific Committee on Food (2001) Opinion of the Scientific Committee on Food on Methyleugenol (4-Allyl-1,2-dimethoxybenzene), http://ec.europa.eu/food/fs/sc/scf/out102_en.pdf (accessed Feb 17, 2014).
- Rietjens I. M. C. M.; Boersma M. G.; van der Woulde H.; Jeurissen S. M. F.; Schutte M. E.; Alink G. M. (2005) Flavanoids and alkenylbenzenes: Mechanisms of mutagenic action and carcinogenic risk. Mutat. Res. 574, 124–138. [DOI] [PubMed] [Google Scholar]
- Groh I. A. M.; Cartus A. T.; Vallicotti S.; Kajzar J.; Merz K.-H.; Schrenk D.; Esselen M. (2012) Genotoxic potential of methyleugenol and selected methyleugenol metabolites in cultured Chinese hamster V79 cell. Food Funct. 3, 428–436. [DOI] [PubMed] [Google Scholar]
- Al-Subeihi A. A. A.; Spenkelink B.; Punt A.; Boersma M. G.; van Bladeren P. J.; Rietjens I. M. C. M. (2012) Physiologically based kinetic modeling of bioactivation and detoxification of the alkenylbenzene methyleugenol in human as compared with rat. Toxicol. Appl. Pharmacol. 260, 271–284. [DOI] [PubMed] [Google Scholar]
- Al-Subeihi A. A. A.; Spenkelink B.; Rachmawti N.; Boersma M. G.; Punt A.; Vervoort J.; van Bladeren P. J.; Rietjens I. M. C. M. (2011) Physiologically based biokinetic model of bioactivation and detoxification of the alkenylbenzene methyleugenol in rat. Toxicol. in Vitro 25, 267–285. [DOI] [PubMed] [Google Scholar]
- Graves S. W.; Runyon S. (1995) Determination of methyleugenol in rodent plasma by high-performance liquid chromatography. J. Chromatogr., B 663, 255–262. [DOI] [PubMed] [Google Scholar]
- Barr D. B.; Barr J. R.; Bailey S. L.; Lapeza C. R. Jr.; Beeson M. D.; Caudill S. P.; Maggio V. L.; Schecter A.; Masten S. A.; Lucier G. W.; Needham L. L.; Sampson E. J. (2000) Levels of methyleugenol in a subset of adults in the general U.S. population as determined by high resolution mass spectrometry. Environ. Health Perspect. 108, 323–328. [DOI] [PMC free article] [PubMed] [Google Scholar]
- Schecter A.; Lucier G. W.; Cunningham M. L.; Abdo K. M.; Blumenthal G.; Silver A. G.; Melnick R.; Portier C.; Barr D. B.; Barr J. R.; Stanfill S. B.; Patterson D. G. Jr.; Needham L. L.; Stopford W.; Master S.; Mignogna J.; Tung K. C. (2004) Human consumption of methyleugenol and its elimination from serum. Environ. Health Perspect. 112, 678–680. [DOI] [PMC free article] [PubMed] [Google Scholar]
- Smith R. L.; Adams T. B.; Doull J.; Feron V. J.; Goodman J. I.; Marnett L. J.; Portoghese P. S.; Waddell W. J.; Wagner B. M.; Rogers A. E.; Caldwell J.; Sipes I. G. (2002) Safety assessment of allylalkoxybenzene derivatives used as flavouring substances – methyl eugenol and estragole. Food Chem. Toxicol. 40, 862. [DOI] [PubMed] [Google Scholar]
- Atsumi T.; Fujisawa S.; Satoh K.; Sakagami H.; Iwakura I.; Uehai T.; Sugita Y.; Yokoe I. (2000) Cytotoxicity and radical intensity of eugenol, isoeugenol or related dimers. Anticancer Res. 20, 2519–2524. [PubMed] [Google Scholar]
- Okada N.; Satoh K.; Atsumi T.; Tajima M.; Ishihara M.; Sugita Y.; Yokoe I.; Sakagami H.; Fujisawa S. (2000) Radical modulating activity and cytoxic activity of synthesized eugenol-related compounds. Anticancer Res. 20, 2955–2960. [PubMed] [Google Scholar]
- Satoh K.; Sakagami H.; Yokoe I.; Kochi M.; Fujisawa S. (1998) Interaction between eugenol-related compounds and radicals. Anticancer Res. 18, 425–428. [PubMed] [Google Scholar]
- Fujisawa S.; Atsumi T.; Kadoma Y.; Ishihara M.; Okada N.; Nagasaki M.; Yokoe I.; Sakagami H. (2000) Radical generation, radical-scavenging activity, and cytotoxicity of eugenol-related compounds. In Vitro Mol. Toxicol. 13, 269–279. [PubMed] [Google Scholar]
- Nakagawa K.; Tero-Kubota S.; Ikegami Y.; Tsuchihashi N. (1994) EPR and TREPR spectroscopic studies of antioxidant sesmolyl and related phenoxyl radicals. Photochem. Photobiol. 60, 199–204. [DOI] [PubMed] [Google Scholar]
- Thompson D.; Norbeck K.; Olsson L.-I.; Constantin-Teodosiu D.; Van der Zee J.; Moldeus P. (1989) Peroxidase-catalyzed oxidation of eugenol: Formation of a cytotoxic metabolite(s). J. Biol. Chem. 264, 1016–1021. [PubMed] [Google Scholar]
- Stone T. J.; Waters W. A. (1964) Aryloxy-radicals. Part I. Electron spin resonance spectra of radicals from some substituted monohydric phenols. J. Chem. Soc. 1964, 213–218. [Google Scholar]
- Zweig A.; Hodgson W. G.; Jura W. H. (1964) The oxidation of methoxybenzenes. J. Am. Chem. Soc. 86, 4124–4129. [Google Scholar]
- Sieiro C.; Calle P.; Lorenzo N. (1998) Electron spin resonance study and theoretical calculations of some methoxybenzene radical cations. J. Mol. Struct.: Theochem. 433, 329–338. [Google Scholar]
- Kersten P. J.; Kalyanaraman B.; Hammel K. E.; Reinhammar B.; Kirk T. K. (1990) Comparison of lignin peroxidase, horseradish peroxidase and laccase in the oxidation of methoxybenzenes. Biochem. J. 268, 475–480. [DOI] [PMC free article] [PubMed] [Google Scholar]
- Kersten P. J.; Tien M.; Kalyanaraman B.; Kirk T. K. (1985) The ligninase of Phanerochaete chrysosporium generates cation radicals from methoxybenzenes. J. Biol. Chem. 260, 2609–2612. [PubMed] [Google Scholar]
- Hammel K. E.; Kalyanaraman B.; Kirk T. K. (1986) Substrate free radicals are intermediates in ligninase catalysis. Proc. Natl. Acad. Sci. U.S.A. 83, 3708–3712. [DOI] [PMC free article] [PubMed] [Google Scholar]
- Josephy P. D.; Eling T. E.; Mason R. P. (1983) Oxidation of p-aminophenol catalyzed by horseradish peroxidase and prostaglandin synthase. Mol. Pharmacol. 23, 461–466. [PubMed] [Google Scholar]
- West P. R.; Harman L. S.; Josephy P. D.; Mason R. P. (1984) Acetaminophen: enzymatic formation of a transient phenoxyl free radical. Biochem. Pharmacol. 33, 2933–2936. [DOI] [PubMed] [Google Scholar]
- Duling D. R. (1994) Simulation of multiple isotropic spin-trap EPR spectra. J. Magn. Reson. Ser. B 104, 105–110. [DOI] [PubMed] [Google Scholar]
- Smith M. B., and March J. ( 2001) March’s Advanced Organic Chemistry, 5th ed., p 920, Wiley-Interscience, New York. [Google Scholar]
- Ingold K. U. (1969) Peroxy radicals. Acc. Chem. Res. 2, 1–9. [Google Scholar]
- Mayo F. R. (1968) Free-radical autoxidations of hydrocarbons. Acc. Chem. Res. 1, 193–201. [Google Scholar]
- Elinson M. N.; Makhova I. V.; Nikishin G. I. (1987) Electrochemical oxidation of allylbenzene in methanol. Izv. Akad. Nauk SSSR, Ser. Khim. 7, 1569–1575. [Google Scholar]
- Nelson D. P.; Kiesow L. A. (1972) Enthalpy of decomposition of hydrogen peroxide by catalase at 25 ◦C (with molar extinction coefficients of H2O2 solutions in the UV). Anal. Biochem. 49, 474–478. [DOI] [PubMed] [Google Scholar]
- Schonbaum G. R.; Lo S. (1972) Interaction of peroxidases with aromatic peracids and alkyl peroxides. Product analysis. J. Biol. Chem. 247, 3353–3360. [PubMed] [Google Scholar]
- Pardini V. L.; Sakata S. K.; Vargas R. R.; Viertler H. (2001) Anodic methoxylation of cinnamate esters. J. Braz. Chem. Soc. 12, 223–229. [Google Scholar]
- Hayashi Y.; Yamazaki I. (1979) The oxidation-reduction potentials of Compound I/Compound II and Compound II/Ferric couples of horseradish peroxidase. J. Biol. Chem. 254, 9101–9106. [PubMed] [Google Scholar]
- Bowers K. (1968) Orbital Degeneracy in Benzene and Substituent Effects, in Radical Ions (Kaiser E. T., and Kevan L., Eds.) pp 211–244, Interscience, New York. [Google Scholar]
- Carrington A. (1963) Electron-spin resonance spectra of aromatic radicals and radical-ions. Q. Rev. Chem. Soc. 17, 67–99. [Google Scholar]


