Abstract
Aim:
The aim of the present study was to explore whether renin angiotensin system (RAS) inhibitor can reduce the production of vascular endothelium growth factor (VEGF). Further, we sought to elucidate the correlation between VEGF level and certain clinical parameters, such as albumin excretion rate (AER), before and after treatment with angiotensin type 1 receptor blocker.
Methods:
We recruited 166 type 2 diabetic patients at various stages of diabetic nephropathy (DN) and 46 healthy control subjects for a cross-sectional study. We recruited another 42 hypertensive type 2 diabetic patients with microalbuminuria for a longitudinal study involving a 6-month irbesartan treatment protocol. Urinary VEGF (uVEGF) levels were determined using ELISA.
Results:
In the cross-sectional study, hypertensive type 2 diabetic patients who received RAS inhibitor presented lower uVEGF levels than those who did not receive the RAS inhibitor. Statistical analysis indicated that uVEGF level was independently correlated with the AER. In the longitudinal study involving the 6-month irbesartan treatment, we demonstrated that uVEGF levels decreased significantly in patients who achieved a 50% AER reduction (remission group, n=32). In contrast, uVEGF levels remained unchanged in patients who did not exhibit a 50% AER reduction (nonremission group, n=10). Furthermore, the change in uVEGF was significantly correlated with the change in AER (r=0.65, P<0.01) before and after 6 months of irbesartan treatment. This result held true even after we had adjusted for the decrease in average blood pressure.
Conclusion:
The protective effect of the RAS inhibitor in DN patients is associated with the suppression of VEGF. Accordingly, it may be possible to use uVEGF as a marker of DN progression. We suggest that uVEGF may be an important target for therapeutic intervention in the context of DN.
Keywords: vascular endothelium growth factor, diabetes, irbesartan, albumin excretion rate, renin angiotensin system
Introduction
Diabetic nephropathy (DN) is the leading cause of end-stage renal disease and is clinically characterized by proteinuria and progressive renal insufficiency 1. Glomerular hypertrophy and neovascularization are considered part of the pathophysiological character of DN 2. However, the molecular mechanisms that underlie the pathogenesis of DN remain unclear.
Clinical research has found that urinary vascular endothelium growth factor (uVEGF) level, whereas serum VEGF level is positively correlated with microalbuminuria 3, 4 in type 2 diabetic patients. This suggests that uVEGF might be used as a sensitive marker for DN. Further, pathological analysis confirmed that the degree of glomerular neovascularization was significantly elevated in patients with DN and was correlated with the extent of VEGF messenger RNA expression 5. In diabetic rats, researchers have found that the protein and mRNA levels of VEGF and its high-affinity receptor (flk-1/KDR) were upregulated in the early as well as the late stages of nephropathy 6, 7. VEGF is known to stimulate podocyte production of α3(IV) collagen, a principal ingredient of extracellular matrix in vitro 2. Moreover, the use of a neutralizing anti-VEGF antibody can ameliorate renal pathologic changes 8. Thus, VEGF is a possible therapeutic target for DN.
Recently, it was reported that VEGF overexpression in diabetic rats 9, 10 and in cultured human proximal tubule cells 11 could be attenuated by the administration of renin angiotensin system (RAS) inhibitor. The use of RAS inhibitor led to a decreased incidence of albuminuria in the diabetic rats. However, to date, it remains unclear whether the RAS inhibitor angiotensin type 1 receptor blocker (ARB) has an effect on uVEGF levels in type 2 diabetic patients with nephropathy. Accordingly, in the present study we aimed to explore whether the RAS inhibitor ARB could reduce VEGF production. Furthermore, we sought to elucidate the correlation between VEGF level and certain clinical parameters, such as albumin excretion rate (AER), before and after the ARB treatment. Our results confirm that the RAS inhibitor significantly decreases uVEGF levels concomitant with an improvement in the incidence of albuminuria. We argue that the protective effect of the RAS inhibitor in the context of DN is indeed associated with VEGF suppression.
Materials and methods
Subjects and study protocol
The study was performed consistent with the principles of the Declaration of Helsinki and was approved by our local ethics committee. All subjects gave informed consent prior to participating in the study.
All subjects underwent a complete physical examination and a routine biochemical blood analysis. Demographic and clinical data were recorded, including age, sex, duration of diabetes, weight, height, blood pressure, and medication. Systolic blood pressure (SBP) and diastolic blood pressure (DBP) were measured using a manual sphygmomanometer. The measurements were taken twice in the sitting position after the subjects had rested for 10 min, and the average blood pressure was calculated using the formula (SBP+2DBP)/3. Albumin excretion rate (AER) was determined from two consecutive 24-h urine samples. An estimated glomerular filtration rate (eGFR) was calculated using the Modification of Diet in Renal Disease study equation 12. uVEGF level was expressed as a ratio relative to creatinine (ng/mmol).
Two hundred twelve subjects were recruited for a cross-sectional study. Of these subjects, 46 were healthy controls and 166 had type 2 diabetes mellitus and they presented with various stages of DN.
Patients with DN were recruited according to the established criteria 13. Those patients who had been taking ACE-I or ARB for more than 3 months were assigned to the RAS positive group, whereas those who had never been prescribed ACE-I or ARB were considered part of the RAS negative group. We recruited 59 subjects who presented with normoalbuminuria (NA; AER<20 mg/min), 18 of whom belonged to the RAS positive group. We also enrolled 68 subjects with microalbuminuria (MA; AER, 20–200 mg/min), 25 of whom belonged to the RAS positive group. Finally, we chose an additional 39 patients who presented with clinical proteinuria (CP; AER>200 mg/min), 21 of whom belonged to the RAS positive group. We excluded any patients who had a history of non-diabetic renal disease, urinary tract infection, electrocardiogram abnormalities, symptoms or history of heart disease, and acute or severe chronic liver disease.
Another 42 hypertensive type 2 diabetic patients with microalbuminuria were enrolled for a longitudinal intervention study to explore irbesartan therapy. These patients exhibited essential hypertension (DBP ranging from 80 to 100 mmHg and SBP ranging from 130 to 160 mmHg) and had been prescribed antihypertensive agents other than ACE-I or ARB. After 2 weeks of washout, all of these patients received daily irbesartan doses that ranged from 150 mg/d to a maximum of 300 mg/d over a 6-month period. The targeted blood pressure 3 months after commencement of the irbesartan therapy was <135/85 mmHg. Patients continued to receive their usual diabetes care. We employed the remission definition cited below as well as the criteria used by the Joslin Diabetes Center study that focused on subjects with type 1 diabetes 14. Microalbuminuria remission was defined as a 50% reduction in AER during a 6-month follow-up period. Patients who did not meet this criterion were considered non-remission subjects.
Enzyme-linked immunosorbent assay (ELISA) for uVEGF
Samples were maintained at −70 °C prior to assay. We measured uVEGF levels using a two-antibody sandwich Quantikine VEGF ELISA kit (R & D Systems, Inc). The detection limit of this assay was 31.2 pg/mL, and intra- and inter-assay variations were 6.6% and 7.5%, respectively. Duplicate measurements were obtained for all samples. Serial dilutions of recombinant human VEGF were included in all assays as a standard.
Statistical analysis
Each variable was examined to determine whether it was normally distributed, and significantly skewed variables were transformed using the natural logarithm. Data were expressed as means±standard deviation (SD) for normally distributed variables and as geometric means (95% CI) for skewed variables. Inter-group subject characteristics were compared using analyses of covariance. We used the t-test to compare subjects between two groups. We used the Wilcoxon signed-ranked test to make inter-group comparisons before and after treatment. We used Pearson correlation tests, multivariable linear regression analysis, and partial correlation analysis. Partial correlation analysis was important in testing the association between two variables, independent of covariates. We used the GraphPad Prism software system (GraphPad; San Diego, CA) and the SPSS13.0 statistical package (Statistical Software, Los Angeles, CA). All reported P values were two-tailed, and P values <0.05 were considered statistically significant.
Results
The general characteristics and clinical parameters of the cross-sectional study are summarized in Table 1. Compared with the controls, type 2 diabetic patients had higher levels of BP, HbA1c, FPG, and PPG2H and lower levels of high-density lipoprotein-cholesterol (HDL-c) (Table 1). There were no significant differences with respect to sex, age, blood glucose level and lipid counts in diabetic patients. Compared with the NA group, the CP group exhibited longer duration and BP. eGFR in the CP group was the lowest among the three groups.
Table 1. General characteristics and clinical parameters of healthy control subjects and type 2 diabetic patients in our cross-sectional study. Data were expressed as Mean±SD or as geometric means (95% CI). bP<0.05, cP<0.01 vs control; eP<0.05, fP<0.01 vs normoalbuminuria; iP<0.01 vs microalbuminuria.
| Control subjects | Normoalbuminuria | Type 2 diabetes Microalbuminuria | Clinical proteinuria | |
|---|---|---|---|---|
| Gender (M/F) | 46 (21/25) | 59 (36/23) | 68 (38/30) | 39 (22/17) |
| Age (years) | 57.41±7.95 | 57.03±10.15 | 58.16±9.75 | 59.13±9.26 |
| Duration of diabetes (years) | – | 6.97±6.68 | 7.37±7.28 | 10.03±5.57e |
| SBP (mmHg) | 120±13 | 129±18b | 134±17c | 149±19cf |
| DBP (mmHg) | 79±10 | 79±8 | 82±10f | 87±11ci |
| BMI (kg/m2) | 23.41±2.61 | 24.71±2.83 | 25.10±3.55 | 24.68±4.43 |
| HbA1c (%) | 5.27±0.25 | 8.34±2.19c | 8.23±1.90c | 8.47±2.31c |
| FPG (mmol/L) | 5.03±0.38 | 8.35±2.85c | 8.05±2.12c | 8.66±3.27c |
| PPG2H (mmol/L) | 5.67±1.05 | 13.14±4.00c | 13.5±4.64c | 12.87±5.38c |
| TC (mmol/L) | 4.83±0.81 | 4.92±1.09 | 5.09±1.10 | 4.92±1.59 |
| LDL-c (mmol/L) | 2.76±0.78 | 3.03±0.76 | 3.21±0.99 | 2.83±1.12 |
| TG (mmol/L) | 1.54±1.40 | 1.82±1.20 | 2.58±2.55 | 2.27±2.81 |
| HDL-c (mmol/L) | 1.56±0.38 | 1.23±0.35c | 1.27±0.42c | 1.13±0.28c |
| AER (μg/min) | 5.05 (3.48–8.14) | 7.12 (4.26–10.20) | 47.35 (39.24–57.14)cf | 721.6 (518.1–1005)cfi |
| eGFR (mL·min−1/1.73 m2) | 98.15±18.48 | 102.70±21.44 | 97.27±28.89 | 62.87±30.66cfi |
| Hypertension | 0 | 32 (54.24%) | 46 (67.65%) | 39 (100%) |
| ACEI/ARB treatment in hypertensive patients | 0 | 18 (56.25%) | 25 (55%) | 21 (54%) |
| DR (non/simplex/proliferative) | – | 41/18/0 | 37/31/0 | 0/23/16 |
Data were analyzed using one-way ANOVA. Pearson correlation analyses were used to determine the association between urinary VEGF and other parameters. BMI: body-mass index; SBP: systolic blood pressure; DBP: diastolic blood pressure; FPG: fasting plasma glucose; PPG2H: 2-h postprandial plasma glucose; TC: total cholesterol; LDL-c: low-density lipoprotein-cholesterol; TG: triglyceride; HDL-c: high-density lipoprotein-cholesterol; eGFR: estimated glomerular filtrate rate; AER: albumin excretion rate.
uVEGF levels were significantly increased in DN patients and independently correlated with AER
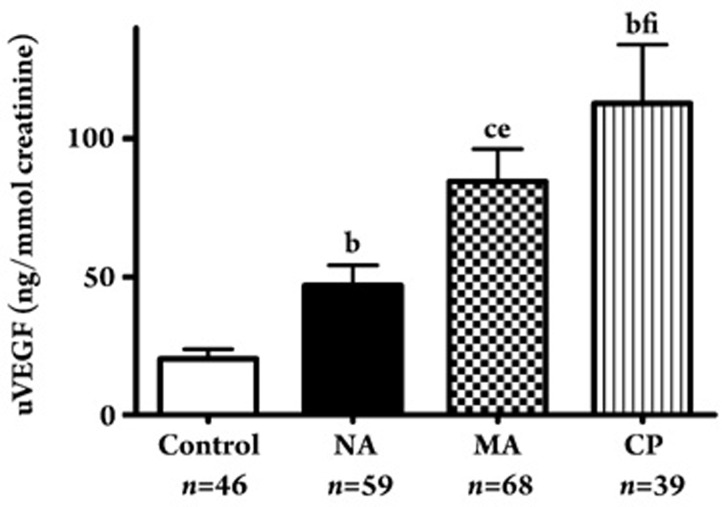
uVEGF levels were significantly higher in the diabetic groups than in the control group, even at the normoalbuminuric stage (NA group; 62.8±55.4 ng/mmol vs control; 28.0±23.3 ng/mmol creatinine, P<0.05). uVEGF levels were higher in the MA group (104.9±95.5 ng/mmol creatinine) (P<0.05, respectively) and the CP group (159.5±132 ng/mmol creatinine) (P<0.01, respectively) than in the NA group. The uVEGF level was even higher in the CP group than in the MA group (P<0.01) (Figure 1). uVEGF levels were higher in patients with more advanced diabetic nephropathy.
Figure 1.
uVEGF levels in type 2 diabetic patients with normoalbuminuria (NA), microalbuminuria (MA), and clinical proteinuria (CP). bP<0.05, cP<0.01 vs control; eP< 0.05, fP<0.01 vs normoalbuminuria; iP<0.01 vs microalbuminuria.
Pearson correlation tests suggested that the uVEGF level was significantly correlated with the duration of diabetes (R=0.249, P<0.01), SBP (R=0.232, P<0.01), HbA1c (R=0.215, P<0.01), HDL-c (R=−0.167, P<0.05), AER (R=0.452, P<0.01), and eGFR (R=−0.316, P<0.01). Furthermore, multiple stepwise regression analysis was performed to elucidate any independent relationships between the uVEGF level and the clinical parameters. The results revealed that uVEGF was independently correlated with AER (R=0.25, P<0.01), with the disease duration (R=0.17, P<0.05), and with eGFR (R=−0.18, P<0.05).
Effect of RAS intervention on uVEGF levels in the cross-sectional study
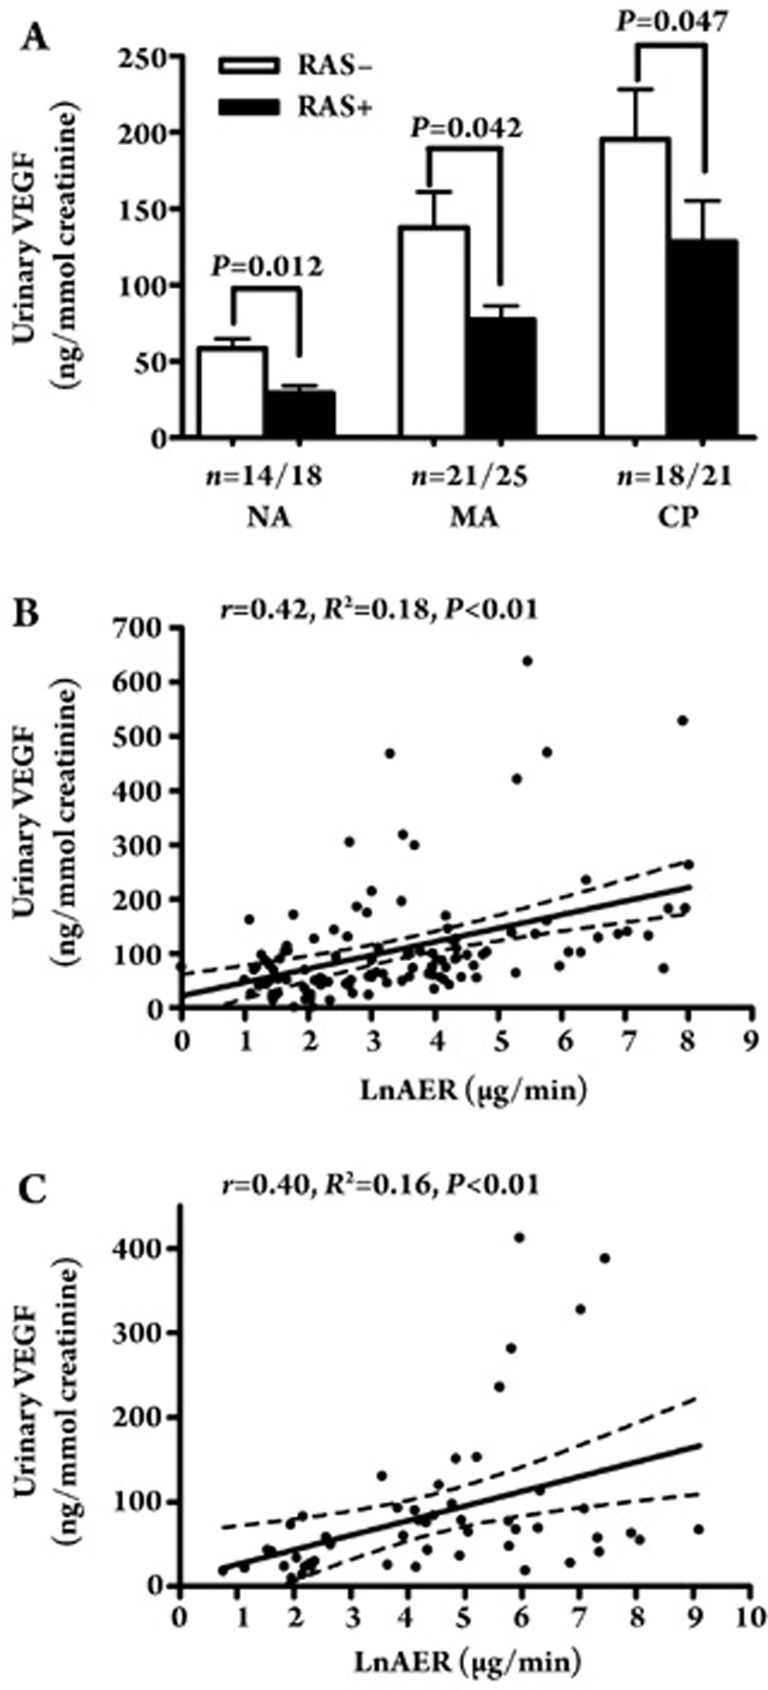
As shown in Figure 2A, the cross-sectional study revealed significant differences in uVEGF levels between the hypertensive diabetes subjects who underwent treatment with the RAS inhibitor and those who did not receive the RAS inhibitor. These differences were observed in the NA group (29.3±16.9 ng/mmol creatinine vs 66.2±46.0 ng/mmol creatinine, P<0.05), MA group (77.2±36.3 ng/mmol creatinine vs 137.7±127.8 ng/mmol creatinine, P<0.05), and CP group (131.5±125.1 ng/mmol creatinine vs 195.6±138.7 ng/mmol creatinine, P<0.05). These results suggest that patients who received the RAS inhibitor presented lower uVEGF levels. Further correlation analysis revealed that the uVEGF levels were significantly correlated with AER, not only in the RAS positive group (r=0.42, P<0.01, n=64, Figure 2B) but also in the RAS negative group (r=0.40, P<0.01, n=53, Figure 2C).
Figure 2.
(A) Comparison of uVEGF levels in hypertensive type 2 diabetic patients between RAS positive and negative group in the NA, MA, and CP groups. (B) A correlation between uVEGF level and LnAER in RAS positive group (r=0.42, P<0.01). (C) A correlation between uVEGF level and LnAER in RAS negative group (r=0.40, P<0.01).
The other general characteristics and clinical parameters of hypertensive diabetes subjects who did and did not receive the RAS inhibitor are summarized in Table 2. No significant within-group differences were recorded.
Table 2. Characteristics and clinical parameters of hypertensive patients who did and did not receive RAS inhibitor in the NA, MA, and CP groups.
| Normoalbuminuria | Microalbuminuria | Clinical proteinuria | |||||||
|---|---|---|---|---|---|---|---|---|---|
| RAS(−) | RAS(+) | P | RAS(−) | RAS(+) | P | RAS(−) | RAS(+) | P | |
| n | 14 | 18 | 21 | 25 | 18 | 21 | |||
| uVEGF (ng/mmol creatinine) | 66.2±46.0 | 29.3±16.9 | 0.012 | 137.7±127.8 | 77.2±36.3 | 0.042 | 195.6±138.7 | 131.5±125.1 | 0.047 |
| Age (years) | 58.0±14.8 | 63.8±8.5 | 0.268 | 61.7±9.7 | 60.3±7.3 | 0.613 | 60.6±10.2 | 59.8±8.7 | 0.794 |
| Diabetes duration (years) | 8.0±6.1 | 9.3±4.4 | 0.574 | 7.4±8.2 | 7.7±6.0 | 0.874 | 10.4±5.9 | 9.7±5.4 | 0.670 |
| Average BP (mmHg) | 99.4±6.2 | 110.0±13.3 | 0.371 | 103.2±13.7 | 104.1±8.4 | 0.829 | 109.3±12.7 | 106.2±13.2 | 0.466 |
| BMI (kg/m2) | 24.8±2.4 | 25.1±2.9 | 0.779 | 25.4±4.0 | 26.1±4.1 | 0.566 | 23.9±4.7 | 25.3±4.2 | 0.344 |
| WC (cm) | 85.5±7.0 | 89.5±9.5 | 0.282 | 88.8±9.8 | 89.8±10.0 | 0.756 | 86.5±10.2 | 90.9±12.1 | 0.280 |
| HbA1c | 8.34±2.73 | 7.36±1.42 | 0.401 | 8.05±1.87 | 7.31±1.38 | 0.17 | 8.47±1.88 | 8.46±2.67 | 0.98 |
| TG (mmol/L) | 1.45±0.55 | 1.93±1.39 | 0.253 | 1.99±1.74 | 1.75±0.59 | 0.60 | 1.95±1.29 | 2.45±1.24 | 0.53 |
| HDL-c (mmol/L) | 1.25±0.38 | 1.35±0.48 | 0.601 | 1.33±0.43 | 1.22±0.29 | 0.37 | 1.18±0.32 | 1.08±0.24 | 0.25 |
| TC (mmol/L) | 4.85±0.86 | 5.23±1.16 | 0.399 | 5.25±1.09 | 5.18±1.01 | 0.84 | 4.66±1.54 | 5.16±1.64 | 0.34 |
| LDL-c (mmol/L) | 3.25±0.95 | 3.13±0.69 | 0.778 | 3.36±0.99 | 3.24±0.87 | 0.11 | 2.75±1.18 | 2.91±1.09 | 0.66 |
| hs-CRP (mg/L) | 2.14±2.07 | 1.52±1.17 | 0.486 | 2.05±1.55 | 2.54±2.27 | 0.40 | 2.35±1.66 | 2.45±1.77 | 0.85 |
| AER (μg/min) | 9.88±5.40 | 7.79±3.24 | 0.35 | 65.14±50.49 | 65.98±43.96 | 0.99 | 1151±1003 | 1301±1983 | 0.77 |
| GFR (ml·min−1/1.73 m2) | 100±32 | 93±11 | 0.57 | 90±28 | 96±28 | 0.52 | 67±36 | 59±26 | 0.44 |
| DR | 2 (30%) | 3 (30%) | 0.87 | 12 (70%) | 8 (50%) | 0.57 | 7 (40%) | 9 (40%) | 0.93 |
Comparison of uVEGF levels before and after irbesartan treatment
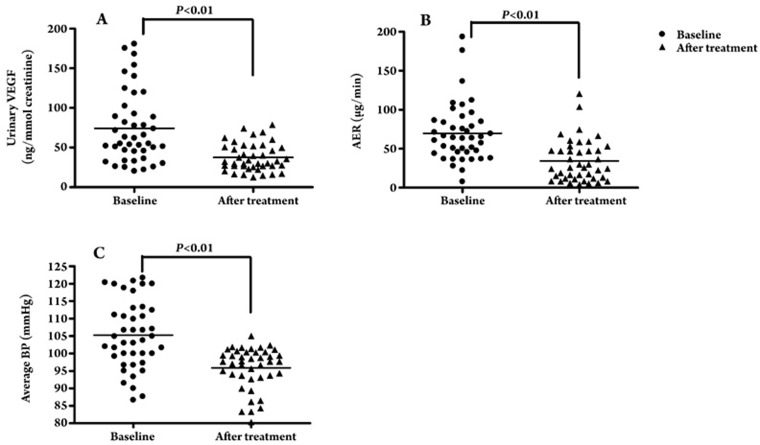
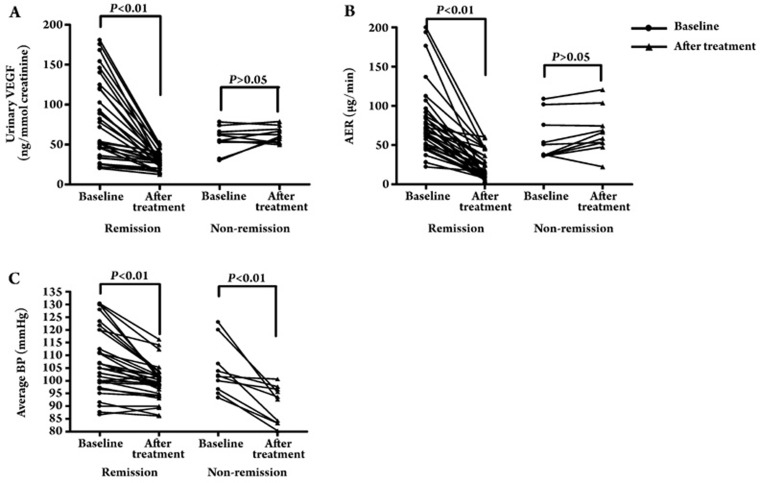
In order to further clarify the effect of RAS intervention on uVEGF levels in DN sufferers, we performed a longitudinal study that focused on ARB irbesartan treatment. After 6 months of treatment with irbesartan, uVEGF levels decreased significantly from a baseline level of 74.5±44.8 ng/mmol creatinine to 37.6±17.4 ng/mmol creatinine (P<0.01) (Figure 3A), and the AER was concomitantly reduced from 69.8±37.4 μg/min to 34.3±26.9 μg/min (P<0.01) (Figure 3B). The average blood pressure decreased significantly from 103.9±9.7 mmHg to 95.9±6.0 mmHg (P<0.01) (Figure 3C). Further subgroup analysis revealed that uVEGF levels decreased significantly from a baseline level of 79.7±49.5 ng/mmol creatinine to 29.9±10.2 ng/mmol creatinine following the irbesartan treatment (P<0.01), and the AER was concomitantly reduced from 80.9±47.2 μg/min to 24.1±16.8 μg/min (P<0.01) (n=32) in the remission group, whereas the uVEGF level and AER remained unchanged in the non-remission group (uVEGF level: 56.8±15.8 ng/mmol creatinine vs 62.3±9.8 ng/mmol creatinine, P>0.05; AER: 57.4±28.2 μg/min vs 66.9±28.3 μg/min, P>0.05) (n=10) (Figure 4A, 4B). In addition, in the remission group and in the non-remission group the average blood pressure significantly decreased from 103.46±4.33 mmHg to 96.15±8.03 mmHg (P<0.01) and from 98.00±3.82 mmHg to 85.33±4.47 mmHg respectively (P<0.01) (Figure 4C). Although the baseline blood pressure data for patients who reached remission after 6 months of irbesartan therapy was remarkably different from that of patients without remission (103.46±4.33 mmHg vs 98.00±3.82 mmHg, P<0.05), no significant difference was found between the two groups with respect to changes in average blood pressure (11.37±7.9 mmHg vs 12.38±8.1 mmHg, P>0.05) and the dosage of irbesartan (215.6±75.6 mg vs 225.0±79.1 mg, P>0.05).
Figure 3.
(A) uVEGF levels before and after irbesartan intervention therapy. (B) AER before and after irbesartan intervention therapy. (C) Average BP before and after irbesartan intervention therapy.
Figure 4.
(A) uVEGF levels before and after irbesartan intervention therapy in the remission (n=32) and non-remission (n=10) groups. (B) AER before and after irbesartan intervention therapy in the remission (n=32) and non-remission (n=10) groups. (C) Average BP before and after irbesartan intervention therapy in the remission (n=32) and non-remission (n=10) groups.
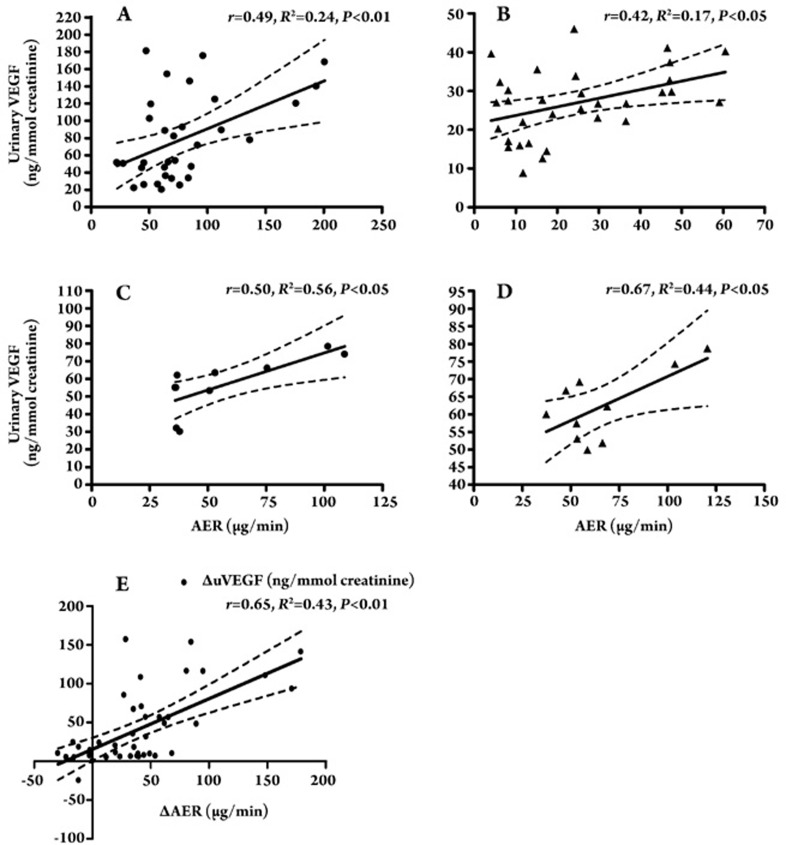
There were significant positive correlations between uVEGF and AER before and after treatment in the remission group (r=0.49, P<0.01 and r=0.42, P<0.05, respectively, Figure 5A, 5B). uVEGF was significantly correlated with AER before and after treatment in the non-remission group (r=0.50, P<0.05 and r=0.67, P<0.05, respectively, Figure 5C, 5D). Furthermore, we also identified a correlation between the changes in uVEGF levels and the changes in AER (r=0.65, P<0.01) (Figure 5E), and this correlation persisted even after we adjusted for changes in average blood pressure, as determined by partial correlation analyses (r=0.63, P<0.01).
Figure 5.
(A) A correlation between uVEGF level and AER in remission group before irbesartan treatment (r=0.49, P<0.01). (B) A correlation between uVEGF level and AER in remission group after 6 months' irbesartan treatment (r=0.42, P<0.05). (C) A correlation between uVEGF level and AER in non-remission group before irbesartan treatment (r=0.50, P<0.05). (D) A correlation between uVEGF level and AER in non-remission group after 6 months' irbesartan treatment (r=0.67, P<0.05). (E) A correlation between the change of the uVEGF level (ΔVEGF) and AER (ΔAER) in DN patients with irbesartan intervention (r=0.65, P<0.01).
There were no significant changes in the general characteristics and clinical parameters of the patients (Table 3).
Table 3. Characteristics and clinical parameters of the remission and nonremission groups before and after irbesartan intervention therapy.
| Non-remission | Remission | |||||
|---|---|---|---|---|---|---|
| Before ARB | After ARB | P | Before ARB | After ARB | P | |
| Sex (M/F) | 12 (7/5) | 30 (17/13) | ||||
| Duration (years) | 3.2±4.2 | 5.0±3.5 | ||||
| Age (years) | 54.8±8.5 | 58.5±7.0 | ||||
| BMI (kg/m2) | 23.9±2.7 | 24.7±2.4 | 0.103 | 26.6±2.1 | 26.9±2.4 | 0.461 |
| WC (cm) | 78±7.8 | 80±2.4 | 0.394 | 94±6.1 | 93±6.3 | 0.356 |
| Average BP (mmHg) | 98.00±3.82 | 85.33±4.47 | 0.000 | 103.46±4.33 | 96.15±8.03 | 0.000 |
| HbA1c | 7.38±2.35 | 6.22±0.77 | 0.276 | 7.14±0.66 | 7.00±0.70 | 0.512 |
| TG (mmol/L) | 1.90±0.85 | 1.89±0.95 | 0.919 | 1.99±1.09 | 2.98±1.35 | 0.326 |
| HDL-c (mmol/L) | 1.30±0.44 | 1.34±0.52 | 0.464 | 1.22±0.29 | 1.19±0.29 | 0.605 |
| TC (mmol/L) | 4.96±5.18 | 5.18±1.42 | 0.276 | 5.13±0.86 | 5.15±0.86 | 0.950 |
| LDL-c (mmol/L) | 3.03±1.37 | 3.14±1.46 | 0.546 | 3.44±0.70 | 3.19±0.79 | 0.414 |
| hs-CRP (mg/L) | 0.81±0.57 | 0.47±0.49 | 0.368 | 1.35±0.92 | 1.27±1.13 | 0.488 |
| AER (μg/min) | 57.4±28.1 | 66.9±28.7 | 0.896 | 80.9±47.2 | 24.1±16.8 | 0.000 |
| GFR (mL·min−1/1.73 m2) | 102±26 | 103±20 | 0.829 | 86±23 | 91±18 | 0.196 |
| uVEGF (ng/mmol creatinine) | 56.8±15.8 | 62.3±9.8 | 0.818 | 79.7±49.5 | 29.9±10.2 | 0.000 |
| Irbesartan dose (mg/d) | 215.6±75.6 | 225.6±79.1 | 0.737 | |||
Discussion
This is the first study to examine the effects of the RAS inhibitor on uVEGF levels in diabetic patients. In this cross-sectional study, uVEGF concentrations were significantly lower in hypertensive diabetic patients treated with RAS inhibitor than in patients who did not receive the RAS inhibitor. Intervention with irbesartan resulted in a significantly lower uVEGF level. Correlation analysis revealed that uVEGF was significantly correlated with AER before and after treatment in both remission and non-remission groups. The reduction in uVEGF levels was correlated with a reduced severity of proteinuria. This correlation persisted even after we had adjusted for the observed changes in average blood pressure.
Our results are consistent with findings from an animal model of diabetic nephropathy. In rats with streptozotocin-induced diabetes, treatment with RAS inhibitor decreased renal VEGF mRNA and simultaneously reduced albuminuria 9, 10. However, in this study, the mechanism of uVEGF decrease was unclear. We found that AT-II could stimulate the synthesis of vascular endothelial growth factor through the p38 mitogen-activated protein kinase pathway in cultured podocytes and via the hypoxia-inducible factor-1alpha induction mechanism in kidney endothelial cells 15. Inhibition of AT-II by ARB can decrease VEGF over-expression in the podocytes of diabetic rats 10. Thus, the mechanism by which AT-II type 1α receptor blocker (ARB) operates in the context of irbesartan-decreased uVEGF might be related to the inhibition of AT-II nonhemodynamic effects.
VEGF, an AT-II downstream molecule, exerts multiple effects in the context of DN pathophysiological processes. In diabetic patients with nephropathy, the degree of neovascularization was significantly increased in DN and correlated with the degree of VEGF mRNA expression and the mesangial matrix 5. In an experimental diabetic rat model, the increased expression of VEGF in glomeruli directly led to glomerular hypertrophy 16 and simultaneously increased the production of alpha3(IV) collagen, an integral component of the glomerular basement membrane (GBM) 17. Therefore, scientists have postulated that blockade of the RAS might downregulate VEGF expression. In turn, this could result in the inhibition of glomerular hypertrophy, the normalization of mesangial matrix generation, and a reduction in vascular hyperpermeability 18. These phenomena may serve to stabilize or improve net renal function.
In our cross-sectional study, uVEGF levels were significantly higher in DN patients and these data were independently correlated with AER measurements. In the RAS positive and RAS negative groups, uVEGF was significantly correlated with AER. In DN patients treated with irbesartan, we observed a similar correlation between the decrease of uVEGF and AER in the remission group. Even in DN patients from the non-remission group, uVEGF levels did not decrease significantly but were correlated with AER. To summarize, we found that changes in uVEGF levels (increase, no change, decrease) were always correlated with changes in AER. We conclude that uVEGF levels might be used as an effective marker of DN and as an indicator of the prognostic and therapeutic effects of ARB treatment.
In summary, ARB can significantly decrease uVEGF levels in a manner concomitant with improvements in AER. This suggests that the protective effect of the RAS inhibitor on DN patients is associated with VEGF suppression. In addition, uVEGF may be useful as a marker of DN progression and could represent an important target for therapeutic intervention in DN cases.
Author contributions
Wei-ping JIA, Yu-qian BAO, Hai-bing CHEN, and Kun-san XIANG designed the research; Hai-bing CHEN and Qing LI performed the research; Jun-xi LU, Hui-juan LU, and Jun-ling TANG contributed new analytical tools and reagents; Hai-bing CHEN analyzed the data; Hai-bing CHEN wrote the paper.
References
- Ritz E, Orth SR. Nephropathy in patients with type 2 diabetes mellitus. N Engl J Med. 1999;341:1127–33. doi: 10.1056/NEJM199910073411506. [DOI] [PubMed] [Google Scholar]
- Ziyadeh FN. The extracellular matrix in diabetic nephropathy. Am J Kidney Dis. 1993;22:736–44. doi: 10.1016/s0272-6386(12)80440-9. [DOI] [PubMed] [Google Scholar]
- Kim NH, Kim KB, Kim DL, Kim SG, Choi KM, Baik SH, et al. Plasma and urinary vascular endothelial growth factor and diabetic nephropathy in type 2 diabetes mellitus. Diabet Med. 2004;21:545–51. doi: 10.1111/j.1464-5491.2004.01200.x. [DOI] [PubMed] [Google Scholar]
- Lenz T, Haak T, Malek J, Grone HJ, Geiger H, Gossmann J. Vascular endothelial growth factor in diabetic nephropathy. Kidney Blood Press Res. 2003;26:338–43. doi: 10.1159/000073940. [DOI] [PubMed] [Google Scholar]
- Kanesaki Y, Suzuki D, Uehara G, Toyoda M, Katoh T, Sakai H, et al. Vascular endothelial growth factor gene expression is correlated with glomerular neovascularization in human diabetic nephropathy. Am J Kidney Dis. 2005;45:288–94. doi: 10.1053/j.ajkd.2004.09.020. [DOI] [PubMed] [Google Scholar]
- Vieitez P, Gomez O, Uceda ER, Vera ME, Molina-Holgado E. Systemic and local effects of angiotensin II blockade in experimental diabetic nephropathy. J Renin Angiotensin Aldosterone Syst. 2008;9:96–102. doi: 10.3317/jraas.2008.018. [DOI] [PubMed] [Google Scholar]
- Kakizawa H, Itoh Y, Imamura S, Matsumoto T, Ishiwata Y, Ono Y, et al. Possible role of VEGF in the progression of kidney disease in streptozotocin (STZ)-induced diabetic rats: effects of an ACE inhibitor and an angiotensin II receptor antagonist. Horm Metab Res. 2004;36:458–64. doi: 10.1055/s-2004-825725. [DOI] [PubMed] [Google Scholar]
- Flyvbjerg A, Dagnaes-Hansen F, De Vriese AS, Schrijvers BF, Tilton RG, Rasch R. Amelioration of long-term renal changes in obese type 2 diabetic mice by a neutralizing vascular endothelial growth factor antibody. Diabetes. 2002;51:3090–4. doi: 10.2337/diabetes.51.10.3090. [DOI] [PubMed] [Google Scholar]
- Kelly DJ, Buck D, Cox A, Zhang Y, Gilbert RE. Effects on protein kinase C-beta inhibition on glomerular vascular endothelial growth factor expression and endothelial cells in advanced experimental diabetic nephropathy. Am J Physiol Renal Physiol. 2007;293:F565–74. doi: 10.1152/ajprenal.00397.2006. [DOI] [PubMed] [Google Scholar]
- Lee EY, Shim MS, Kim MJ, Hong SY, Shin YG, Chung CH. Angiotensin II receptor blocker attenuates overexpression of vascular endothelial growth factor in diabetic podocytes. Exp Mol Med. 2004;36:65–70. doi: 10.1038/emm.2004.9. [DOI] [PubMed] [Google Scholar]
- Kim NH, Oh JH, Seo JA, Lee KW, Kim SG, Choi KM, et al. Vascular endothelial growth factor (VEGF) and soluble VEGF receptor FLT-1 in diabetic nephropathy. Kidney Int. 2005;67:167–77. doi: 10.1111/j.1523-1755.2005.00067.x. [DOI] [PubMed] [Google Scholar]
- Levey AS, Bosch JP, Lewis JB, Greene T, Rogers N, Roth D. A more accurate method to estimate glomerular filtration rate from serum creatinine: a new prediction equation. Modification of Diet in Renal Disease Study Group. Ann Intern Med. 1999;130:461–70. doi: 10.7326/0003-4819-130-6-199903160-00002. [DOI] [PubMed] [Google Scholar]
- Mogensen CE, Chachati A, Christensen CK, Close CF, Deckert T, Hommel E, et al. Microalbuminuria: an early marker of renal involvement in diabetes. Uremia Invest. 1985;9:85–95. doi: 10.3109/08860228509088195. [DOI] [PubMed] [Google Scholar]
- Perkins BA, Ficociello LH, Silva KH, Finkelstein DM, Warram JH, Krolewski AS. Regression of microalbuminuria in type 1 diabetes. N Engl J Med. 2003;348:2285–93. doi: 10.1056/NEJMoa021835. [DOI] [PubMed] [Google Scholar]
- Sanchez-Lopez E, Lopez AF, Esteban V, Yague S, Egido J, Ruiz-Ortega M, et al. Angiotensin II regulates vascular endothelial growth factor via hypoxia-inducible factor-1alpha induction and redox mechanisms in the kidney. Antioxid Redox Signal. 2005;7:1275–84. doi: 10.1089/ars.2005.7.1275. [DOI] [PubMed] [Google Scholar]
- Liu E, Morimoto M, Kitajima S, Koike T, Yu Y, Shiiki H, et al. Increased expression of vascular endothelial growth factor in kidney leads to progressive impairment of glomerular functions. J Am Soc Nephrol. 2007;18:2094–104. doi: 10.1681/ASN.2006010075. [DOI] [PubMed] [Google Scholar]
- Chen S, Kasama Y, Lee JS, Jim B, Marin M, Ziyadeh FN. Podocyte-derived vascular endothelial growth factor mediates the stimulation of alpha3(IV) collagen production by transforming growth factor-beta1 in mouse podocytes. Diabetes. 2004;53:2939–49. doi: 10.2337/diabetes.53.11.2939. [DOI] [PubMed] [Google Scholar]
- Sano H, Hosokawa K, Kidoya H, Takakura N. Negative regulation of VEGF-induced vascular leakage by blockade of angiotensin II type 1 receptor. Arterioscler Thromb Vasc Biol. 2006;26:2673–80. doi: 10.1161/01.ATV.0000245821.77155.c3. [DOI] [PubMed] [Google Scholar]


