Abstract
Purpose
To improve slice coverage of gradient echo spin echo (GESE) sequences for dynamic susceptibility contrast (DSC) MRI using a simultaneous-multiple-slice (SMS) method.
Methods
Data were acquired on 3 Tesla (T) MR scanners with a 32-channel head coil. To evaluate use of SMS for DSC, an SMS GESE sequence with two-fold slice coverage and same temporal sampling was compared with a standard GESE sequence, both with 2× in-plane acceleration. A signal to noise ratio (SNR) comparison was performed on one healthy subject. Additionally, data with Gadolinium injection were collected on three patients with glioblastoma using both sequences, and perfusion analysis was performed on healthy tissues as well as on tumor.
Results
Retained SNR of SMS DSC is 90% for a gradient echo (GE) and 99% for a spin echo (SE) acquisition, compared with a standard acquisition without slice acceleration. Comparing cerebral blood volume maps, it was observed that the results of standard and SMS acquisitions are comparable for both GE and SE images.
Conclusion
Two-fold slice accelerated DSC MRI achieves similar SNR and perfusion metrics as a standard acquisition, while allowing a significant increase in slice coverage of the brain. The results also point to a possibility to improve temporal sampling rate, while retaining the same slice coverage.
Keywords: DSC, GESE, CAIPIRINHA, blipped CAIPI, SMS, brain tumor
INTRODUCTION
Dynamic susceptibility contrast (DSC) MRI using Gadolinium (Gd) contrast agents (CA) has proven to be a reliable method for quantifying blood perfusion of tissue (1). In this technique, a fast bolus injection of a Gd-based contrast agent creates a large difference between the magnetic susceptibilities of the blood vessels and extravascular space which results in a shortening of the transversal relaxation constants R2(t) and R2*(t), and a decrease of MRI signal intensity in perfused brain tissue. To accurately acquire this time dependent perfusion signal, a high temporal sampling rate is required. Therefore, rapid single-shot acquisitions such as echo-planar imaging (EPI) are used for DSC MRI.
In DSC imaging, the simultaneous acquisition of a gradient echo (GE) and a spin echo (SE) signal (GESE) may increase its diagnostic value by providing insights into the vascular properties due to the differences in their sensitivity to the vasculature size (2,3). In particular, the combined GESE imaging allows calculating the mean caliber of cerebral vessels, a technique called vessel size imaging (4,5).
The additional information from the second signal, however, entails long echo times (TE) and therefore results in an increased total acquisition time. A high temporal sampling rate of approximately 1s is crucial to sufficiently record the time dependent signal change after the CA injection. For this reason, the combined GE and SE data comes at the cost of reduced slice coverage, because it is not possible to cover the whole brain at a suitable spatial resolution in a sufficiently short repetition time (TR). Reduced coverage is a major disadvantage, in particular, in the longitudinal study of growing brain tumors where the image slab is set to cover the tumor. In addition to the problem of having consistent coverage in each scan, the tumor may grow out of the covered region over the course of study. On the other hand, varying coverage becomes an issue in normalization of the perfusion maps to a reference region, as a consistent reference region is more difficult to find, resulting in less repeatable measurements.
Simultaneous (SMS) acquisition has the potential to significantly improve the temporal efficiency of GESE DSC acquisitions. The SMS technique uses a two-dimensional imaging readout and parallel imaging to disentangle signal from multiple imaging slices that has been simultaneously excited by a multi-band (MB) RF pulse. This type of acquisition increases the number of slices that can be acquired in a given TR by a factor equal to that of the number of slices that were simultaneously excited and acquired (MB factor). The SMS method was first proposed by Larkman et al (6) for a multi-shot sequence and later demonstrated for EPI (7) and applied to increase temporal efficiency of fMRI acquisition (8). We note that in the original study by Larkman et al, it was already proposed that such method would be useful in improving the efficiency of DSC acquisitions.
In recent works, the SMS technique was also combined with simultaneous echo refocusing (9) and used to acquire fMRI and diffusion data at high temporal sampling rate (10,11). For brain imaging, the Field of View (FOV) along the slice direction is typically small and the simultaneously excited slices in SMS acquisition are spatially close. This results in an ill-conditioned unaliasing problem and a strong g-factor noise amplification that causes a significant drop in the signal to noise ratio (SNR) level.
A technique that enables SMS acquisitions with low SNR penalty was proposed by Breuer et al (12) through introducing a phase evolution along the phase encoding direction, resulting in a shift of overlapping slices (Fig. 1B). The method was termed Controlled Aliasing In Parallel Imaging Results in Higher Acceleration (CAIPIRINHA). Recently, this CAIPIRINHA approach was applied to EPI acquisitions by adding an additional gradient blip scheme (Fig. 1D) along the slice direction during phase encoding. The method was given the name blipped CAIPI (11). This technique overcame the large voxel blurring artifact of a previous attempt in introducing controlled aliasing to EPI (7) and has been used to improve the temporal efficiency of fMRI and diffusion imaging at 3T and 7T (13,14). Recently, the technique has also been applied to increase temporal sampling of GE-EPI for DSC imaging (15).
FIG. 1.
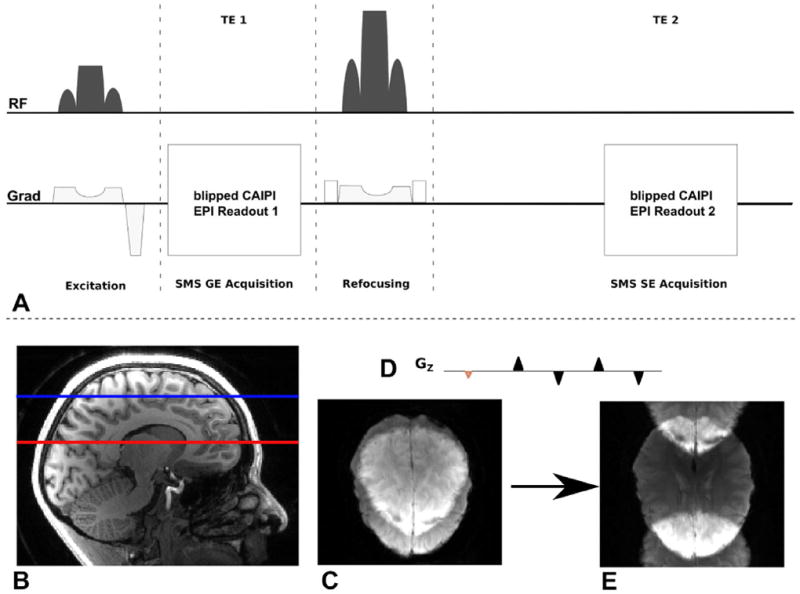
A: Pulse sequence diagram of SMS DSC MRI acquisition: Both gradient and spin echo are acquired within one TR. B–E: Blipped CAIPI SMS Acquisition: several slices are excited simultaneously (B) and read out using a 2D EPI scan. Disentangling the overlapping slices (C) results in low SNR. An additional gradient blip scheme in slice direction (D) with each phase encoding step shifts the slices in PE direction and enables SMS imaging with much reduced g-factor penalty and thereby allowing it to be used in this work to replace standard non-slice accelerated acquisition with a very small SNR penalty. [Color figure can be viewed in the online issue, which is available at wileyonlinelibrary.com.]
In this study, we combine the GESE sequence with a blipped CAIPI acquisition scheme to obtain high quality perfusion data with large slice coverage at a high temporal sampling rate.
METHODS
For all measurements, institutional review board approval and informed consent were obtained.
Hardware and Sequence Programming
All measurements were performed, using 3 Tesla (T) Magnetom Tim Trio whole body MRI systems (Siemens Healthcare Sector, Erlangen, Germany). A 32-channel phased array coil (Siemens Healthcare Sector, Erlangen, Germany) was used to receive the signal. The gradient system specifications of the MRI scanner include a maximum strength of 45 mT/m with a slew rate of 200 mT/m/s.
A standard GESE sequence was modified to perform SMS data acquisition (Fig. 1A). MB pulses were used to excite and refocus multiple slices at a time. The pulses were designed using a Shinnar - Le Roux algorithm (16). To reduce energy transmission and peak RF voltage of these pulses, the VERSE technique was used (17).
Dedicated software was developed to perform real time online image reconstruction using a Slice-GRAPPA algorithm with low leakage artifacts (18,19). For in-plane accelerated reconstruction, a standard GRAPPA algorithm (20) was used. For parallel reconstruction of GE as well as SE images, a separate set of GE and SE auto calibration signal (ACS) data was recorded for each signal.
Signal to Noise Analysis
One hundred repetition time series data of GESE sequences, with slice acceleration (MB = 2) and without slice acceleration, were acquired on a healthy volunteer and used to calculate quantitative SNR metrics to aid the comparison of the two sequences. A contrast agent was not given for these measurements. For both slice- and non slice accelerated acquisitions, 22 slices were recorded with an identical TR = 3000 ms. The long TR in both protocols resulted from the slower acquisition in the standard sequence without slice acceleration (minimum TR for MB = 2 acquisition is 1500 ms). Identical TR was used for both acquisitions to eliminate influence of differences in magnetization saturation/recovery on the results. The slice thickness was set to 3 mm. All remaining protocol parameters were matched to the patient studies (described below).
The image data in the time series of each of the two acquisitions was co-registered using the FMRIB Software Library (FSL) (21) (MCFLIRT, http://www.fmrib.ox.ac.uk/fsl/) to correct subject motion during each of the scans. The skull was excluded from the analysis using FSL Brain Extraction Tool.
SNR maps were computed for each measurement by calculating the average signal and standard deviation over a time series at every voxel with a signal over a certain threshold. The calculated SNR maps for GE and SE with and without slice acceleration were then co-registered using FSL (FLIRT) to enable a comparison of SNR at each image voxel.
The ratio of both SNR maps for either GE or SE acquisition reveals the voxel-wise retained SNR from additional slice acceleration.
The total retained SNR of the SMS acquisitions was calculated as the peak value of the retained SNR distribution.
Slice Accelerated DSC in Patients
To compare the results of perfusion analysis with and without slice acceleration, three patients with glioblastoma were scanned with both methods and each method with separate CA injection. Table 1 shows the order of DSC acquisitions for each scan. Subject 1 was scanned twice with reversed order of acquisitions. This enabled the evaluation of the effect of a pre-dose on the second acquisition which is a result of performing two consecutive acquisitions/injections.
Table 1.
Subject Scans which Are Included in the Studya
| Scan # | 1 | 2 | 3 | 4 |
|---|---|---|---|---|
| Subject | Subject 1,Visit 1 | Subject 1,Visit 2 | Subject 2 | Subject 3 |
| First DSC imaging | MB=2 | Standard | MB=2 | Standard |
| Second DSC imaging | Standard | MB=2 | Standard | MB=2 |
Subject 1 was scanned twice with reversed order of SMS and standard DSC to check for effects arising from pre bolus contrast.
The protocol parameters for both standard and SMS acquisitions are TR = 1500 ms, TE(GE) = 32 ms, TE(SE) = 98 ms, 11/22 slices (no slice acc./MB = 2), slice thickness = 5mm, 30% slice-gap distance factor, in-plane field of view (FOV) = 192 × 192 mm, in-plane-resolution = 1.5 mm, in-plane acceleration of 2. To maximize SNR for the MB =2 acquisition, a blipped CAIPI phase encoding for the overlapping slices was used. Fat suppression was achieved with a spectral saturation pulse.
The additional Slice GRAPPA ACS data are acquired before the SMS acquisition as a full slice stack, one slice at a time. No triggering was used for such acquisition. The acquisition duration for this training data is the product of the slice acceleration factor and the TR of the SMS acquisition. Thus, the acquisition of the slice acceleration ACS data takes 3 additional seconds.
In addition, 3D magnetization prepared rapid gradient echo (MPRAGE) volumetric anatomical acquisition was performed, with 1 mm isotropic voxels both before and after CA injection. This dataset was used for segmentation of DSC EPI images.
Perfusion Analysis
Before perfusion analysis, potential motion artifacts in the DSC data were detected and corrected using FSL (MCFLIRT). Perfusion analysis was performed in a modified version of nordicICE (NordicNeuroLab AS, Bergen, Norway). In brief, cerebral blood volume (CBV) and cerebral blood flow (CBF) maps were generated by an established tracer kinetic model, which was used to correct for CA extravasation based on the technique proposed by Weisskoff et al (2) and later elaborated by Donahue et al (22) and Boxerman et al (23). The arterial input functions (AIFs) were determined automatically in each patient by an established clustering method (24). The CBV and CBF maps were calculated with AIF deconvolution. Reference tissue masks representing unaffected gray matter (GM) and white matter (WM) were generated automatically from the DSC images as previously described (25,26). The masks representing the combined WM+GM were used to generate the reference tissue response curves used for CA extravasation correction and also to generate normalized CBV and CBF maps by dividing the respective perfusion parameters by their corresponding mean value in the WM+GM mask. This perfusion analysis has previously resulted in highly repeatable measurements (27).
Image Analysis
For each subject, tumor and healthy tissue regions of interest (ROIs) were generated as follows on MPRAGE images and mapped to both DSC images. Enhancing tumor was outlined on postcontrast MPRAGE images by an expert (P.P.). The whole brain was also automatically segmented into several anatomical regions by nonrigid registration of the Harvard-Oxford atlas, distributed by FSL, to the precontrast MPRAGE images using ANTS (http://www.picsl.upenn.edu/ANTS/) (28). These regions mostly included cortical areas. Only the anatomical regions of the healthy hemisphere, contralateral to the tumor side were retained for analysis of “healthy” brain. As the SMS DSC images had a larger field of view (FOV), to ensure that both DSC images are analyzed in the same way for perfusion, and that the same regions are evaluated in both DSC images, before analyzing SMS DSC image a mask was applied to eliminate the tissues outside the standard DSC FOV (Fig. 2A). The mask was obtained by rigid co-registration of the two DSC images. The same mask was applied to the label volume of anatomical regions. Figure 2B presents the resulting cortical regions overlaid on a structural image. Finally, the resulting tumor and normal tissue labels were mapped to the perfusion maps by rigid co-registration of structural images to perfusion maps in SPM (http://www.fil.ion.ucl.ac.uk/ spm/). The mean values of the generated perfusion maps were calculated within each ROI. We excluded the healthy regions that had less than 50 voxels.
FIG. 2.
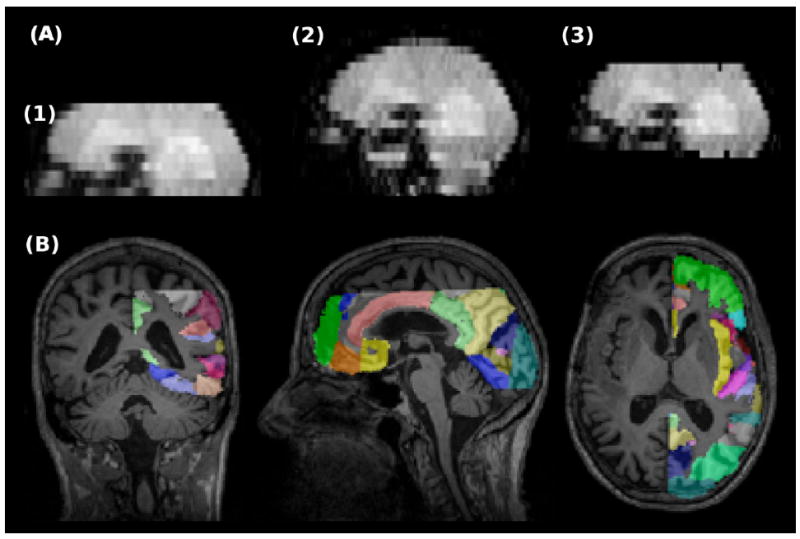
A: Comparison of the FOVs in standard and SMS DSC MRI. (1) Standard DSC, (2) SMS DSC, and (3) SMS DSC after eliminating the tissues out of standard DSC FOV. B: Labels of automatically generated healthy anatomical regions overlaid on MPRAGE image. [Color figure can be viewed in the online issue, which is available at wileyonlinelibrary.com.]
Statistical Analysis
For each subject, agreement between the two measurements within healthy tissues was assessed by intra-class correlation coefficient (ICC) (29) and repeatability coefficients (RC) (30). ICC describes how strongly two within-ROI measurements resemble each other relative to the variation between the measurements in all ROIs. An ICC value close to 0 represents poor agreement and a value close to 1 represents good agreement. RC represents the estimated range of variation between the measurements so that the difference between two measurements is expected to be between ±RC for 95% of cortical structures. Scatter plots were generated, i.e., values of SMS DSC versus standard DSC, as well as Bland-Altman plots, i.e., plots of differences versus mean values, which also display the confidence limits according to ±RC.
RESULTS
Signal to Noise Ratio Analysis
The results of the in vivo SNR comparison are shown in Figure 3A,B. This figure shows the retained SNR due to slice acceleration for two simultaneously acquired slices compared with the same slices without SMS. The distribution of retained SNR across all slices can be seen in the histograms of this figure. The peak value of the SNR distributions gives a retained SNR of 90% for GE and of 99% for SE acquisitions.
FIG. 3.
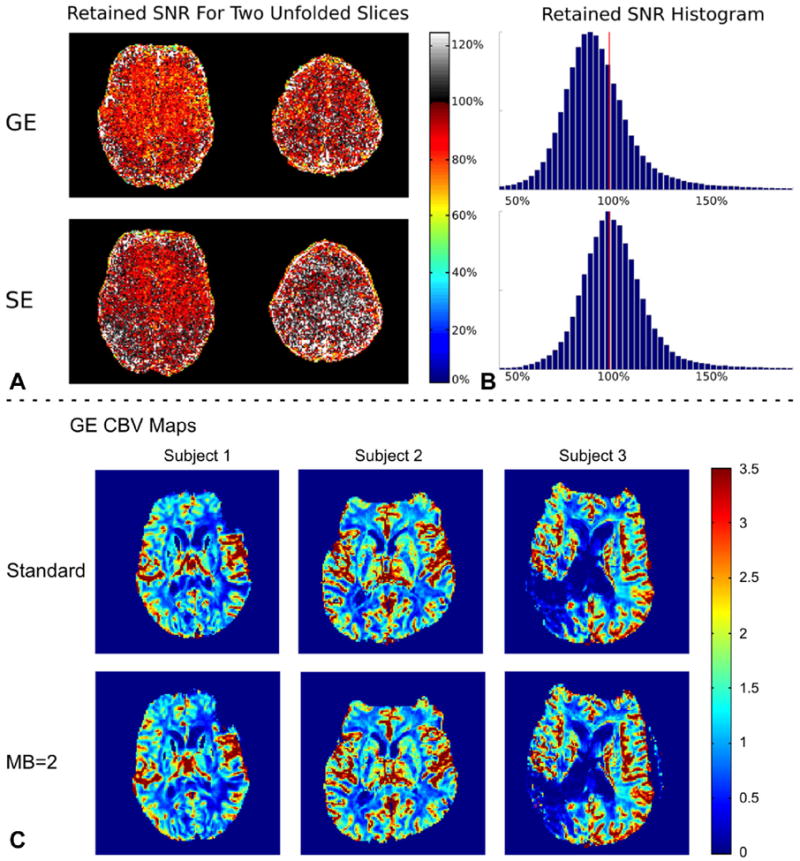
A,B: Results of the SNR comparison between an acquisition without slice acceleration and with an MB factor = 2. C: Representative GE CBV maps generated from standard (first row) and SMS (second row) DSC images for subjects 1, 2, and 3 (from left to right).
Perfusion Analysis
Figure 3C compares representative slices of GE CBV maps for three patients with and without slice acceleration. The maps appear to be near identical. Visual inspection of the signal showed that there is no degradation of image quality during the bolus passage compared with non–slice-accelerated acquisitions. Table 2 presents the ICCs and RCs for GE and SE CBV within healthy tissues for each scan. High agreement was obtained between the two GE CBV measurements with ICC values ≥ 0.95. For SE CBV, this was reduced to ICC ≥ 0.56. The GE and SE RC values, however, were comparable in all scans except in scan 4. In other words, intra-region variability was similar for GE and SE images. It is observed that RC ≤ 0.39 and RC ≤ 0.54 for GE and SE images, respectively. Figures 4 and 5 (first two columns) show the scatter and Bland-Altman plots for GE and SE CBV maps, respectively. As shown, the inter-region variability is higher in GE perfusion maps in comparison with SE perfusions maps. Similar values were obtained for CBF maps (data not shown).
Table 2.
Values of ICCs and RCs Reported for CBV within Healthy Regions
| Scan # | GE
|
SE
|
||
|---|---|---|---|---|
| ICC | RC | ICC | RC | |
| 1 | 0.97 | 0.25 | 0.78 | 0.25 |
| 2 | 0.95 | 0.32 | 0.65 | 0.28 |
| 3 | 0.96 | 0.34 | 0.79 | 0.33 |
| 4 | 0.95 | 0.39 | 0.56 | 0.54 |
| Average | 0.96 | 0.33 | 0.70 | 0.35 |
FIG. 4.
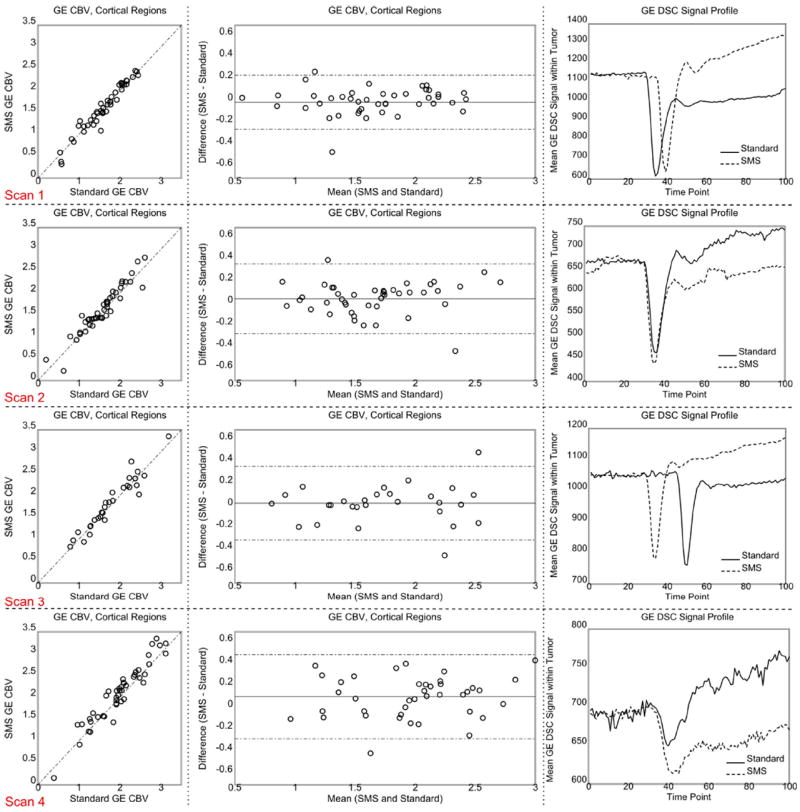
Scatter and Bland-Altman plots generated from GE CBV measurements within the healthy tissues (first two left columns) and GE DSC signal profile within the enhancing tumor (right column). The dotted lines of the Bland-Altman plot in the center column show the 95% confidence interval. The SMS signal in the time series signal curve plots on the right was scaled to make the baselines similar. The time shift of the peak arises from manual timing of CA injection. Each row corresponds to one scan. [Color figure can be viewed in the online issue, which is available at wileyonlinelibrary.com.]
FIG. 5.
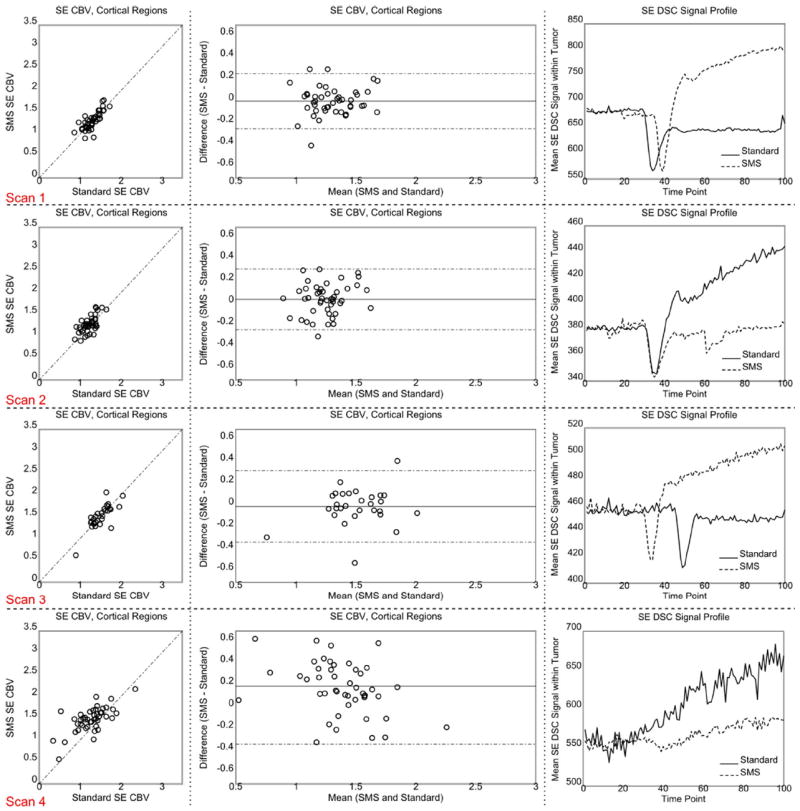
Scatter and Bland-Altman plots generated from SE CBV measurements within the healthy tissues (first two left columns) and GE DSC signal profile within the enhancing tumor (right column). The dotted lines of the Bland-Altman plot in the center column show the 95% confidence interval. The SMS signal in the signal profile plots on the right was scaled to make the baselines similar. The time shift of the peak arises from manual timing of CA injection. Each row corresponds to one scan. [Color figure can be viewed in the online issue, which is available at wileyonlinelibrary.com.]
The plots on the right side of Figures 4 and 5 compare the GE and SE profiles of the two DSC images within the tumor for each scan. The observed differences between the two profiles are in good agreement with (i) the T1 effect of CA leakage which should cause an increase in the signal profile after the bolus dip for the first injection only, and (ii) the difference in the injection times which should cause a time shift between the signal dips. Figure 6 shows the AIFs detected by nordicICE. As shown, the AIFs are comparable except for scan 4.
FIG. 6.
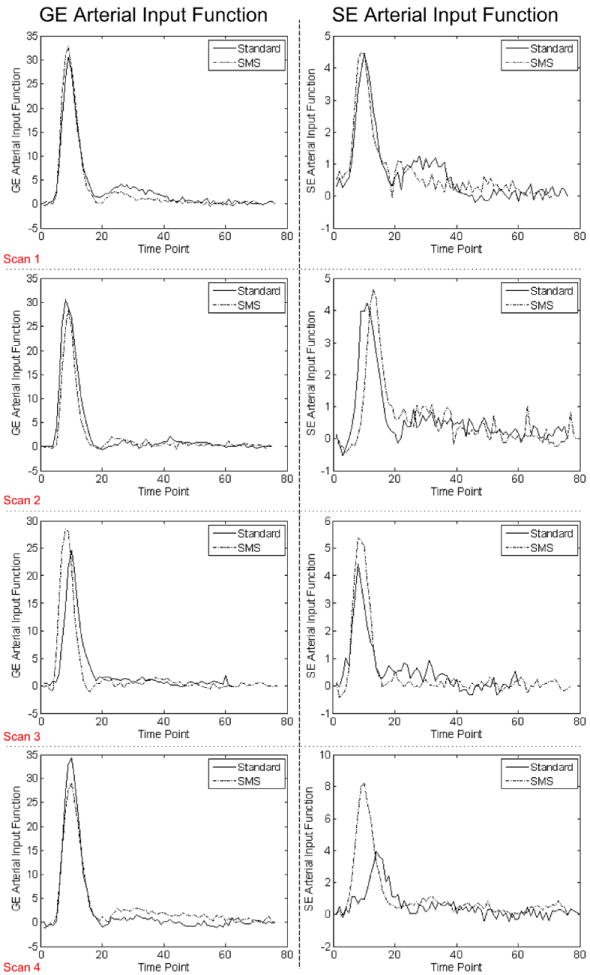
Arterial input functions detected by nordicICE. Note that the baseline has been eliminated. [Color figure can be viewed in the online issue, which is available at wileyonlinelibrary.com.]
DISCUSSION
This study shows that high quality DSC data can be acquired with an increased temporal efficiency using a slice-accelerated sequence. This additional acceleration was used to record images with significantly larger slice coverage than a standard DSC sequence, whilst preserving a sufficient time sampling rate.
The SNR results, depicted in Figure 3, reveal only neglectable loss in the total retained SNR for the SE acquisition (99% retained SNR) and a minor loss for the GE acquisition (90% retained SNR); allowing a two-fold increase in slice coverage at a minimal SNR cost. The SE retained SNR result is in-line with previously published result (13), which examines the application of SMS acquisition in SE diffusion imaging. In (13), it was shown that a slightly lowered average retained SNR of 90% was achieved for an acquisition of slightly higher acceleration factor (MB = 3) with the same in-plane acceleration (in-plane = 2).
A detailed look into the SNR analysis shows that the higher reduction in SNR in the SMS GE acquisition is related to higher noise amplification and not due to any change in the signal level. We hypothesize that this higher noise amplification could arise from differences in the two separate Slice-GRAPPA kernels that are used to reconstruct SMS GE and SE acquisitions, which in turn is a result of differences in the ACS training data that is used in creating these kernels. Future work will investigate the effect of using same Slice-GRAPPA kernels trained on the SE ACS data to reconstruct the SMS GE data. Nonetheless, we note that with this current implementation, the two-fold slice coverage increase still comes at a relatively low cost for the GE SMS acquisition.
The passage of the contrast agent induces a strong change of contrast in the images. The ACS data for Slice-GRAPPA were recorded before bolus injection and therefore have a different contrast. With a conventional Slice-GRAPPA algorithm, slice un-aliasing performance can have some dependency on the image contrast of the training data. With the Split Slice-GRAPPA method (19) used in this work, un-aliasing performance is improved; with lower slice leakage and dependency on image contrast. Visual inspection of the time course of the data confirms this. No additional slice leakage or ghosting was observed during the bolus induced contrast change and image quality with very low residual aliasing stays consistent during the whole acquisition procedure.
The major sources of variability between the two measurements include the difference between pulse sequences, order of acquisitions (i.e., the presence or absence of CA in the body from a previous acquisition), and biological variations. The order of acquisitions could make a difference in the presence of CA leakage within the tumor. This results in different DSC temporal profiles (Figs. 4 and 5). However, the T1 effect of CA leakage was corrected in the perfusion analysis.
The comparison with results based on a previous study, which examines the repeatability of standard DSC imaging of glioblastoma patients (27), yields an average RC value for healthy brain regions of 0.36 and 0.47 for GE and SE CBV, respectively. (compared with 0.33 and 0.35 in this study) The corresponding ICC values were 0.80 for GE and 0.71 for SE (compared with 0.96 and 0.70 in this study). Differences between the reported values of RC and ICC are influenced by slight changes in the experimental set ups of both studies. The previously reported study uses only one scan per session and is therefore more susceptible to biologic differences. This present study on the other hand uses two concatenated scans per session and is, therefore, more susceptible to variations arising from the bolus injection order. However, because the overall repeatability values of both studies are very similar, we conclude that this presented SMS method can be used with a similar confidence as the previously used standard sequence.
For comparability reasons, in this study the slice range of acquired SMS GESE data was cut to match the number of slices for nonaccelerated data. However, larger slice coverage will likely improve the repeatability of specifying a reference tissue for normalization of the perfusion maps, which improves repeatability of GESE measurements. To provide more detailed assessment of the performance of this method in clinical settings, further research effort in this direction should be made by performing studies with high numbers of tumor subjects.
In this study, an SMS acquisition with MB and in-plane acceleration factors of two was used to increase the coverage of the GESE DSC acquisition by two fold. This acquisition scheme was chosen to provide the increased coverage at a neglectable cost in artifact and SNR penalty when compared with the standard GESE sequence with in-plane acceleration of two. With larger MB factors, a potentially increased resolution and/or temporal sampling rate will have to be traded off with potential loss in SNR and increased artifacts. The effect of this on the quality of the DSC data will have to be studied in detail. Based on previous work, a whole brain acquisition with an MB factor of 3 and in-plane acceleration of 2, results a retained SNR of 80% compared with the nonslice accelerated acquisition with the same in-plane acceleration (13).
For scan 4, the estimated AIF for SE image was different between the two DSC images, which could account for the high RC values and less agreement between the two SE measurements. This may be attributed to the lower image quality due to the presence of a very large lesion, which can be observed in Figure 3C, resulting in less reliable perfusion analysis.
This study proposed a new DSC sequence to increase the brain coverage with a low SNR penalty. With this combined method, numerous improvements to GESE DSC MRI can be achieved amongst which are a higher number of slices for larger brain coverage or increased slice resolution as well as a higher temporal sampling rate. All of these can help improve the confidence in tracking therapeutic responses of tumor patients.
Acknowledgments
Grant sponsor: the NIH Human Connectome Project; Grant numbers: NIH U01MH093765; NIBIB R00EB012107.
References
- 1.Willats L, Calamante F. The 39 steps: evading error and deciphering the secrets for accurate dynamic susceptibility contrast MRI. NMR Biomed. 2013;26:913–931. doi: 10.1002/nbm.2833. [DOI] [PubMed] [Google Scholar]
- 2.Weisskoff RM, Zuo CS, Boxerman JL, Rosen BR. Microscopic susceptibility variation and transverse relaxation: theory and experiment. Magn Reson Med. 1994;31:601–610. doi: 10.1002/mrm.1910310605. [DOI] [PubMed] [Google Scholar]
- 3.Boxerman JL, Hamberg LM, Rosen BR, Weisskoff RM. MR Contrast due to intravascular magnetic susceptibility perturbations. Magn Reson Med. 1995;34:555–566. doi: 10.1002/mrm.1910340412. [DOI] [PubMed] [Google Scholar]
- 4.Prinster A, Pierpaoli C, Turner R, Jezzard P. Simultaneous measurement of DeltaR2 and DeltaR2* in cat brain during hypoxia and hypercapnia. Neuroimage. 1997;6:191–200. doi: 10.1006/nimg.1997.0288. [DOI] [PubMed] [Google Scholar]
- 5.Kiselev VG, Strecker R, Ziyeh S, Speck O, Hennig J. Vessel size imaging in humans. Magn Reson Med. 2005;53:553–563. doi: 10.1002/mrm.20383. [DOI] [PubMed] [Google Scholar]
- 6.Larkman DJ, Hajnal JV, Herlihy AH, Coutts GA, Young IR, Ehnholm G. Use of multicoil arrays for separation of signal from multiple slices simultaneously excited. J Magn Reson. 2001;13:313–317. doi: 10.1002/1522-2586(200102)13:2<313::aid-jmri1045>3.0.co;2-w. [DOI] [PubMed] [Google Scholar]
- 7.Nunes RG, Hajnal JV, Golay X, Larkman DJ. Simultaneous slice excitation and reconstruction for single shot EPI. Proceedings of the 14th Annual Meeting of ISMRM; Seattle, Washington, USA. 2006. p. 293. [Google Scholar]
- 8.Moeller S, Yacoub E, Olman CA, Auerbach E, Strupp J, Harel N, Ugurbil K. Multiband multislice GE-EPI at 7 tesla, with 16-fold acceleration using partial parallel imaging with application to high spatial and temporal whole-brain fMRI. Magn Reson Med. 2009;63:1144–1153. doi: 10.1002/mrm.22361. [DOI] [PMC free article] [PubMed] [Google Scholar]
- 9.Feinberg DA, Reese TG, Wedeen VJ. Simultaneous echo refocusing in EPI. Magn Reson Med. 2002;48:1–5. doi: 10.1002/mrm.10227. [DOI] [PubMed] [Google Scholar]
- 10.Feinberg DA, Moeller S, Smith SM, Auerbach E, Ramanna S, Glasser MF, Miller KL, Ugurbil K, Yacoub E. Multiplexed echo planar imaging for sub-second whole brain FMRI and fast diffusion imaging. PLoS One. 2010;5:e15710. doi: 10.1371/journal.pone.0015710. [DOI] [PMC free article] [PubMed] [Google Scholar]
- 11.Setsompop K, Gagoski BA, Polimeni JR, Witzel T, Wedeen VJ, Wald LL. Blipped-controlled aliasing in parallel imaging for simultaneous multislice echo planar imaging with reduced g-factor penalty. Magn Reson Med. 2012;67:1210–1224. doi: 10.1002/mrm.23097. [DOI] [PMC free article] [PubMed] [Google Scholar]
- 12.Breuer FA, Blaimer M, Heidemann RM, Muller MF, Griswold MA, Jakob PM. Controlled aliasing in parallel imaging results in higher acceleration (CAIPIRINHA) for multi-slice imaging. Magn Reson Med. 2005;53:684–691. doi: 10.1002/mrm.20401. [DOI] [PubMed] [Google Scholar]
- 13.Setsompop K, Cohen-Adad J, Gagoski BA, Raij T, Yendiki A, Keil B, Wedeen VJ, Wald LL. Improving diffusion MRI using simultaneous multi-slice echo planar imaging. Neuroimage. 2012;63:569–580. doi: 10.1016/j.neuroimage.2012.06.033. [DOI] [PMC free article] [PubMed] [Google Scholar]
- 14.Eichner C, Setsompop K, Koopmans PJ, Lutzkendorf R, Norris DG, Turner R, Wald LL, Heidemann RM. Slice accelerated diffusion-weighted imaging at ultra-high field strength. Magn Reson Med. 2013 doi: 10.1002/mrm.24809. [DOI] [PubMed] [Google Scholar]
- 15.Wang D, Cantrell C, Spottiswoode B, Deshpande V, Carroll T, Heberlein K. Slice accelerated EPI for dynamic-susceptibility contrast enhanced (DSC) MRI. Proceedings of the 21st Annual Meeting of ISMRM; Salt Lake City, Utah, USA. 2013. p. 6464. [Google Scholar]
- 16.Pauly J, Le Roux P, Nishimura D, Macovski A. Parameter relations for the Shinnar-Le Roux selective excitation pulse design algorithm. IEEE Trans Med Imaging. 1991;10:53–65. doi: 10.1109/42.75611. [DOI] [PubMed] [Google Scholar]
- 17.Conolly S, Nishimura D, Macovski A. Variable-rate selective excitation. J Magn Reson. 1988;78:440–458. [Google Scholar]
- 18.Cauley SF, Setsompop K, Polimeni JR, Wald LL. Inter-slice artifact reduction for slice-GRAPPA reconstruction of simultaneous multislice (SMS) acquisitions. Proceedings of the 20th Annual Meeting of ISMRM; Melbourne, Australia. 2012. p. 2543. [Google Scholar]
- 19.Cauley SF, Polimeni JR, Bhat H, Wald LL, Setsompop K. Interslice leakage artifact reduction technique for simultaneous multislice acquisitions. Magn Reson Med. 2013 doi: 10.1002/mrm.24898. [DOI] [PMC free article] [PubMed] [Google Scholar]
- 20.Griswold MA, Jakob PM, Heidemann RM, Nittka M, Jellus V, Wang J, Kiefer B, Haase A. Generalized autocalibrating partially parallel acquisitions (GRAPPA) Magn Reson Med. 2002;47:1202–1210. doi: 10.1002/mrm.10171. [DOI] [PubMed] [Google Scholar]
- 21.Jenkinson M, Beckmann CF, Behrens TEJ, Woolrich MW, Smith SM. FSL. Neuroimage. 2012;62:782–790. doi: 10.1016/j.neuroimage.2011.09.015. [DOI] [PubMed] [Google Scholar]
- 22.Donahue KM, Krouwer HG, Rand SD, Pathak AP, Marszalkowski CS, Censky SC, Prost RW. Utility of simultaneously acquired gradient-echo and spin-echo cerebral blood volume and morphology maps in brain tumor patients. Magn Reson Med. 2000;43:845–853. doi: 10.1002/1522-2594(200006)43:6<845::aid-mrm10>3.0.co;2-j. [DOI] [PubMed] [Google Scholar]
- 23.Boxerman JL, Schmainda KM, Weisskoff RM. Relative cerebral blood volume maps corrected for contrast agent extravasation significantly correlate with glioma tumor grade, whereas uncorrected maps do not. AJNR Am J Neuroradiol. 2006;27:859–867. [PMC free article] [PubMed] [Google Scholar]
- 24.Mouridsen KS, Christensen S, Gyldensted L, Ostergaard L. Automatic selection of arterial input function using cluster analysis. Magn Reson Med. 2006;55:524–531. doi: 10.1002/mrm.20759. [DOI] [PubMed] [Google Scholar]
- 25.Emblem KE, Bjornerud A. An automatic procedure for normalization of cerebral blood volume maps in dynamic susceptibility contrast-based glioma imaging. AJNR Am J Neuroradiol. 2009;30:1929–1932. doi: 10.3174/ajnr.A1680. [DOI] [PMC free article] [PubMed] [Google Scholar]
- 26.Bjornerud A, Emblem KE. A fully automated method for quantitative cerebral hemodynamic analysis using DSC-MRI. J Cereb Blood Flow Metab. 2010;30:1066–1078. doi: 10.1038/jcbfm.2010.4. [DOI] [PMC free article] [PubMed] [Google Scholar]
- 27.Jafari-Khouzani KE, Emblem K, Kalpathy-Cramer J, Bjornerud A, Vangel M, Gerstner E, Schmainda K, Batchelor T, Rosen B, Stufflebeam S. Repeatability of cerebral perfusion measurements using dynamic susceptibility contrast MRI. Proceedings of the 21st Annual Meeting of ISMRM; Salt Lake City, Utah, USA. 2013. p. 3061. [Google Scholar]
- 28.Avants BB, Epstein CL, Grossman M, Gee JC. Symmetric diffeomorphic image registration with cross-correlation: evaluating automated labeling of elderly and neurodegenerative brain. Med Image Anal. 2008;12:26–41. doi: 10.1016/j.media.2007.06.004. [DOI] [PMC free article] [PubMed] [Google Scholar]
- 29.Shrout PE, Fleiss JL. Intraclass correlations: uses in assessing rater reliability. Psychol Bull. 1979;86:420. doi: 10.1037//0033-2909.86.2.420. [DOI] [PubMed] [Google Scholar]
- 30.Bland JM, Altman DG. Statistical methods for assessing agreement between two methods of clinical measurement. Lancet. 1986;1:307–310. [PubMed] [Google Scholar]


