Abstract
Aim:
To prepare a bergenin-phospholipid complex (BPC) to increase oral bioavailability of the drug.
Methods:
In order to obtain the acceptable BPC, a spherical symmetric design-response surface methodology was used for process optimization. The influence of reaction medium, temperature, drug concentration and drug-to-phospholipid ratio on the combination percentage and content of bergenin in BPC were evaluated. BPC was then characterized by thin-layer chromatography (TLC), high-performance liquid chromatography (HPLC), ultra-violet (UV) spectroscopy, fourier transform infrared spectroscopy (FT-IR), differential scanning calorimetry (DSC) and X-ray powder diffraction. The physicochemical properties such as microscopic shape, particle size, zeta-potential, solubility, crystalline form, and hygroscopicity were tested. The pharmacokinetic characteristics and bioavailability of BPC were investigated after oral administration in rats in comparison to bergenin and the physical mixture (bergenin and phospholipids).
Results:
BPC was successfully prepared under the optimum conditions [temperature=60 °C, drug concentration=80 g/L and drug-to-phospholipids ratio=0.9 (w/w)]. The combination percentage was 100.00%±0.20%, and the content of bergenin in the complex was 45.98%±1.12%. Scanning electron microscopy and transmission electron microscopy of BPC showed spherical particles. The average particle size was 169.2±20.11 nm and the zeta-potential was -21.6±2.4 mV. The solubility of BPC in water and in n-octanol was effectively enhanced. The Cmax and AUC0→∞ of BPC were increased, and the relative bioavailability was significantly increased to 439% of bergenin.
Conclusion:
The BPC is a valuable delivery system to enhance the oral absorption of bergenin.
Keywords: bergenin, phospholipid complex, spherical symmetric design-response surface methodology, physicochemical properties, bioavailability
Introduction
Bergenin (3,4,8,10-tetrahydroxy-2-hydroxymethyl-9-methoxy-2,3,4,4a-tetrahydropyrano[3,2-c]isochromen-6-one) is a major component of traditional Chinese medicine Bergenia crassiflora1, 2. Bergenin has been widely used for the treatment of chronic bronchitis and has other effects such as antitussive, hepatoprotective, anti-inflammatory, neuroprotective and weak anti-HIV activities3, 4, 5, 6. Although bergenin has been used for more than 30 years, its poor oral bioavailability is still an obstacle to its further application7. The Biopharmaceutics Classification System (BCS) classifies drugs into four categories depending on their solubility and permeability characteristics8. According to this scheme, as a class IV compound, bergenin has neither sufficient solubility nor permeability for complete absorption9. Furthermore, conventional tablet is the formulation of bergenin on the market, but a high dose (375 mg/d) has to be used in order to exert therapeutic effects. Many efforts have been made to enhance its bioavailability, such as structure modification, prodrugging and new dosage forms such as dripping pills, soft capsules and β-cyclodextrin inclusion complexes10, 11, 12, 13, 14. However, no data has been published in relation to the improved bioavailability after oral administration.
In this study, a phospholipid complex was adopted to increase both the water solubility and liposolubility of bergenin to enhance its oral bioavailability. The preparation of the bergenin-phospholipid complex (BPC) was optimized by a spherical symmetric design-response surface methodology. Furthermore, the physicochemical properties and oral bioavailability of BPC was explored in comparison to bergenin and the physical mixture (bergenin and phospholipids).
Materials and methods
Materials
Bergenin was kindly supplied by Sichuan Dihon Medical Development Co, Ltd (Chengdu, China). Phospholipid was purchased from Shanghai Toshisun Enterprise Co, Ltd (Shanghai, China), and the phosphatidyl content was approximately 80% (w/w). Methanol and water were of HPLC grade. All the other reagents and solvents were of the highest purity commercially available.
Chromatography
A sensitive HPLC assay was developed to analyze the content of bergenin. The HPLC instrument employed was an Alltech™ (manufactured by Alltech Technologies, USA) LC system with a model 426 pump and model UVIS-201 absorbance detector. The output signal was monitored and processed using the AllChrom™ Plus Chromatograph Data System (designed by Multilink Services Co Ltd). The columns were Dikma Diamonsil® C18 (150×4.6 mm, 5 μm) and Dikma EasyGuard 6101 C18 kit guard column. The mobile phase was a mixture of methanol-water (20:80, v/v, pH 2.50) at a flow rate of 1 mL/min. The wavelength was set at 275 nm. All analyses were performed at 30 °C.
Preparation of BPC
A weighed amount of bergenin and phospholipids were charged in a round bottom flask and dissolved in anhydrous ethanol. The mixture was refluxed at a controlled temperature for about 2 h. The resultant clear solution was evaporated and dried under vacuum (40 °C). The residues were then gathered and placed in desiccators.
Preliminary investigations of the process parameters revealed that reaction temperature (X1), drug concentration (X2) and the drug to phospholipid ratio (X3) highly influenced both the combination percentage (Y1) and content of bergenin (Y2). A statistical model incorporating interactive and polynomial terms was used to evaluate the response employing the equation:
Y=b0+b1X1+b2X2+b3X3+b4X12+b5X22+b6X32+b7X1X2+b8X1X3+b9X2X3
where Y was the dependent variable, b0 was the intercept representing the arithmetic average of the 15 runs, and b1 to b9 were the estimated coefficients for the factors (Xi, i=1, 2, 3). X1, X2, and X3 were the coded levels of the independent variable(s). The interaction terms X1X2, X1X3, and X2X3 showed how the response changed when two factors were changed simultaneously. The polynomial terms (Xi2) were included to investigate nonlinearity. The level values of three factors and the composition of central composite design batches 1 to 15 are shown in Tables 1 and 2.
Table 1. Independent variables and their correspondent values for optimization of BPC preparation using the spherical symmetric design-response surface methodology.
| Variables | Levels |
||||
|---|---|---|---|---|---|
| −1.732 | −1 | 0 | 1 | 1.732 | |
| X1 | 30 | 38.45 | 50 | 61.55 | 70 |
| X2 | 20 | 36.91 | 60 | 83.09 | 100 |
| X3 | 0.4 | 0.57 | 0.8 | 1.03 | 1.2 |
Table 2. Response values of different variables for the optimization of BPC preparation using the spherical symmetric design-response surface methodology.
| Formulation | Factors |
Responses |
|||
|---|---|---|---|---|---|
| X1 | X2 | X3 | Y1 | Y2 | |
| 1 | −1 | −1 | −1 | 100.00 | 34.70 |
| 2 | −1 | −1 | 1 | 98.82 | 47.02 |
| 3 | −1 | 1 | −1 | 67.19 | 26.76 |
| 4 | −1 | 1 | 1 | 76.19 | 43.06 |
| 5 | 1 | −1 | −1 | 97.82 | 37.22 |
| 6 | 1 | −1 | 1 | 90.25 | 46.13 |
| 7 | 1 | 1 | −1 | 98.44 | 35.91 |
| 8 | 1 | 1 | 1 | 96.85 | 47.07 |
| 9 | −1.732 | 0 | 0 | 65.27 | 32.97 |
| 10 | 1.732 | 0 | 0 | 99.12 | 43.50 |
| 11 | 0 | −1.732 | 0 | 100.00 | 45.78 |
| 12 | 0 | 1.732 | 0 | 90.11 | 45.36 |
| 13 | 0 | 0 | −1.732 | 100.00 | 26.94 |
| 14 | 0 | 0 | 1.732 | 90.74 | 49.85 |
| 15 | 0 | 0 | 0 | 100.00 | 41.41 |
The combination percentage of bergenin was calculated using the following equation: Combination percentage (%)=(A–B)/A*100%, where A was the weighed amount of bergenin for preparing the complex and B was the content not forming a complex. The content of bergenin in the complex was estimated by HPLC. It was calculated as: content (w/w, %)=C/D*100%, where C was the amount of bergenin that formed a complex and D was the weight of the BPC.
Thin-layer chromatography (TLC)
Sample solutions were prepared by dissolving bergenin, phospholipids, the physical mixture and BPC in methanol. TLC plates were precoated with silica gel at a 0.15–0.2 mm thickness. The plates were saturated with a solvent system of acetic ether:methanol (5:1, v/v), developed to a distance of about 4.5 cm and removed from the chamber to dry in air. Phospholipids were visualized by ninhydrin, and the spot of bergenin was observed with a ZF-I ultraviolet analysis instrument (Shanghai Gucun Optic Instrument Factory, China).
Ultraviolet (UV) spectra, HPLC, and Fourier Transform Infrared spectra (FT-IR)
Tested samples were dissolved in water and then scanned with a UV spectrometer (Varian Cary 100, America) over the wavenumber range of 200–600 nm. For HPLC, a 10 μL aliquot sample solution was injected into the HPLC. The FT-IR spectra were recorded on an FT-IR spectrometer (VECTOR 22, Bruker, Germany) after the samples were compressed into a KBr pellet.
Differential scanning calorimetry (DSC)
The samples were sealed in an aluminum crimp cell and heated at 5 °C/min from 0 to 300 °C in a nitrogen atmosphere at a flow rate of 50 mL/min. The peak transition onset temperature of bergenin, phospholipids, BPC and the physical mixture were determined and compared with the help of a differential scanning calorimeter (EXSTAR6000 DSC, Japan).
X-ray powder diffraction
The X-ray diffraction was recorded on an X-ray diffractometer (PHILIPS X'Pert Pro MPD DY1291, Japan). Samples of certain weight were added into the slide for packing prior to X-ray scanning. Spectra of graphs were plotted from 3.00° to 65.00° of 2 θ with a step width of 0.03° and step time of 0.2 s at room temperature.
Morphological characteristics
The samples were coated with platinum in a sputter coater, and their surface morphology was viewed and photographed with a scanning electron microscope (SEM). A transmission electron microscope (TEM, H-600IV, Hitachi, Japan) was used for microscopic characterization of the complex. The complex was suspended in distilled water, and a drop was placed on a carbon-coated copper grid. The films on the grid were negatively stained by immediately adding a drop of 2% (w/w) ammonium molybdate in 2% (w/v) ammonium acetate buffer (pH 6.8), removing the excess staining solution with a filter paper and air-drying.
Particle size and zeta-potential
The particle size and zeta-potential of BPC were determined at 25 °C using photon correlation spectroscopy (Malvern Zeta-Size Nano ZS90, UK). A proper dilution of the suspension was prepared with double-distilled water before each analysis.
Solubility studies
Solubility determination was carried out by adding an excess of sample to 5 mL of water or n-octanol in sealed glass containers at 25 °C. Each experiment was performed in triplicate. The liquids were agitated for 24 h and then centrifuged to remove solid substances (12 000×g, 5 min). The supernatant was filtered through a 0.45 μm membrane. Then, 1 mL of filtrate was mixed with 9 mL of solvent, and a 10 μL aliquot of the resulting solution was injected into an HPLC.
Hygroscopicity
Solid samples were stored under controlled temperature and humidity conditions to investigate the ability of bergenin and BPC to take up water from the environment. The relative humidity (RH) at 25 °C was prepared using saturated solutions with known RH values (22.45%, 42.76%, 57.7%, 75.28%, 84.26%, 92.50%, and 98.00%) in desiccators15. Certain amounts of samples were weighed and put into open clear glass bottles that were exposed to the desired RH. The gain in weight of the samples was determined up to saturation humidity. At each investigated RH, samples were prepared in triplicate.
Pharmacokinetic study in rats
Experiment design
Male Wistar rats (250±20 g) were obtained from the Laboratory Animal Center of Sichuan University. All experiments were approved by the Institutional Animal Care and Use Committee of Sichuan University. Animals were divided randomly into three groups (n=5). Each group of rats was given a single oral dose of free bergenin, the physical mixture or BPC (equivalent to 300 mg of bergenin). Blood samples were obtained at appropriate time points; 0.2 mL of plasma was separated by centrifugation (12 000×g) for 5 min and then stored at -20 °C until analysis.
Plasma sample preparation
The preparation method of the plasma samples was developed in our laboratory to quantify the bergenin concentration in biosamples16. When the plasma sample was thawed, 20 μL of the IS solution was added and agitated for 20 s. Then 600 μL of ethyl acetate was added and shaken for 2 min, and sonic oscillation was performed to obtain complete extraction. The extracts were then centrifuged at 3000×g to achieve better phase separation. This procedure was repeated three times, and all of the supernatant was mixed and dried under vacuum. The residues were reconstituted with 100 μL of mobile phase and then centrifuged at 12 000×g for 2 min. A 20 μL aliquot of the supernatant was then injected into the HPLC system.
Pharmacokinetic parameters
The pharmacokinetic parameters for bergenin in plasma were estimated by appropriate compartmental methods. All parameters were determined from the sample collection times and the assayed concentrations at these time points. Plasma concentrations were plotted against time, and the pharmacokinetic calculations were performed using the standard software program DAS 2.0 (Drug and Statistics, Anhui, China). The following parameters were estimated: absorption half-life (t1/2α), elimination half-life (t1/2β), maximal plasma concentration (Cmax), area under the plasma concentration time curve (AUC), and mean residence time (MRT). Free bergenin was taken as the control group to calculate the relative BA values.
Results
Preparation of BPC
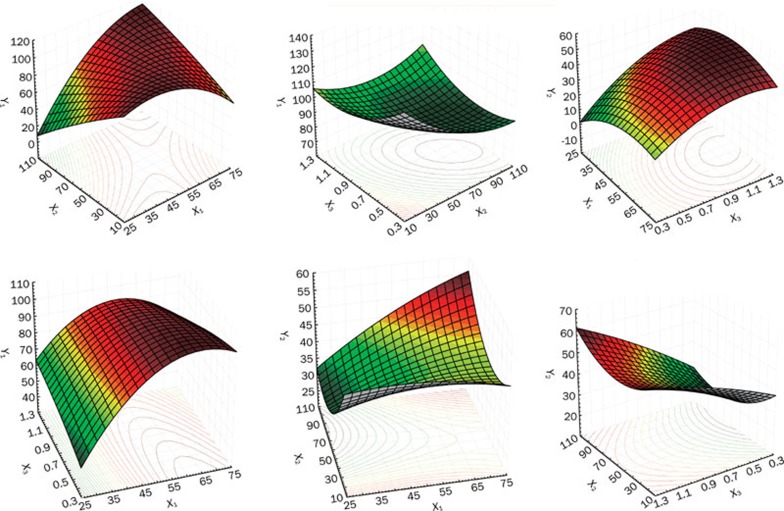
The experimental results concerning the tested variables on the combination or content of bergenin in the complex are shown in Table 2. A mathematical relationship between factors and parameters was generated by response surface regression analysis in the software STATISTICA 6.0. The three-dimensional response surface plots for the most statistically significant variables on the evaluated responses are shown in Figure 1. The equations represented the quantitative effect of process variables (X1, X2, and X3), and their interactions on their responses Y1 and Y2 are listed as follows:
Figure 1.
Response surface plot showing the influence of reaction temperature (X1), drug concentration (X2), drug to phospholipids ratio (X3) on combination percentage (Y1) and content of bergenin (Y2).
Y1=17.8292+3.9683X1−1.5953X2+59.0044X3−0.0448X12−0.0032X22−29.5646X32+0.0294X1X2−0.7960X1X3+0.3788X2X3
Y2=−10.7459+1.1372X1−0.6964X2+74.4763X3−0.0094X12+0.0022X22−22.4228X32+0.0054X1X2−0.4008X1X3+0.1462X2X3
The polynomial models for Y1 and Y2 were found to be significant, with F values of 482.45 and 760.97, respectively (P<0.05). The values of correlation coefficients (R) were found to be 0.9670 and 0.9892, respectively, indicating a good fit to the quadratic model.
The response surface and contour plots (Figure 1) clearly indicated that X1, X2, and X3 strongly influenced the combination percentage (Y1) and content of bergenin (Y2). The combination (%) for the 15 batches showed a wide variation of 65.27% to 100.00%, and the content was in the range of 26.94% to 49.85% (Table 2). It was found that an increase in reaction temperature led to an increase of combination percentage and drug content. The drug-to-phospholipids ratio was an important factor affecting the drug content.
In order to evaluate the optimization capability of the models generated according to the results of the spherical symmetric design-response surface methodology, the BPC was prepared using the optimal process variable settings, where X1, X2, and X3 were equal to 60 °C, 80 g/L and 0.9, respectively (Table 3). The combination percentage was 100.00%, and the content of bergenin in the complex was 45.98%±1.12%. The results illustrated a good relationship between the experimental and predicted values, which confirmed the practicability and validity of the model. The predicted error for all the response variables was below 3%, indicating that the optimization technique was appropriate for optimizing BPC.
Table 3. Comparison of the observed and predicted values in BPC prepared under predicted optimum conditions.
| Response variable | Predicted value | Observed value | Bias (%) |
|---|---|---|---|
| Combination (%) | 100.00 | 100.00±0.20 | 0 |
| Content (%) | 47.37 | 45.98±1.12 | −2.93 |
Thin-layer chromatography (TLC)
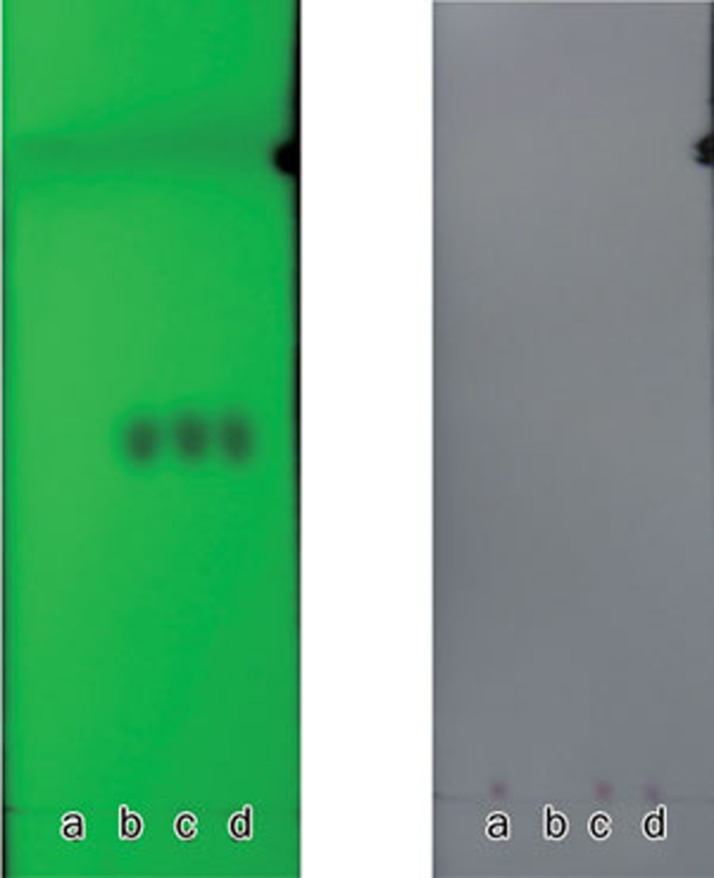
The chromatogram of BPC was the same as the physical mixture. Two spots were observed (Figure 2): one was similar to the phospholipids (on the starting line), and the other had the same Rf as bergenin (Rf=0.58). No new spot was found.
Figure 2.
TLC of phospholipids (a), bergenin (b), physical mixture (c), and BPC (d).
UV, HPLC, and FT-IR spectrum
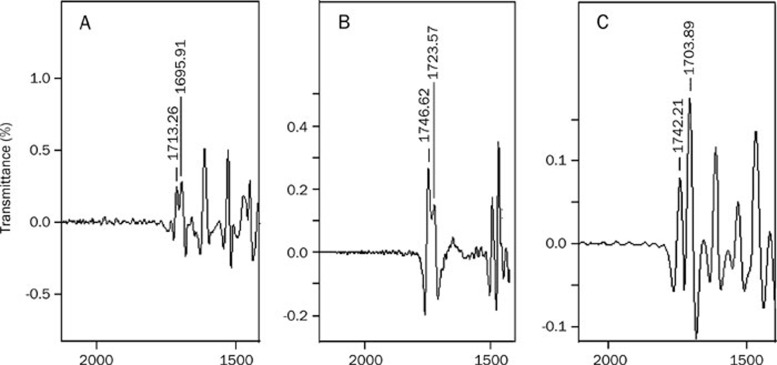
The UV spectra are shown in Figure 3. The phospholipids showed only end absorptions close to 200 nm. The absorption curves of bergenin, the physical mixture and BPC were nearly the same. Two characteristic absorption bands of bergenin were observed at 220 and 275 nm, which was in accordance with the Pharmacopoeia of PRC17. The retention time of BPC was the same as bergenin, and no new peak was present in the HPLC chromatogram (Figure 4). As shown in Figure 5, the carbonyl absorptions (C=O) of bergenin and the phospholipids were at 1713 cm−1 and 1746 cm−1, respectively. Bergenin contains phenolic hydroxyl groups, and hydrogen bonding interactions between molecules was observed (1695 cm−1). The hydrogen bonds between molecules of phospholipids were present at 1723 cm−1. The hydrogen bonds in BPC (1703 cm−1) were different from the bonds in either bergenin or the phospholipids.
Figure 3.
UV spectra of bergenin (A), phospholipids (B), physical mixture (C), and BPC (D).
Figure 4.
HPLC of bergenin (A), phospholipids (B), physical mixture (C), and BPC (D). The mobile phase was consisted of methanol-water (20:80, v/v), pH 2.50.
Figure 5.
FT-IR spectra of bergenin (A), phospholipids (B), and BPC (C).
Differential scanning calorimetry (DSC)
DSC thermograms of bergenin (a), phospholipids (b), the physical mixture (c) and BPC (d) are shown in Figure 6. The thermogram of bergenin exhibited peaks at 143.0, 153.5, and 240.7 °C. The peak at 240.7 °C was very sharp and appeared to be due to a phase transition from solid to liquid, which is in accordance with a report that 232–240 °C is the melting point of bergenin17. DSC of BPC showed that the endothermal peaks of bergenin and phospholipids disappeared.
Figure 6.
DSC thermograms of bergenin (A), phospholipids (B), physical mixture (C), and BPC (D).
X-ray powder diffraction
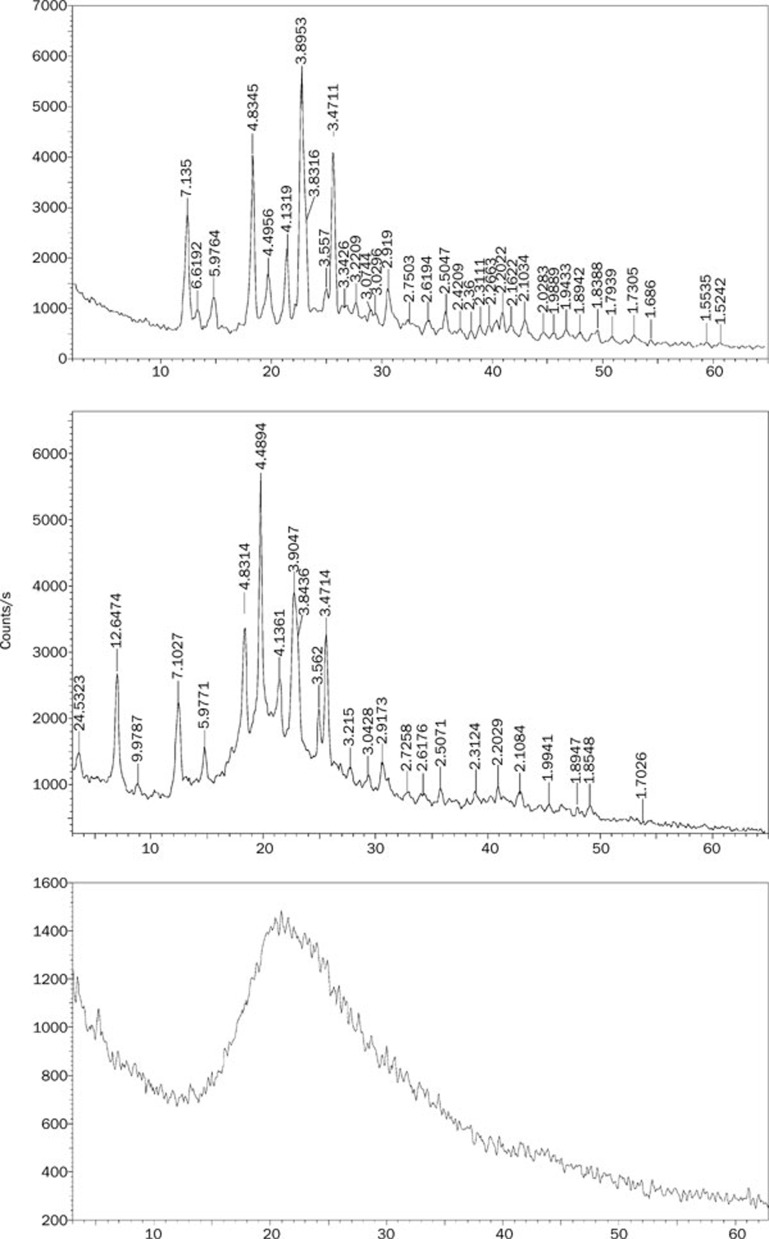
The powder of X-ray diffraction patterns of bergenin, the physical mixture and BPC are shown in Figure 7. Bergenin displayed partial sharp crystalline peaks, which is characteristic of a molecule with some crystallinity. The physical mixture exhibited both crystalline peaks and a wide peak due to the phospholipids. Compared with the above two, the crystalline peaks disappeared in the complex.
Figure 7.
X-ray diffraction patterns of bergenin (A), physical mixture (B), and BPC (C).
Morphological characteristics of BPC
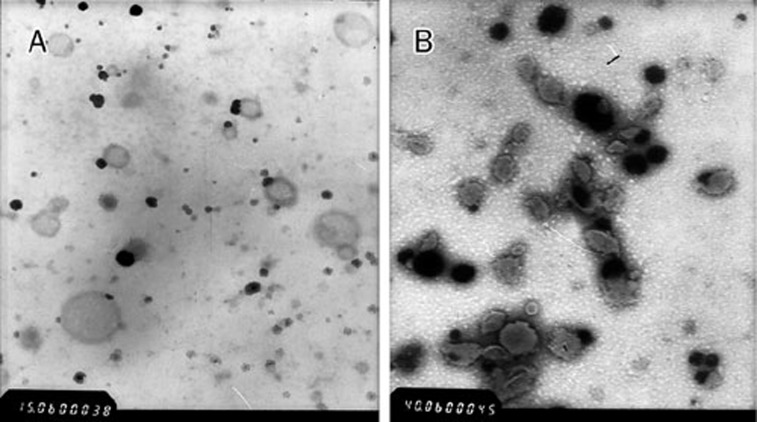
The SEM and TEM photographs are shown in Figures 8 and 9. Bergenin exhibited a distinctive external crystal shape. BPC did not exist on the appearance of drug but appeared to be spherical with a smooth surface.
Figure 8.
Scanning electron micrographs of bergenin at ×400 (A) and BPC at ×100 (B), and ×300 (C) magnification.
Figure 9.
Transmission electron micrographs of BPC after slightly shaking in distilled water at ×1500 magnification (A) and at ×4000 magnification (B), respectively.
Particle size and zeta-potential
The particle size of BPC was distributed in a narrow range of 169.2±20.11 nm, and the PDI was 0.212±0.032. The zeta-potential is a key factor that could influence some properties of the particles, such as the stability in solution and interaction with other materials. However, no studies have been published to date in relation to this aspect of phospholipid complexes. The zeta-potential of BPC prepared in our experiment was -21.6±2.4 mV, which might be related to the type and composition of the phospholipids.
Solubility studies
The data showed that the solubility of BPC in n-octanol or water was increased 177.32- and 6.03-times higher than bergenin, respectively (Table 4, 5). The results also indicated that, for the physical mixture, the phospholipids enhanced the solubility of the drug, but this effect was weaker.
Table 4. Apparent solubility of bergenin and BPC in water at 25 °C. n=3.
| Sample | Apparent solubility (mg/mL) |
Mean±SD | ||
|---|---|---|---|---|
| 1 | 2 | 3 | ||
| Bergenin | 1.35 | 1.39 | 1.36 | 1.37±0.02 |
| Physical mixture | 1.55 | 1.46 | 1.36 | 1.46±0.08 |
| BPC | 10.38 | 8.96 | 9.55 | 9.63±0.58 |
Table 5. Apparent solubility of bergenin and BPC in n-octanol at 25 °C. n=3.
| Sample | Apparent solubility (mg/mL) |
Mean±SD | ||
|---|---|---|---|---|
| 1 | 2 | 3 | ||
| Bergenin | 0.71 | 0.70 | 0.74 | 0.72±0.02 |
| Physical mixture | 1.15 | 1.17 | 1.13 | 1.15±0.02 |
| BPC | 135.40 | 116.06 | 133.73 | 128.39±8.75 |
Hygroscopicity studies
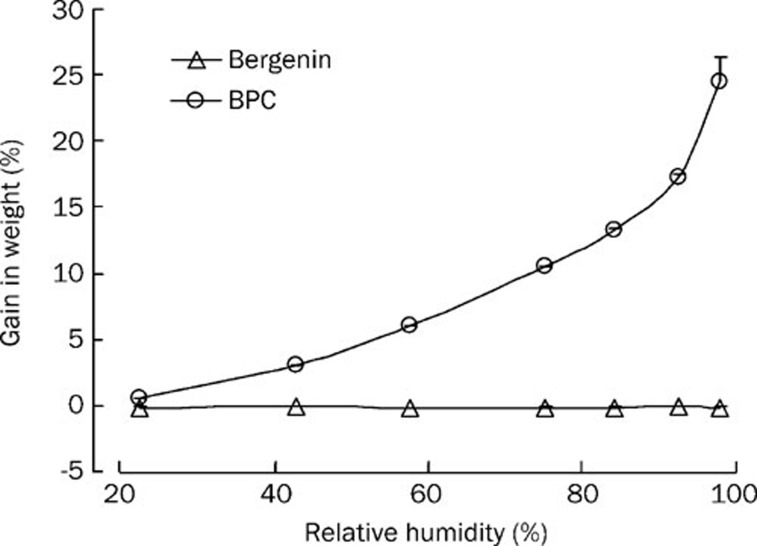
In our experiments, we found that BPC could absorb moisture in the air and become viscous. Little information was available about this aspect, so the critical relative humidity (CRH) was investigated. The weight increases of bergenin stored at 22.45%–98.00% RH (25 °C) are shown in Figure 10. It was demonstrated that the bulk drug gained weight very slightly (-0.03%–0.19% w/w), which suggested a good stability of bergenin in response to moisture during formulation and storage. When the drug was formed into the complex, the hygroscopicity was stronger. The CRH was about 80% at 25 °C, suggesting that BPC should be stored under relatively dry conditions (RH<80%).
Figure 10.
Moisture adsorption curve of bergenin and BPC.
Pharmacokinetic study in rats
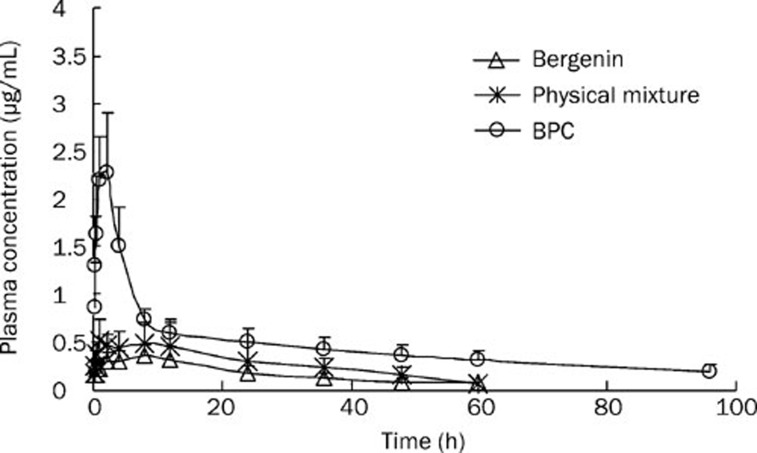
After administration of a single dose (300.0 mg/kg) of bergenin, the physical mixture and BPC to rats, the plasma bergenin levels were analyzed over a 60 h period. The mean plasma concentration-time profiles are shown in Figure 11, and the pharmacokinetic parameters calculated from the data are summarized in Table 6. The concentration–time profiles were best described as a two-compartment open model and a biphasic phenomenon, with a rapid absorption followed by a slower elimination phase. As seen in the plasma curves, both the physical mixture and BPC showed higher plasma levels than free bergenin. For BPC, the AUC0→∞ value was 53.17±11.81 μg·h/mL, and the relative bioavailability increased significantly to 439% of the control group. The Cmax value (2.87±1.29 μg/mL) was almost 6.52 times that of bergenin (0.44±0.06 μg·h/mL). When the physical mixture was administered, a 1.56-fold higher AUC0→∞ (18.91±8.20 μg·h/mL) and 1.66-fold higher Cmax (0.73±0.12 μg/mL) were observed compared to the control group.
Figure 11.
Plasma concentration profiles of bergenin in rat after oral administration of bergenin alone, physical mixture and BPC (equivalent to 300.0 mg/kg of bergenin). n=5. Mean±SD.
Table 6. Main pharmacokinetic parameters of free bergenin (300.0 mg/kg), physical mixture and BPC (equivalent to 300.0 mg/kg of free bergenin) in rats after oral administration. n=5. Mean±SD.
| Parameter | Bergenin | Physical mixture | BPC |
|---|---|---|---|
| t1/2α (h) | 9.16±3.66 | 7.98±3.16 | 1.12±0.16 |
| t1/2β (h) | 40.78±19.63 | 20.74±10.84 | 51.73±8.61 |
| MRT0←t (h) | 21.31±1.70 | 21.83±2.66 | 30.30±4.95 |
| Cmax (μg/mL) | 0.44±0.06 | 0.73±0.12 | 2.87±1.29 |
| AUC0←∞ (μg·h/mL) | 12.11±3.51 | 18.91±8.20 | 53.17±11.81 |
Discussion
In recent years, it has been reported that some poorly soluble drugs combined with phospholipids could result in an increase of oral bioavailability and/or improvement of the biological effects, such as silybin, curcumin and puerarin18, 19, 20. However, detailed information about the preparation of these complexes is limited. Peng et al used a central composite design approach for the optimization of ursodeoxycholic acid-phospholipid complex (UDCA). The yield (%) of UDCA present as a complex was the unique evaluation index for the preparation21. However, the content of drug in the complex that determines the pharmacologic action is another key factor and should not be neglected. In our experiment, both the combination percentage and content of the drug were taken into consideration. The spherical symmetric design-response surface methodology constitutes an alternative approach because it offers the possibility of investigating a high number of variables at different levels, while performing only a limited number of experiments22. In the experimental design of the spherical symmetric design-response surface methodology, the preliminary studies were investigated in detail. Organic solvents like chloroform, diethyl ether, acetone, methylenechloride, tetrahydrofuran, acetic ether, methanol and ethanol were investigated. A high combination percentage was achieved when methanol and ethanol were used. Considering that ethanol could be removed easily and is less harmful to the environment and human body compared with other solvents, it was used as the reaction medium. When the drug-to-phospholipids ratio was lower than 0.4, the resultant materials appeared viscous. When the ratio was more than 1.2, crystals of bergenin could be observed in SEM photographs, and the combination percentage was low (these results were not shown).
In the literature, researchers have demonstrated that phospholipid complexes are not new chemical compounds or simple physical mixtures. Drugs and phospholipids should have some interactions, such as hydrogen bonding or van der Waals interactions, when they form complexes18, 23, 24. We performed some experiments to prove this point. In the structure of bergenin and the phospholipids, there were no chemical groups that could react with each other under our preparation conditions. Thus, it is hard for them to form a new substance. TLC was performed in order to determine whether a new substance was formed. In the chromatogram, no new spot was found. The result was further proven by UV and HPLC analyses. The chromatographic behavior of BPC was the same as bergenin, and no new peaks were found. This indicated that no new substance was formed in the preparation. However, the BPC showed different physical properties from bergenin and the physical mixture, such as increased solubility, different morphological characteristics and stronger hygroscopicity. Some interactions might exist between bergenin and phospholipids. In order to clarify the interactions, Fourier transform infrared spectral (FT-IR) analysis was performed. From the FT-IR spectra, the hydrogen bonds in BPC were different from the hydrogen bonds in either bergenin or the phospholipids. There are carbonyl groups belonging to phospholipids that allow the formation of hydrogen bonds with the phenolic hydroxyl groups of bergenin. This means that, when BPC was prepared, intermolecular coupling interactions changed and absorption bands attributed to the vibration of hydrogen-bonded carbonyl groups were observed in the FT-IR spectra. With the hydrogen bonds between the molecules gone, the crystal shape of bergenin disappeared (from SEM photographs), and the sharp melting peak of bergenin was absent in DSC thermograms. The results of the X-ray diffraction studies also confirmed that in the phospholipids complex, bergenin was either molecularly dispersed or present as an amorphous form.
Phospholipids are an important component of cell membranes, having low toxicity and good biocompatibility. Due to their surface-active properties, phospholipids are commonly used as solubilizers or absorption enhancers to increase the permeability of some drugs. In the present study, the relative bioavailability of bergenin was significantly enhanced when it was administered as a phospholipid complex. In order to explore whether the enhanced absorption was the effect of phospholipids, a physical mixture of the drug and phospholipids was investigated and compared with the complex. The results showed that phospholipids could enhance both the Cmax and relative bioavailability of bergenin, but the effect was weaker than in BPC (P<0.05). It indicated that BPC could markedly improve the oral absorption of bergenin, and not just through the action of phospholipids. Small particle size, good solubility and permeability may be the main reasons for the improved absorption.
In conclusion, the preparation of BPC was optimized using the spherical symmetric design-response surface methodology by fitting a quadratic model to the response data. The experimental values of the BPC prepared under the optimum conditions were close to the predicted values and had a low percentage bias. The physicochemical properties and pharmacokinetic characteristics of BPC in rats were explored. Our results indicate that BPC has greatly enhanced solubility and improved oral bioavailability compared to bergenin and is more suitable for oral administration. However, the detailed mechanism of BPC oral absorption needs further investigation.
Author contribution
Xuan QIN, Yuan HUANG designed the research; Xuan QIN, Yang YANG, Ting-ting FAN and Tao GONG carried out laboratory experiments; and Xuan QIN, Yuan HUANG and Xiao-ning ZHANG analyzed data and wrote the paper.
Acknowledgments
The research described above was supported by the National Basic Research Program of China (973 program, No 2009CB903301).
References
- Nazir N, Koul S, Qurishi MA, Taneja SC, Ahmad SF, Bani S. Immunomodulatory effect of bergenin and norbergenin against adjuvant-induced arthritis-a flow cytometric study. J Ethnopharmacol. 2007;112:401–5. doi: 10.1016/j.jep.2007.02.023. [DOI] [PubMed] [Google Scholar]
- Ye YP, Sun HX, Pan YJ. Bergenin monohydrate from the rhizomae of Astilbe chinensis. Acta Crystallogr C. 2004;60:397–8. doi: 10.1107/S0108270104008364. [DOI] [PubMed] [Google Scholar]
- Wang G, Ma BJ. Overview of recent progress on bergenin. Anhui Zhong Yi Xue Yuan Xue Bao. 2002;21:59–62. [Google Scholar]
- Lim HK, Kim HS, Choi HS, Choi J, Kim SH, Chang MJ. Effects of bergenin, the major constituent of Mallotus japonicus against D-galactosamine-induced hepatotoxicity in rats. Pharmacology. 2001;63:71–5. doi: 10.1159/000056115. [DOI] [PubMed] [Google Scholar]
- Piacente S, Pizza C, Tommasi N, Mahmood N. Constituents of Ardisia japonica and their in vitro anti-HIV activity. J Nat Prod. 1996;59:565–9. doi: 10.1021/np960074h. [DOI] [PubMed] [Google Scholar]
- Takahashi H, Kosaka M, Watanabe Y, Nakade K, Fukuyama Y. Synthesis and neuroprotective activity of bergenin derivatives with antioxidant activity. Bioorg Med Chem. 2003;11:1781–8. doi: 10.1016/s0968-0896(02)00666-1. [DOI] [PubMed] [Google Scholar]
- Jiangsu New Medical College. Traditional MedicineShanghai, China: Shanghai People's Publishing House1999. p2359
- Lipkaa E, Amidonb GL. Setting bioequivalence requirements for drug development based on preclinical data: optimizing oral drug delivery systems. J Control Rel. 1999;62:41–9. doi: 10.1016/s0168-3659(99)00022-x. [DOI] [PubMed] [Google Scholar]
- Dan Z, Xuan Q, Zhi RZ, Yuan H. Physicochemical properties of bergenin. Pharmazie. 2008;63:366–71. [PubMed] [Google Scholar]
- Cyril R, Olivier RM. Synthesis of bergenin-related natural products by way of an intramolecular C-glycosylation reaction. Tetrahedron-Asymmetr. 2000;11:409–12. [Google Scholar]
- Wang G, Liu JK, Ma BJ.The acetylate of bergenin and its applicationPR China Patent 2006; 200510010970.0.
- Li XD, Lu SL, He B.The preparation of bergenin compositae pillsPR China Patent 2005; 200410040660.9.
- Li J.The preparation of bergenin compositae soft capsulesPR China Patent 2005; 200410078846.3.
- Guan JY, Sun DJ, Wu GL. The study of bergenin's inclusion complex. Zhong Cheng Yao. 1991;13:4–5. [Google Scholar]
- Stokes RH. Standard solutions for humidity control at 25 °C. Ind Eng Chem. 1949;41:2013. [Google Scholar]
- Xuan Q, Dan Z, Zhi RZ, Yuan H. Determination of bergenin in rat plasma by high-performance liquid chromatography. Pharmazie. 2007;62:323–6. [PubMed] [Google Scholar]
- Chinese Pharmacopoeia Commission. The Pharmacopoeia of the People's Republic of China 2005; part I: 278.
- Xiao YY, Song YM, Chen ZP, Ping QN. The preparation of silybin–phospholipid complex and the study on its pharmacokinetics in rats. Int J Pharm. 2006;307:77–82. doi: 10.1016/j.ijpharm.2005.10.001. [DOI] [PubMed] [Google Scholar]
- Kuntal M, Kakali M, Arunava G, Bishnu PS, Pulok KM. Curcumin–phospholipid complex: Preparation, therapeutic evaluation and pharmacokinetic study in rats. Int J Pharm. 2007;330:155–63. doi: 10.1016/j.ijpharm.2006.09.025. [DOI] [PubMed] [Google Scholar]
- Li Y, Pan WS, Chen SL, Xu HX, Yang DJ, Chan ASC. Pharmacokinetic, tissue distribution, and excretion of puerarin and puerarin-phospholipid complex in rats. Drug Dev Ind Pharm. 2006;32:413–22. doi: 10.1080/03639040600559123. [DOI] [PubMed] [Google Scholar]
- Peng FY, Zhang WJ, Yuan HL, Yang M, Zhu WF, Cai PL, et al. Process optimization, characterization and pharmacokinetic evaluation in rats of ursodeoxycholic acid–phospholipid complex. AAPS PharmSciTech. 2008;9:322–9. doi: 10.1208/s12249-008-9040-1. [DOI] [PMC free article] [PubMed] [Google Scholar]
- Wu W, Cui GH. Central composite design-response surface methodology and its application in pharmaceutics. Foreign Med Sci Sect Pharm. 2000;27:292–8. [Google Scholar]
- Venema FR, Weringa WD. The interactions of phospholipid vesicles with some anti-inflammatory agents. J Colloid Interface Sci. 1988;125:484–500. [Google Scholar]
- Peng FY, Hai LY, Huan X, Xiao HX, Ming Y, et al. Preparation, characterization, and bioavailability of ursodeoxycholic acid-phospholipid complex in vivo. Drug Dev Ind Pharm. 2008;34:708–18. doi: 10.1080/03639040701842477. [DOI] [PubMed] [Google Scholar]


