Abstract
Complications arising from abnormal immune responses are the major causes of mortality and morbidity in diabetic patients. CD4+CD25+ T regulatory cells (Tregs) play pivotal roles in controlling immune homeostasis, immunity and tolerance. The effect of hyperglycemia on CD4+CD25+ Tregs has not yet been addressed. Here we used streptozotocin (STZ)-induced diabetic mice to study the effects of long-term hyperglycemia on CD4+CD25+ Tregs in vivo. Four months after the onset of diabetes, the frequency of CD4+CD25+Foxp3+ T regulatory cells was significantly elevated in the spleen, peripheral blood lymphocytes (PBLs), peripheral lymph nodes (pLNs) and mesenteric LNs (mLNs). CD4+CD25+ Tregs obtained from mice with diabetes displayed defective immunosuppressive functions and an activated/memory phenotype. Insulin administration rescued these changes in the CD4+CD25+ Tregs of diabetic mice. The percentage of thymic CD4+CD25+ naturally occurring Tregs (nTregs) and peripheral CD4+Helios+Foxp3+ nTregs were markedly enhanced in diabetic mice, indicating that thymic output contributed to the increased frequency of peripheral CD4+CD25+ Tregs in diabetic mice. In an in vitro assay in which Tregs were induced from CD4+CD25− T cells by transforming growth factor (TGF)-β, high glucose enhanced the efficiency of CD4+CD25+Foxp3+ inducible Tregs (iTregs) induction. In addition, CD4+CD25− T cells from diabetic mice were more susceptible to CD4+CD25+Foxp3+ iTreg differentiation than those cells from control mice. These data, together with the enhanced frequency of CD4+Helios−Foxp3+ iTregs in the periphery of mice with diabetes, indicate that enhanced CD4+CD25+Foxp3+ iTreg induction also contributes to a peripheral increase in CD4+CD25+ Tregs in diabetic mice. Our data show that hyperglycemia may alter the frequency of CD4+CD25+Foxp3+ Tregs in mice, which may result in late-state immune dysfunction in patients with diabetes.
Keywords: CD4+CD25+Foxp3+ regulatory T cells, diabetes, hyperglycemia, immune disorder, mice
Introduction
Diabetic retinopathy, nephropathy, neuropathy and cardiovascular disease are complications that are major causes of mortality in patients with diabetes.1 Inflammatory and immunologic abnormalities are involved in both type 1 and type 2 diabetes (T1D and T2D), as well as their associated complications.2, 3 Hyperglycemic crises are associated with an elevation of counter-regulatory hormones and pro-inflammatory cytokines, markers of lipid peroxidation and oxidative stress. Patients with T2D and hyperglycemia have increased pro-inflammatory cytokines and activated innate immune cells and T cells, which are involved in cellular and/or humoral immune responses.4, 5, 6, 7
CD4+CD25+ T regulatory cells (Tregs) play pivotal roles in controlling immune balance and maintaining immune tolerance. There are two main subgroups of CD4+CD25+ Tregs: thymus-derived, naturally occurring CD4+CD25+ nTregs and peripherally induced CD4+CD25+Foxp3+ iTregs.8, 9 CD4+CD25+ Tregs constitutively express CD25 and Foxp3, as well as high levels of glucocorticoid-induced tumor-necrosis factor receptor (GITR) and intracellular cytotoxic T lymphocyte-associated antigen 4 (CTLA-4). Although researchers have focused on the role of CD4+CD25+ Tregs in the progression of diabetes, the frequency and function of CD4+CD25+ CD4+CD25+Foxp3+ in non-obese diabetic (NOD) mice or patients with T1D is still controversial at present. Some groups have reported that the frequency of CD4+CD25+Foxp3+ Tregs is decreased in diabetic NOD mice and patients with diabetes,10, 11, 12 whereas others have found an increase in Foxp3 mRNA or no change in the frequency of CD4+CD25+ Tregs at the onset of diabetes.13, 14, 15 The function of CD4+CD25+ Tregs was decreased or remained unchanged in patients with T1D and diabetic NOD mice.14, 16, 17, 18
T1D is a complex disease caused by environmental and genetic factors. Genetic studies have identified several genetic disease variants and a longer list of putative genetic loci associated with T1D.19 It is unclear whether hyperglycemia and/or genetic regulation caused the changes in CD4+CD25+ Tregs observed in the spontaneous diabetes model, NOD mice or diabetic patients. NOD mice are potentially immune deficient due to intrinsic defects in their genome. In addition to autoimmune diabetes, they are prone to developing multi-organ autoimmune diseases such as autoimmune sialitis, thyroiditis and peripheral polyneuropathy.20, 21, 22 Therefore, NOD mice are not suitable for studying the direct effect of hyperglycemia or other diabetes-induced alterations on the immune system and immunity. In this study, in order to address whether diabetes itself can impact the level and function of CD4+CD25+ Tregs in vivo, we used streptozotocin (STZ)-induced diabetic mice. Surprisingly, the frequency of CD4+CD25+Foxp3+ Tregs was significantly increased in the periphery, but these cells were functionally deficient 4 months after the onset of diabetes. Further studies demonstrated that the enhanced percentage of CD4+CD25+Foxp3+ Tregs in the periphery was due to an increased output from the thymus and an increased sensitivity of peripheral CD4+CD25− effector T cells (Teffs) to become CD4+CD25+Foxp3+ iTregs. Furthermore, treatment with insulin significantly reversed the diabetes-induced alteration in frequency and function of CD4+CD25+Foxp3+ Tregs in mice. Therefore, it is important to control blood glucose levels to prevent immune disorders and their associated complications in patients with diabetes, which may have potential clinical significance in preventing complications from diabetes.
Materials and methods
Mice
Six- to eight-week-old C57BL/6 (B6, H-2b) mice and BALB/c (H-2d) mice were purchased from the Beijing Experimental Animal Center (Beijing, China). Foxp3- green fluorescent protein (GFP) knock-in mice (H-2d) were kindly provided by Dr Bin Wang (Chinese University of Agriculture). All mice were maintained in a specific, pathogen-free facility and were housed in microisolator cages containing sterilized food, bedding and water. All experimental manipulations were performed in accordance with the Institutional Guidelines for the Care and Use of Laboratory Animals.
Diabetes induction, monitoring and insulin treatment
Six- to eight-week-old male C57BL/6 (B6) mice were injected intraperitoneally for 5 consecutive days with 40 mg/kg STZ (Sigma-Aldrich, St Louis, MO, USA) in citrate buffer (pH 4.5) to induce diabetes. Control B6 mice received vehicle buffer alone. Day 1 was defined as the day of the first STZ injection. Insulin injections (10 U/kg, twice a day) were started 1 week after STZ administration. Blood samples were obtained from the tail vein to detect glucose levels using a glucose meter (Hypoguard, Minneapolis, MN, USA). Mice with a glucose level of greater than 11 mM for 2 consecutive weeks were considered to be diabetic. Glucose levels were monitored in diabetic mice twice a month following the initial diagnosis of diabetes.
Monoclonal antibodies (mAbs) and chemical reagents
The following mAbs were purchased from eBiosciences (San Diego, CA, USA): FITC-anti-mCD4 mAb (RM4-5, rat IgG2a), PE-CY5-anti-mCD4 mAb (H129.19, rat IgG2a), PE-anti-mCD4 mAb (RM4-5, rat IgG2a), FITC-anti-mCD8a mAb (53-6.7, rat IgG2a), PE-anti-mCD8a mAb (53-6.7, rat IgG2a), FITC-anti-mCD25 mAb (7D4, rat IgM), PE-anti-mCD25 mAb (PC61.5, rat IgG1), PE-CY5-anti-mCD25 mAb (PC61.5, rat IgM), PE-anti-mCD44 mAb (IM7, rat IgG2b), PE-anti-mCD45RB mAb (16A, rat IgG2a), PE-anti-mCD62L mAb (SK11, rat IgG2a), PE-anti-mGITR mAb (DTA-1, rat IgG2b), PE-anti-mCD152 mAb (BNI3, mouse IgG2a), PE-anti-mFoxp3 mAb (FJK-16s, rat IgG2a), FITC-anti-mIFN mAb (XMG1.2, rat IgG1), FITC-labeled rat IgG2a and PE-labeled rat IgG2a. The following mAbs were purchased from Biolegend (San Diego, CA, USA): FITC-anti-h/mHelios mAb (22F6, hamster IgG), PE-anti-mIL-17A mAb (TC11-18H10.1, rat IgG1) and PE-anti-mIL-2 mAb (C15.6, rat IgG1). In addition, PE-anti-mCD8 mAb (53-6.7, rat IgG2a) and purified anti-mCD28 mAb (37.51) were obtained from BD Biosciences Pharmingen (San Diego, CA, USA) and mitomycin C (C15H18N4O5) was obtained from Kyowa Hakko Co., Ltd (Tokyo, Japan). Transforming growth factor (TGF)-β and purified anti-CD3 mAb were obtained from R&D Co., Ltd (Minneapolis, MN, USA). DELFIA proliferation kit was purchased from PerkinElmer Co., Ltd (Wellesley, MA, USA).
Flow cytometry (FCM) assay
Approximately 30 000 cells (thymocytes, peripheral blood lymphocytes, splenocytes or lymphocytes) were freshly prepared and incubated with 2.4G2 to block FcRs, and then incubated with the indicated mAbs for 30 min at 4 °C in the dark. Cells were washed with FCM buffer (phosphate-buffered saline, pH 7.2, containing 0.1% NaN3 and 0.5% bovine serum albumin). For intracellular staining of Foxp3 and CTLA-4, cells were first stained for surface molecules and subsequently fixed, permeabilized and stained with the corresponding mAbs (eBioscience). Cells were assayed using a Beckman Coulter FCM (Beckman Coulter, Fullerton, CA, USA), and data were analyzed with CXP v2.2 software (Beckman Coulter).
CD4+CD25− Teffs and CD4+CD25+ Treg purification
CD4+CD25− Teffs and CD4+CD25+ Tregs were isolated using a magnetic-activated cell sorting CD4+ T-cell isolation kit and FCM sorting. According to the manufacturer's instruction, erythrocyte-depleted splenocytes from control and diabetic mice were suspended in phosphate-buffered saline containing 0.5% bovine serum albumin and 2 mM EDTA (pH 7.2) and then incubated with a biotin-antibody cocktail against CD8 (Ly2), CD11b (membrane-activated complex 1), CD45R (B220), CD49B (DX5) and Ter-119 for 20 min at 4 °C. Microbead-conjugated, antibiotin mAbs (Clone Bio318E7.2) was then added to deplete non-CD4+ T cells. The cell suspension was loaded on an LD column placed in the magnetic field of a magnetic-activated cell-sorting separator to allow unlabeled CD4+ T cells to run through the colomn. For further isolation of CD4+CD25− Teffs and CD4+CD25+ Tregs, CD4+ T cells were stained with PE-labeled CD25 mAbs and then sorted by FCM. The purity of sorted CD4+CD25− Teffs and CD4+CD25+ Tregs was always >95%.
Mixed lymphocyte reaction
Enriched CD4+CD25+ Tregs were isolated from control and diabetic mice as described above. CD4+CD25− Teffs from control mice were used as responder T cells. BALB/c splenocytes, pretreated with 25 µg/ml mitomycin C at 37 °C for 30 min, were used as allogeneic stimulator cells. In general, 2×10⁵ responder cells and 2×10⁵ stimulator cells in RPMI-1640 medium supplemented with 10% fetal calf serum were added per well to 96-well flat-bottomed plates. The indicated numbers of CD4+CD25+ Tregs were subsequently added to each well. Cells were cultured in complete medium at 37 °C and 5% CO2 for 48 h, and 100 µM BrdU was added to each well for additional 24 h. The labeling medium was then thoroughly removed and the cells were fixed. Cells were incubated with 0.5 µg/ml anti-BrdU for 16–18 h and washed thoroughly. Eu flurorescence was measured using a time-resolved fluorometer (BioTek, Winooski, VT, USA). Values are expressed as the Eu value from triplicate wells.
In vitro immunosuppression assays
Purified CD4+CD25− Teffs (2×10⁵) were activated by culturing in the presence or plate bound anti-CD3 mAbs (2 µg/ml) and soluble anti-CD28 mAbs (1 µg/ml). The indicated numbers of CD4+CD25+ Tregs were subsequently added to each well. After the 24-h incubation, 0.5 µg/ml anti-BrdU was added to each well for additional 16–18 h. Eu flurorescence was measured using a time-resolved fluorometer as describe above.
CD4+CD25+ Treg induction in vitro
CD4+CD25− T cells from Foxp3-GFP knock-in mice or control and diabetic mice were isolated as describe above. CD4+CD25− T cells (2×10⁵) were cultured in the presence of plate-bound anti-CD3 mAbs (2 µg/ml) and soluble anti-CD28 mAbs (1 µg/ml) with or without TGF-β (5 ng/ml). At indicated time points, cells were collected and stained for Foxp3 as describe above.
Statistical analysis
Results were expressed as mean±s.d. values. Statistical analysis was performed using Student's t-test for all experiments. Statistical significance was assigned for P values <0.05.
Results
The proportion of CD4+CD25+Foxp3+ Tregs was significantly increased in the periphery of mice with STZ-induced diabetes for 4 months
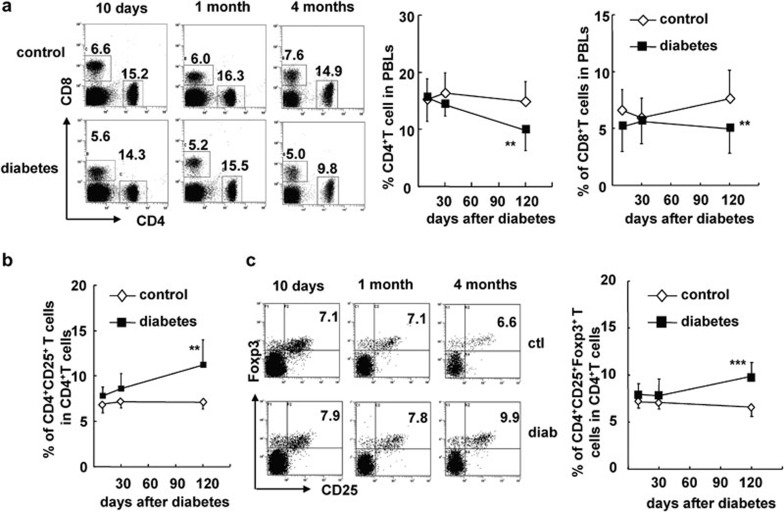
In order to investigate the effect of hyperglycemia or diabetes on CD4+CD25+ Tregs in mice, we used a STZ-induced mouse model of diabetes in instead of NOD mice. Injection of STZ-induced significant, long-term hyperglycemia in B6 mice (>11 mM; Supplementary Figure 1). To determine the dynamic changes in CD4+CD25+ Tregs that occur during diabetes progression, we examined the balance of CD4+CD25+Foxp3+ Tregs and CD4+CD25− Teffs in peripheral blood lymphocytes (PBLs), the spleen, peripheral lymph nodes (pLNs) and mesenteric LNs (mLNs) 10 days, 1 month and 4 months after the onset of diabetes. The fractions of both CD4+ T cells and CD8+ T cells in PBLs gradually decreased in STZ-induced diabetic mice (P<0.01; Figure 1a). However, the frequency of CD4+CD25+ Tregs, out of the total CD4+ T-cell population, was significantly increased by 4 months after the onset of diabetes (P<0.01; Figure 1b), whereas the proportions of CD4+CD25+ Tregs in the periphery were still normal at the early time points. To further characterize CD4+CD25+ Tregs, we used Foxp3 as a marker for CD4+CD25+ Tregs because it plays a critical role in theirdevelopment. The percentage of CD4+CD25+Foxp3+ Tregs, out of total CD4+ T cells, was significantly increased only at 4 months after the onset of diabetes (P<0.01; Figure 1c).
Figure 1.
The proportion of CD4+CD25+Foxp3+ Tregs was significantly increased in the peripheral blood of mice with STZ-induced diabetes for 4 months. PBLs of control and diabetic mice were collected at 10 days, 1 month and 4 months after onset of diabetes and stained for CD4, CD8, CD25 and Foxp3. (a) Representative FACS staining for CD4 and CD8 on PBLs as well as the percentages of CD4+ T cells (middle) and CD8+ T cells (right) in PBLs of control and diabetic mice at indicated time points. (b) The percentage of CD4+CD25+ T cells out of total CD4+ T cells in PBLs of control and diabetic mice. (c) Representative FACS staining for CD25 and Foxp3 on gated CD4+ T cells and the percentage of CD4+CD25+Foxp3+ Tregs out of total CD4+ T cells in PBLs of control and diabetic mice (right). Data are shown as mean±s.d. (n=10), for one representative out of three independent experiments. **P<0.01 and ***P<0.001, compared with the identical control mice. FACS, fluorescence-activated cell sorting; PBL, peripheral blood lymphocyte; STZ, streptozotocin; Treg, T regulatory cell.
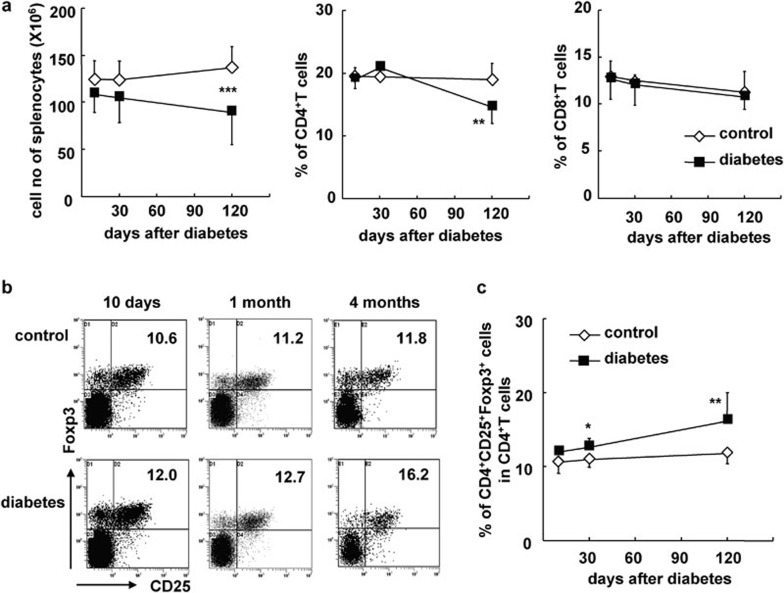
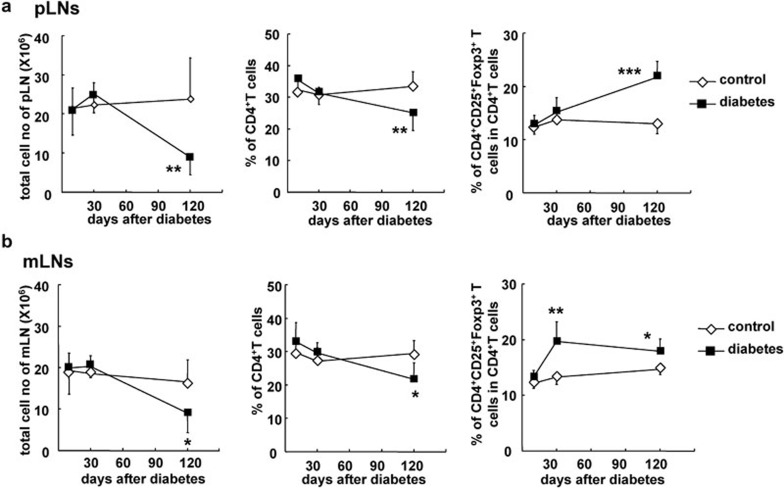
As shown in Figure 2, the total number of splenocytes and the percentage of CD4+ T cells but not CD8+ T cells was decreased in diabetic B6 mice by 4 months (P<0.001, and P<0.01, respectively; Figure 2b). However, the percentage of CD4+CD25+Foxp3+ Tregs among CD4+ T cells was significantly increased in the spleens of diabetic mice at 1 and 4 months (P<0.05 and P<0.01, respectively; Figure 2b and c). Consistent with the changes seen in PBLs and splenocytes, cell numbers were decreased and the percentages of CD4+CD25+Foxp3+ Tregs among CD4+ T cells were markedly elevated in the pLNs and mLNs of diabetic mice months after the onset of diabetes (P<0.001 and P<0.05, respectively; Figure 3a and b). It should be noted that the percentage of CD4+CD25+Foxp3+ Tregs out of total CD4+ T cells was increased as early as 1 month after the onset of diabetes, suggesting that mLNs are likely to be more sensitive to hyperglycemia than other peripheral immune tissues.
Figure 2.
The proportion of CD4+CD25+Foxp3+ Tregs was significantly increased in the spleens of mice with diabetes for 4 months. Splenocytes were freshly prepared at different time points after the onset of diabetes and stained for CD4, CD8, CD25 and Foxp3. (a) Absolute cell numbers as well as the percentages of CD4+ T cells or CD8+ T cells in the splenocytes of control and diabetic mice at indicated time points. (b) Representative FACS stain for CD25 and Foxp3 on gated CD4+ T cells in the spleen. (c) The percentage of CD4+CD25+Foxp3+ Tregs out of total CD4+ T cells in splenocytes at indicated time points. Data are shown as mean±s.d. (n=10), for one representative out of three independent experiments. *P<0.05, **P<0.01 and ***P<0.001, compared with the identical control mice. FACS, fluorescence-activated cell sorting; Treg, T regulatory cell.
Figure 3.
The proportion of CD4+CD25+Foxp3+ Tregs was increased in the pLNs and mLNs of diabetic mice. Lymphocytes from pLNs and mLNs were freshly prepared at 10 days, 1 month and 4 months after the onset of diabetes and stained for CD4, CD8, CD25 and Foxp3. (a) Absolute cell numbers, the percentage of CD4+ T cells and the percentage of CD4+CD25+Foxp3+ Tregs out of total CD4+ T cells in the pLNs of control and diabetic mice at indicated time points. (b) The total cell numbers, the percentage of CD4+ T cells and the percentage of CD4+CD25+Foxp3+ Tregs out of the total CD4+ T cells in the mLNs of control and diabetic mice at indicated time points. Data are shown as mean±s.d. (n=10), for one representative out of three independent experiments. *P<0.05, **P<0.01 and ***P<0.001, compared with the control mice. mLN, mesenteric lymph node; pLN, peripheral lymph node; Treg, T regulatory cell.
The total number of CD4+CD25+Foxp3+ Treg cells in the spleen, pLNs and mLNs of mice with STZ-induced diabetes for 4 months was significantly decreased compared with the control mice (P<0.05 or P<0.01; Supplementary Figure 2), due to a decrease in the total number of all cells, including CD4+ T cells, in these tissues. Thus, the increased percentage of CD4+CD25+Foxp3+ Tregs among CD4+ T cells in diabetic mice indicates that CD4+CD25+Foxp3+ Tregs may be more resistant to hyperglycemia or other changes than CD4+CD25− Teffs, although both subsets were decreased in diabetic mice.
CD4+CD25+ Tregs displayed an activated/memory phenotype in the periphery of STZ-induced diabetic mice
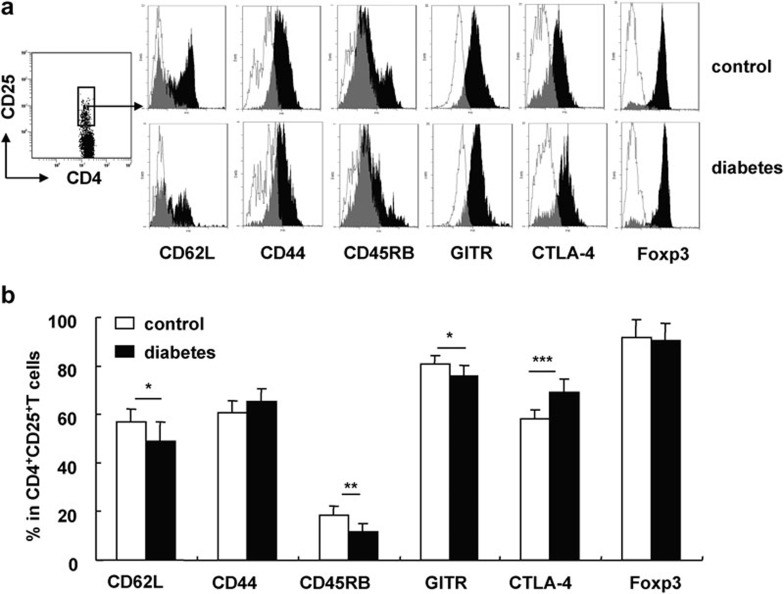
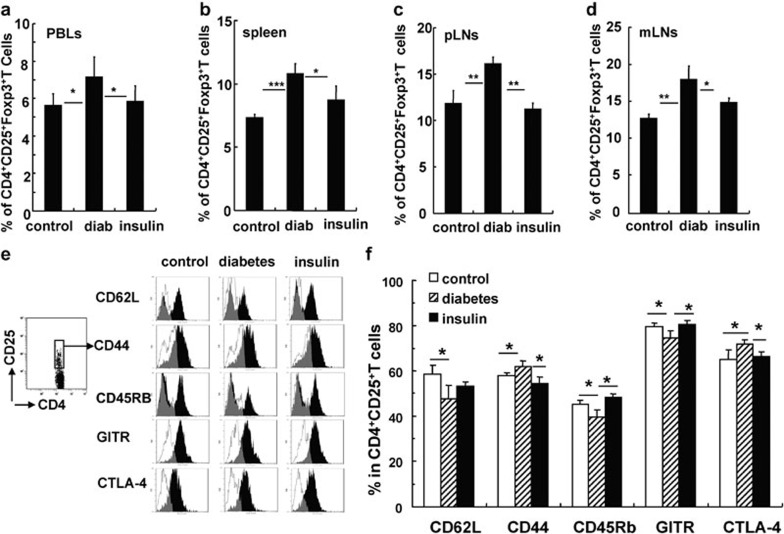
To determine the characteristics of CD4+CD25+ Tregs in B6 mice with long-term STZ-induced diabetes, we obtained CD4+CD25+ Tregs from the spleens of these mice and evaluated the expression of CD62L, CD44, CD45RB and GITR, as well as intracellular CTLA-4 and Foxp3 expression by fluorescence-activated cell sorting. Naive T cells express high levels of CD62L and CD45RB and low levels of CD44, whereas activated/memory T cells express high levels of CD44 and low levels of CD62L and CD45RB. These molecules also play important roles in CD4+CD25+ Tregs. As shown in Figure 4, we found identical expression of Foxp3 on CD4+CD25+ Tregs from both STZ-induced diabetic and control mice. However, compared with control mice, the CD4+CD25+ Tregs in diabetic mice express a lower percentage of CD62L, CD45RB and GITR and a higher percentage of intracellular CTLA-4. This indicates that CD4+CD25+ Tregs in diabetic mice are of an activated/memory phenotype. We also evaluated the expression of these molecules on CD4+CD25+ Tregs in pLNs and obtained similar results (data not shown).
Figure 4.
The phenotype of CD4+CD25+ Tregs was altered in mice with STZ-induced diabetes for 4 months. Splenocytes from control and diabetic mice were collected 4 months after the onset of diabetes and stained for CD4, CD25 and other surface markers including CD62L, CD45RB, CD44 and GITR. Intracellular staining of CTLA-4 and Foxp3 was performed after the staining of the surface markers. (a) One representative FACS stain for each of the indicated molecules gated on CD4+CD25+ T cells. The open histograms represent staining of cells from the control mice, while the black filled histograms represent staining of cells from the diabetic mice. (b) The percentages of CD62L+, CD44+, CD45RB+, GITR+ or Foxp3+ cells out of total CD4+CD25+ T cells in control and diabetic mice. Data are shown as mean±s.d. (n=8), for one representative out of two independent experiments. *P<0.05, **P<0.01 and ***P<0.001, compared with the control mice. CTLA-4, cytotoxic T lymphocyte-associated antigen 4; FACS, fluorescence-activated cell sorting; GITR, glucocorticoid-induced tumor-necrosis factor receptor; STZ, streptozotocin; Treg, T regulatory cell.
The immunosuppressive function of CD4+CD25+ Tregs is reduced in mice with STZ-induced diabetes for 4 months
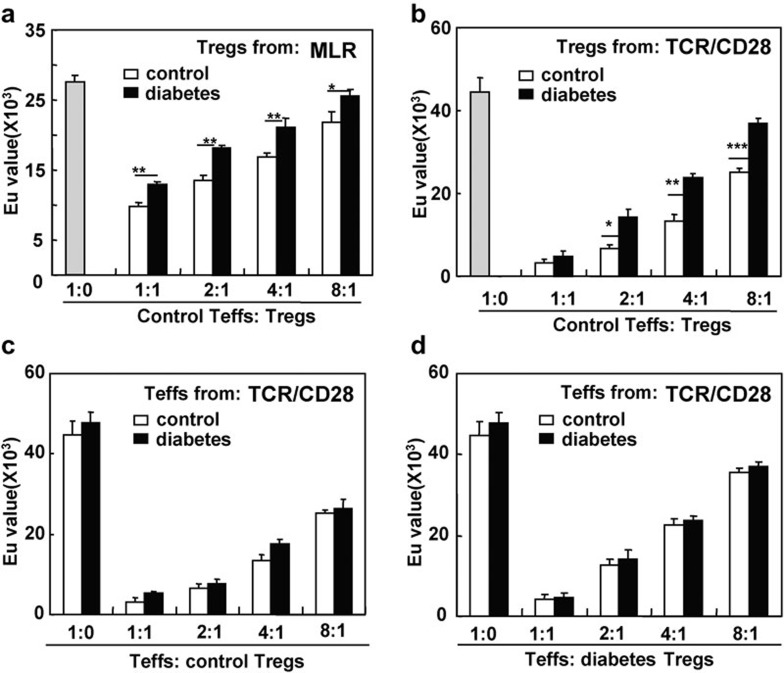
The immunosuppressive capability of CD4+CD25+ Tregs in mice with long-term diabetes was detected in two suppression assays. As shown in Figure 5a, CD4+CD25+ Tregs from control and diabetic B6 mice were functional and inhibited the response of CD4+CD25− Teffs to allogeneic antigens or anti-CD3/CD28 mAb stimulation in a dose-dependent manner. However, compared with control mice, the CD4+CD25+ Tregs from diabetic mice demonstrated a significantly reduced suppressive ability (P<0.05, P<0.01 and P<0.001, respectively; Figure 5a and b).
Figure 5.
The suppressive function of CD4+CD25+ Tregs was decreased in mice with diabetes for 4 months. Sorted splenic CD4+CD25+ Tregs and CD4+CD25− T cells from control and diabetic B6 mice were cocultured as described in the ‘Materials and methods' section. A DELFIA proliferation kit was used to assess cell proliferation. (a) CD4+CD25− T cells isolated from control B6 mice were used as responder cells and were cultured with mitomycin C-pretreated allogeneic BALB/c splenocytes in the presence of CD4+CD25+ Tregs from control and diabetic B6 mice at the indicated ratios. (b) CD4+CD25− T cells isolated from control B6 mice were stimulated with plate-bound anti-CD3 and soluble anti-CD28 mAbs in the presence of CD4+CD25+ Tregs from control and diabetic mice at the indicated ratios. (c) CD4+CD25− T responder cells from either control or diabetic mice were stimulated with plate-bound anti-CD3 and soluble anti-CD28 mAbs in the presence of CD4+CD25+ Tregs from control mice at the indicated ratios. (d) Responder cells from either control or diabetic mice were stimulated with plate-bound anti-CD3 and soluble anti-CD28 mAbs in the presence of CD4+CD25+ Tregs from diabetic mice at the indicated ratios. The gray column represents control responders without CD4+CD25+ Tregs. Data are shown as mean±s.d. (n=5), for one representative out of three independent experiments. *P<0.05, **P<0.01 and ***P<0.001, comparison was between the indicated groups. mAb, monoclonal antibody; MLR, mixed lymphocyte reaction; TCR, T-cell receptor; Teff, effector T cell; Treg, T regulatory cell.
Conversely, it was reported that Teffs in diabetic NOD mice were resistant to regulation by CD4+CD25+ Tregs.23 Therefore, we also compared the sensitivity of CD4+CD25− Teffs from control and STZ-induced diabetic mice to regulation by CD4+CD25+ Tregs. CD4+CD25− Teffs from control and diabetic mice were equally sensitive to inhibition by CD4+CD25+ Tregs regardless of whether the CD4+CD25+ Tregs were isolated from control mice or mice with long-term diabetes (Figure 5c and d). Thus, diabetes somehow altered the function of CD4+CD25+ Tregs but not CD4+CD25− Teffs.
Insulin administration reversed the changes in CD4+CD25+Foxp3+ Tregs induced by diabetes in mice with long-term STZ-induced diabetes
In order to elucidate the role of hyperglycemia in the changes of CD4+CD25+ Tregs in mice with long-term diabetes, we treated diabetic B6 mice with daily insulin injections to maintain blood glucose close to normal levels following the onset of diabetes (data not shown). Four months later, the percentage and phenotype of CD4+CD25+Foxp3+ Tregs were investigated. As shown in Figure 6, insulin administration reversed the effect of hyperglycemia on the proportion of CD4+CD25+Foxp3+ Tregs out of total CD4+ T cells in PBLs, splenocytes, pLNs and mLNs of diabetic mice (Figure 6a–d). The activation/memory status of CD4+CD25+Foxp3+ Tregs in diabetic mice was at least partially rescued by insulin injections (Figure 6e and f). Furthermore, CD4+CD25+Foxp3+ Tregs from insulin-treated, diabetic mice were better able to suppress ability of CD4+CD25− Teffs in immunosuppression assays (Supplementary Figure 3). These data indicate that hyperglycemia contributed to the frequency, phenotype and functional changes of CD4+CD25+Foxp3+ Tregs from mice with long-term STZ-induced diabetes.
Figure 6.
Insulin injections effectively reversed the changes observed in CD4+CD25+Foxp3+ Tregs obtained from mice with diabetes for 4 months. The mean percentage of CD4+CD25+Foxp3+ Tregs out of total CD4+ T cells in PBLs (a), the spleen (b), pLNs (c) and mLNs (d) from control and diabetic mice. (e) Representative FACS staining for the indicated molecules on gated CD4+CD25+ Tregs from control mice, diabetic mice and diabetic mice treated with insulin. (f) The percentage of indicated molecules among CD4+CD25+ Tregs in the spleen. Data are shown as mean±s.d. (n=6), for one representative out of two independent experiments. *P<0.05, **P<0.01 and ***P<0.001, comparison was among the indicated groups. CTLA-4, cytotoxic T lymphocyte-associated antigen 4; FACS, fluorescence-activated cell sorting; GITR, glucocorticoid-induced tumor-necrosis factor receptor; mLN, mesenteric lymph node; PBL, peripheral blood lymphocyte; pLN, peripheral lymph node; Treg, T regulatory cell.
Enhanced thymic nTreg output and peripheral iTregs contributed to the increased frequency of CD4+CD25+ Tregs in the periphery of mice with long-term diabetes
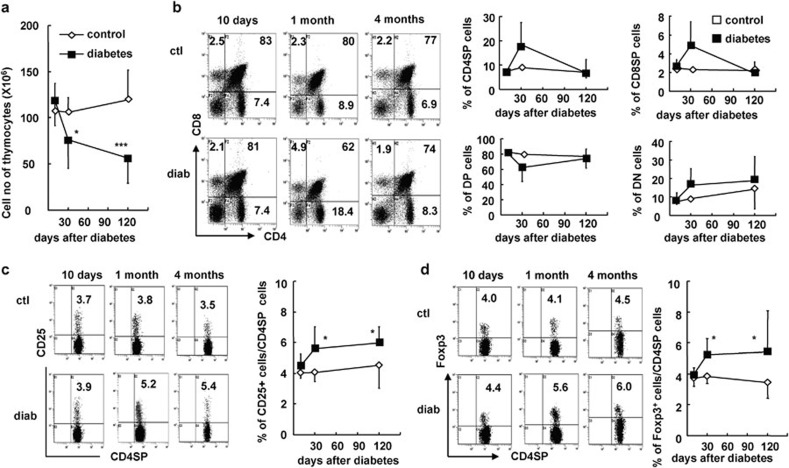
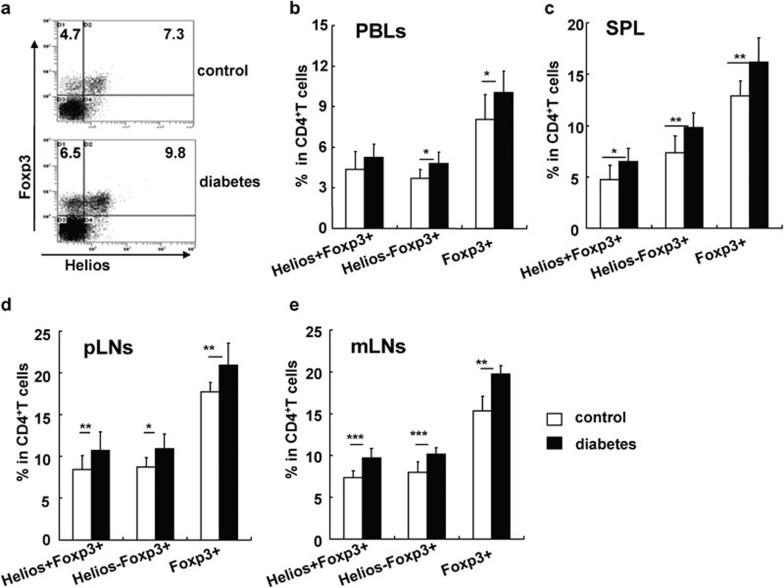
To determine whether the increase in peripheral CD4+CD25+Foxp3+ Tregs in mice with long-term STZ-induced diabetes is associated with thymic CD4+CD25+ nTreg development and/or peripheral induction of CD4+CD25+Foxp3+ iTregs, we investigated the dynamics of CD4+CD25+ Treg development in the thymus during diabetes progression. The total number of thymocytes was significantly decreased at 1 and 4 months after the onset of diabetes, respectively (P<0.05 and P<0.001; Figure 7a). However, there was no significant change in the percentages of CD4 single positive (CD4SP), CD8SP, CD4CD8 double positive and CD4CD8 double negative cells in the thymuses of diabetic mice (Figure 7b). Nevertheless, the proportions of CD25+ or Foxp3+ nTregs among all CD4SP cells were significantly increased beginning 1 month after the onset of diabetes (P<0.05; Figure 7c and d). Helios is a newly discovered molecule that is mainly expressed on thymus-produced CD4+CD25+ nTregs in mice and humans.24, 25 Consistent with the changes of CD4+CD25+ Tregs observed in the thymus, the frequency of CD4+Helios+Foxp3+ nTregs was significantly enhanced in PBLs, the spleen, pLNs and mLNs in mice that had STZ-induced diabetes for 4 months (P<0.05, P<0.01 and P<0.001, respectively; Figure 8). Conversely, the frequency of CD4+Helios−Foxp3+ iTregs, which may represent peripherally induced iTregs, was significantly enhanced in the spleen, pLNs and mLNs of diabetic mice (P<0.05, P<0.01 and P<0.001, respectively; Figure 8). These data collectively indicate that both the enhanced output of CD4+CD25+ nTreg by the thymus and the relatively enhanced percentage of peripheral CD4+CD25+ iTregs contributed to the increased frequency of CD4+CD25+ Tregs in the periphery of mice with long-term STZ-induced diabetes.
Figure 7.
The percentage of nTregs was increased in the thymuses of mice with diabetes. Thymocytes were freshly prepared at 10 days, 1 month and 4 months after the onset of diabetes and stained for CD4, CD8 and CD25/Foxp3. (a) Absolute numbers of thymocytes from control and diabetic mice at indicated time points. (b) Representative FACS staining for CD4 and CD8 on thymocytes (middle in upper panel) and the mean percentages of CD4SP, CD8SP, CD4CD8DP and CD4CD8DN cells in thymocytes (right in upper panel) at indicated time points. (c) Representative FACS staining for CD25 on gated CD4SP thymocytes (left in lower panel) from control and diabetic mice as well as the mean percentage of CD25+ Tregs out of total CD4SP cells (middle in lower panel) in the thymus at indicated time points. (d) Representative FACS staining for Foxp3 on gated CD4SP thymocytes as well as the mean percentage of Foxp3+ Tregs out of total CD4SP cells (right in lower panel) in the thymuses of control and diabetic mice at indicated time points. Data are shown as mean±s.d. (n=15), which is a summary of four independent experiments. *P<0.05, **P<0.01 and ***P<0.001, compared with the control mice. DN, double negative; DP, double positive; FACS, fluorescence-activated cell sorting; nTreg, naturally occurring regulatory T cell.
Figure 8.
Both nTregs and iTregs were increased in the periphery of mice with diabetes for 4 months. (a) Representative FACS staining for Helios and Foxp3 on gated CD4+ T cells. The percentages of Helios+Foxp3+ iTregs, Helios−Foxp3+ iTregs and Foxp3+ iTregs out of total CD4+ T cells in PBLs (b), the spleen (c), pLNs (d) and mLNs (e). Data are shown as mean±s.d. (n=10), for one representative out of three independent experiments. *P<0.05, **P<0.01 and ***P<0.001, compared with the indicated groups. FACS, fluorescence-activated cell sorting; iTreg, inducible regulatory T cell; mLN, mesenteric lymph node; nTreg, naturally occurring regulatory T cell; PBL, peripheral blood lymphocyte; pLN, peripheral lymph node; SPL, splenic-derived lymphocyte.
Diabetes impacts the differentiation of CD4+CD25− Teffs into CD4+CD25+Foxp3+ Tregs
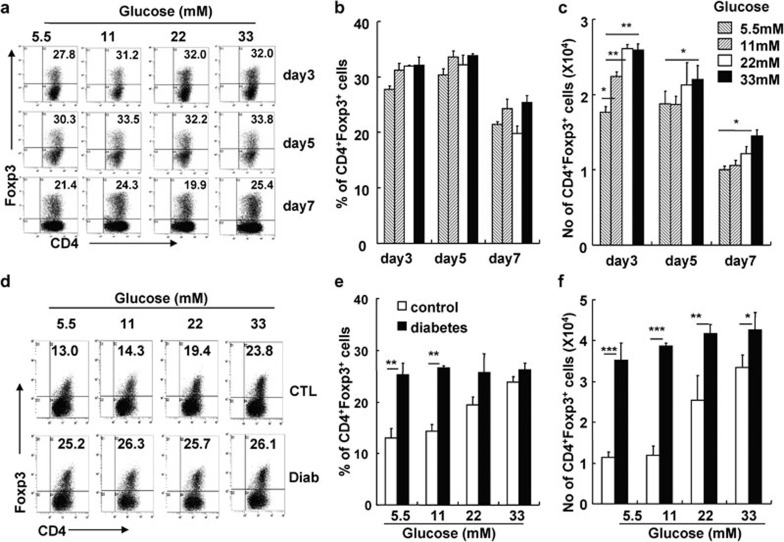
High glucose levels did not significantly impact the survival of CD4+CD25+ Tregs in vitro (data not shown). We propose that high glucose levels may promote the differentiation of naive CD4+CD25− Teffs into CD4+CD25+Foxp3+ iTregs. We isolated CD4+CD25− T cells from Foxp3-GFP knock-in mice to investigate the effect of glucose on the induction of CD4+CD25+Foxp3+ iTregs in vitro. As shown in Figure 9, along with anti-CD3/CD28 mAbs and TGF-β stimulation, the increased glucose concentration significantly enhanced the percentage and absolute number of CD4+Foxp3+ iTregs (Figure 9a–c). We also studied the effect of glucose on the induction of CD4+Foxp3+ iTregs using purified CD4+CD25− T cells from mice with long-term STZ-induced diabetes. Significantly higher percentages and absolute numbers of CD4+Foxp3+ iTregs were induced from CD4+CD25− T cells obtained from diabetic mice under different glucose concentrations, compared with control mice (P<0.01, P<0.001 and P<0.05, respectively; Figure 9d–f). Thus, CD4+CD25− T cells from mice with long-term hyperglycemia were more sensitive to differentiate into CD4+Foxp3+ iTregs than those from control mice.
Figure 9.
Enhanced CD4+CD25+ iTreg induction under high glucose conditions and enhanced sensitivity of CD4+CD25− Teffs in diabetic mice to iTreg induction in vitro. Sorted CD4+CD25− T cells from Foxp3-GFP knock-in mice or the indicated mice were cultured with TGF-β in the presence of plate-bound anti-CD3 and soluble anti-CD28 mAbs for the indicated amount of time. Cells were harvested and stained for Foxp3. (a) One representative FACS staining for CD4 and Foxp3 on cultured CD4+CD25− T cells. The mean percentages (b) and cell numbers (c) of CD4+Foxp3+ Tregs were summarized. (d) Representative FACS staining for CD4 and Foxp3 on cultured CD4+CD25− T cells from control or diabetic mice. Summary of the mean percentages (e) and cell numbers (f) of CD4+Foxp3+ Tregs after CD4+CD25− T cells from control or diabetic mice were cultured for 5 days. Data are shown as mean±s.d. (n=6), for one representative out of two independent experiments. *P<0.05, **P<0.01 and ***P<0.001, compared with the indicated groups. CTL, control; FACS, fluorescence-activated cell sorting; GFP, green fluorescent protein; iTreg, inducible regulatory T cell; mAb, monoclonal antibody; TGF, transforming growth factor; Treg, regulatory T cell.
Discussion
In this study, we demonstrated that the percentages of CD4+CD25+ or CD4+CD25+Foxp3+ Tregs were significantly elevated in peripheral lymphoid compartments, including PBLs, the spleen, pLNs and mLNs, in mice with long-term STZ-induced diabetes, although the absolute cell numbers were decreased. CD4+CD25+ Tregs from diabetic mice displayed an activated/memory phenotype with reduced immunosuppressive function. Control of blood glucose levels with insulin injections reversed the imbalance between CD4+CD25+ Tregs and CD4+CD25− Teffs in diabetic mice. CD4+CD25− Teffs from diabetic mice were prone to CD4+CD25+ iTreg induction.
Because the frequency of CD4+CD25+ Tregs appeared normal at the onset of diabetes and gradually increased after the establishment of STZ-induced diabetes, we concluded that CD4+CD25+ Tregs might not be involved in the initiation of disease in this model, however, CD4+CD25+ Tregs are altered under long-term diabetic conditions in this model. In order to figure out whether high glucose levels play a role in altering CD4+CD25+ Tregs, we treated diabetic mice with insulin to maintain blood glucose at normal levels. The changes in CD4+CD25+ Treg frequency, phenotype and function under hyperglycemic conditions were all reversed with insulin treatment. This supports the hypothesis that long-term hyperglycemia caused a series of changes in the CD4+CD25+ Treg population in mice with long-term STZ-induced diabetes. However, we cannot exclude the possibility that stress and an altered neuroendocrine system impaired T-cell subsets in these mice.
We explored the origin of the increased proportion of CD4+CD25+ Tregs in the periphery of mice with STZ-induced diabetes. Similar to the changes in the periphery, the percentage of CD4+CD25+ nTregs in the thymus was also gradually increased following the onset of diabetes. By 1 month after the onset of diabetes, the proportion of CD4+CD25+ nTregs in the thymus was significantly elevated. A previous report showed that STZ may be toxic to the thymus;26 however, Mic et al.27 provided conflicting results. Our data showed normal T-cell development and no alteration in CD4+CD25+ Tregs in the thymus 10 days after the onset of diabetes. Moreover, insulin injections reversed the alterations in thymic CD4+CD25+ nTregs in diabetic mice. These data indicate that STZ did not affect T-cell development directly, but STZ-induced hyperglycemia or other relevant changes impacted thymic CD4+CD25+ nTreg development. Significantly increased levels of CD4+Helios+Foxp3+ nTregs were consistently observed in the periphery of mice with long-term diabetes. These data support the hypothesis that the increased thymic output of CD4+Helios+Foxp3+ nTregs may contribute to the elevated frequency of CD4+CD25+ Tregs in the periphery of mice with long-term diabetes.
In recent years, it has become evident that CD4+CD25+Foxp3+ Tregs could also be generated outside the thymus under a variety of conditions.9 A significantly increased percentage of CD4+Helios−Foxp3+ iTregs in mice with long-term hyperglycemia indicates that peripheral induction of CD4+Helios−Foxp3+ iTregs was also relatively elevated in mice with long-term diabetes. In the presence of anti-CD3/CD28 mAbs and TGF-β, high glucose levels enhanced the percentage and number of CD4+CD25+ iTregs derived from the sorted CD4+CD25− Teffs. CD4+CD25− Teffs from mice with STZ-induced diabetes produced more Foxp3+ iTregs at all glucose concentrations compared with CD4+CD25− Teffs from control mice, indicating that CD4+CD25− Teffs from diabetic mice are predisposed to convert to CD4+CD25+ Tregs. However, the increased frequencies of CD4+CD25+Foxp3+ Tregs in the periphery of mice with diabetes may not be due to changes in the survival of CD4+CD25+ Tregs, as these cells showed identical survival rates in vitro (data not shown). This is consistent with the observation that there is no difference in the apoptosis of CD4+CD25+ Tregs in either long-standing T1D patients or control individuals.28
Cytokines including TGF-β and IL-2 are necessary for CD4+CD25+ iTreg induction.29, 30, 31, 32, 33 It was reported that high glucose levels promoted an increased production of TGF-β1 from human mesenchymal stem cells.34, 35 The activated protein kinase C–mitogen-activated protein kinase signaling pathway leads to high expression of TGF-β and contributes to diabetic nephropathy in diabetic mice.1, 36 The IL-2–STAT5 signaling pathway is essential for CD4+CD25+ iTreg induction.37, 38 Some reports demonstrated defective IL-2 production in T1D patients or NOD mice.12, 39 In our STZ-induced diabetic mouse model, CD4+CD25− Teffs produced significantly more IL-2 after stimulation with phorbol myristate acetate and ionomycin. These data collectively suggest that enhanced TGF-β and IL-2 production may at least partially contribute to peripheral CD4+CD25+ iTreg induction in mice with long-term diabetes. Therefore, hyperglycemia impacts both thymic and peripheral CD4+CD25+ Treg development in mice.
Our results showed that, in addition to the paradoxical increase in the frequency of CD4+CD25+ Tregs in the periphery of mice with STZ-induced diabetes, the function of CD4+CD25+ Tregs was somewhat defective in these mice. In immunosuppression assays, CD4+CD25+ Tregs from diabetic mice showed a significantly reduced ability to suppress proliferation of CD4+CD25− Teffs in response to allogeneic antigens or T-cell receptor stimulations compared with control mice, although CD4+CD25+ Tregs from diabetic mice show immunosuppressive ability on CD4+CD25− Teffs. Our data is consistent with previous data.16, 17 To check whether CD4+CD25− Teffs from diabetic mice are resistant to regulation by CD4+CD25+ Tregs, we compared the sensitivity of CD4+CD25− Teffs from control and diabetic mice to the regulation of CD4+CD25+ Tregs either from control or from diabetic mice, respectively. We did not, however, observe any decrease in the sensitivity of CD4+CD25− Teffs from diabetic mice to regulation by CD4+CD25+ Tregs. These data indicate that the intrinsic changes in CD4+CD25+ Tregs themselves, but not the sensitivity of CD4+CD25− Teffs to regulation by CD4+CD25+ Tregs, causes the observed diabetes-induced immune alterations.
The reduced immunosuppressive function of CD4+CD25+ Tregs in mice with hyperglycemia may be related to phenotypic changes in CD4+CD25+ Tregs. Fewer CD4+CD25+ Tregs expressed high levels of CD62L, CD45RB and GITR, while more cells expressed CD44 and CTLA-4. It has been reported that, compared with CD4+CD62Llow T cells, CD4+CD62Lhigh T cells are more suppressive and better at preventing T1D progression in NOD-Rag−/− mice harboring a transgenic T-cell receptor derived from the diabetogenic T-cell clone BDC2.5.40 Linderly et al.17 reported that an increased number of CD4+CD25+ Tregs from T1D patients expressed intracellular CTLA-4, and these CD4+CD25+ Tregs were defective in an in vitro suppression assay, which is consistent with our results. A recent report demonstrated that in the periphery, a substantial percentage of cells had transient or unstable expression of the transcription factor Foxp3.41 These Foxp3+ Tregs demonstrated a CD62LlowCD44high phenotype and had a decreased suppressive ability and showed inflammatory characteristics. Whether the increased CD4+CD25+ Tregs in STZ-induced diabetic mice were the same population needs to be determined. Anti-GITR antibody exacerbates autoimmune diabetes due to selective activation/costimulation of pathogenic T cells. While CD4+CD25+ Tregs are spared, others have reported that ligation of GITR may inhibit the suppressive capacity of CD4+CD25+ Tregs.42, 43, 44, 45 The phenotypic alterations in CD4+CD25+ Tregs from diabetic mice may be associated with decreased function of these cells.
In summary, STZ-induced diabetes leads to a relatively increased output of CD4+CD25+ nTregs from the thymus and increased CD4+CD25+ iTreg generation in the periphery of mice. CD4+CD25+ Tregs displayed an activated/memory phenotype and decreased immunosuppressive function in mice with long-term diabetes. The effect of diabetes on CD4+CD25+ Tregs encourages us to recognize the relationship between the change in CD4+CD25+ Tregs and diabetes progression, and to consider the potential roles of the altered CD4+CD25+ Tregs in the incidence of diabetic complications.
Supplementary information accompanies the paper on Cellar & Molecular Immunology's website (http://www.nature.com/cmi)
Acknowledgments
The authors wish to thank Ms Jing Wang and Mr Yabing Liu for their expert technical assistance, Ms Qinghuan Li for her excellent laboratory management, and Mr Baisheng Ren for his outstanding animal husbandry. This work was supported by grants from the National Basic Research Program of China (973 program, 2010CB945301), and National Natural Science Foundation for Key Programs (30630060). The authors declare no conflict of interest related to this manuscript.
The authors have declared no conflict of financial interest.
Supplementary Information
References
- King GL. The role of inflammatory cytokines in diabetes and its complications. J Periodontol. 2008;79:1527–1534. doi: 10.1902/jop.2008.080246. [DOI] [PubMed] [Google Scholar]
- Devaraj S, Cheung AT, Jialal I, Griffen SC, Nguyen D, Glaser N, et al. Evidence of increased inflammation and microcirculatory abnormalities in patients with type 1 diabetes and their role in microvascular complications. Diabetes. 2007;56:2790–2796. doi: 10.2337/db07-0784. [DOI] [PMC free article] [PubMed] [Google Scholar]
- Hotamisligil GS. Inflammation and metabolic disorders. Nature. 2006;444:860–867. doi: 10.1038/nature05485. [DOI] [PubMed] [Google Scholar]
- Stentz FB, Umpierrez GE, Cuervo R, Kitabchi AE. Proinflammatory cytokines, markers of cardiovascular risks, oxidative stress, and lipid peroxidation in patients with hyperglycemic crises. Diabetes. 2004;53:2079–2086. doi: 10.2337/diabetes.53.8.2079. [DOI] [PubMed] [Google Scholar]
- Daoud AK, Tayyar MA, Fouda IM, Harfeil NA. Effects of diabetes mellitus vs. in vitro hyperglycemia on select immune cell functions. J Immunotoxicol. 2009;6:36–41. doi: 10.1080/15476910802604564. [DOI] [PubMed] [Google Scholar]
- Stentz FB, Kitabchi AE. Activated T lymphocytes in type 2 diabetes: implications from in vitro studies. Curr Drug Targets. 2003;4:493–503. doi: 10.2174/1389450033490966. [DOI] [PubMed] [Google Scholar]
- Ma H, Liu G, Ding W, Wu Y, Cai L, Zhao Y. Diabetes-induced alteration of F4/80+ macrophages: a study in mice with streptozotocin-induced diabetes for a long-term. J Mol Med. 2008;86:391–400. doi: 10.1007/s00109-008-0304-8. [DOI] [PubMed] [Google Scholar]
- Bluestone JA, Abbas AK. Natural versus adaptive regulatory T cells. Nat Rev Immunol. 2003;3:253–257. doi: 10.1038/nri1032. [DOI] [PubMed] [Google Scholar]
- Curotto de Lafaille MA, Lafaille JJ. Natural and adaptive foxp3+ regulatory T cells: more of the same or a division of labor. Immunity. 2009;30:626–635. doi: 10.1016/j.immuni.2009.05.002. [DOI] [PubMed] [Google Scholar]
- Pop SM, Wong CP, Culton DA, Clarke SH, Tisch R. Single cell analysis shows decreasing FoxP3 and TGFbeta1 coexpressing CD4+CD25+ regulatory T cells during autoimmune diabetes. J Exp Med. 2005;201:1333–1346. doi: 10.1084/jem.20042398. [DOI] [PMC free article] [PubMed] [Google Scholar]
- Grinberg-Bleyer Y, Baeyens A, You S, Elhage R, Fourcade G, Gregoire S, et al. Piaggio E IL-2 reverses established type 1 diabetes in NOD mice by a local effect on pancreatic regulatory T cells. J Exp Med. 2010;207:1871–1878. doi: 10.1084/jem.20100209. [DOI] [PMC free article] [PubMed] [Google Scholar]
- Tang Q, Adams JY, Penaranda C, Melli K, Piaggio E, Sgouroudis E, et al. Central role of defective interleukin-2 production in the triggering of islet autoimmune destruction. Immunity. 2008;28:687–697. doi: 10.1016/j.immuni.2008.03.016. [DOI] [PMC free article] [PubMed] [Google Scholar]
- You S, Belghith M, Cobbold S, Alyanakian MA, Gouarin C, Barriot S, et al. Autoimmune diabetes onset results from qualitative rather than quantitative age-dependent changes in pathogenic T-cells. Diabetes. 2005;54:1415–1422. doi: 10.2337/diabetes.54.5.1415. [DOI] [PubMed] [Google Scholar]
- Mellanby RJ, Thomas D, Phillips JM, Cooke A. Diabetes in non-obese diabetic mice is not associated with quantitative changes in CD4+CD25+Foxp3+ regulatory T cells. Immunology. 2007;121:15–28. doi: 10.1111/j.1365-2567.2007.02546.x. [DOI] [PMC free article] [PubMed] [Google Scholar]
- Brusko T, Wasserfall C, McGrail K, Schatz R, Viener HL, Schatz D, et al. No alterations in the frequency of FOXP3+ regulatory T-cells in type 1 diabetes. Diabetes. 2007;56:604–612. doi: 10.2337/db06-1248. [DOI] [PubMed] [Google Scholar]
- Brusko TM, Wasserfall CH, Clare-Salzler MJ, Schatz DA, Atkinson MA. Functional defects and the influence of age on the frequency of CD4+CD25+ T-cells in type 1 diabetes. Diabetes. 2005;54:1407–1414. doi: 10.2337/diabetes.54.5.1407. [DOI] [PubMed] [Google Scholar]
- Lindley S, Dayan CM, Bishop A, Roep BO, Peakman M, Tree TI. Defective suppressor function in CD4+CD25+ T-cells from patients with type 1 diabetes. Diabetes. 2005;54:92–99. doi: 10.2337/diabetes.54.1.92. [DOI] [PubMed] [Google Scholar]
- Putnam AL, Vendrame F, Dotta F, Gottlieb PA. CD4+CD25high regulatory T cells in human autoimmune diabetes. J Autoimmun. 2005;24:55–62. doi: 10.1016/j.jaut.2004.11.004. [DOI] [PubMed] [Google Scholar]
- Alizadeh BZ, Koeleman BP. Genetic polymorphisms in susceptibility to type 1 diabetes. Clin Chim Acta. 2008;387:9–17. doi: 10.1016/j.cca.2007.09.021. [DOI] [PubMed] [Google Scholar]
- Hu Y, Nakagawa Y, Purushotham KR, Humphreys-Beher MG. Functional changes in salivary glands of autoimmune disease-prone NOD mice. Am J Physiol. 1992;263:E607–E614. doi: 10.1152/ajpendo.1992.263.4.E607. [DOI] [PubMed] [Google Scholar]
- Many MC, Maniratunga S, Denef JF. The non-obese diabetic (NOD) mouse: an animal model for autoimmune thyroiditis. Exp Clin Endocrinol Diabetes. 1996;104 Suppl 3:17–20. doi: 10.1055/s-0029-1211673. [DOI] [PubMed] [Google Scholar]
- Salomon B, Rhee L, Bour-Jordan H, Hsin H, Montag A, Soliven B, et al. Development of spontaneous autoimmune peripheral polyneuropathy in B7-2-deficient NOD mice. J Exp Med. 2001;194:677–684. doi: 10.1084/jem.194.5.677. [DOI] [PMC free article] [PubMed] [Google Scholar]
- D'Alise AM, Auyeung V, Feuerer M, Nishio J, Fontenot J, Benoist C, et al. The defect in T-cell regulation in NOD mice is an effect on the T-cell effectors. Proc Natl Acad Sci USA. 2008;105:19857–19862. doi: 10.1073/pnas.0810713105. [DOI] [PMC free article] [PubMed] [Google Scholar]
- Thornton AM, Korty PE, Tran DQ, Wohlfert EA, Murray PE, Belkaid Y, et al. Expression of Helios, an Ikaros transcription factor family member, differentiates thymic-derived from peripherally induced Foxp3+ T regulatory cells. J Immunol. 2010;184:3433–3441. doi: 10.4049/jimmunol.0904028. [DOI] [PMC free article] [PubMed] [Google Scholar]
- Getnet D, Grosso JF, Goldberg MV, Harris TJ, Yen HR, Bruno TC, et al. A role for the transcription factor Helios in human CD4+CD25+ regulatory T cells. Mol Immunol. 2010;47:1595–1600. doi: 10.1016/j.molimm.2010.02.001. [DOI] [PMC free article] [PubMed] [Google Scholar]
- Tabata T, Okuno Y, Fujii S, Kimura S, Kinoshita Y. Maturational impairment of thymic lymphocytes in streptozotocin-induced diabetes in rats. Cell Immunol. 1984;89:250–258. doi: 10.1016/0008-8749(84)90216-8. [DOI] [PubMed] [Google Scholar]
- Mic AA, Mic FA, Tatu CA, Ionac M, Ordodi VL, Paunescu V. Indomethacin inhibits thymic involution in mice with streptozotocin-induced diabetes. Comp Med. 2007;57:476–481. [PubMed] [Google Scholar]
- Glisic S, Ehlenbach S, Jailwala P, Waukau J, Jana S, Ghosh S. Inducible regulatory T cells (iTregs) from recent-onset type 1 diabetes subjects show increased in vitro suppression and higher ITCH levels compared with controls. Cell Tissue Res. 2010;339:585–595. doi: 10.1007/s00441-009-0900-0. [DOI] [PubMed] [Google Scholar]
- Chen W, Jin W, Hardegen N, Lei KJ, Li L, Marinos N, et al. Conversion of peripheral CD4+CD25− naive T cells to CD4+CD25+ regulatory T cells by TGF-beta induction of transcription factor Foxp3. J Exp Med. 2003;198:1875–1886. doi: 10.1084/jem.20030152. [DOI] [PMC free article] [PubMed] [Google Scholar]
- Fu S, Zhang N, Yopp AC, Chen D, Mao M, Chen D, et al. TGF-beta induces Foxp3+ T-regulatory cells from CD4+CD25− precursors. Am J Transplant. 2004;4:1614–1627. doi: 10.1111/j.1600-6143.2004.00566.x. [DOI] [PubMed] [Google Scholar]
- Zheng SG, Wang J, Wang P, Gray JD, Horwitz DA. IL-2 is essential for TGF-beta to convert naive CD4+CD25− cells to CD25+Foxp3+ regulatory T cells and for expansion of these cells. J Immunol. 2007;178:2018–2027. doi: 10.4049/jimmunol.178.4.2018. [DOI] [PubMed] [Google Scholar]
- Davidson TS, DiPaolo RJ, Andersson J, Shevach EM. Cutting edge: IL-2 is essential for TGF-beta-mediated induction of Foxp3+ T regulatory cells. J Immunol. 2007;178:4022–4026. doi: 10.4049/jimmunol.178.7.4022. [DOI] [PubMed] [Google Scholar]
- Yamagiwa S, Gray JD, Hashimoto S, Horwitz DA. A role for TGF-beta in the generation and expansion of CD4+CD25+ regulatory T cells from human peripheral blood. J Immunol. 2001;166:7282–7289. doi: 10.4049/jimmunol.166.12.7282. [DOI] [PubMed] [Google Scholar]
- Ryu JM, Lee MY, Yun SP, Han HJ. High glucose regulates cyclin D1/E of human mesenchymal stem cells through TGF-beta1 expression via Ca2+/PKC/MAPKs and PI3K/Akt/mTOR signal pathways. J Cell Physiol. 2010;224:59–70. doi: 10.1002/jcp.22091. [DOI] [PubMed] [Google Scholar]
- Wang X, Shaw S, Amiri F, Eaton DC, Marrero MB. Inhibition of the Jak/STAT signaling pathway prevents the high glucose-induced increase in TGF-beta and fibronectin synthesis in mesangial cells. Diabetes. 2002;51:3505–3509. doi: 10.2337/diabetes.51.12.3505. [DOI] [PubMed] [Google Scholar]
- Ohshiro Y, Ma RC, Yasuda Y, Hiraoka-Yamamoto J, Clermont AC, Isshiki K, et al. Reduction of diabetes-induced oxidative stress, fibrotic cytokine expression, and renal dysfunction in protein kinase Cbeta-null mice. Diabetes. 2006;55:3112–3120. doi: 10.2337/db06-0895. [DOI] [PubMed] [Google Scholar]
- Murawski MR, Litherland SA, Clare-Salzler MJ, Davoodi-Semiromi A. Upregulation of Foxp3 expression in mouse and human Treg is IL-2/STAT5 dependent: implications for the NOD STAT5B mutation in diabetes pathogenesis. Ann NY Acad Sci. 2006;1079:198–204. doi: 10.1196/annals.1375.031. [DOI] [PubMed] [Google Scholar]
- Burchill MA, Yang J, Vogtenhuber C, Blazar BR, Farrar MA. IL-2 receptor beta-dependent STAT5 activation is required for the development of Foxp3+ regulatory T cells. J Immunol. 2007;178:280–290. doi: 10.4049/jimmunol.178.1.280. [DOI] [PubMed] [Google Scholar]
- Long SA, Cerosaletti K, Bollyky PL, Tatum M, Shilling H, Zhang S, et al. Defects in IL-2R signaling contribute to diminished maintenance of FOXP3 expression in CD4+CD25+ regulatory T-cells of type 1 diabetic subjects. Diabetes. 2010;59:407–415. doi: 10.2337/db09-0694. [DOI] [PMC free article] [PubMed] [Google Scholar]
- You S, Slehoffer G, Barriot S, Bach JF, Chatenoud L. Unique role of CD4+CD62L+ regulatory T cells in the control of autoimmune diabetes in T cell receptor transgenic mice. Proc Natl Acad Sci USA. 2004;101 Suppl 2:14580–14585. doi: 10.1073/pnas.0404870101. [DOI] [PMC free article] [PubMed] [Google Scholar]
- Zhou X, Bailey-Bucktrout SL, Jeker LT, Penaranda C, Martinez-Llordella M, Ashby M, et al. Instability of the transcription factor Foxp3 leads to the generation of pathogenic memory T cells in vivo. . Nat Immunol. 2009;10:1000–1007. doi: 10.1038/ni.1774. [DOI] [PMC free article] [PubMed] [Google Scholar]
- Shimizu J, Yamazaki S, Takahashi T, Ishida Y, Sakaguchi S. Stimulation of CD25+CD4+ regulatory T cells through GITR breaks immunological self-tolerance. Nat Immunol. 2002;3:135–142. doi: 10.1038/ni759. [DOI] [PubMed] [Google Scholar]
- Ronchetti S, Zollo O, Bruscoli S, Agostini M, Bianchini R, Nocentini G, et al. GITR, a member of the TNF receptor superfamily, is costimulatory to mouse T lymphocyte subpopulations. Eur J Immunol. 2004;34:613–622. doi: 10.1002/eji.200324804. [DOI] [PubMed] [Google Scholar]
- Ji HB, Liao G, Faubion WA, Abadia-Molina AC, Cozzo C, Laroux FS, Caton A, et al. Cutting edge: the natural ligand for glucocorticoid-induced TNF receptor-related protein abrogates regulatory T cell suppression. J Immunol. 2004;172:5823–5827. doi: 10.4049/jimmunol.172.10.5823. [DOI] [PubMed] [Google Scholar]
- You S, Poulton L, Cobbold S, Liu CP, Rosenzweig M, Ringler D, et al. Key role of the GITR/GITRLigand pathway in the development of murine autoimmune diabetes: a potential therapeutic target. PLoS One. 2009;4:e7848. doi: 10.1371/journal.pone.0007848. [DOI] [PMC free article] [PubMed] [Google Scholar]
Associated Data
This section collects any data citations, data availability statements, or supplementary materials included in this article.


