Abstract
Monocyte chemoattractant protein-1 (MCP-1)/CCL2 is a C–C chemokine involved in the activation and recruitment of monocytic cells to injury sites. MCP-1/CCL2 can induce either neuroprotection or neurodestruction in vitro, depending on the experimental model. We aim to use MCP-1/CCL2 as an experimental tool to investigate the morphological changes of microglia when loss of healthy retinal ganglion cells (RGCs) is exacerbated or attenuated in an experimental glaucoma model. While a high concentration (1000 ng) of MCP-1/CCL2 and lipopolysaccharide (LPS)-exacerbated RGC loss, 100 ng MCP-1/CCL2 provided neuroprotection towards RGC. Neuroprotective MCP-1/CCL2 (100 ng) also upregulated insulin-like growth factor-1 (IGF-1) immunoreactivity in the RGCs. The neuroprotective effect of MCP-1/CCL2 was not due to the massive infiltration of microglia/macrophages. Taken together, this is the first report showing that an appropriate amount of MCP-1/CCL2 can protect RGCs in experimental glaucoma.
Keywords: glaucoma, IGF-1, MCP-1/CCL2, microglia, neuroprotection
Introduction
Glaucoma is defined as a group of optic neuropathies characterized by the irreversible loss of retinal ganglion cells (RGCs) and their axons accompanied by excavation and degeneration of the optic nerve head (ONH). 1 Elevated intraocular pressure (IOP) is a major risk factor, but the pathophysiological mechanisms may be mediated via a combination of IOP-dependent compressive effects of the cribriform plates in the lamina cribosa on the axons of the RGCs, pressure-induced tissue ischemia and local cellular responses. In human glaucomatous ocular specimens, microglia in the ONH and the parapapillary chorioretinal region of the ONH become activated and redistributed. 2 In response to pathological stimuli, microglia have different phenotypes with diverse functions. 3 The result of engagement of microglia can be neuroprotective or neurodestructive, resulting in containment or aggravation of disease progression. 4 In a rat glaucoma model induced by photocoagulation, wolfberry has been proven to be protective to RGCs under chronic ocular hypertension, partially due to modulating the activation of microglia. 5 In vitro, it is possible to manipulate the activation state of microglia so that their activation can be beneficial. 6 However, it is difficult to achieve this goal in vivo. In this study, we aim to investigate the changes in microglia during different activation states and correlate those with RGC survival in a rat glaucoma model.
Chemokines constitute a family of chemoattractant cytokines whose main function is to regulate cell trafficking. 7 Monocyte chemoattractant protein-1 (MCP-1)/CCL2 is one of the key chemokines that regulate migration and infiltration of monocytes/macrophages. 8 The roles of MCP-1/CCL2 can be both supportive 9 and detrimental to neuronal survival. 10, 11, 12 In photoreceptor culture, when the microglia are depleted from the cultures, MCP-1/CCL2 has no direct effect on photoreceptor survival, even at the concentration of 100 ng/ml. When cocultured with macrophages, MCP-1/CCL2 is cytotoxic to the photoreceptor at a concentration as low as 0.1 ng/ml. 12 MCP-1/CCL2 can protect against N-methyl-𝒹-aspartate-induced neuronal apoptosis at 100 ng/ml in a mixed culture of neurons and astrocytes. 9
Using a rat experimental model of glaucoma, the current study demonstrates that differential effects of MCP-1/CCL2 can stimulate retinal microglia to exhibit distinct morphologies that may result in different functional consequences. The neuroprotective effect of MCP-1/CCL2 may be enforced by upregulation of insulin-like growth factor-1 (IGF-1) levels in the RGCs.
Materials and methods
Adult female Sprague–Dawley rats (250–280 g) were obtained from the Laboratory Animal Unit of LKS Faculty of Medicine at the University of Hong Kong and were maintained in a temperature-controlled room with a 12-h light/dark cycle throughout the observation period. Prior to measuring IOP or any other operation, the rats were anesthetized with an intraperitoneal injection of a ketamine/xylazine mixture (80 mg/kg ketamine and 8 mg/kg xylazine) (Alfasan, Woerden, The Netherlands). All operations were performed with an operating microscope (Olympus OME, Tokyo, Japan). The animals were handled according to the protocol for the use of animals in research approved by the University of Hong Kong Animal Ethics Committee and the Association for Research in Vision and Ophthalmology Statements for the use of animals in ophthalmic and vision research.
Ocular hypertension model
Ocular hypertension (OH) was induced in the right eye of each animal using laser photocoagulation according to our previous publications. 5, 13, 14, 15, 16 Before each laser treatment, one drop of proparacaine hydrochloride (0.5% alcaine, Alcon-Couvreur, Puurs, Belgium) was applied to the eyes as a topical anesthetic. IOP was measured with a Tonopen XL tonometer (Mentor, Norwell, MA, USA) before the first laser treatment and every subsequent week until the rats were killed. Using an argon laser (Ultima 2000SE Argon Laser, Coherent, Palo Alto, CA, USA), the limbal vein and the three radical episcleral aqueous humor drainage veins were photocoagulated. About 60 laser spots (power, 1000 mV; spot size, 50–100 μm; duration, 0.1 s) around the limbal vein (except the nasal area) and 15–20 laser spots on each episcleral aqueous humor drainage vein were applied. To maintain high IOP, a second laser treatment at the same settings was applied 7 days later. After each laser treatment, ophthalmic Tobrex ointment (3% tobramyxin, Alcon-Couvreur) was applied topically to prevent infection.
For the time-course study of RGC survival and microglia activation, 25 animals were divided into five groups (five rats per group): normal control (group 1) and 2 weeks (group 2), 4 weeks (group 3), 8 weeks (group 4) and 12 weeks (group 5) after the first laser photocoagulation. Retrograde labeling of RGC was done 7 days before each end point in the time-course study.
Intravitreous injection of immune stimulants
MCP-1/CCL2 was purchased from R&D Systems, Inc. (Minneapolis, MN, USA) and bacterial endotoxin lipopolysaccharide (LPS, Escherichia coli O111:B4) was purchased from Calbiochem (La Jolla, CA, USA). For the intravitreous injection experiments, 2 µl of different solutions were injected into the vitreous chamber of the right eye directly after the first laser treatment. 14 The needle tip was inserted into the superior temporal region of the eye at a 45° angle through the sclera into the vitreous body without touching the iris or the lens. The injection was performed within 1 min, and the needle was kept in place for an additional period before being gently removed. Animals with cataracts, intraocular bleeding, retinal detachment or non-elevated IOP were excluded from this study (∼15% of experimental animals).
A total of 47 rats with elevated IOP in the right eye were separated into eight groups for 2- or 4-week time periods after the first laser treatment. The treatment profile of IOP measurement, laser photocoagulation, intravitreous injection and superior colliculus labeling in 2- or 4-week studies are shown in Figure 1. A summary of the animal grouping is shown in Table 1. In brief, rats from group 2 (2-week chronic ocular hypertension) did not receive any intravitreous injections and served as the OH control. For the rest of the groups, 2 µl of different drug solutions were given intravitreously: (i) two groups (groups 6 and 7) of animals received phosphate buffer (PB, 0.1 M, pH 7.4) and were used as solvent controls for 2- and 4-week treatments; (ii) three groups of animals (groups 8–10) received an intravitreous injection of 10, 100 or 1000 ng MCP-1/CCL2 dissolved in 2 µl PB and survived for a 2-week period, while another group of rats (group 11) received 100 ng MCP-1/CCL2 and survived for 4 weeks and (iii) the last two groups of rats (groups 12 and 13) received 5 µg of LPS in 2 µl PB for 2- and 4-week time periods.
Figure 1.
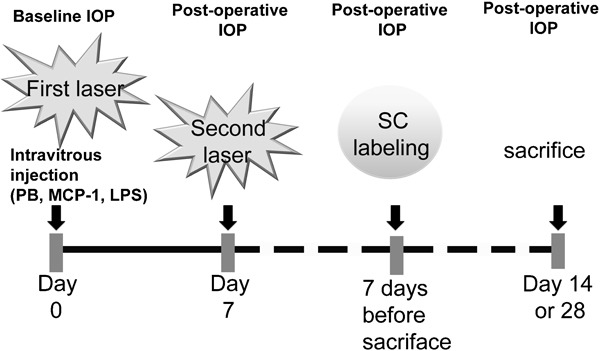
Treatment profile of IOP measurement, laser photocoagulation, intravitreous injection and SC labeling in 2- or 4-week studies. IOP was measured before the first laser treatment (as baseline) and before killing (postoperative). A total of two laser photocoagulations were performed at 1-week intervals. Within 1 min of the first laser treatment, 2 μl sterilized PB, MCP-1/CCL2 or LPS was injected intravitreously. SC labeling was done 7 days before killing of the rat at respective time point after the first laser photocoagulation (14 or 28 days). IOP, intraocular pressure; LPS, lipopolysaccharide; MCP-1, monocyte chemoattractant protein-1; PB, phosphate buffer; SC, superior colliculus.
Table 1. Experimental groups for examining the effects of immune response stimulators on RGCs after induction of ocular hypertension.
| Survival time after the first laser photocoagulation | |||
|---|---|---|---|
| Treatment groups (right eye treated) | 2 weeks | 4 weeks | Objectives |
| No laser | 5 (group 1) | Normal control | |
| Laser treatment without i.v. injection | 5 (group 2) | OH control for 2 weeks | |
| Laser treatment+i.v. injection of PB | 6 (group 6) | 6 (group 7) | Solvent control for drug treatment |
| Laser treatment+i.v. injection of MCP-1 (10 ng) | 6 (group 8) | MCP-1 dose-response study | |
| Laser treatment+i.v. injection of MCP-1 (100 ng) | 6 (group 9) | 6 (group 11) | |
| Laser treatment+i.v. injection of MCP-1 (1000 ng) | 6 (group 10) | ||
| Laser treatment+i.v. injection of LPS (50 mg) | 6 (group 12) | 5 (group 13) | Effect of LPS |
Abbreviations: i.v., intravenous; LPS, lipopolysaccharide; MCP-1, monocyte chemoattractant protein-1; OH, ocular hypertension; PB, phosphate buffer; RGC, retinal ganglion cell.
Retrograde labeling, counting of RGCs and statistical analysis
Retrograde labeling and counting of RGCs were performed using the same protocol described in our previous publication. 5 The eyes were enucleated and post-fixed in the same fixative for 60 min and then cut horizontally into superior and inferior eyecups. The superior eyecups with intact optic nerves were fixed overnight and processed to make paraffin blocks. Retinas from the inferior eyecups were dissected from the underlying sclera and flattened with the vitreal side up. Changes in the density of RGCs in the flat-mounted retina were expressed as a percentage loss of RGCs by comparing the laser-treated right eye and the normal control eye. The percentage loss of RGCs in different groups was compared using one-way analysis of variance followed by a post hoc Tukey multiple comparison test (SigmaStat, statistical significance is noted as P<0.05).
Immunohistochemistry of microglia in flat-mounted retinas
After counting the RGCs, the flat-mounted retinas were carefully removed from the slides and washed as shown in a previous study. 5 Briefly, the retinas were incubated with ionized calcium adaptive molecule-1 (iba-1) primary antibody (1:800; Wako Chemicals USA, Richmond, VA, USA) for 3 days at 4°C. To visualize microglia, the retinas were incubated with Alexa-594 fluorescent-conjugated secondary antibody (Molecular Probes, Eugene, OR, USA) and were flat mounted, again with the vitreal side facing upward. One retinal area of 230×230 µm at about 2500 µm from the optic disk of each retina was scanned at ×40 magnification using a LSM-510Meta multiphoton confocal microscope (Carl Zeiss, Jena, Germany). All the images were taken under the same excitation attenuation to avoid bias on the judgment of the immunoreactivity. The gain level for all groups was identical in order to demonstrate the best resolution of the microglia in the normal control group. Stacked images (z-interval: 1 µm) of different focal planes composted by the LSM software were shown for the entire view of the microglia cell body and their processes in the inner retina. To give a clear observation of the different statuses of microglia, representative single cells were scanned under ×63 magnification, and the gain was adjusted for better resolution of the cell morphology.
Immunohistochemistry of iba-1 and IGF-1 in retinal sections
Retinal sections from different groups were handled at the same time for each primary antibody to avoid bench-to-bench variation. IGF-1 and iba-1 immunoreactivity were detected with 4-μm cross-retinal sections with intact optic nerves. The sections were deparaffinized and boiled in citric acid buffer (0.01 M, pH 6.0, 15 min). Following washing and blocking, retinal sections were incubated with IGF-1 (1:100; R&D Systems, Inc.) or iba-1 primary antibody (1:800) overnight at 4°C. After further washing, retinal sections were incubated with Alexa-594 (for IGF-1) or Alexa-488 (for iba-1) fluorescent-conjugated secondary antibody (Molecular Probes) at room temperature for 1 h. The retinal sections were mounted, and photos were taken under a fluorescent microscope (Carl Zeiss) using the same exposure parameters. The specificity of the antibody was tested by omission of the primary antibody.
Results
Photocoagulation using the argon laser increased the IOP of the right eyes (OH eyes) about 1.5 times compared to the baseline for 1 month. 16 This study extended the observation time to 3 months after the first laser and detected that the IOP of the OH eyes was maintained at a high level (∼22 mmHg). At the same time, the IOP of the contralateral left control eyes remained at a much lower level (∼15.5 mmHg). Compared with normal retinas, there was a significant percentage of RGC loss (P<0.001) starting from 2 weeks after the first laser photocoagulation. Laser photocoagulation induced about 14% RGC loss at 2 weeks, which continuously increased to around 18% at 4 weeks and stabilized at approximately 21% at 2 and 3 months after the first laser (Figure 2).
Figure 2.
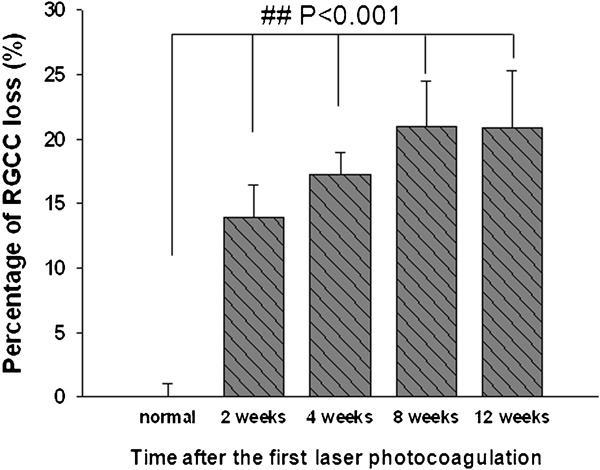
Loss of RGCs at different time points after the first laser photocoagulation. Compared with normal retina, there was a significant percentage of RGC loss starting from 2 weeks after the first laser photocoagulation. # # P<0.001. Error bars represent the SEM. RGC, retinal ganglion cell; SEM, standard error of the mean.
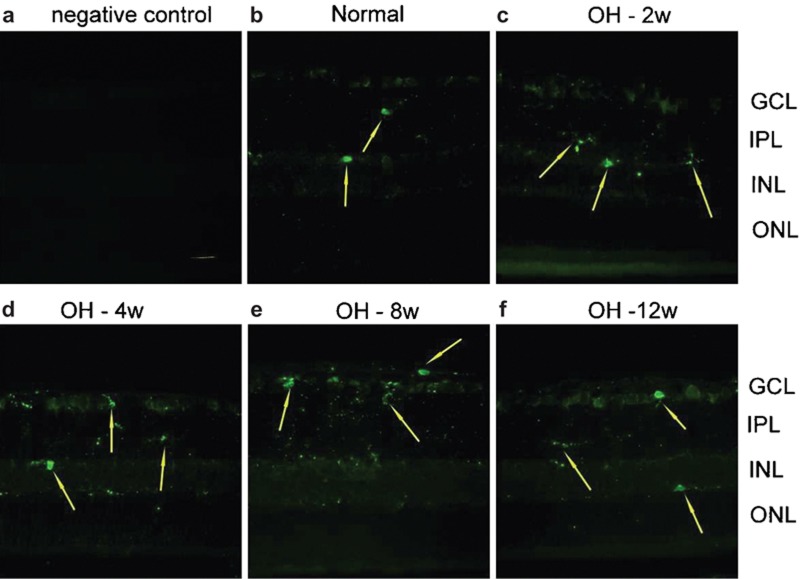
The iba-1 protein is specifically localized to microglia and is not found in neurons, astrocytes or oligodendroglia. 17, 18 When microglia are activated, iba-1 expression is enhanced. 19 For the time-course study, immunoreactivity of iba-1 in the OH retinas showed no significant change between different time periods. In the normal retinas (Figure 3b), scattered iba-1-positive microglia nuclei (arrows) were only found in the inner plexiform layer (IPL) and the inner nucleus layer (INL). Fine processes of the microglia could be observed in the retinal ganglion cell layer (RGCL), IPL, INL and outer plexiform layer. There were no significant changes in iba-1-positive nuclei throughout the observation period up to 3 months after the first laser treatment (Figure 3).
Figure 3.
Immunoreactivity of iba-1 in the OH retinas at different time points. To verify immunohistochemical staining, negative control was introduced by omitting the primary antibody. Procedures by using the secondary antibody only did not yield any positive immunoreacivity (a). In the normal retina (b), only scattered iba-1-positive microglia nuclei (arrow) were stained in the IPL and the INL. Fine processes of the microglia can be observed in the GCL, IPL, INL and OPL. There were no significant changes in iba-1-positive nuclei throughout the observation period in the retinas with OH (c–f). Scale bar=20 μm. GCL: ganglion cell layer; iba-1, ionized calcium adaptive molecule-1; INL: inner nucleus layer; IPL: inner plexiform layer; OH, ocular hypertension; ONL: outer nucleus layer; OPL: outer plexiform layer.
Morphological changes of microglia after various stimulations
At 2 weeks, laser photocoagulation increased the intraocular pressure of the right eye (OH group) to 22.9 mmHg. Intraocular injection of various drugs did not further alter the laser photocoagulation-induced ocular hypertension. The means of the laser-treated right eyes in the PB control, 10 ng MCP-1/CCL2, 100 ng MCP-1/CCL2, 1000 ng MCP-1/CCL2 and LPS groups were 23.5±0.8, 23.4±1.0, 23.8±0.3, 22.2±0.8 and 22.3±0.4 mmHg, respectively (Table 2).
Table 2. Increase in intraocular pressure (IOP) at 2 weeks after the first laser photocoagulation.
| Intraocular pressure (mmHg) | ||
|---|---|---|
| Right eye | Left eye | |
| OH | 22.87±0.60 | 15.61±0.31 |
| OH+PB | 23.45±0.84 | 15.89±0.22 |
| OH+10 ng MCP-1 | 23.40±0.95 | 14.78±1.09 |
| OH+100 ng MCP-1 | 23.77±0.32 | 15.36±0.47 |
| OH+1000 ng MCP-1 | 22.23±0.79 | 15.20±0.68 |
| OH+LPS | 22.29±0.38 | 14.61±0.47 |
LPS, lipopolysaccharide; MCP-1, monocyte chemoattractant protein-1; OH, ocular hypertension; PB, phosphate buffer.
In order to illustrate the morphology of various statuses of microglia induced by different doses of MCP-1/CCL2, immunoreactivity of iba-1 in the retinal microglia was detected in whole-mounted rat retinas. The complete morphology of microglia was reconstructed by stacking the z-layers of scanned photos using the multiphoton confocal laser scanning microscope. The gain of the fluorescence intensity for all retinal scans was identical in order to demonstrate the best resolution of the normal control group. In the normal retina, resting microglia (diameter: ∼50 μm) exhibited ramified shape, with small nuclei and long thin processes, and were located in the inner retina with almost no overlapping of processes (Figure 4a). Two weeks after treatment, there was no difference between microglia in the OH eyes with or without intravitreous PB injection (Figure 4b). LPS and 1000 ng MCP-1/CCL2 intravitreous injection greatly altered microglia from a resting state to a fully activated state in the OH eyes, and the immunoreactivity of iba-1 in the microglia was dramatically increased. They displayed enlarged nuclei and significantly thicker and shorter processes (Figure 4c and f). With a marked increase in number, the short processes of the microglia were overlapping. A unique moderately activated phenotype of microglia was found in the 10/100 ng MCP-1/CCL2 groups. Compared with the resting microglia, their nuclei were slightly enlarged and processes were significantly shortened, with moderate thickening, and there was no overlapping of processes (Figure 4d and e).
Figure 4.
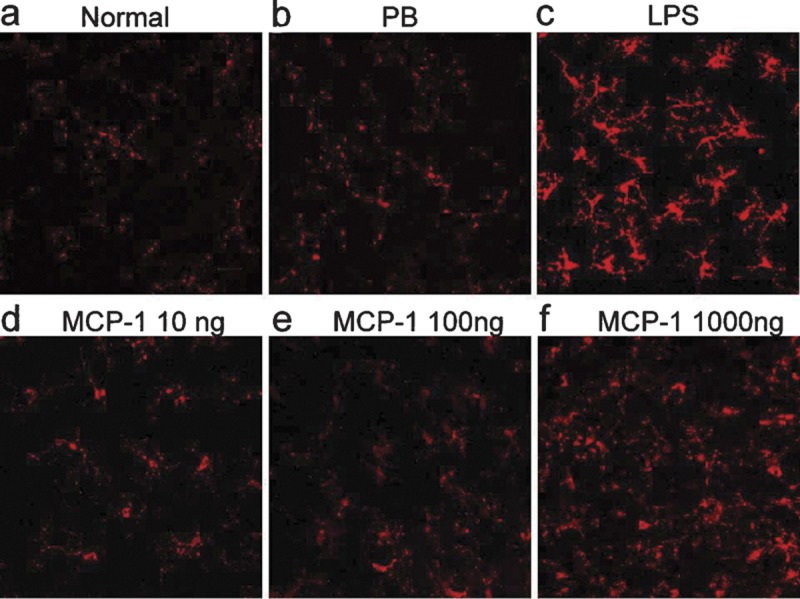
Immunofluorescent analysis of iba-1 in the flat-mounted retinas. The gain of fluorescence intensity for all retinal scans was identical in order to demonstrate the best resolution of the normal control group. In the normal retina (a), iba-1 immunoreactive-positive cells displayed resting morphology. At 2 weeks under OH and with PB intravitreous injection (b), the iba-1-positive microglia were retained at the resting state. With intravitreous injection of LPS (c), iba-1-positive microglia showed a fully activated phenotype. Intravitreous injection of 10 ng (d) and 100 ng (e) MCP-1/CCL2 activated iba-1-positive microglia to a unique semiactivated status. In the 1000 ng MCP-1/CCL2 group (f), iba-1-positive microglia showed a fully activated phenotype. Scale bar=20 µm. iba-1, ionized calcium adaptive molecule-1; LPS, lipopolysaccharide; MCP-1, monocyte chemoattractant protein-1; OH, ocular hypertension; PB, phosphate buffer.
Change of microglial morphology correlated with the differential survival rate of RGCs
Concomitant to the changes in microglial morphology, RGC loss appeared to be correlated with the activation status of microglia. At 2 weeks after the first laser treatment (Figure 3a), OH alone resulted in 13.9% RGC loss. Intravitreous injection of PB into the OH eye slightly increased RGC loss to 17.4%. Compared with the OH- and PB-treated groups, injection of 10 ng MCP-1/CCL2 decreased the RGC loss to 10.3%, and 100 ng of MCP-1/CCL2 significantly reduced RGC loss to 3.4% (**P<0.001, 100 ng MCP-1/CCL2 versus PB, Figure 5). Further increase of MCP-1/CCL2 to 1000 ng did not decrease, but significantly increased RGC loss to 21.2%. Intravitreous injection of bacterial endotoxin LPS significantly increased RGC loss to 28.3% (# P=0.007, Figure 5). While there were significant changes in RGC loss at different dosages of MCP-1/CCL2, the elevation of IOP was unaffected (Table 2), suggesting that the neuroprotective or neurodestructive effect of MCP-1/CCL2 was not mediated via an alteration of IOP. Indeed, there was a high correlation with the morphological changes of microglia. Like LPS, a positive control for the usual inflammatory response, the presence of 1000 ng MCP-1/CCL2 markedly increased the loss of RGCs. At the same time, fully activated microglia were observed. When 100 ng MCP-1/CCL2 exhibited RGC neuroprotection, a distinct morphology of microglia showing the activation state in between the resting and fully activated states was observed. To further test the neuroprotective effect of 100 ng MCP-1/CCL2 and the neurodestructive effect of LPS, we examined RGC loss at 1 month after the first laser treatment. Compared to PB control, 100 ng MCP-1/CCL2 significantly reduced RGC loss from 19.1 to 5.1% (*P<0.001, Figure 6b), while LPS significantly increased the RGC loss to 28.1% (as previously reported) 5 (# P<0.05, Figure 6b). Similar to the 2-week groups, the majority of microglia in the 100 ng MCP-1/CCL2-treated retinas displayed moderately activated morphology (Figure 6c), while fully activated morphology (Figure 6d) was noted in the LPS-treated retinas.
Figure 5.
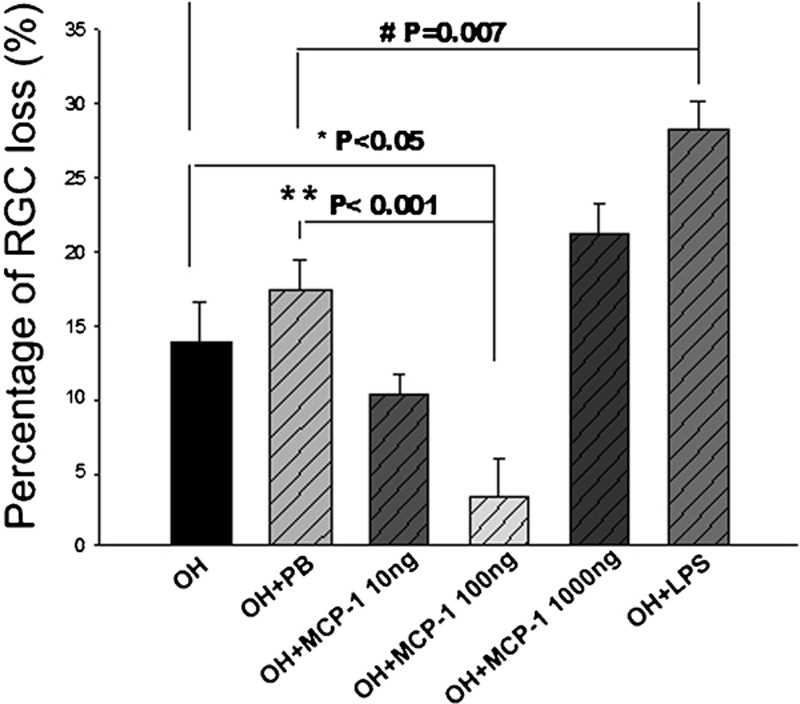
Effects of microglia stimulators administered intravitreally on the loss of RGCs in OH eyes. At 2 weeks after the first laser, 5 µg LPS significantly increased RGC loss compared with the PB intravitreous injection, and 100 ng MCP-1/CCL2 significantly protected the RGCs from OH. Error bars represent the SEM. LPS, lipopolysaccharide; MCP-1, monocyte chemoattractant protein-1; OH, ocular hypertension; PB, phosphate buffer; RGC, retinal ganglion cell; SEM, standard error of the mean.
Figure 6.
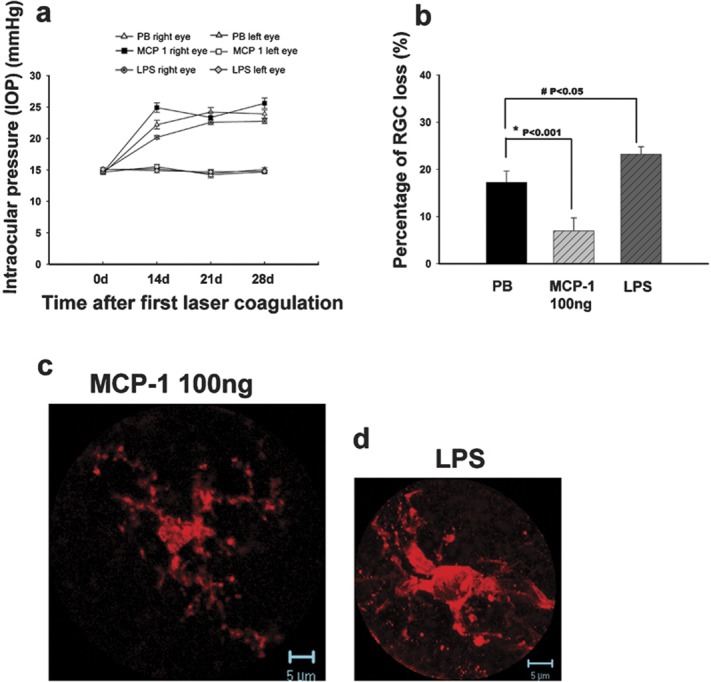
The effects of MCP-1/CCL2 and LPS administered intravitreally in the OH eyes at 4 weeks after the first laser photocoagulation. IOP of the right eyes in different groups showed no significant difference (a). There were significant differences in the percentage of RGC loss when comparing the 100 ng MCP-1/CCL2 and LPS groups with the PB control group (b). Error bars represent the SEM. At 4 weeks after the first laser photocoagulation, iba-1-positive microglia showed a semiactivated state (c) in the 100 ng MCP-1/CCL2-treated retinas while they showed a fully activated phenotype (d) in the LPS-treated retinas. LPS, lipopolysaccharide; MCP-1, monocyte chemoattractant protein-1; PB, phosphate buffer; RGC, retinal ganglion cell; SEM, standard error of the mean.
Endogenous IGF-1 level in the RGC was restored by 100 ng MCP-1/CCL2 under OH
Previous brain ischemia studies have shown that activated microglia can produce neurotrophic molecules, such as IGF-1. 20, 21, 22 In view of the fact that IGF-1 is neuroprotective, we examined the expression of IGF-1 in the retinas. In the normal retina, IGF-1 immunoreactivity was detected in the RGCL and INL (Figure 7a). After 4 weeks under OH, this was markedly reduced in the PB-treated retinas (Figure 7b). In the 100 ng MCP-1/CCL2-treated group (Figure 7c), concomitant to neuroprotective effects of MCP-1/CCL2, IGF-1 immunoreactivity was upregulated and restored to a normal level. However, the increase of IGF-1 immunoreactivity by MCP-1/CCL2 was not observed in the 1000 ng group, and it was at a similar level as the PB group at 2 weeks after the first laser photocoagulation (data not shown). Therefore, we did not further investigate the effect of 1000 ng MCP/CCL2 in the 4-week groups.
Figure 7.

Immunohistochemical study of IGF-1 in retinal sections. At 4 weeks after induction of ocular hypertension, IGF-1 immunoreactivity in the GCL (arrows) decreased in the PB control (b) compared to the normal retina (a). MCP-1/CCL2 (100 ng) increased the IGF-1 level to near-normal levels (c). Scale bar=20 µm. GCL: ganglion cell layer; IGF-1, insulin-like growth factor-1; INL: inner nuclear layer; MCP-1, monocyte chemoattractant protein-1; ONL: outer nuclear layer; PB, phosphate buffer.
Discussion
The results presented here demonstrate, from a morphological point of view, different morphologies of microglia in relation to exacerbated or attenuated neuronal loss in an experimental rat glaucoma model. Using MCP-1/CCL2, we can manipulate the activation states of microglia, in which they exert differential effects in vivo. Our results show, for the first time, that a single dose of MCP-1/CCL2 injected into the vitreous can affect activation of microglia and modulate the fate of RGCs by restoring the IGF-1 level, even after 4 weeks under OH. Furthermore, this is the first study to identify the moderately activated morphology of microglia when a neuroprotective agent was given to safeguard neurons (RGCs).
In the normal mature brain, microglia in a resting state are highly ramified. In contrast to their non-moving cell body, processes of the ‘resting' microglia display high mobility, especially extension and retraction. 23 The brain microglia perform tissue surveillance and can patrol the entire neural parenchyma every few hours. 24 Multiphoton z-stack scanning (from the nerve fiber layer to the outer segment) on whole-mounted retinas allowed us to observe the morphology of the resting state microglia in the retina. Similar to other studies on the brain, resting microglia in the normal rat retina are highly ramified, with a diameter of about 50 μm (scattered throughout the retinal ganglion cell layer and the inner plexiform layer). They may also play a surveillance role in the retina. At 2 weeks under OH, even though there was RGC loss, the microglia detected in the inner retina were in a resting state. There was no significant increase in either the number or the phenotype of microglia up to 3 months in the ocular hypertensive eyes (Figure 3). The morphology of iba-1-positive microglia in the cross-retinal sections was similar to the ramified morphology in the Naskar et al.'s study. 25 The resting state morphology of microglia was also supported by the study by Lam et al., 26 in which they could not detect the phagocytic microglia in glaucomatous retina by using ED1 immunohistochemical staining. Since OH is not an acute injury causing massive neuronal death, microglia in the glaucomatous retina were not activated as they were in the optic nerve axotomy model. The microglia response in this laser photocoagulation-induced OH model can mimic the situation in human glaucomatous retinas, in which activated microglia are detected in the ONH and the parapapillary chorioretinal region of the ONH, but not in the retina. Therefore, this model provides a good opportunity for us to investigate different morphologies of microglia modulated by different factors.
To demonstrate the activated morphology of microglia seen in other reports, we intravitreously injected LPS as the positive control. LPS is one of the most common immune stimuli used to investigate the impact of inflammation on neuronal death. 27 A single intravitreous injection of LPS significantly increased RGC loss up to 1 month. Concomitantly, fully activated microglia were found in the nerve fiber layer and retinal ganglion cell layer corresponding to the area of retinal injury in OH. Fully activated microglia could increase RGC death because LPS simulates cultured retinal microglia to release neurotoxic cytokines, such as IL-1β, tumor-necrosis factor (TNF)-α and inducible nitric oxide synthase (iNOS). 28, 29 Dysregulated response or overactivation of microglia is considered to be destructive for bystander neurons because of the harmful effects of free radicals produced by fully activated microglia. 30, 31 The increased RGC death was not due to direct neurotoxic effects of LPS, as it has been shown that LPS does not exert direct neurotoxicity. 32 The roles of MCP-1/CCL2 can be both supportive 9 and detrimental to neuronal survival. 10, 11, 12 In photoreceptor culture, when the microglia were depleted from the cultures, MCP-1/CCL2 had no direct effect on photoreceptor survival, even at the concentration of 100 ng/ml. When cocultured with macrophages, MCP-1/CCL2 is cytotoxic to the photoreceptor at a concentration as low as 0.1 ng/ml. 12 MCP-1/CCL2 can protect against N-methyl-𝒹-aspartate-induced neuronal apoptosis at 100 ng/ml in a mixed culture of neurons and astrocytes. 9 All of these reports support a hypothesis that effects of MCP-1/CCL2 on neuronal survival require the help of glial cells. In this OH model, microglia were not dramatically activated even up to 3 months, suggesting that MCP-1/CCL2 does not have only one mechanism eliciting neuroprotection in this OH model. As we observed in the semiactivated morphology of microglia, long-term neuroprotective effects of MCP-1/CCL2 are accomplished by modulation of microglia.
It is unclear how microglia sense the change of microenvironment in the retina and display distinct morphology in response to the neuroprotective effect of MCP-1/CCL2. It is likely that MCP-1/CCL2 elicits direct effects on microglia so that microglia change their activation state to those exhibiting neuroprotection.
Elevated IGF-1 levels have been detected in activated microglia and exhibit neuroprotection in brain ischemia and Alzheimer's disease. 20, 21, 22 Exogenous IGF-1 has been shown to be neuroprotective to RGCs 33 and amacrine cells. 34 In normal rat retina, mRNA for IGF-1 is localized in the RGCL, 35 and we detected IGF-1 in the RGCL and INL of normal retinas. Similar to the reports of optic nerve injury in which IGF-1 was downregulated, 36 we also observed a decrease in IGF-1 immunoreactivity in the RGCL under OH. Endogenous IGF-1 in the RGC was restored by MCP-1/CCL2 (100 ng) treatment up to 4 weeks, which may explain persistent semiactivated microglia in the inner retina.
Our findings here demonstrate a distinct morphology of microglia in response to neuroprotective MCP-1/CCL2. Definition of this distinct morphology will help future studies to understand the biological mechanisms of neuroprotective microglia, opening up a new avenue of manipulating microglia to elicit neuroprotective effects in neurodegeneration.
Acknowledgments
This work was supported by the Glaucoma Foundation, New York, USA. Kin Chiu is supported by a postdoctoral fellowship from the University of Hong Kong.
References
- Quigley HA. Number of people with glaucoma worldwide. . Br J Ophthalmol. 1996;80:389–393. doi: 10.1136/bjo.80.5.389. [DOI] [PMC free article] [PubMed] [Google Scholar]
- Neufeld AH. Microglia in the optic nerve head and the region of parapapillary chorioretinal atrophy in glaucoma. . Arch Ophthalmol. 1999;117:1050–1056. doi: 10.1001/archopht.117.8.1050. [DOI] [PubMed] [Google Scholar]
- Hanisch UK, Kettenmann H. Microglia: active sensor and versatile effector cells in the normal and pathologic brain. . Nat Neurosci. 2007;10:1387–1394. doi: 10.1038/nn1997. [DOI] [PubMed] [Google Scholar]
- Schwartz M, Butovsky O, Bruck W, Hanisch UK. Microglial phenotype: is the commitment reversible? . Trends Neurosci. 2006;29:68–74. doi: 10.1016/j.tins.2005.12.005. [DOI] [PubMed] [Google Scholar]
- Chiu K, Chan HC, Yeung SC, Yuen WH, Zee SY, Chang RC, et al. Modulation of microglia by wolfberry on the survival of retinal ganglion cells in a rat ocular hypertension model. . J Ocular Biol Dis Infor. 2009;2:47–56. doi: 10.1007/s12177-009-9023-9. [DOI] [PMC free article] [PubMed] [Google Scholar]
- Li L, Lu J, Tay SS, Moochhala SM, He BP. The function of microglia, either neuroprotection or neurotoxicity, is determined by the equilibrium among factors released from activated microglia in vitro. . Brain Res. 2007;1159:8–17. doi: 10.1016/j.brainres.2007.04.066. [DOI] [PubMed] [Google Scholar]
- Deshmane SL, Kremlev S, Amini S, Sawaya BE. Monocyte chemoattractant protein-1 (MCP-1): an overview. . J Interferon Cytokine Res. 2009;29:313–326. doi: 10.1089/jir.2008.0027. [DOI] [PMC free article] [PubMed] [Google Scholar]
- Zhang J, Koninck Y. Spatial and temporal relationship between monocyte chemoattractant protein-1 expression and spinal glial activation following peripheral nerve injury. . J Neurochem. 2006;97:772–783. doi: 10.1111/j.1471-4159.2006.03746.x. [DOI] [PubMed] [Google Scholar]
- Eugenin EA, D'Aversa TG, Lopez L, Calderon TM, Berman JW. MCP-1 (CCL2) protects human neurons and astrocytes from NMDA or HIV-tat-induced apoptosis. . J Neurochem. 2003;85:1299–1311. doi: 10.1046/j.1471-4159.2003.01775.x. [DOI] [PubMed] [Google Scholar]
- Galasso JM, Liu Y, Szaflarski J, Warren JS, Silverstein FS. Monocyte chemoattractant protein-1 is a mediator of acute excitotoxic injury in neonatal rat brain. . Neuroscience. 2000;101:737–744. doi: 10.1016/s0306-4522(00)00399-7. [DOI] [PubMed] [Google Scholar]
- Kalehua AN, Nagel JE, Whelchel LM, Gides JJ, Pyle RS, Smith RJ, et al. Monocyte chemoattractant protein-1 and macrophage inflammatory protein-2 are involved in both excitotoxin-induced neurodegeneration and regeneration. . Exp Cell Res. 2004;297:197–211. doi: 10.1016/j.yexcr.2004.02.031. [DOI] [PubMed] [Google Scholar]
- Nakazawa T, Matsubara A, Noda K, Hisatomi T, She H, Skondra D, et al. Characterization of cytokine responses to retinal detachment in rats. . Mol Vis. 2006;12:867–878. [PubMed] [Google Scholar]
- Chiu K, Chang R, So KF. Laser induced rat chronic ocular hypertension model on SD rats. J Vis Exp. 2007. p. 549. [DOI] [PMC free article] [PubMed]
- Ji JZ, Elyaman W, Yip HK, Lee VW, Yick LW, Hugon J, et al. CNTF promotes survival of retinal ganglion cells after induction of ocular hypertension in rats: the possible involvement of STAT3 pathway. . Eur J Neurosci. 2004;19:265–272. doi: 10.1111/j.0953-816x.2003.03107.x. [DOI] [PubMed] [Google Scholar]
- Chan HC, Chang RC, Koon-Ching Ip A, Chiu K, Yuen WH, Zee SY, et al. Neuroprotective effects of Lycium barbarum Lynn on protecting retinal ganglion cells in an ocular hypertension model of glaucoma. . Exp Neurol. 2007;203:269–273. doi: 10.1016/j.expneurol.2006.05.031. [DOI] [PubMed] [Google Scholar]
- Luo XG, Chiu K, Lau FH, Lee VW, Yung KK, So KF. The selective vulnerability of retinal ganglion cells in rat chronic ocular hypertension model at early phase. Cell Mol Neurobiol. 2009. [DOI] [PMC free article] [PubMed]
- Imai Y, Ibata I, Ito D, Ohsawa K, Kohsaka S. A novel gene iba1 in the major histocompatibility complex class III region encoding an EF hand protein expressed in a monocytic lineage. . Biochem Biophys Res Commun. 1996;224:855–862. doi: 10.1006/bbrc.1996.1112. [DOI] [PubMed] [Google Scholar]
- Ito D, Imai Y, Ohsawa K, Nakajima K, Fukuuchi Y, Kohsaka S. Microglia-specific localisation of a novel calcium binding protein, Iba1. . Mol Brain Res. 1998;57:1–9. doi: 10.1016/s0169-328x(98)00040-0. [DOI] [PubMed] [Google Scholar]
- Ito D, Tanaka K, Suzuki S, Dembo T, Fukuuchi Y. Enhanced expression of Iba1, ionized calcium-binding adapter molecule 1, after transient focal cerebral ischemia in rat brain. . Stroke. 2001;32:1208–1215. doi: 10.1161/01.str.32.5.1208. [DOI] [PubMed] [Google Scholar]
- Lalancette-Hebert M, Gowing G, Simard A, Weng YC, Kriz J. Selective ablation of proliferating microglial cells exacerbates ischemic injury in the brain. . J Neurosci. 2007;27:2596–2605. doi: 10.1523/JNEUROSCI.5360-06.2007. [DOI] [PMC free article] [PubMed] [Google Scholar]
- O'Donnell SL, Frederick TJ, Krady JK, Vannucci SJ, Wood TL. IGF-I and microglia/macrophage proliferation in the ischemic mouse brain. . Glia. 2002;39:85–97. doi: 10.1002/glia.10081. [DOI] [PubMed] [Google Scholar]
- Butovsky O, Koronyo-Hamaoui M, Kunis G, Ophir E, Landa G, Cohen H, et al. Glatiramer acetate fights against Alzheimer's disease by inducing dendritic-like microglia expressing insulin-like growth factor 1. Proc Natl Acad Sci USA. 2006;103:11784–11789. doi: 10.1073/pnas.0604681103. [DOI] [PMC free article] [PubMed] [Google Scholar]
- Davalos D, Grutzendler J, Yang G, Kim JV, Zuo Y, Jung S, et al. ATP mediates rapid microglial response to local brain injury in vivo. . Nat Neurosci. 2005;8:752–758. doi: 10.1038/nn1472. [DOI] [PubMed] [Google Scholar]
- Nimmerjahn A, Kirchhoff F, Helmchen F. Resting microglial cells are highly dynamic surveillants of brain parenchyma in vivo. . Science. 2005;308:1314–1318. doi: 10.1126/science.1110647. [DOI] [PubMed] [Google Scholar]
- Naskar R, Wissing M, Thanos S. Detection of early neuron degeneration and accompanying microglial responses in the retina of a rat model of glaucoma. . Invest Ophthalmol Vis Sci. 2002;43:2962–2968. [PubMed] [Google Scholar]
- Lam TT, Kwong JM, Tso MO. Early glial responses after acute elevated intraocular pressure in rats. . Invest Ophthalmol Vis Sci. 2003;44:638–645. doi: 10.1167/iovs.02-0255. [DOI] [PubMed] [Google Scholar]
- Qin L, Liu Y, Wang T, Wei SJ, Block ML, Wilson B, et al. NADPH oxidase mediates lipopolysaccharide-induced neurotoxicity and proinflammatory gene expression in activated microglia. . J Biol Chem. 2004;279:1415–1421. doi: 10.1074/jbc.M307657200. [DOI] [PubMed] [Google Scholar]
- Wang AL, Yu AC, Lau LT, Lee C, Wu LM, Zhu X, et al. Minocycline inhibits LPS-induced retinal microglia activation. . Neurochem Int. 2005;47:152–158. doi: 10.1016/j.neuint.2005.04.018. [DOI] [PubMed] [Google Scholar]
- Yang LP, Zhu XA, Tso MO. Minocycline and sulforaphane inhibited lipopolysaccharide-mediated retinal microglial activation. . Mol Vis. 2007;13:1083–1093. [PMC free article] [PubMed] [Google Scholar]
- Block ML, Zecca L, Hong JS. Microglia-mediated neurotoxicity: uncovering the molecular mechanisms. . Nat Rev Neurosci. 2007;8:57–69. doi: 10.1038/nrn2038. [DOI] [PubMed] [Google Scholar]
- Ladeby R, Wirenfeldt M, Garcia-Ovejero D, Fenger C, Dissing-Olesen L, Dalmau I, et al. Microglial cell population dynamics in the injured adult central nervous system. . Brain Res Brain Res Rev. 2005;48:196–206. doi: 10.1016/j.brainresrev.2004.12.009. [DOI] [PubMed] [Google Scholar]
- Bronstein DM, Perez-Otano I, Sun V, Mullis Sawin SB, Chan J, Wu GC, et al. Glia-dependent neurotoxicity and neuroprotection in mesencephalic cultures. . Brain Res. 1995;704:112–116. doi: 10.1016/0006-8993(95)01189-7. [DOI] [PubMed] [Google Scholar]
- Kermer P, Klocker N, Labes M, Bahr M. Insulin-like growth factor-I protects axotomized rat retinal ganglion cells from secondary death via PI3-K-dependent Akt phosphorylation and inhibition of caspase-3 in vivo. . J Neurosci. 2000;20:722–728. [PubMed] [Google Scholar]
- Politi LE, Rotstein NP, Salvador G, Giusto NM, Insua MF. Insulin-like growth factor-I is a potential trophic factor for amacrine cells. . J Neurochem. 2001;76:1199–1211. doi: 10.1046/j.1471-4159.2001.00128.x. [DOI] [PubMed] [Google Scholar]
- Burren CP, Berka JL, Edmondson SR, Werther GA, Batch JA. Localization of mRNAs for insulin-like growth factor-I (IGF-I), IGF-I receptor, and IGF binding proteins in rat eye. . Invest Ophthalmol Vis Sci. 1996;37:1459–1468. [PubMed] [Google Scholar]
- Homma K, Koriyama Y, Mawatari K, Higuchi Y, Kosaka J, Kato S. Early downregulation of IGF-I decides the fate of rat retinal ganglion cells after optic nerve injury. . Neurochem Int. 2007;50:741–748. doi: 10.1016/j.neuint.2007.01.011. [DOI] [PubMed] [Google Scholar]


