Abstract
Aim:
To improve and validate analytical methods based on HPLC and liquid chromatography coupled to electrospray ionization tandem mass spectrometry (LC-ESI-MS/MS) for the quantitative measurement of sinomenine in rat plasma and brain tissue.
Methods:
The separation of analytes and the internal standard (IS), chloramphenicol, was performed on an Agilent TC-C18 column (250×4.6 mm, 5 μm). Blood samples were measured with a Surveyor photodiode array (PDA) detector at a wavelength of 263 nm. The LCQ DECA XPPlus mass spectrometer was operated in the multiple reactions monitoring mode using positive electrospray ionization, and the transition from the precursor ion (m/z 279) to the product ion (m/z 224) for sinomenine was measured in brain tissue.
Results:
Measurements were linear over the concentration range of 0.1–100 μg/mL for sinomenine in plasma and over the range of 0.01–5.00 μg/g for sinomenine in brain tissue. The intra- and inter-day variabilities were less than 10% of the relative standard deviation (RSD), and the extraction and recovery of sinomenine was 72.48%–80.26% from plasma and 73.75%–80.26% from brain tissue. The limit of quantification (LOQ) was 0.1 μg/mL for plasma, and 0.01 μg/g for brain tissue. Identification of sinomenine was reproducible at 0.5, 5, and 50 μg/mL in the plasma and at 0.05, 0.50, and 2.00 μg/g in brain tissue. The concentration of sinomenine measured in brain tissue after a single ip dose had a neuroprotective effect on H2O2-induced injury in PC12 cells in vitro.
Conclusion:
Our methods offered a sensitivity within a wide linear concentration range for sinomenine. These methods were successfully applied to evaluate sinomenine pharmacokinetics over time in rat brain tissue after a single ip dose of 30 mg/kg.
Keywords: sinomenine, LC-MS/MS, electrospray ionization, pharmacokinetics
Introduction
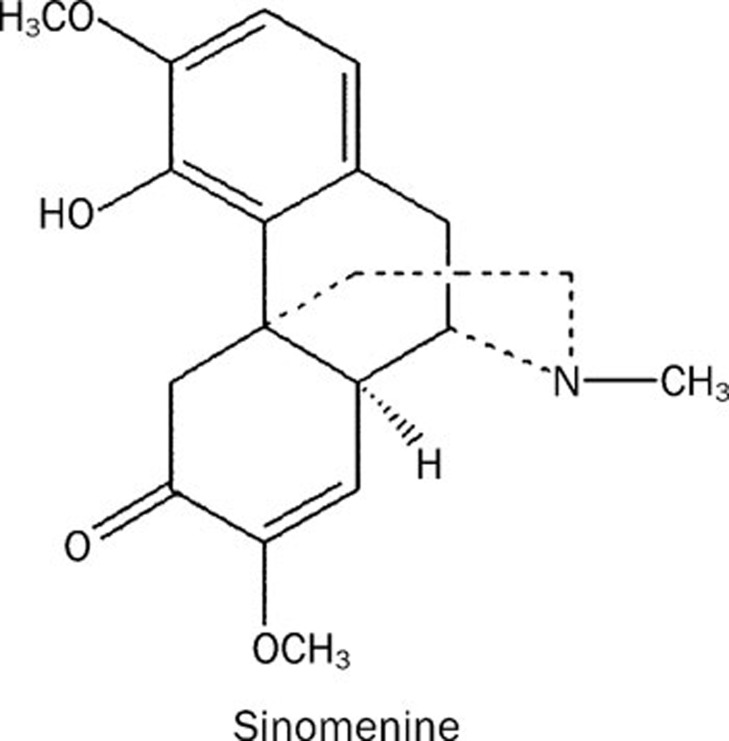
Sinomenine [morphinan-6-1,7,8-didehydro-4-hydroxy-3,7-dimethoxy-17-methyl, (9α,13α,14α)-] is a pure alkaloid that is extracted from the roots and stems of Sinomenium acutum (the chemical structure is shown in Figure 1). Due to its anti-inflammatory and immunosuppressive effects, sinomenine has been widely used for the treatment of various rheumatic diseases, such as atrophic arthritis, with few side effects1, 2, 3.
Figure 1.
The chemical structure of sinomenine.
Recent studies have explored several pharmacological effects of sinomenine in the central nervous system (CNS), such as neuroprotection, addiction treatment and antinociception 4, 5, 6. Sinomenine is a natural dextrorotatorymorphinan analog with a chemical structure that is similar to morphine. It has been shown to exhibit antinociceptive action by activating the opioid μ-receptor4, thereby implicating its applicability in the clinic.
In addition, some studies show that sinomenine has a potent inhibitory effect on withdrawal syndromes in morphine-dependent mice and rats and on withdrawal contractures of in vitro ileum extracted from morphine-dependent guinea pigs7, 8. These data suggest that sinomenine administration may be able to attenuate the effects of psychical dependence on morphine without displaying psychical dependence to the drug itself. The mechanism for alleviating withdrawal syndromes may involve its role in decreasing cAMP levels in the brain9. Therefore, sinomenine may be a valuable natural component to treat addiction without leading to addiction itself.
Microglia-mediated inflammation has recently been implicated as a critical mechanism in progressive neurodegeneration, such as in Parkinson's disease (PD). Sinomenine has been shown to exhibit significant neuroprotective effects against both LPS- and MPP+-induced dopaminergic (DA) neurotoxicity5. The protective effects of sinomenine most likely arise from the inhibition of microglial NADPH oxidase activity, which leads to the inhibition of a wide array of pro-inflammatory mediators that are produced by activated microglia. These findings suggest a novel therapy using sinomenine to treat inflammation-mediated neurodegenerative diseases.
However, the metabolism of this drug is poorly understood in the CNS. Previous studies indicate that sinomenine can be metabolized in humans and rats, as well as with human microsomal protein in vitro. Several methods have been developed to measure sinomenine in rat and human plasma through HPLC10, 11. Liu et al developed an HPLC analytical method to detect sinomenine in plasma and other tissues, which exhibited a low limit of detection (LOD) of 0.32 μg/mL. Yao et al improved the LOD in plasma to 0.5 ng/mL by HPLC/ESI/ion trap mass spectrometry. However, this method has not been applied to measure sinomenine concentrations in the brain tissue. Due to the low amount of sinomenine that can be delivered to the CNS and interference with endogenous substances, we developed a more sensitive method to quantify sinomenine in rat brain tissue that was based on LC-ion trap mass spectrometry with electrospray ionization. Furthermore, we developed an effective pretreatment method to precipitate endogenous proteins before quantification. Finally, we evaluated whether sinomenine, at the measured level achieved in rat brain tissue after administration, was sufficient to induce neuroprotective effects against H2O2-induced injury in PC12 cells in vitro.
Materials and methods
Chemicals and materials
Sinomenine was obtained from the National Institute for the Control of Pharmaceutical and Biological Products (Beijing, China). Chloramphenicol (internal standard) was obtained from Baijingyu Pharma (purity: 99.98%, Nanjing, China)12. HPLC-grade methanol was purchased from Merck & Co, Inc (Germany). HPLC-grade water was obtained from a Milli-Q system (Millipore, USA). All other reagents were purchased at the analytical grade.
In vivo studies in rats
Adult Wistar rats (equal number of males and females, 220–250 g) were provided by the Experimental Animal Center of Tongji Medical College. All animals were housed under controlled conditions (22–23 °C, humidity ∼70%, 12 h light, 12 h dark) for 5 d before the experiment.
Pharmacokinetic (PK) studies were performed overnight (∼12 h) in fasted, healthy Wistar rats. During fasting time, animals had free access to water. The animals were given a single dose of 30 mg/kg sinomenine (solution, prepared by dissolving sinomenine in 0.9% sodium chloride) by an intraperitoneal injection (ip). Blood samples (1.5 mL) were collected into heparinized tubes from the postorbital vein plex at 0, 2.5, 5, 10, 20, and 30 min and at 1, 1.5, 2, 3, and 5 h (n=8/time point). Blood was immediately processed to extract plasma by centrifugation at 600×g for 15 min. Rat brain tissue was rapidly extirpated at 0, 3, 5, 8, 15, and 30 min and at 1, 1.5, 2, and 3 h (n=8/time point). Then the plasma and brain were frozen at −80 °C.
Sample preparation
After the frozen plasma samples were thawed at room temperature, plasma (1 mL) was spiked with chloramphenicol to a final concentration of 10 μg/mL. To perform sample extraction, 1 mL anhydrous methanol was added, and the mixture was shaken for 1 min at room temperature. After centrifugation at 12 000×g for 5 min, the organic supernatant was transferred to a clean tube; the remaining sample was supplemented with 1 mL of 10% zinc sulfate, then vortex-mixed and centrifuged (10 000×g for 10 min). The supernatant (20 μL) was used to measure drug concentration by HPLC.
After the frozen brain samples were thawed at room temperature, 0.5 g of each sample was added to 1 mL ice cold phosphate-buffered saline (PBS, pH=7.4), and the samples were homogenized using a Polytron1 PT-MR 3100 homogenizer (Switzerland) and centrifuged (12 000×g for 5 min). The supernatant (0.5 mL) was spiked with a chloramphenicol solution to a final concentration of 1 μg/mL. No chloramphenicol was added to the sample containing the brain tissue blanks. Then 1 mL of anhydrous methanol was added, and the samples were shaken for 2 min at room temperature. After centrifugation at 12 000×g for 10 min, the clear supernatants (20 μL) were transferred to autosampler vials that contained inserts for LC-MS analysis.
Instrument and chromatography conditions
Blood samples were analyzed on a Thermo Finnigan HPLC system (ThermoFinnigan Corporation, San Jose, CA, USA) containing a Surveyor MS pump, a Surveyor PDA detector, an auto sampler and the Xcalibur TM 1.3 software. A reversed-phase column (Agilent TC-C18, 250×4.6 mm, 5 μm), kept at 30 °C, was also used. Separation of sinomenine and chloramphenicol was performed using a mobile phase consisting of methanol: 0.01 mol/L NH4H2PO4 (60:40, v/v) delivered at a flow rate of 1.0 mL/min. All samples were measured at a wavelength of 263 nm. Standard stock solutions (1 g/L, 0.2 g/L) of sinomenine were prepared by dissolving the target compound in water. Working solutions were prepared on the day of analysis by appropriate dilution of the stock solutions with the mobile phase solution. The stock solutions were kept at 4 °C. The internal standard (chloramphenicol) was also prepared as a stock solution (10.0 g/L) in methanol and was further diluted with the mobile phase solution to a final concentration of 10 μg/mL for these analyses.
MS/MS experiments
The LC system was equipped with a Finnigan Suryor pump and a Suryor autosample injection apparatus. The ion trap mass spectrometer was a Finnigan LCQ Deca XPTM. Separations were performed on a reversed-phase column (Agilent TC-C18, 250×4.6 mm, 5 μm) kept at 30 °C. The mobile phase was methanol: 0.01 mol/L CH3COONH4 (60:40, v/v), which was delivered at a flow rate of 1.0 mL/min.
MS analyses were carried out on an ion trap mass spectrometer with an electrospray ionization source (ESI) that was set to the positive ion mode. Detection of the ions was performed in the multiple reaction monitoring (MRM) mode, in which we monitored the transition from the m/z 330 precursor ion to the m/z 224 product ion for sinomenine. MS was performed under the following conditions: the flow rate for sheath gas (N2) into the ESI source was 300 mL/min, the flow rate for auxiliary gas (N2) was 50 mL/min, the temperature of the capillary was 300 °C, and the voltage of detection was 4 kV.
Preparation of stock solutions, calibration standards, quality control samples and plasma/brain samples for a reproducibility assay
Calibration curve samples for measuring sinomenine in plasma were prepared at concentrations of 0.1, 0.5, 1, 5, 10, 50, and 100 μg/mL. Samples for measuring sinomenine in brain tissue were prepared at concentrations of 0.01, 0.05, 0.1, 0.5, 1, 2, and 5 μg/g. All samples were freshly prepared by serial dilution of the stock solution with drug-free plasma and brain homogenate. Quality control (QC) samples were prepared in the same way at concentrations of 0.5 (low), 5 (medium) and 50 μg/mL (high) for sinomenine in the plasma and at 0.05 (low), 0.50 (medium) and 2.00 μg/g (high) for sinomenine in the brain tissue. Plasma samples were collected at 20 min and brain samples at 8 min after sinomenine administration, and each sample was divided into three portions for the reproducibility assay. Further processing of both the calibration curve samples and the quality control samples were performed according to the methods described in the sample preparation section.
Plasma and brain tissue sinomenine concentrations were calculated using calibration curves. The samples used to make the calibration curves were analyzed over 5 d for plasma and 3 d for tissues. The calibration curves in plasma were assessed by the correlation coefficients that were obtained with the following equation: Y=A×X+B (the weighting factor was 1/X), where Y was the ratio of the relative peak area of sinomenine to that of the internal standard chloramphenicol, X was the concentration of sinomenine, A and B were the values from a least squares regression analysis.
Plasma concentrations of sinomenine were determined using the 3p97 software (Chinese Pharmacological Association, China). The maximum plasma concentrations (Cmax) and their time of occurrence (Tmax) were calculated directly from the measured data. The area under the curve for plasma concentration plotted as a function of time (AUC0–t), from time zero to the time of the last measured concentration, was calculated by the linear trapezoidal rule.
The results for tissue levels of sinomenine were expressed as μg/g tissue, and the levels were calculated by the following equation:
Ct (μg/g)=Cs Vs/W
where Ct is the tissue concentration (μg/g), Cs is the supernatant concentration, Vs is the supernatant volume, and W is the weight of the tissue sample. The mean tissue concentration as a function of time curves were obtained, and pharmacokinetics parameters were determined using the equations that are described for plasma.
Cell culture and cell viability assessments
PC12 cells were obtained from Chinese Type Culture Collection and were differentiated to be neuron-like by treatment with nerve growth factor (NGF). Cultures of PC12 cells were maintained in DMEM containing 5% heat-inactivated fetal calf serum, 10% heat-inactivated horse serum, 100 U/mL penicillin, and 100 μg/mL streptomycin in a humidified atmosphere of 95% air and 5% CO2 at 37 °C. The culture medium was changed and the cells were passaged by trypsinization every 3 to 4 d. Cells (4×10⁴ cells/200 μL) were seeded onto 96-, 24-, or 6-well plates and incubated in a humidified atmosphere of 95% air and 5% CO2 at 37 °C for 2 d.
After treatment, cell viability was measured using the MTT assay, which is based on the conversion of MTT to bright blue formazan crystals by mitochondrial dehydrogenases. In live cells, mitochondrial enzymes have the capacity to transform MTT into insoluble formazan. Cell cultures were incubated with an MTT solution (5 g/L) for 4 h at 37 °C. After incubation, the medium was discarded and DMSO was added to solubilize the reaction product, formazan, by shaking for 15 min. Absorbance of formazan at 492 nm was measured on a microplate reader (ELx800, Bio-Tek, Winooski, VT, USA). Cell viability of the control group was defined as 100%. Cell viability was expressed as a percentage of the value in control cultures.
Statistical analysis
All values are expressed as the mean±standard deviation. Data were analyzed using ANOVA. Post-hoc comparisons were performed using the Tukey HSD test. All statistical analyses were performed using the SPSS 12.0 software (SPSS, Chicago, IL, USA). P values <0.05 were considered statistically significant.
Results
HPLC-UV method to measure sinomenine in plasma
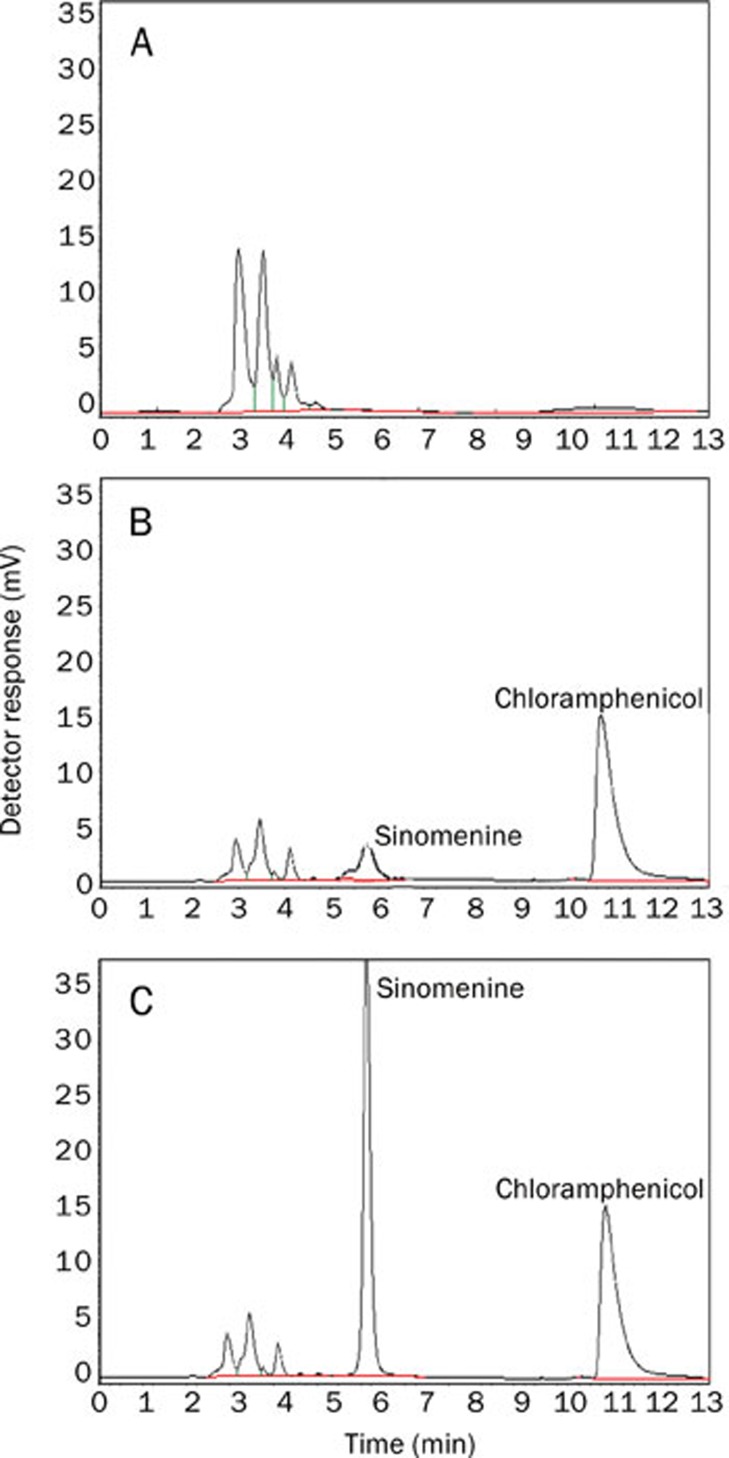
The HPLC-UV method exhibited the baseline separation of sinomenine and chloramphenicol, with retention times of 5.66 and 10.48 min, respectively (Figure 2). No interference peaks from intrinsic substances were observed at the sinomenine and chloramphenicol retention times in homogenate samples from control rats (n=8). Representative HPLC-UV chromatograms for plasma samples are shown in Figure 2.
Figure 2.
HPLC-UV chromatograms of rat plasma. (A) rat plasma blank, (B) rat plasma spiked with sinomenine at its LOQ (0.1 μg/mL) and (C) plasma collected for 20 min after a 30 mg/kg ip dose of sinomenine in rats. The retention times of sinomenine and chloramphenicol were 5.66 min and 10.48 min, respectively.
MS/MS experiments to measure sinomenine in brain
Standard solutions of sinomenine were scanned under ESI positive and negative ion modes. The base peak intensity of sinomenine in the positive ion mode was higher than in the negative ion. Molecular ions with an m/z 330 [M+H]+ for sinomenine were observed. Therefore, this ion was chosen as a parent ion for fragmentation in the MRM mode. Finally, m/z 224 was selected as the target fragmentation ion of sinomenine. The collision energy for the product in the LC–MS/MS mode was varied to optimize the sensitivity for this fragmentation molecule, and the optimal value was found to be 23 V for sinomenine.
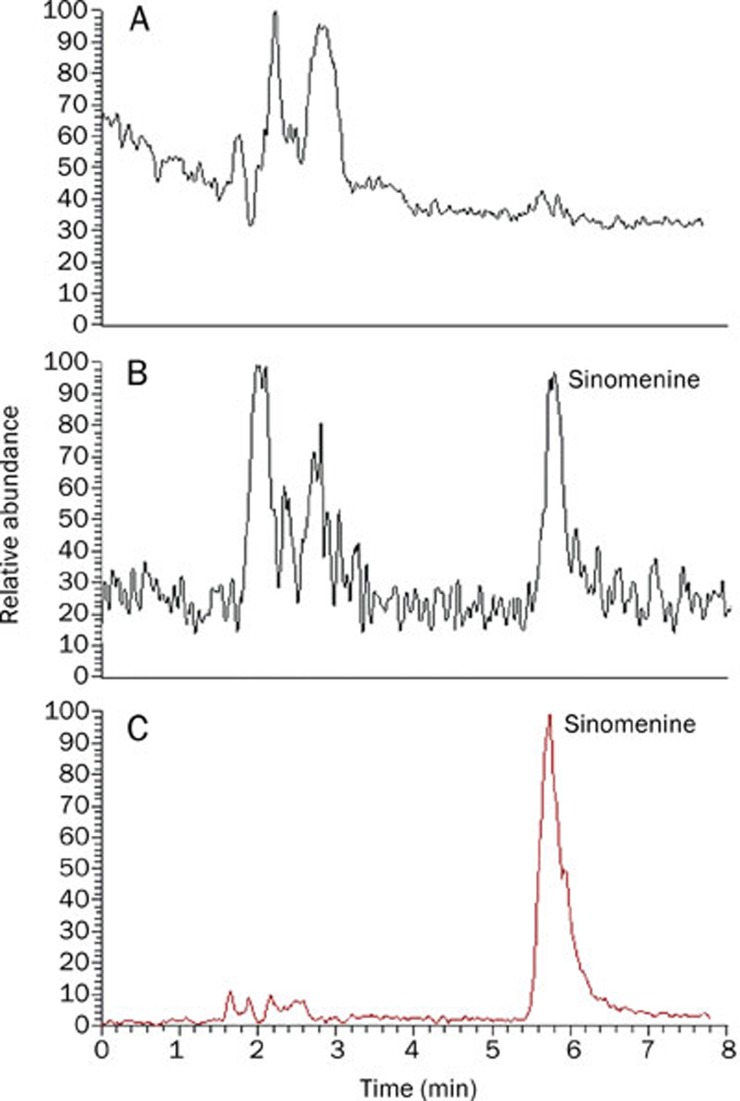
Figure 3 shows representative MRM chromatograms for sinomenine in a blank rat brain tissue, a spiked brain sample with sinomenine at the LOQ (0.01 μg/g) and a brain sample collected 15 min after administration of a single dose of sinomenine at 30 mg/kg (ip). No significant endogenous interferences were observed at the retention time for sinomenine.
Figure 3.
Representative MRM chromatograms of sinomenine in rat brain tissue in the positive ion mode for (A) rat brain blank, (B) rat plasma spiked with sinomenine at its LOQ (0.01 μg/g) and (C) a brain sample collected 15 min after a 30 mg/kg ip dose of sinomenine in rats.
Calibration curves and assay validation
Equations obtained from the calibration curves were RA=0.0124C+0.1311 (r2=0.999) for plasma samples and A=1.5681×10⁵C–2.013×10⁶(r2=0.999) for brain samples. The limit of quantification (LOQ) was estimated as the concentration that gave a signal-to-noise ratio (S/N) of 5:1. The LOQ was 0.1 μg/mL for plasma samples and 0.01 μg/g for brain samples. HPLC analysis of QC samples (n=3) demonstrated that the extraction recovery of sinomenine was 72.48%−80.26% from plasma and 73.75%−80.26% from brain tissue. Intra-day and inter-day variabilities were less than 10% for both plasma and brain samples. The peak areas for sinomenine and the internal standard in plasma and brain samples were measured in the HPLC and LC-MS chromatographs, respectively, to assay the reproducibility of each method. The coefficient of variation for the peak area was 2.1%−2.8%.
Pharmacokinetics of sinomenine
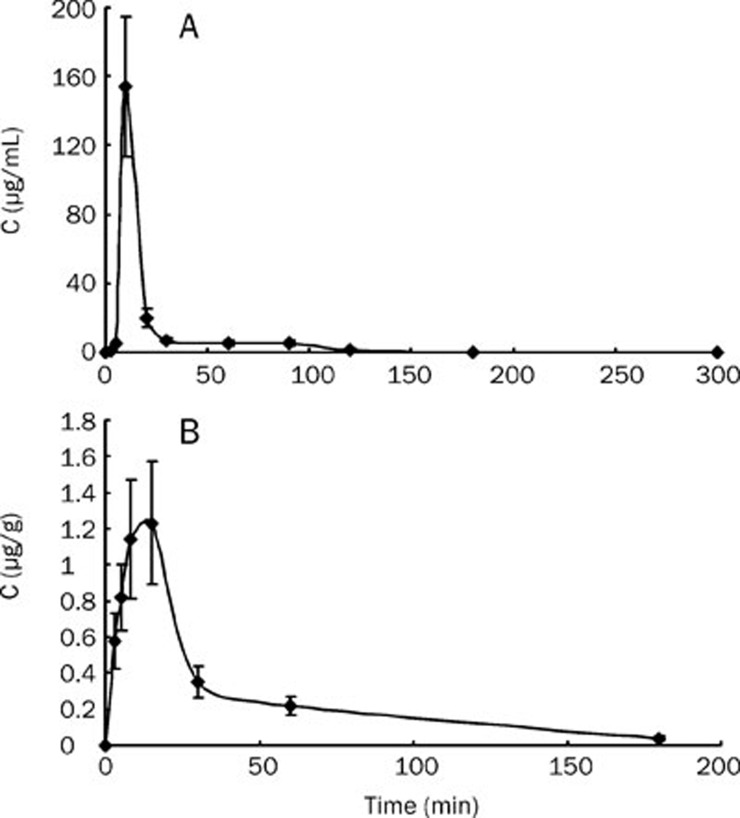
The concentration-time courses of sinomenine in plasma and brain homogenates of rats are shown in Figure 4. Table 1 summarizes the pharmacokinetic parameters of sinomenine after a single ip dose of 30 mg/kg. The Cmax in plasma samples was 154.12±25.56 μg/mL at 10 min after injection. Plasma concentrations remained above 0.1 μg/mL until 5 h post-injection, and the elimination half-life was 62.6±19.4 min. However, Cmax only reached 1.23±0.25 μg/g in brain tissue at 15 min after injection. The concentration in the brain tissue remained above 0.03 μg/g until 3 h post-injection, and the elimination half-life was 8.7±2.6 min. By comparing the concentration-time courses between plasma and brain samples, we estimated that sinomenine could be detected at 3 min post dosing, soon after its absorption, and its mean residence time (MRT) in brain tissue was similar to that in the plasma (38.8±11.5 min in brain tissue and 30.1±8.9 min in plasma).
Figure 4.
Concentration-time curves for sinomenine (A) in plasma and (B) in brain tissue after a 30 mg/kg ip dose of sinomenine in rats. Each point represents the mean value from eight animals.
Table 1. The pharmacokinetic parameters of sinomenine in plasma and brain after a single ip dose of 30 mg/kg in rats.
| Pharmacokinetic parameters | Plasma | Brain | |
|---|---|---|---|
| Tmax | min | 10.0±2.6 | 15.0±3.7 |
| Cmax | mg/L | 154.12±25.56 | 1.23±0.25 |
| AUC(0–t) | mg/L·min | 2037.9±504.5 | 35.9±11.5 |
| AUC(0–∞) | mg/L·min | 2059.8±541.9 | 36.8±10.8 |
| t1/2α | min | 2.7±0.7 | 2.9±0.8 |
| t1/2β | min | 62.6±19.4 | 8.7±2.6 |
| t1/2Ka | min | 1.0±0.3 | 1.5±0.4 |
| CL/F | L/min/kg | 0.015±0.034 | 0.815±0.205 |
| V1/F | L/kg | 0.021±0.06 | 3.238±0.989 |
| MRT(0-t) | min | 30.1±8.9 | 38.8±11.5 |
Tmax: Time to reach maximum plasma concentration; Cmax: Maximum plasma concentration; AUC(0–t): Area under the concentration-time curve from zero up to a definite time t; AUC(0–∞): Area under the concentration–time curve from zero up to infinite time; t1/2β: Half-life of elimination phase; t1/2α: Half-life of distribution phase; t1/2Ka: Half-life of absorption phase; V1/F: Volume of distribution; CL/F: Total clearance; MRT: Mean residence time. Data are expressed as mean±SD.
H2O2-induced PC12 cells injury was significantly reduced by sinomenine
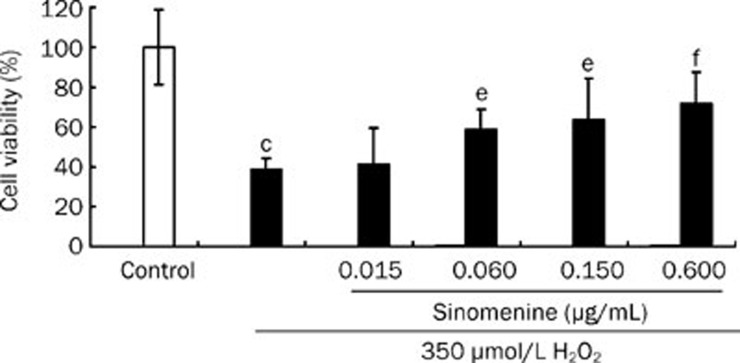
As shown in Figure 5, the viability of cells exposed to 350 μmol/L H2O2 for 4 h, evaluated by determining the percentage of MTT reduction, decreased by 61.25%±5.72% compared with the control (P<0.05). To examine the neuroprotective effects of sinomenine against H2O2-induced cytotoxicity, different concentrations of sinomenine were added to the culture medium 24 h prior to H2O2 treatment and through the end of the recovery period. As shown in Figure 5, pretreatment with sinomenine attenuated H2O2-induced PC12 cell death in a dose-dependent manner, and cell viability increased to 41.00%±7.40%, 59.10%±4.10%, 63.57%±8.10% (P<0.05 vs H2O2) and 72.39%±6.30% (P<0.01 vs H2O2) for sinomenine pretreatment at 0.015, 0.060, 0.150, and 0.600 μg/mL, respectively.
Figure 5.
Sinomenine protected PC12 cells against H2O2 (350 μmol/L for 4 h) induced cytotoxicity. Cell viability was quantified from 6 experiments using the MTT reduction assay. Data are expressed as the mean±SD. cP<0.01 vs control. eP<0.05, fP<0.01 vs H2O2.
Discussion and conclusions
Methods using HPLC and LC-MS/MS were developed for the quantification of sinomenine in plasma and brain samples, respectively. These methods were successfully applied to investigate the pharmacokinetics of sinomenine in rats after administration at a dose of 30 mg/kg ip. Previous reports used HPLC to determine sinomenine in beagle dogs, rats and human plasma10, 11, 13, 14. Liu et al investigated the properties and oral bioavailability in different tissues at a higher dose (90 mg/kg), which is the clinical dose for the treatment of arthritis. However, the therapeutic dose for antinociceptive effects and morphine addiction was measured to be around 30 mg/kg, which is considerably lower. Thus, a new method to improve sensitivity is necessary to study the pharmacokinetics of sinomenine in the CNS at this dose. Only one LC-MS-MS method that shows improved sensitivity has been recommended in the literature to further investigate the metabolism of sinomenine and its metabolites10. To our knowledge, until now, this method had not been used for pharmacokinetic studies. Furthermore, the pretreatment of blood samples in the previous study was overly simple and was not suitable for the detection of sinomenine in the CNS. Therefore, we modified this LC-MS/MS method to maintain good sensitivity and coupled it to pretreatment by precipitation of endogenous substances. We quantified sinomenine standard solutions at two different product ions obtained in different stages of analysis, the m/z 330 precursor ion and its conversion to the m/z 224 product ion. We determined that these ions were the most suitable for the quantification of sinomenine in rat brain homogenate, and these ions did not interfere with endogenous substances or the potential metabolites of sinomenine.
Sinomenine administration has been shown to protect against DA neuron death in rat midbrain neuron-glial cultures at concentrations from sub-picomolar to 10 μmol/L in vitro15. Antinociceptive effects in mice were achieved with repeated subcutaneous administration of sinomenine for 6 d (30 mg/kg, twice daily). In addition, sinomenine at 1 to 10 μmol/L has been shown to activate opioid μ-receptors in CHO cells4. In the present study, after ip administration of sinomenine at a single dose of 30 mg/kg, the Cmax in plasma samples was observed at 10 min and at 15 min in brain samples. These results suggest that sinomenine can be delivered across the blood-brain barrier and can become available in brain tissue soon after its absorption. Administration of sinomenine at the dose of 30 mg/kg in rats was also sufficient to achieve the potential therapeutic level in both plasma and brain tissue, based on our in vitro cell viability tests.
Based on its molecular structure, sinomenine is considered part of the family of dextrorotatory morphinan analogs, and it has been shown to exhibit neuroprotective properties in a variety of experimental models of CNS injury4, 5. Because exogenously administered H2O2 is one of the most widely used methods to induce cytotoxicity 16, 17, 18, we evaluated the neuroprotective effects of sinomenine during H2O2-induced injury in PC12 cells. Pretreatment with sinomenine significantly attenuated H2O2-induced PC12 cell death, in a dose-dependent manner, at a concentration range of 0.060 to 0.600 μg/mL of the drug. The effective dose, determined in the MTT assay was similar to the concentration of sinomenine that was achieved in rat brain tissue after a single dose at 30 mg/kg ip, as determined by our LC-MS/MS method of quantification.
In the present study, HPLC and LC-MS methods were developed and tested for the quantification of sinomenine in plasma and brain samples, respectively. These methods were suitable for pharmacokinetic studies of sinomenine in rats. Our pharmacokinetics studies in the CNS combined with our cell viability assay suggest that sinomenine at the therapeutic dose, 30 mg/kg ip, could provide neuroprotective effects in the CNS.
Author contribution
Fang WANG, Jian-guo CHEN designed research; Li-hong LONG, Peng-fei WU, Xiang-long CHEN performed research; Zui ZHANG, Yu CHEN contributed new reagents, Yi-yong LI, You JIN analyzed data; Li-hong LONG, Peng-fei WU wrote the paper.
Acknowledgments
This work was supported by grants from the National Basic Research Program of China (973 Program) (No 2007CB507404), the Key Project of National Natural Science Foundation of China (NSFC) (No 30930104) to Dr Jian-guo CHEN, and NSFC (No 30801390) to Dr Li-hong LONG. This work was also supported by the Program for New Century Excellent Talents in Universities of China (NCET-08-0225) to Dr Fang WANG.
References
- Liu L, Resch K, Kaever V. Inhibition of lymphocyte proliferation by the anti-arthritic drug sinomenine. Int J Immunopharmacol. 1994;16:685–91. doi: 10.1016/0192-0561(94)90142-2. [DOI] [PubMed] [Google Scholar]
- Liu L, Buchner E, Beitze D, Schmidt-Weber CB, Kaever V, Emmrich F, et al. Amelioration of rat experimental arthritides by treatment with the alkaloid sinomenine. Int J Immunopharmacol. 1996;18:529–43. doi: 10.1016/s0192-0561(96)00025-2. [DOI] [PubMed] [Google Scholar]
- Feng H, Yamaki K, Takano H, Inoue K, Yanagisawa R, Yoshino S. Effect of sinomenine on collagen-induced arthritis in mice. Autoimmunity. 2007;40:532–9. doi: 10.1080/08916930701615159. [DOI] [PubMed] [Google Scholar]
- Wang MH, Chang CK, Cheng JH, Wu HT, Li YX, Cheng JT. Activation of opioid mu-receptor by sinomenine in cell and mice. Neurosci Lett. 2008;443:209–12. doi: 10.1016/j.neulet.2008.07.088. [DOI] [PubMed] [Google Scholar]
- Qian L, Xu Z, Zhang W, Wilson B, Hong JS, Flood PM. Sinomenine, a natural dextrorotatory morphinan analog, is anti-inflammatory and neuroprotective through inhibition of microglial NADPH oxidase. J Neuroinflammation. 2007;4:23. doi: 10.1186/1742-2094-4-23. [DOI] [PMC free article] [PubMed] [Google Scholar]
- Chen SW, Mi XJ, Wang R, Wang WJ, Kong WX, Zhang YJ, et al. Behavioral effects of sinomenine in murine models of anxiety. Life Sci. 2005;78:232–8. doi: 10.1016/j.lfs.2005.04.056. [DOI] [PubMed] [Google Scholar]
- Zhang GM, Mo ZX, Wang CY.Study on the detoxification of alcohol extracts from orientvine and its effective component on withdrawal syndromes of morphine Zhong Yao Cai 2009321414–8.Chinese. [PubMed] [Google Scholar]
- Liu Z, Zheng JF, Yang LQ, Yi L, Hu B.Effects of sinomenine on NO/nNOS system in cerebellum and spinal cord of morphine-dependent and withdrawal mice Sheng Li Xue Bao 200759285–92.Chinese. [PubMed] [Google Scholar]
- Mo ZX, Leung WN, Yung KL.Changes in cAMP and cGMP levels in neonatal rat histaminergic neurons of tuberomammillary nucleus following 48-hour morphine exposure and effects of sinomenine intervention Di Yi Jun Yi Da Xue Xue Bao 2005251105–8.Chinese. [PubMed] [Google Scholar]
- Yao YM, Tan ZR, Hu ZY, Guo X, Cheng ZN, Wang LS, et al. Determination of sinomenine in human plasma by HPLC/ESI/ion trap mass spectrum. Clin Chim Acta. 2005;356:212–7. doi: 10.1016/j.cccn.2005.01.018. [DOI] [PubMed] [Google Scholar]
- Liu ZQ, Chan K, Zhou H, Jiang ZH, Wong YF, Xu HX, et al. The pharmacokinetics and tissue distribution of sinomenine in rats and its protein binding ability in vitro. Life Sci. 2005;77:3197–209. doi: 10.1016/j.lfs.2005.05.054. [DOI] [PubMed] [Google Scholar]
- Chang BB, Zhang L, Cao WW, Cao Y, Yang WL, Wang Y, et al. Pharmacokinetic interactions induced by content variation of major water-soluble components of Danshen preparation in rats. Acta Pharmacol Sin. 2010;31:638–46. doi: 10.1038/aps.2010.27. [DOI] [PMC free article] [PubMed] [Google Scholar]
- Yan XH, Li HD, Peng WX, Liu FQ, Shao Y, He YQ.Determination of sinomenine HCl in serum and urine by HPLC and its pharmacokinetics in normal volunteers Yao Xue Xue Bao 199732620–4.Chinese. [PubMed] [Google Scholar]
- Chen W, Zhou Y, Kang J, Li Q, Feng X.Study on pharmacokinetics and absolute bioavailability of sinomenine in beagle dogs Zhongguo Zhong Yao Za Zhi 200934468–71.Chinese. [PubMed] [Google Scholar]
- Miller ES, Klinger JC, Akin C, Koebel DA, Sonnenfeld G. Inhibition of murine splenic T lymphocyte proliferation by 2-deoxy-D-glucose-induced metabolic stress. J Neuroimmunol. 1994;52:165–73. doi: 10.1016/0165-5728(94)90110-4. [DOI] [PubMed] [Google Scholar]
- Nguyen TT, Cho SO, Ban JY, Kim JY, Ju HS, Koh SB, et al. Neuroprotective effect of Sanguisorbae radix against oxidative stress-induced brain damage: in vitro and in vivo. Biol Pharm Bull. 2008;31:2028–35. doi: 10.1248/bpb.31.2028. [DOI] [PubMed] [Google Scholar]
- Amantea D, Marrone MC, Nistico R, Federici M, Bagetta G, Bernardi G, et al. Oxidative stress in stroke pathophysiology validation of hydrogen peroxide metabolism as a pharmacological target to afford neuroprotection. Int Rev Neurobiol. 2009;85:363–74. doi: 10.1016/S0074-7742(09)85025-3. [DOI] [PubMed] [Google Scholar]
- ArunaDevi R, Lata S, Bhadoria BK, Ramteke VD, Kumar S, Sankar P, et al. Neuroprotective effect of 5,7,3′,4′,5′-pentahydroxy dihdroflavanol-3-O-(2′′-O-galloyl)-beta-d-glucopyranoside, a polyphenolic compound in focal cerebral ischemia in rat. Eur J Pharmacol. 2010;626:205–12. doi: 10.1016/j.ejphar.2009.09.038. [DOI] [PubMed] [Google Scholar]


