

Abstract
Infection of neonatal mice with reovirus T3 Dearing (T3D), the prototypic neurotropic reovirus, causes fatal encephalitis associated with neuronal injury and virus-induced apoptosis throughout the brain. T3D variant K (VarK) is an antigenic variant that has a nearly 1 million-fold reduction in neurovirulence following intracerebral (i.c.) inoculation compared to T3D and a restricted pattern of central nervous system injury with damage limited to the hippocampus, sparing other brain regions. We wished to determine whether the restricted pattern of VarK-induced injury was due to a reduced capacity to replicate in or injure cortical, as opposed to hippocampal, tissue. We found that following i.c. inoculation, VarK grew to similar titers as T3D in the hippocampus but had significantly lower titers in the cortex. Both viruses grew to identical titers and infected the same percentage of cells in mouse primary hippocampal cultures (MHC). In mouse primary cortical cultures (MCC) both the number of infected cells and the viral yield per infected cell were significantly lower for VarK than T3D. VarK-induced apoptosis was limited to the hippocampus in vivo, and in vitro both viruses induced apoptosis equally in MHC but VarK induced significantly less apoptosis than T3D in MCC. Growth of T3D in MCC was reduced to levels comparable to those of VarK following treatment of MCC with caspase inhibitors. Conversely, induction of apoptosis in VarK-infected MCC with fatty acid synthase-activating antibody significantly enhanced viral yield. These results suggest that the decreased neurovirulence of VarK may be due to its failure to efficiently induce apoptosis in cortical neurons.
Experimental reovirus infection is used as a model for studying the roles of viral genes and the proteins they encode in virus-cell interactions in vitro and during pathogenesis in vivo. Type 3 (T3) reoviruses are highly neurovirulent, causing fatal encephalitis in neonatal mice that is associated with massive central nervous system (CNS) apoptosis (13, 16). Differences in the capacity of reovirus strains to infect discrete populations of cells within the CNS and to induce apoptosis are determined by the viral S1 gene (22, 23, 25). Antigenic variants of T3 strain Dearing (T3D) have been generated by incubating T3D with anti-sigma 1 neutralizing monoclonal antibodies (19). Following intracerebral (i.c.) inoculation into newborn mice, the prototypic reovirus antigenic variant K (VarK) has markedly reduced neurovirulence and decreased CNS growth and induces a restricted pattern of CNS injury when compared to the parental virus from which it was derived, T3D (10, 18). These dramatic phenotypic differences are reproduced by a reassortant virus containing the VarK S1 gene, indicating that mutations in this gene alone account for the variant phenotype (10). Nucleotide sequence analysis of the S1 gene indicate that VarK and T3D differ by a single nucleotide change which results in a single amino acid substitution in VarK (K419L) in the globular head domain of sigma 1 (3).
Prior studies indicate that VarK was not restricted for growth in mouse L929 fibroblasts in vitro and that it was able to grow to equivalent titers as T3D in a wide variety of nonneural organs in vivo (18, 19). VarK also retains the capacity to spread within the CNS through neural pathways, another property linked to the S1 gene (10). The mutation in VarK is not associated with either the sialic acid or JAM1 receptor binding domains of sigma 1 (5). The basis for the restricted pattern of CNS injury by VarK and its attenuated growth within the CNS were unknown. We now show that VarK has a selectively reduced capacity to induce apoptosis in the mouse cortex and diencephalon in vivo and in cortical neuronal cultures in vitro. This results in reduced viral growth of VarK in the cortex and diencephalon in vivo and in cortical neurons in vitro compared to that of the wild-type parent strain T3D. Together, these data help explain the restricted pattern of CNS injury and reduced CNS viral growth of VarK.
MATERIALS AND METHODS
Viral infection of mice.
Postnatal day 2 neonatal Swiss-Webster mice were infected with either T3D or variant K via i.c. injection with a 29-gauge needle in a 10-μl volume. Animals were sacrificed 7 days after infection. Control mice were not injected.
Primary neuronal cultures.
Primary cortical and hippocampal cultures were prepared from embryonic day 20 or postnatal day 0 Swiss-Webster mice. Mouse pups were decapitated, brains were removed, and the cingulate frontal cortex and hippocampus were dissected, immediately submerged in ice-cold sterile Hanks buffer (without calcium chloride, magnesium chloride, magnesium sulfate, and phenol red; GibcoBRL, Invitrogen, Carlsbad, Calif.), and then manually dissociated with a 1-ml pipette tip. The percentage of viable cells was quantified by trypan blue staining with a hemocytometer. Cells were plated at densities of 105 cells per ml in poly-d-lysine (PDL)-coated 12-well polystyrene plates or on PDL-laminin 12-mm glass coverslips placed in 6-well plates (BioCoat; BD Biosciences, San Jose, Calif.). Mouse cortical cultures (MCC) were maintained in neurobasal A media (2% B27 [GibcoBRL], 10% fetal bovine serum, 0.5 mM l-glutamine) at 37°C in 5% CO2, and mouse hippocampal cultures (MHC) were maintained in the same media with the addition of 100 μM glutamic acid (Sigma) for the first 4 days in culture. Four days after plating, a 50% medium change was performed, adding fresh media. Cells were allowed to mature for 7 to 10 days before use in experiments. The neuronal and astroglial contents of MCC and MHC were assessed by immunocytochemistry for cell type-specific markers (other CNS cells are present at negligible levels in the cortex and hippocampus of day 0 newborn or day 20 embryonic mice).
Viral growth assays.
Viral growth in mouse brains, MCC, and MHC was assayed by determining virus titers at various times postinfection (p.i.) with a multiplicity of infection (MOI) of 10 by plaque assay on a monolayer of L929 mouse fibroblasts as previously described (10, 14, 21). For some experiments with MCC and MHC, the pancaspase inhibitor ZVAD-FMK (15 μM; Calbiochem, San Diego, Calif.) was added to the cultures immediately following viral infection and was maintained in the media throughout the infection. For some experiments, the apoptosis-inducing activating antibody anti-fatty acid synthase (FAS) (0.5 μg/ml; Upstate Biotech, Waltham, Mass.) was added to the cultures immediately following viral infection and was maintained in the media throughout the infection.
Histology.
For histologic analysis, mouse brains were fixed by immersion in 10% buffered formalin for 18 to 30 h at room temperature (RT), transferred to 70% ethanol, paraffin embedded, and sectioned at a 4-μm thickness. For each animal, a coronal section that showed cingulate gyrus, hippocampus, and thalamus was stained with hematoxylin and eosin for studies to determine the extent of virus-induced pathology.
Apoptosis assays.
Cell monolayers were virus infected with an MOI of 100. Apoptotic cells were identified by evaluating nuclear morphology at various times following reovirus infection by staining fixed cells with the fluorescent nuclear DNA intercalating dye Hoechst 33342 (Molecular Probes, Eugene, Oreg.) as previously described (16). A biotin-streptavidin-based terminal deoxynucleotidyltransferase-mediated dUTP-biotin nick end labeling (TUNEL) kit optimized for neuronal tissues and cells was used (NeuroTACS II; Trevigen, Gaithersburg, Md.). At 48 h following reovirus infection, cells were fixed with 3.7% formaldehyde-phosphate-buffered saline (PBS) for 10 min, postfixed in methanol for 20 min, and then permeabilized in Neuropore (Trevigen) for 30 min at RT under hydrophobic coverslips. For each condition, the percentage of TUNEL-positive cells was determined by counting 300 cells in at least three individual samples. Caspase 3 activity in reovirus-infected (MOI, 100) and mock-infected primary cortical and hippocampal cultures was detected via the ApoAlert caspase 3 activity fluorometric assay (Clontech, Palo Alto, Calif.) as previously described (11). Samples were transferred to 96-well enzyme-linked immunosorbent assay plates for detection of fluorescent activity with a fluorimeter (Cytofluor series 4000; PerSeptive Biosystems) set with a 400-nm excitation filter and a 505-nm emission filter.
Immunocytochemistry and immunohistochemistry.
For viral antigen detection, T3D- and VarK-infected (MOI, 100) MCC and MHC were grown on PDL-coated glass coverslips, fixed at various times following virus infection with 3.7% formaldehyde-PBS for 30 min at RT, and permeabilized with PBS-0.1% Triton X-100 (PBSX). Primary antibody (diluted 1:100 in 3% bovine serum albumin [BSA]-PBSX) was incubated at 4°C overnight, washed in PBSX, and then incubated with secondary antibody for 1 h at RT in the dark. After immunocytochemistry, nuclei of cells were labeled with Hoechst 33342-PBS, aqueous mounted with Vectashield, sealed with nail polish, and stored at 4°C until imaging as described for TUNEL. Double labeling of cultures was as previously described (16).
For immunohistochemistry, mouse brains were fixed in 10% buffered formalin, paraffin embedded, processed, and sectioned (4-μm thickness), and then sections were deparaffinized by baking at 57°C for 5 min followed by immersion in mixed xylenes and rehydration in a series of descending ethanol concentrations followed by PBS. For viral antigen staining, brain tissue sections were permeabilized with Neuropore (Trevigen) for 30 min at RT, blocked for 1 h in 5% BSA-PBSX (PBS with 0.1% Triton X-100), and then incubated for 1 h at 37°C with anti-T3D polyclonal antisera at a 1:100 dilution in 3% BSA-PBSX (21). Sections were washed twice in PBSX, incubated for 30 min in the dark with secondary antibody anti-rabbit Alexa Fluor 594 (1:100; Molecular Probes) and Neurotrace Alexa Fluor 430 Nissl (1:50; Molecular Probes) in 1.5% BSA-PBSX. Sections were washed three times in PBSX, aqueous mounted with Vectashield (Vectorlabs, Burlingame, Calif.), sealed with nail polish, and stored at 4°C until imaging. Immunohistochemistry for activated caspase 3 was as previously described (15, 16).
RESULTS
VarK injures only a subset of neurons that are susceptible to T3D-induced injury.
T3D causes neuronal injury and death throughout the neonatal mouse CNS, with particularly severe injury seen in the cingulate gyrus, frontoparietal cortex, subiculum, CA1 to CA4 regions of the hippocampus, and several thalamic nuclei (20). In contrast, previous studies found that VarK-induced injury is almost exclusively restricted to the hippocampus (Fig. 1A to C) (18). VarK is much less neurovirulent than T3D, which causes fatal encephalitis in 100% of infected neonatal mice at doses as low as 10 PFU by 14 days p.i. by i.c. inoculation. In contrast, 90% of mice i.c. infected with the highest possible dose of VarK (greater than 3 × 10⁷ PFU) never develop encephalitis and survive beyond 14 days p.i. (19). We now report that VarK-infected neonatal mice survive into adulthood with no observable neurologic deficits and no detectable virus in the brain at 6 or 12 weeks after infection, indicated by the absence of reovirus antigen as detected by immunohistochemistry (data not shown). Histologic analysis of brains from these mice revealed prominent lesions in the CA2 to CA4 regions of the hippocampus associated with cellular debris and evidence of some infiltrating immune cells but no gliosis (identified by morphology) (Fig. 1E). This indicates that VarK-induced injury remains restricted to the hippocampus throughout the course of the infection and that virus has been cleared from the brain by 6 weeks p.i.
FIG. 1.

VarK injures only a subset of neurons that are susceptible to T3D-induced injury, resulting in long-term loss of hippocampal cells after clearance of the virus. (A) Coronal brain section from an uninfected mouse 9 days (d) postnatal shows normal cytoarchitecture with hematoxylin and eosin histologic stain. (B) Brain section from VarK-infected mouse 7 days p.i. and 9 days postnatal shows normal cytoarchitecture and no evidence of neuronal loss in the cortical and thalamic areas but shows viral injury in the CA2 to CA3 region of the hippocampus, indicated by neuronal death and minor inflammation. (C) Brain section from a T3D-infected mouse 7 days p.i. and 9 days postnatal shows abnormal cytoarchitecture, massive cell loss, and minor inflammation throughout the cortical, hippocampal, and thalamic regions. T3D-infected mice die 7 to 9 days p.i. (D) Brain section from an uninfected mouse at 12 weeks (84 days) postnatal shows normal brain cytoarchitecture. (E) Brain section from a VarK-infected mouse 82 days p.i. and 84 days postnatal. CG, cingulate gyrus; FPX, frontoparietal cortex; S, subiculum; DG, dentate gyrus; THA, thalamic nuclei. Arrows point to areas of severe viral injury. These tissue sections are representative of data from the results of 4 studies with at least 8 mice per treatment group in each study.
VarK grows as well as T3D in the hippocampus but does not grow in other brain regions that support robust growth of T3D.
The hippocampal restriction of VarK-induced CNS injury could result either from an enhanced susceptibility of hippocampal compared to cortical neurons to VarK-induced injury or by the reduced capacity of VarK to grow in the cortex compared to the hippocampus. Therefore, to better understand the altered pattern of CNS pathogenesis of VarK, we evaluated VarK growth in various brain regions and expression of VarK antigen throughout the brain. VarK has attenuated growth in whole-brain lysates compared to T3D (10, 18); however, differences in the capacity of VarK and T3D to grow in individual brain regions have not been previously assessed. We therefore compared growth of T3D and VarK in tissue microdissected from the hippocampus and cortex (frontoparietal cortex and cingulate gyrus combined) at 7 days following i.c. inoculation of viruses into newborn mice. T3D grew well in all brain regions, reaching viral titers of 109 PFU/ml in the cortex and >108 PFU/ml in the hippocampus and cerebellum (Fig. 2A). VarK grew to nearly the same titter as T3D in the hippocampus but reached a peak titer of <106 PFU/ml in the cortex, >1,000-fold less than that achieved by T3D.
FIG. 2.

VarK grows as well as T3D in the hippocampus but does not grow in other brain regions that support robust growth of T3D. (A) VarK did not grow as well as wild-type T3D in the cortex (cingulate gyrus [CG] combined with frontoparietal cortex [FPX]) or cerebellum (CRB), however VarK and T3D grew to similar titers in the hippocampus (HPC). These data are brain region viral titers from day 7 p.i. *, P < 0.01 for T3D compared to VarK titer by Tukey-Kramer. These tissue sections are representative of data from the results from 2 studies with 3 mice per treatment group in each study. (B) The coronal section of the brain from a mouse i.c. inoculated with VarK 7 days p.i. immunohistochemically stained for reovirus antigen shows that viral antigen is restricted to the CA2 to CA4 regions of the hippocampus (red staining is positive). (C) A brain section from a mouse i.c. inoculated with T3D 7 days p.i. stained for reovirus antigen shows strong positive staining (red cells) throughout the cortical, hippocampal, and thalamic regions of the brain. All neurons in brain tissue sections were counterstained with fluorescent Nissl stain (green cells). These tissue sections are representative of data from the results from 4 studies with at least 8 mice per treatment group in each study.
We next compared the distribution of viral antigen in the brain by immunocytochemistry. In VarK-infected brains, viral antigen was found exclusively in the CA2-CA4 region of the hippocampus (Fig. 2B) in striking contrast to T3D infection, following which antigen was detected throughout the cortex, CA2-CA4 region of the hippocampus, thalamus (Fig. 2C), and cerebellum (data not shown). Taken together, these data indicate that although both T3D and VarK grow almost equally well in the hippocampus, by contrast, growth of VarK is markedly attenuated in other brain regions that are readily infected by T3D.
VarK induces apoptosis in the hippocampus but not in other regions of the CNS in infected mice.
It has previously been shown that apoptosis is the major mechanism by which T3 reoviruses induce injury in the CNS (13, 16). We therefore wished to determine whether VarK and T3D differed in their capacity to induce apoptosis in vivo and whether this correlated with differences in their patterns of replication. At 7 days following i.c. inoculation of neonatal mice with T3D or VarK, we analyzed the brains of infected mice for evidence of apoptosis by TUNEL staining and staining for the activated form of the key apoptotic effector caspase, caspase 3. In VarK-infected brains, apoptosis was limited to the CA2-CA4 region of the hippocampus, the identical anatomic site in which the largest amount of viral antigen was detected by immunocytochemistry (compare Fig. 2B to 3B). By contrast, as previously reported (13, 16), T3D produced apoptosis throughout the cortex, thalamus, and hippocampus, again corresponding to regions of peak viral antigen detection (Fig. 3C). Since VarK was clearly able to induce apoptosis in the hippocampus, it did not have a global defect in its capacity to induce neuronal apoptosis. However, in comparison to T3D, VarK showed a striking regional restriction in apoptosis induction, failing to induce apoptosis in the cortex, thalamus, or cerebellum.
FIG. 3.

VarK induces apoptosis in the hippocampus but not in other regions of the CNS in infected mice. (A) A coronal section from an uninfected mouse at 9 days postnatal shows few apoptotic cells as detected by immunohistochemistry for activated caspase 3. (B) A brain section from a VarK-infected mouse 7 days p.i. shows apoptotic neurons positive for activated caspase 3 (brown cells) in the CA2 to CA4 regions of the hippocampus with very few apoptotic cells present in the cortical or thalamic regions. (C) A brain section from a T3D-infected mouse 7 days p.i. shows massive apoptosis throughout the brain regions displayed, as indicated, by cells positive for activated caspase 3 staining in the cortical, hippocampal, and thalamic areas. In both T3D- and VarK-infected mice, regions of apoptotic cells correspond to the regions of viral injury and those positive for viral antigen as seen in Fig. 1 and 2, respectively. All brain sections were counterstained with a blue stain. Arrows point to areas of strong activated caspase 3 staining. These tissue sections are representative of data from the results from 3 studies with at least 8 mice per treatment group in each study.
The capacity of VarK to induce apoptosis and grow in primary hippocampal and cortical neuronal cultures parallels its in vivo phenotype.
Our results in vivo indicated that there was an almost perfect correlation between the growth of VarK and its capacity to induce apoptosis but did not indicate which was the key causal factor. Thus, this correlation may have resulted from the fact that apoptosis is required for optimal viral growth and that a reduced capacity of VarK to induce apoptosis in the cortex and other regions may have resulted in impaired replication, thus limiting viral growth and virus-induced injury to that brain region. Conversely, optimal viral growth may be required for apoptosis induction, with VarK's impaired replication in the cortex and other regions resulting in an attenuated capacity to induce apoptosis and produce histopathological injury. To investigate this issue further, we examined the capacity of VarK and T3D to grow and induce apoptosis in primary neuronal cultures derived from the hippocampus and cortex.
Primary neuronal cultures derived from the hippocampus (MHC) and cortex (MCC) of postnatal day 0 mice were prepared as described (see Materials and Methods) and infected at 7 to 10 days postisolation with either T3D or VarK at an MOI of 10. Both MCC and MHC have 75 to 95% neuronal content as quantified by dual immunocytochemical staining for microtubule-associated protein 2 (MAP2), a neuronal marker, and glial fibrillary acidic protein (GFAP), an astroglial marker (Fig. 4A to H). Other CNS cells such as oligodendrocytes and microglia (identified morphologically) are not present in these cultures; furthermore, neuronal cultures are maintained in serum-free media to inhibit the growth of nonneuronal cells. Both T3D and VarK infected only neurons in both MCC and MHC, as seen previously in MCC prepared for studies by Richardson-Burns et al. (16). Here we show dual label immunocytochemistry for the neuronal nuclei marker (NeuN) and reovirus antigen (Fig. 4I to L) (16). Both T3D and VarK grew with identical kinetics and reached identical peak titers in MHC (Fig. 5A). Conversely, in MCC, VarK grew to significantly lower titers (>10-fold less) than T3D (Fig. 5B). We found similar viral titers at 0 h p.i. (cells were exposed to virus for 1 h and washed three times, and then viral titer was measured) in MCC infected with either VarK or T3D, suggesting that VarK is not deficient in its capacity to attach to cellular receptors on MCC compared to MHC.
FIG. 4.

MCC and MHC are 75 to 95% neuronal, and only neurons are infected by T3D or VarK. (A) Nuclei in MCC prepared from E20-P0 stained with the fluorescent nuclear dye Hoechst 33342. Magnification, ×100. (B) Neurons in MCC immunocytochemically detected with anti-MAP2 (Alexa Fluor 594; red staining) show both pyramidal neurons (larger with long processes) and interneurons (smaller with little or no processes). (C) Astroglia in MCC stained with anti-GFAP (green staining) show a few positive cells. (D) The merged image shows that most cells in the culture are neurons. (E) Nuclei in MHC prepared from E20-P0 stained with the fluorescent nuclear dye Hoechst 33342. (F) Neurons in MHC immunocytochemically detected with anti-MAP2 (Alexa Fluor 594; red staining) show both pyramidal neurons (larger with long processes) and interneurons (smaller with little or no processes). (G) Astroglia in MHC stained with anti-GFAP (green staining) show a few positive cells. (H) The merged image shows that most cells in the culture are neurons. (I) T3D-infected MCC dual labeled for reovirus antigen (anti-T3D polyclonal, green staining) and the neuronal nucleus marker NeuN (Cy3; red staining) shows that infected cells (antigen in cytoplasm) are neurons. Magnification, ×400. (J) T3D-infected MHC dual labeled for reovirus antigen (green) and the neuronal nucleus marker NeuN (red). (K) VarK-infected MCC dual labeled for reovirus antigen (green) and the neuronal nucleus marker NeuN (red). (L) VarK-infected MHC dual labeled for reovirus antigen (green) and the neuronal nucleus marker NeuN (red).
FIG. 5.
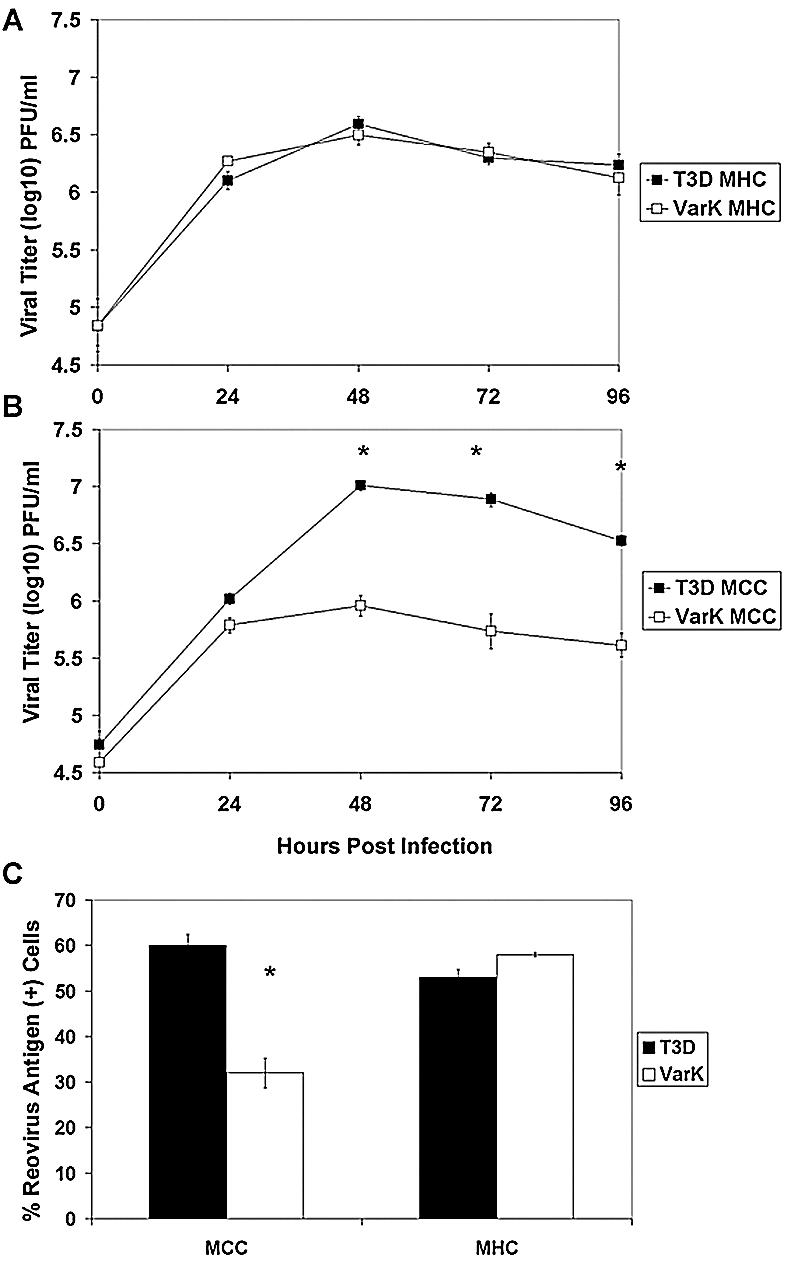
Capacity of VarK to infect and grow in primary hippocampal and cortical neuronal cultures parallels its in vivo phenotype. (A) T3D and VarK grow to similar titers in MHC; (B) in MCC, T3D grows significantly better than VarK. *, P < 0.05 by Tukey-Kramer. (C) MCC and MHC were infected with either T3D or VarK, and immunocytochemistry was performed to detect the percentage of virus-infected cells at 48 h p.i. The percentage of cells positive for viral antigen was quantified in each culture. *, P < 0.01 by Tukey-Kramer. These data are representative of viral growth assays performed for at least three individual samples of primary cultures from three to four different culture preparations.
To determine whether differences in virus titer were the result of fewer infected cells per culture or lower viral yield per infected cell, we performed immunocytochemistry on infected cultures. Both T3D and VarK infected a similar percentage of cells in MHC; however, in MCC, VarK infected approximately 50% fewer cells than T3D (Fig. 5C). This represents a significantly different percentage of infected MCC for T3D versus VarK, yet this does not completely account for the >10-fold (1 log) difference in virus titer seen between the two viruses in MCC (Fig. 5B). These results suggest that the yield of VarK per infected cell was identical to that of T3D in the hippocampal cultures but lower than that of T3D in the cortical cultures.
We next wished to compare the capacity of VarK and T3D to induce apoptosis in MCC and MHC by TUNEL. We found that VarK and T3D induced almost identical levels of apoptosis in MHC; however, VarK induced significantly less apoptosis than T3D in MCC (Fig. 6A). To confirm these results, we measured levels of activated caspase 3, the key apoptosis effector caspase, in infected cell lysates (Fig. 6B). We found that VarK induced significantly less caspase 3 activation than did T3D in MCC but not MHC. Thus, our results in primary neuronal cultures replicated our findings in vivo. VarK and T3D grow to identical titers and induce similar amounts of apoptosis in MHC, but VarK has both reduced growth and decreased apoptosis in MCC.
FIG. 6.
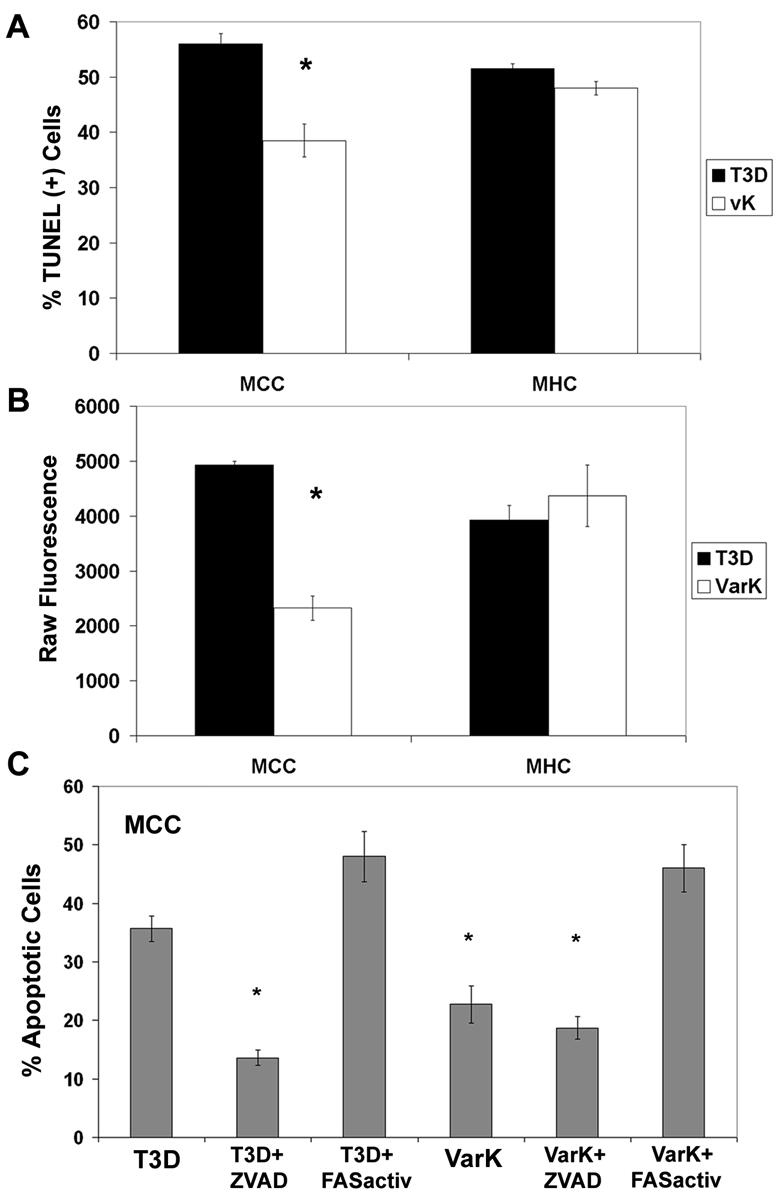
VarK induced significantly less apoptosis than T3D in MCC, but in MHC, VarK and T3D kill an equal percentage of cells. (A) TUNEL, a marker for apoptosis-associated DNA fragmentation, was performed on MCC, and MHC were infected with either T3D or VarK at 48 h p.i. Significantly fewer MCC were TUNEL positive after VarK infection than after T3D infection, whereas T3D- and VarK-infected MHC had similar percentages of TUNEL-positive cells. (B) Another assay for apoptosis which detects the total level of activated caspase 3, an apoptosis-specific protease in cell lysate, by fluorogenic substrate cleavage. Increases in raw fluorescence of the cell lysate correspond to increases in levels of activated caspase 3 present in the lysate. By 24 h p.i., there was significantly more activated caspase 3 in T3D-infected MCC than in VarK-infected MCC. At the same time, activated caspase 3 levels in MHC infected with T3D or VarK were the same. *, P < 0.01 by Tukey-Kramer. These data are representative of apoptosis assays performed with at least three individual samples of primary cultures from three to four different culture preparations. (C) Apoptosis morphology assay (percent apoptosis in mock-infected control MCC subtracted from all treatments) at 48 h p.i. in MCC infected with either T3D or VarK (MOI of 100) and treated with caspase inhibitor ZVAD (25 μM in dimethyl sulfoxide), anti-FASactiv (0.25 μg/ml), or dimethyl sulfoxide (vehicle control). *, P < 0.01 by Tukey-Kramer.
Inhibiting apoptosis reduces growth of T3D and augmenting apoptosis enhances growth of VarK in cortical neurons.
Having shown that VarK is associated with reduced growth and decreased apoptosis induction both in vitro and in vivo, it was still not clear whether this was due to an impaired capacity of VarK to induce apoptosis, resulting in reduced viral growth, or vice versa. Therefore, we wished to determine whether inhibiting the apoptosis-inducing capacity of T3D would attenuate its growth and, conversely, whether augmenting the apoptosis-inducing capacity of VarK would enhance its growth. Previous studies on T3D-induced neuronal apoptosis indicated that peptide caspase inhibitors are potent blockers of T3D-induced apoptosis in neurons; hence, ZVAD-FMK, a pancaspase inhibitor, was used to inhibit apoptosis in this experiment. Since it had previously been shown that the death receptor FAS-FAS ligand system was important in mediating reovirus-induced apoptosis in primary neuronal cultures (16), we tested whether an antibody which binds and activates the death receptor FAS (anti-FASactiv), inducing apoptosis in MCC, can function as a possible reagent for augmenting virus-induced apoptosis.
As previously reported (16), T3D-induced apoptosis in MCC is significantly inhibited by the pancaspase inhibitor ZVAD-FMK (P < 0.001) (Fig. 6C). ZVAD treatment decreases percentage of apoptosis in T3D-infected MCC to levels closer to that seen in VarK-infected MCC; however, treatment of VarK-infected MCC with ZVAD does not further reduce the level of virus-induced apoptosis. Anti-FASactiv induces apoptosis in MCC similarly to levels seen with T3D infection (data not shown) and significantly increases the level of apoptosis in both T3D- and VarK-infected MCC compared to either virus alone (P < 0.05) (Fig. 6C) or virus-plus-control nonactivating FAS antibody (anti-FASneg) (data not shown). Therefore, we used anti-FASactiv as an apoptosis-inducing reagent in VarK-infected MCC to determine whether increasing the capacity of VarK to induce apoptosis in MCC could increase VarK titer.
We found that treatment with ZVAD (25 μM) significantly reduced T3D virus titer and viral yield in MCC but had no effect on viral growth in VarK-infected MCC (Fig. 7A and C). The virus titer in ZVAD-treated T3D-infected MCC was virtually identical to that seen following VarK infection, and viral yield per cell was actually lower than that seen following VarK infection (Fig. 7C). The T3D titer in infected MCC was also significantly reduced by DEVD-FMK (15 μM), a caspase 3-specific peptide inhibitor, but not by YVAD-FMK (15 μM), a caspase 1-specific inhibitor (Fig. 7E). This is consistent with previous studies indicating that T3 reovirus-induced apoptosis is not associated with caspase 1 activation, further supporting the idea that reovirus-induced apoptosis is mediated by specific virus-activated cellular signaling (11). These results clearly indicate that inhibition of apoptosis can inhibit growth and yield of T3D in neurons (Fig. 7E). No caspase inhibitor changed the VarK titer in MCC (Fig. 7A and E).
FIG. 7.

Inhibiting apoptosis reduces growth of T3D, and augmenting apoptosis enhances growth of VarK in cortical neurons. (A) ZVAD treatment of T3D-infected MCC but not VarK-infected MCC results in a significant reduction in viral titer by 48 h p.i. Viral titer and the growth kinetics of ZVAD-treated T3D-infected MCC resembled those of VarK-infected MCC. *, P < 0.01 for T3D versus T3D plus ZVAD by Tukey-Kramer). (B) Anti-FASactiv (0.25 μg/ml) added at 18 h p.i. to T3D- or VarK-infected MCC significantly increased VarK viral titer in MCC but did not increase titer to levels seen in T3D-infected MCC. *, P < 0.05 for T3D versus VarK plus FASactiv and VarK plus FASactiv versus VarK by Tukey-Kramer). (C) ZVAD treatment of T3D-infected MCC reduces viral yield in MCC compared to untreated T3D-infected cells. Viral yield was calculated by dividing the total viral titer at one time point by the viral titer at time 0 h p.i. (D) Anti-FASactiv treatment increased VarK viral yield compared to untreated VarK-infected MCC at all times p.i. after addition to the cultures. (E) Viral titer at 48 h p.i. for T3D- and VarK-infected MCC treated with either vehicle (2 μl of dimethyl sulfoxide), caspase 3 inhibitor DEVD (15 μM in dimethyl sulfoxide), or caspase 1 inhibitor YVAD (15 μM in dimethyl sulfoxide). As previously seen, T3D and VarK have significantly different titers at 48 h p.i. in MCC. **, P < 0.01. DEVD but not YVAD treatment significantly reduced T3D viral titer at 48 h p.i., bringing the T3D titer to the same level as the VarK titer. *, P < 0.05. Neither treatment has an effect on VarK titer. (F) Viral titers of T3D and VarK at 48 h p.i. in MCC treated with either vehicle (2 μl of PBS), anti-FASactiv or anti-FASnegative antibody (control antibody, 0.25 μg in 2 μl of PBS). Anti-FASactiv but not FASneg antibody significantly increased VarK viral titer in MCC at 48 h p.i. *, P < 0.05 for VarK plus FASactiv versus VarK. Neither antibody had an effect on the T3D viral titer. These data are representative of viral growth assays performed with primary cultures from at least four different culture preparations and apoptosis assays performed with two MCC preparations.
Having shown that inhibition of apoptosis could decrease viral growth and yield in cortical cultures, we next wished to see whether augmentation of apoptosis would enhance the replication of VarK in MCC. Infected MCC were exposed to the FAS-activating antibody, anti-FASactiv (0.25 μg/ml), at 18 h p.i., a time p.i. at which previous studies indicate that virus-induced neuronal apoptosis is under way in T3D-infected MCC (16). Treatment of VarK-infected cells with anti-FASactiv significantly increased both titer and viral yield of VarK (Fig. 7B and D). Despite an increasing percentage of apoptosis in T3D-infected MCC (Fig. 6C), anti-FASactiv did not further increase T3D titer, suggesting that T3D is already growing maximally in MCC (Fig. 7B and F). A FAS-negative control antibody which binds the FAS receptor but does not activate associated apoptotic signaling cascades did not increase VarK or T3D virus titer in MCC, indicating that the increased VarK titer seen in MCC treated with FAS activator is not nonspecifically associated with treatment of MCC with a FAS antibody (Fig. 7F). Taken together, these results suggest that differences in the capacity of T3D and VarK to induce apoptosis may be responsible for differences in their patterns of growth in specific neuronal populations. This idea is further supported by our data showing that a higher percentage of virus-induced apoptosis in MCC corresponds with increased viral yields (Fig. 8A and B). Treatments that reduce virus-induced apoptosis, such as exposure to caspase inhibitors, reduce viral yield, and on the other hand, the attenuated virus VarK that normally produces low viral yields grows significantly better in the presence of an apoptosis inducer.
FIG. 8.
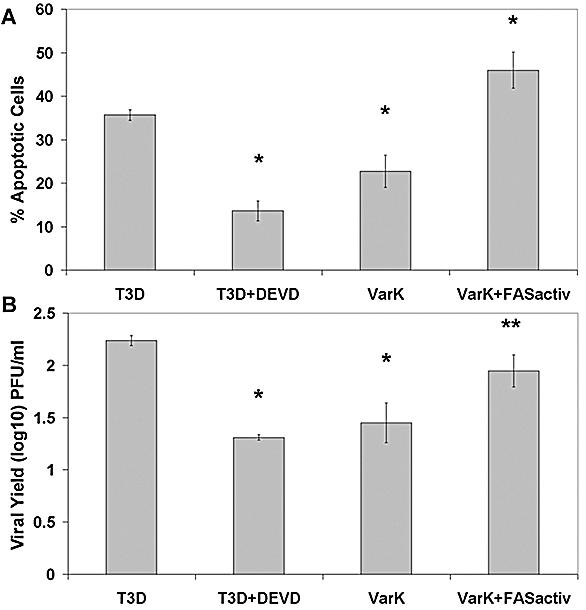
Higher percentage of apoptosis in MCC corresponds to higher viral yield. (A) The percentage of apoptosis was quantified at 48 h p.i. in T3D, T3D plus DEVD, VarK, or VarK plus FASactivating antibody-treated MCC. T3D induced significantly greater levels of apoptosis than T3D plus DEVD or VarK alone. *, P < 0.01. T3D alone was not different than VarK plus FASactiv. T3D plus DEVD was not different than VarK alone. The percentage of apoptosis in control mock-infected MCC was subtracted from each treatment prior to graphing. Apoptosis was measured by staining fixed cells with Hoechst 3342 and counting cells with condensed and/or fragmented nuclei. (B) The viral yield in MCC at 48 h p.i. was quantified for each treatment: T3D, T3D plus DEVD, VarK, or VarK plus FASactiv. DEVD treatment significantly inhibited T3D growth, making T3D plus DEVD titers similar to that of VarK alone. *, P < 0.01. VarK grew significantly better in the presence of FASactiv, growing to titers similar to those with T3D. **, P < 0.05.
DISCUSSION
In this study, we investigated whether the neurovirulence of T3 reoviruses is linked to the capacity to induce apoptosis by examining two reovirus strains that differ greatly in neurovirulence. VarK, a reovirus antigenic variant, differs from its parent strain T3D by only a single amino acid change in the viral cell attachment protein, sigma 1. Several key differences in the pathogenesis of reovirus strains have been linked to the sigma 1 protein, including differences in the patterns of tropism within and spread to the CNS (24, 26), the capacity to induce apoptosis (1, 2, 4, 8), and differences in the capacity to bind to cell surface receptors, including sialic acid. Prior studies of VarK indicate that the striking differences in neuropathogenesis between this virus and T3D are not likely due to the inability of this virus to spread to or within the CNS (10) or to bind to either sialic acid-containing or JAM1 reovirus receptors, despite proximity of the VarK mutation to the JAM receptor binding site (5).
T3D administered by either intraperitoneal or i.c. injection causes severe neuronal injury and death throughout the neonatal mouse CNS, whereas VarK induces CNS injury only after i.c. injection and the injury is restricted to the CA2 to CA4 regions of the hippocampus (10, 18, 19, 25). Since VarK is not deficient in its capacity to spread within the CNS or in its potential to bind cellular receptors, we asked whether the restricted pattern of tissue injury by VarK was due to either its inability to grow in or injure cortical as opposed to hippocampal neurons. We found in both infected mouse brain and in primary neuronal cultures that VarK was as competent as T3D to grow in and injure hippocampal neurons. By contrast, both in vivo and in vitro VarK had a markedly reduced capacity to grow in and injure cortical neurons compared to T3D. It was previously shown that CNS injury induced by T3 reoviruses results from apoptosis and that apoptotic injury was limited to regions of viral growth, as determined by immunocytochemical detection of viral antigen (13, 16), and a similar correlation in VarK-infected brains was found. These results clearly indicate that the restricted CNS injury induced by VarK is associated with both decreased viral replication and impaired apoptosis.
Since VarK showed both impaired growth and decreased capacity to induce apoptosis, it is not possible to definitively determine which of these two phenomena is the key causal event. Decreased growth may have resulted in decreased capacity to induce apoptosis, or conversely, decreased capacity to induce apoptosis may have inhibited viral growth and spread. It was previously shown that apoptosis induction does not require viral growth (17), and in fact, there is little correlation in continuous nonneuronal cell lines between the efficiency of reovirus replication and the capacity of viruses to induce apoptosis. For example, both T1L and T3D grow to approximately equivalent titers in L929 fibroblasts, yet T3D induces apoptosis far more efficiently in these cells than T1L (23). Similarly, T1L grows better than T3D in MDCK cells, yet T3D induces significantly more apoptosis (17). However, in several systems, inhibition of apoptosis has led to a modest but reproducible decrease in virus titer in reovirus T3-infected cells, suggesting that apoptosis may be required for maximal replication efficiency of T3 reoviruses both in vitro and in vivo.
We found that inhibiting apoptosis in primary cortical cultures by treatment of cells with a pancaspase inhibitor or a caspase 3 inhibitor significantly reduced T3D viral growth, making the T3D growth curve resemble that of VarK. These results provide the clearest evidence to date, suggesting that apoptosis is required for maximal replication of T3 reoviruses. Interestingly, treatment of T3D-infected cortical cultures with a caspase 1 inhibitor did not significantly reduce virus titer. Previous studies in our laboratory indicate that caspase 3, but not caspase, plays a key role in T3 reovirus-induced apoptotic signaling; thus, our findings here further support the idea that virus-activated apoptotic signaling has a role in viral growth (11, 16). In contrast to that seen with apoptosis inhibitors in T3D-infected cortical cultures, treating VarK-infected cortical cultures with an apoptosis-inducing agent significantly enhanced the VarK titer in the cells, although this treatment did not restore the yield of VarK to wild-type (T3D) levels. These data support the idea that VarK has a defect in its capacity to induce apoptosis which is associated with reduced growth in certain types of neurons and support the idea that induction of apoptosis is an important mechanism of viral neuropathogenesis. A similar phenomenon has been seen following Sindbis virus infection, in which coincident overexpression of the antiapoptotic protein Bcl-2 inhibits viral growth and reduces neurovirulence (12).
The explanation for the cell type specificity of VarK's effects remains to be established, as the defects in replication and apoptosis do not occur in hippocampal neurons but are clearly manifested in cortical neurons. The sigma 1 protein plays a key role in the activation of cellular signaling pathways, leading to the activation of specific cellular transcription factors, including NF-κB (6, 9) and c-Jun (7), and to the selective activation of mitogen-activated protein kinase cascades that play a critical role in apoptosis induction (27). It remains to be seen whether the mutant sigma 1 protein is only capable of inducing these events in hippocampal as opposed to cortical cultures. Perhaps the mutant protein is defective in its capacity to interact with key host signaling proteins that either differ or are only required in one type of cells but not another.
In conclusion, we show that the altered neurovirulence of VarK is associated with a reduced capacity to induce apoptosis and grow in selected populations of neurons compared with the wild-type parent strain T3D. Our findings suggest that the deficiency in the capacity of VarK to induce apoptosis in cortical as opposed to hippocampal neurons may in turn reduce the efficiency of viral replication. Induction of apoptosis is likely to be an important mechanism for efficient production of viral progeny following T3D infection in the CNS. Further elucidation of the basis for the selective vulnerability of specific neuronal populations to reovirus-induced apoptosis may help shed light on the key cellular proteins and signaling pathways involved in neuronal cell death.
Acknowledgments
This work was supported by Merit and REAP grants from the Department of Veterans Affairs, a U.S. Army Medical Research and Material Command (USAMRMC) grant (DAMD17-98-1-8614), and the Reuler-Lewin Family Professorship of Neurology (K.L.T.).
REFERENCES
- 1.Barton, E. S., J. L. Connolly, J. C. Forrest, J. D. Chappell, and T. S. Dermody. 2001. Utilization of sialic acid as a coreceptor enhances reovirus attachment by multistep adhesion strengthening. J. Biol. Chem. 276:2200-2211. [DOI] [PubMed] [Google Scholar]
- 2.Barton, E. S., J. C. Forrest, J. L. Connolly, J. D. Chappell, Y. Liu, F. J. Schnell, A. Nusrat, C. A. Parkos, and T. S. Dermody. 2001. Junction adhesion molecule is a receptor for reovirus. Cell 104:441-451. [DOI] [PubMed] [Google Scholar]
- 3.Bassel-Duby, R., D. R. Spriggs, K. L. Tyler, and B. N. Fields. 1986. Identification of attenuating mutations on the reovirus type 3 S1 double-stranded RNA segment with a rapid sequencing technique. J. Virol. 60:64-67. [DOI] [PMC free article] [PubMed] [Google Scholar]
- 4.Chappell, J. D., V. L. Gunn, J. D. Wetzel, G. S. Baer, and T. S. Dermody. 1997. Mutations in type 3 reovirus that determine binding to sialic acid are contained in the fibrous tail domain of viral attachment protein sigma1. J. Virol. 71:1834-1841. [DOI] [PMC free article] [PubMed] [Google Scholar]
- 5.Chappell, J. D., A. E. Prota, T. S. Dermody, and T. Stehle. 2002. Crystal structure of reovirus attachment protein sigma1 reveals evolutionary relationship to adenovirus fiber. EMBO J. 21:1-11. [DOI] [PMC free article] [PubMed] [Google Scholar]
- 6.Clarke, P., S. M. Meintzer, L. Moffitt, and K. L. Tyler. 2003. Two distinct phases of virus-induced NF-kappaB regulation enhance TRAIL-mediated apoptosis in virus-infected cells. J. Biol. Chem. 278:18092-18100. [DOI] [PubMed] [Google Scholar]
- 7.Clarke, P., S. M. Meintzer, C. Widmann, G. L. Johnson, and K. L. Tyler. 2001. Reovirus infection activates JNK and the JNK-dependent transcription factor c-Jun. J. Virol. 75:11275-11283. [DOI] [PMC free article] [PubMed] [Google Scholar]
- 8.Connolly, J. L., E. S. Barton, and T. S. Dermody. 2001. Reovirus binding to cell surface sialic acid potentiates virus-induced apoptosis. J. Virol. 75:4029-4039. [DOI] [PMC free article] [PubMed] [Google Scholar]
- 9.Connolly, J. L., S. E. Rodgers, P. Clarke, D. W. Ballard, L. D. Kerr, K. L. Tyler, and T. S. Dermody. 2000. Reovirus-induced apoptosis requires activation of transcription factor NF-κB. J. Virol. 74:2981-2989. [DOI] [PMC free article] [PubMed] [Google Scholar]
- 10.Kaye, K. M., D. R. Spriggs, R. Bassel-Duby, B. N. Fields, and K. L. Tyler. 1986. Genetic basis for altered pathogenesis of an immune-selected antigenic variant of reovirus type 3 (Dearing). J. Virol. 59:90-97. [DOI] [PMC free article] [PubMed] [Google Scholar]
- 11.Kominsky, D. J., R. J. Bickel, and K. L. Tyler. 2002. Reovirus-induced apoptosis requires both death receptor- and mitochondrial-mediated caspase-dependent pathways of cell death. Cell Death Differ. 9:926-933. [DOI] [PubMed] [Google Scholar]
- 12.Lewis, J., S. L. Wesselingh, D. E. Griffin, and J. M. Hardwick. 1996. Alphavirus-induced apoptosis in mouse brains correlates with neurovirulence. J. Virol. 70:1828-1835. [DOI] [PMC free article] [PubMed] [Google Scholar]
- 13.Oberhaus, S. M., R. L. Smith, G. H. Clayton, T. S. Dermody, and K. L. Tyler. 1997. Reovirus infection and tissue injury in the mouse central nervous system are associated with apoptosis. J. Virol. 71:2100-2106. [DOI] [PMC free article] [PubMed] [Google Scholar]
- 14.Poggioli, G. J., C. Keefer, J. L. Connolly, T. S. Dermody, and K. L. Tyler. 2000. Reovirus-induced G2/M cell cycle arrest requires σ1s and occurs in the absence of apoptosis. J. Virol. 74:9562-9570. [DOI] [PMC free article] [PubMed] [Google Scholar]
- 15.Richardson-Burns, S. M., B. K. Kleinschmidt-DeMasters, R. L. DeBiasi, and K. L. Tyler. 2002. Progressive multifocal leukoencephalopathy and apoptosis of infected oligodendrocytes in the central nervous system of patients with and without AIDS. Arch. Neurol. 59:1930-1936. [DOI] [PubMed] [Google Scholar]
- 16.Richardson-Burns, S. M., D. J. Kominsky, and K. L. Tyler. 2002. Reovirus-induced neuronal apoptosis is mediated by caspase 3 and is associated with the activation of death receptors. J. Neurovirol. 8:365-380. [DOI] [PubMed] [Google Scholar]
- 17.Rodgers, S. E., E. S. Barton, S. M. Oberhaus, B. Pike, C. A. Gibson, K. L. Tyler, and T. S. Dermody. 1997. Reovirus-induced apoptosis of MDCK cells is not linked to viral yield and is blocked by Bcl-2. J. Virol. 71:2540-2546. [DOI] [PMC free article] [PubMed] [Google Scholar]
- 18.Spriggs, D. R., R. T. Bronson, and B. N. Fields. 1983. Hemagglutinin variants of reovirus type 3 have altered central nervous system tropism. Science 220:505-507. [DOI] [PubMed] [Google Scholar]
- 19.Spriggs, D. R., and B. N. Fields. 1982. Attenuated reovirus type 3 strains generated by selection of haemagglutinin antigenic variants. Nature 297:68-70. [DOI] [PubMed] [Google Scholar]
- 20.Tyler, K. L. 1998. Pathogenesis of reovirus infections of the central nervous system. Curr. Top. Microbiol. Immunol. 233:93-124. [DOI] [PubMed] [Google Scholar]
- 21.Tyler, K. L., R. T. Bronson, K. B. Byers, and B. Fields. 1985. Molecular basis of viral neurotropism: experimental reovirus infection. Neurology 35:88-92. [DOI] [PubMed] [Google Scholar]
- 22.Tyler, K. L., P. Clarke, R. L. DeBiasi, D. Kominsky, and G. J. Poggioli. 2001. Reoviruses and the host cell. Trends Microbiol. 9:560-564. [DOI] [PubMed] [Google Scholar]
- 23.Tyler, K. L., M. K. Squier, S. E. Rodgers, B. E. Schneider, S. M. Oberhaus, T. A. Grdina, J. J. Cohen, and T. S. Dermody. 1995. Differences in the capacity of reovirus strains to induce apoptosis are determined by the viral attachment protein σ1. J. Virol. 69:6972-6979. [DOI] [PMC free article] [PubMed] [Google Scholar]
- 24.Tyler, K. L., H. W. Virgin, R. Bassel-Duby, and B. N. Fields. 1989. Antibody inhibits defined stages in the pathogenesis of reovirus serotype 3 infection of the central nervous system. J. Exp. Med. 170:887-900. [DOI] [PMC free article] [PubMed] [Google Scholar]
- 25.Tyler, K. L. 2001. Mammalian reoviruses, p. 1307-1328. In D. M. Knipe and P. M. Howley (ed.), Fields virology, 4th ed. Lippincott-Williams & Wilkins, Philadelphia, Pa.
- 26.Virgin, H. W., R. Bassel-Duby, B. N. Fields, and K. L. Tyler. 1988. Antibody protects against lethal infection with the neurally spreading reovirus type 3 (Dearing). J. Virol. 62:4594-4604. [DOI] [PMC free article] [PubMed] [Google Scholar]
- 27.Yujiri, T., M. Ware, C. Widmann, R. Oyer, D. Russell, E. Chan, Y. Zaitsu, P. Clarke, K. Tyler, Y. Oka, G. R. Fanger, P. Henson, and G. L. Johnson. 2000. MEK kinase 1 gene disruption alters cell migration and c-Jun NH2-terminal kinase regulation but does not cause a measurable defect in NF-kappa B activation. Proc. Natl. Acad. Sci. USA 97:7272-7277. [DOI] [PMC free article] [PubMed] [Google Scholar]