

Abstract
Chemical exchange saturation transfer (CEST) MRI is sensitive to dilute proteins and peptides as well as microenvironmental properties. However, the complexity of the CEST MRI effect, which varies with the labile proton content, exchange rate and experimental conditions, underscores the need for development of quantitative CEST (qCEST) analysis. Towards this goal, it has been shown that the omega plot is capable of quantifying paramagnetic CEST (PARACEST) MRI. However, the use of omega plot is somewhat limited for diamagnetic CEST (DIACEST) MRI because it is more susceptible to direct RF saturation (spillover) effects owing to their relatively small chemical shift. Recently, it has been found that for dilute DIACEST agents that undergo slow to intermediate chemical exchange, the RF spillover effect varies little with the labile proton ratio and exchange rate. Therefore, we postulated that the omega plot analysis can be improved if RF spillover effect could be estimated and taken into account. Specifically, simulation showed that both labile proton ratio and exchange rate derived using the spillover effect-corrected omega plot are in good agreement with simulated values. In addition, the modified omega plot was confirmed experimentally, and we showed that the derived labile proton ratio increases linearly with creatine concentration (P< 0.01), with little difference in their exchange rate (P=0.32). In summary, our study extended the conventional omega plot for quantitative analysis of DIACEST MRI.
Keywords: amide proton transfer (APT), Chemical exchange saturation transfer (CEST), omega plot
1. INTRODUCTION
Chemical exchange saturation transfer (CEST) MRI is an imaging technique that allows measurement of dilute CEST agents and microenvironmental properties (1–4). Both diamagnetic CEST (DIACEST) and paramagnetic CEST (PARACEST) agents are being developed as novel molecular imaging probes for in vivo applications (5–9). Recent studies have also explored endogenous amide proton transfer (APT) imaging as a means to investigate acute stroke, cancer and multiple sclerosis (10–17). However, the CEST MRI effect is complex (18–21). In addition to labile proton concentration and exchange rate, the experimentally obtainable CEST effect varies with both RF irradiation power and the bulk water T1 and T2 (22,23). As such, there is a definitive need to develop quantitative CEST (qCEST) analysis for characterizing the underlying CEST properties.
Both numerical simulations and empirical solutions have been developed to describe the CEST effect; these include modified Bloch-McConnell equations for direct numerical fitting of the CEST spectrum, as well as saturation time (QUEST) and power (QUESP) dependence (22,24–29). Particularly, Dixon et al. demonstrated that the chemical exchange rate can be determined independent of the CEST agent concentration, and dubbed it omega plot (30). Whereas the omega-plot analysis is simple to use and provides accurate quantification of PARACEST agents, it is somewhat limited for analyzing DIACEST MRI because of their relatively small chemical shift. One recently developed method, QUEST ratiometric analysis (QUESTRA), corrects the RF spillover effect by normalizing the saturation time dependent label scan intensity with that of reference scan, but it derives only the labile proton ratio-weighted exchange rate (31). More recently, we have shown that the RF power level at which the CEST effect peaks is strongly dependent on the exchange rate, not on the labile proton ratio, which may delineate their independent contributions (32). Nevertheless, the RF power-dependent (RFP) CEST analysis relies on non-linear fitting of the empirical solution, which is cumbersome to use and prone to multi-parametric non-linear fitting errors (33).
The goal of this study was to develop RF spillover effect-corrected omega plot for quantifying DIACEST MRI. We found that the RF spillover factor varies little with changes in the labile proton ratio and exchange rate, and therefore, can be reasonably estimated and, hence, compensated (34). Furthermore, using a modified omega plot, both the labile proton ratio and exchange rate can be determined by linear regression analysis of the RF spillover factor-corrected CEST effect calculated from the asymmetry analysis as a function of the RF power level. To demonstrate this, we first compared the results of the qCEST analysis with simulated CEST effects, using Bloch-McConnell equations in a 2-pool exchange model; the results showed very good agreement between the numerically derived and simulated values. Importantly, the RF spillover correction significantly improved the accuracy of the results than those obtained from the conventional omega plot analysis, particularly for labile protons with chemical shift less than 5 ppm from that of the bulk water resonance. We further validated the modified omega plot analysis using a creatine CEST phantom and showed that the derived labile proton ratio is linearly correlated with creatine concentration, exhibiting little difference in exchange rate (35).
2. THEORY
The CEST MRI effect has often been described using CEST ratio (CESTR) from the asymmetry analysis of the classical 2-pool exchange model (12),
| (1) |
where fr is the labile proton ratio with respect to bulk water, ksw is the chemical exchange rate, R1w is the longitudinal relaxation rate of bulk water, α is the labeling coefficient, and 1 − σ is the RF spillover factor. We have
| (2) |
and
| (3) |
, where , rzw = r1w cos2θ/2 + r2w sin2θ/2, rzs = r1s cos2θ + r2s sin2θ, r1w,s = R1w,s + kws,sw, r2w,s = R2w,s + kws,sw and θ = tan−1(ω1/Δωs). Here, kws = fr·ksw, ω1=2π·γ·B1, Δωs is the labile proton chemical shift, γ is the gyromagnetic ratio, and B1 is the amplitude of RF irradiation.
The RF spillover factor has been shown not to be sensitive to the labile proton ratio and exchange rate (32,34). As such, the RF spillover factor-corrected CEST effect (i.e., CESTRσ = CESTR/(1−σ)) can be calculated for the modified omega plot analysis (30). For dilute CEST agents undergoing slow or intermediate chemical exchange (i.e., fr·ksw ≪R2w), we have p ≈ R2s + ksw. In addition, because typical R1s is around 1 s−1 (i.e., R1s≪ksw), q can be shown to be , and the labeling coefficient can be simplified as . The relationship between 1/CESTRσ and can then be described by linear regression, as
| (4) |
The labile proton ratio and exchange rate can be determined from the linear regression relationship. Specifically, the intercept and slope of the linear regression from Eq. 4 can be shown to be
| (5.a) |
| (5.b) |
Therefore, the labile proton exchange rate and ratio can be solved
| (6.a) |
| (6.b) |
3. RESULTS
Fig. 1 shows simulated Z-spectra for three RF power levels of 1, 2 and 3 μT, for a representative chemical shift of 2 ppm, with labile proton ratio and exchange rate being 1:2000 and 200 s−1. CEST effect can be easily observed at 2 ppm for B1 level of 1 μT. However, Z-spectral intensity decreases at higher RF power level due to direct RF saturation and the CEST effect at 2 ppm becomes less apparent (Fig. 1a). The CEST effect initially increases with the RF power level, peaking and then decreasing for RF power levels greater than 1 μT (Fig 1b). It is important to note that the empirical solution (Eq. 1) accurately describes the RF power level-dependent CEST effect as a multiplication of the simplistic CEST effect (fr*ksw/(R1w+fr*ksw)), labeling coefficient (a) and spillover factor (1−σ), with R2 being 0.996.
Fig. 1.
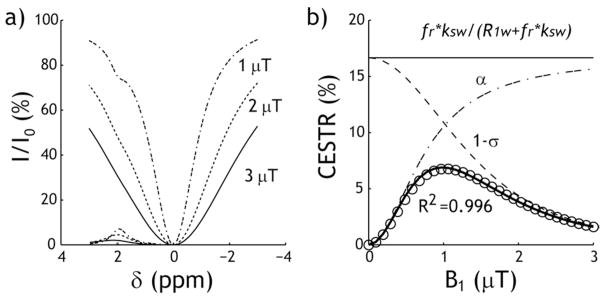
CEST MRI depends on the RF irradiation power level. a) Z-spectra and asymmetry curves simulated using Bloch-McConnell equations for three representative RF power levels of 1, 2 and 3 μT. b) The CEST ratio (CESTR) calculated with asymmetry analysis can be empirically described as a multiplication of the simplistic solution, the RF labeling coefficient, and the spillover factor.
Fig. 2 illustrates how the labeling coefficient and spillover factor vary with labile proton ratio and exchange rate. Fig. 2a shows that the labeling coefficient increases with RF power level, and slightly increases with the labile proton ratio. Although a higher RF power level can more efficiently saturate the labile protons, it is also associated with more severe concomitant RF irradiation effects, as shown in Fig. 2b. This is consistent with the results shown in Fig. 1b, which demonstrates that higher CEST effect can be obtained using an intermediate RF power level that balances the saturation efficiency and spillover factor. As Fig. 2c shows, the labeling coefficient decreases substantially with the exchange rate, particularly when weak RF power levels are used. On the other hand, the spillover factor remains nearly unchanged as a function of exchange rate (Fig. 2d). Whereas the labeling coefficient varies strongly with the labile proton ratio and exchange rate, the spillover factor shows very little change, suggesting that we can calculate the spillover factor based on a reasonable estimation of the typical labile proton ratio and exchange rate.
Fig. 2.

The labeling coefficient and spillover factor as functions of the labile proton ratio and exchange rate. a) The labeling coefficient increases slightly with the labile proton ratio. b) The spillover factor shows very little change with the labile proton ratio. c) The labeling coefficient decreases with the exchange rate. d) The spillover factor shows very little change with respect to the exchange rate.
Fig. 3 evaluates the conventional omega plot for representative labile proton ratio (1:2000) and exchange rate (200 s−1). Fig. 3a shows the normalized label scan intensity as a function of B1 irradiation level for three representative chemical shifts of 2, 5 and 10 ppm. Despite identical labile proton ratio and exchange rate, the label scan signal decreases substantially for small chemical shift offset under large B1 levels, indicating concomitant RF spillover effects, which could be particularly severe for DIACEST agents due to their relatively small chemical shift, leading to poor description of B1-dependent CEST effect using the conventional omega-plot analysis (Fig. 3b). Because the conventional omega plot analysis can not distinguish direct RF saturation from CEST effect, it resulted in significant overestimation of the labile proton ratio (Fig. 3c) and exchange rate (Fig. 3d), particularly for chemical shift within 5 ppm from that of the bulk water resonance. The normalized labile proton fraction ratio and exchange rate were 2.05 ± 3.37 and 1.86 ± 1.05, respectively.
Fig. 3.

Conventional omega-plot analysis. a) Normalized label scan signal intensity as a function of B1 for three representative chemical shifts, 2, 5 and 10 ppm. b) Labile proton ratio and exchange rate can be obtained from omega plot. c) The ratio of derived labile proton with respect to simulated value shows as a function of chemical shift. d) The ratio of derived exchange rate with respect to simulated value shows as a function of chemical shift.
We also evaluated the proposed RF spillover effect-corrected omega plot analysis. The simulated CEST effect strongly depends on the chemical shift and B1 irradiation level, indicating concomitant RF spillover effects. Notably, the calculation of CESTRσ corrected the RF spillover effects, resulting in nearly identical measurements despite the chemical shift difference (Fig. 4a). The RF spillover factor-corrected CEST effect can be described by the modified omega plot analysis, which overlapped for three representative chemical shift offsets (Fig. 4b). Indeed, R2 was found to be 1.000 for three representative chemical shifts. Importantly, both the labile proton ratio (Fig. 4c) and exchange rate (Fig. 4d) can be determined from the modified omega plot, which yields measures that show good agreement with the simulated values. Specifically, the normalized labile proton ratio and exchange rate were found to be 0.99 ± 0.00 and 1.01 ± 0.00, respectively, significantly more accurate that those obtained from the conventional omega plot analysis (Fig. 3). We further evaluated how the initial guess of exchange rate may affect the derivation. The initial guess of the exchange rate was varied ±50 % from the simulated value of 200 s−1 (i.e. 100 to 300 s−1), and the normalized labile proton fraction ratio (Fig. 4 e) and exchange rate (Fig. 4 f) showed change within 2%. This suggested that if the exchange rate can be reasonably estimated, the modified omega plot analysis should yield sufficiently accurate measurement of the underlying CEST system.
Fig. 4.

The proposed RF spillover factor-corrected omega-plot analysis. a) CESTR as a function of the RF power level for three representative chemical shifts, with the spillover effects-corrected CESTR shown in diamonds. b) Both labile proton ratio and exchange rate can be obtained from the RF spillover factor-corrected omega plot. c) The labile proton fraction ratio normalized by the simulated value shows as a function of chemical shift. d) The ratio of derived exchange rate with respect to simulated value shows as a function of chemical shift. e) The normalized labile proton fraction ratio as a function of initial guess of exchange rate. f) The normalized exchange rate as a function of initial guess of exchange rate.
The CEST measurements from the creatine phantom demonstrate that CEST image contrast increases with creatine concentration (Fig. 5a) and that CESTR varies as a function of the RF power level (Fig. 5b). Because we used a volume RF coil with relatively small B1 inhomogeneity (within 5%) and B0 inhomogeneity (−0.67±1.36 Hz), no field inhomogeneity correction for CEST effect was necessary. The bulk water T1 and T2 were measured at 1.76 and 1.18 s, respectively. The phantom results showed noticeable RF spillover effects for RF power levels greater than 1.5 μT. We estimated the RF spillover factor assuming a typical labile proton ratio of 1:1000 and exchange rate of 200 s−1 for all compartments. Whereas the raw CESTR decreases at high RF power level (Fig. 5b), the spillover-corrected CEST effect (CESTRσ) consistently increases with RF power level (Fig. 5c). Fig. 5d shows the modified omega plot, which well described the RF power dependence. Specifically, we found significant correlation between 1/CESTRσ and 1/ω12, being 0.899, 0.973, 0.976, 0.964 and 0.974 for 20, 40, 60, 80 and 100 mM (P < 0.02).
Fig. 5.

Evaluation of qCEST MRI analysis in a creatine CEST phantom. a) The CEST image depicts the difference in creatine concentration in the CEST phantom. b) CESTR as functions of RF power level and creatine concentration. c) The RF spillover factor-corrected CESTR as a function of both RF power level and creatine concentration. d) Both labile proton ratio and exchange rate can be determined from the RF spillover effect-corrected omega plot.
We used the qCEST analysis to map the labile proton exchange rate and ratio, per pixel. The labile proton ratio map increased substantially with creatine concentration (Fig. 6a) with little change in chemical exchange rate (Fig. 6b). Indeed, the labile proton ratios for creatine concentrations of 20, 40, 60, 80 and 100 mM were 1:2519, 1:1203, 1:836, 1:667 and 1:512, respectively, which can be described by linear regression fr= 1.90×10⁻⁵*f+4.2×10⁻⁵, where f is creatine concentration in mM (ρ=0.998, P<0.01). In addition, exchange rate was found to be 141 ± 12 s−1, and Pearson’s correlation test showed that its relationship to creatine concentration was insignificant (ρ =0.563, P=0.32). It is important to note that although the spillover factor was estimated assuming the same labile proton ratio and exchange rate (i.e., 1:1000 and 200 s−1) for all creatine compartments, the proposed qCEST analysis correctly differentiated the contributions from the exchange rate and labile proton ratio. Notably, the intercept (i.e. 4.2×10⁻⁵) was not statistically different from 0 (P=0.42). In addition, the 95% confidence interval of the slope was from 1.68 × 10⁻⁵ to 2.12×10⁻⁵ while the average labile proton ratio for creatine solution can be estimated to be fr= 1.82×10⁻⁵*f, in good agreement with each other.
Fig. 6.

Experimental validation of qCEST analysis. a) Pixel-wise mapping of labile proton ratio. b) Pixel-wise mapping of labile proton chemical exchange rate. c) The labile proton ratio as a function of the creatine concentration. d) The numerically solved labile proton exchange rate as a function of creatine concentration.
To test whether the modified omega plot analysis can quantify the underlying CEST system of different pH, we repeated the measurement after adjusting pH to 6.51, 7.02 and 7.28. Fig. 7 a shows the creatine concentration normalized labile proton fraction ratio (i.e. slope in Fig. 6 c) with the bar showing the 95% confidence interval (STATA, College Station, TX). Whereas the slope appears to increase slightly with pH, linear regression analysis shows its change with pH was not statistically significant (P>0.10). In comparison, the exchange rate as a function of pH can be described assuming that the chemical exchange is dominantly base-catalyzed (i.e., k=k0+kb·10pH-pkw), as shown by the dot dashed line, with k0=9.15, kb=3.51*106 and pkw=11.11, in good agreement with previous findings (35). Although there was substantial increase in exchange rate, from 92±12 s−1 to 509±41 s−1 when pH was varied from 6.51 to 7.28, the change in creatine concentration normalized labile proton fraction ratio (i.e. 2.22±0.33*10−5) was relatively small, with the coefficient of variation being 14.8%.
Fig. 7.
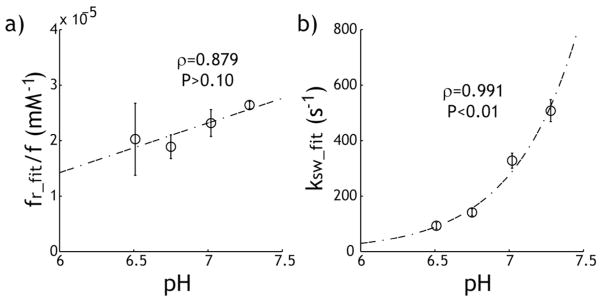
Evaluation of pH-dependent qCEST MRI analysis. a) The creatine concentration normalized labile proton fraction ratio shows little change with pH (P> 0.10). b) The labile proton exchange rate can be described using dominantly base-catalyzed chemical exchange relationship (P<0.01).
4. DISCUSSION
Our study augments the conventional omega plot analysis, and demonstrates that the proposed RF spillover effect-corrected omega plot provides good quantification of DIACEST MRI, despite non-negligible RF spillover effects. It is important to note that CEST effect derived from the asymmetry analysis is still contaminated with RF spillover effect, which can be described using the empirical solution. Therefore, the modified omega plot analysis evaluates CEST effect measured using the asymmetry analysis instead of label scan alone (30). For a relatively simple CEST model system, we chose the term CESTR, which is equivalent to the commonly used MTRasym. In addition, ratiometric CEST MRI has been proposed to normalize the CEST agent concentration factor for solving chemical exchange rate (36–38). However, it only applies to CEST agents with multiple chemically distinguishable labile protons, which the modified omega plot approach proposed in our study does not require. As such, our study complements the previous work of qCEST MRI (32,33,39).
Because the spillover factor depends on the bulk water T1 and T2, relaxation rates have to be accurately measured or pre-determined for qCEST MRI analysis. For dilute DIACEST agents, the chemical exchange should not significantly affect the relaxation measurements, and the bulk water relaxation rates can be accurately measured. It is necessary to note that R2s has to be reasonably determined in order to quantify ksw and fr. Our simulation showed that the normalized labile proton exchange rate and fraction ratio varied less than 7% when using R2s within ±25% of the original value. This suggested that if R2s can be reasonably estimated, the underlying CEST system could be quantified using the modified omega plot analysis. Our study used Bloch-McConnell equation to simulate CEST effect without considering the effect of noise. We have recently derived SNR of CEST CESTR map (SNRCESTR) being , where SNRI0 is SNR of the control image without RF saturation (40). Importantly, our results demonstrated that sufficient SNR could be obtained experimentally for the proposed analysis, which can be further enhanced using sensitive acquisition approaches (19,41). In addition, correction of RF spillover effects allows further studies to evaluate alternative processing algorithms that may minimize error propagation in the modified omega plot analysis (42). Moreover, the field inhomogeneity was minor in our experiments, and no post-processing correction was necessary. If necessary, both B0 and B1 field maps could be obtained to improve omega-plot analysis during post-processing. Specifically, B0 inhomogeneity can be corrected using interpolation or empirical solution-based correction, and B1 inhomogeneity can be corrected per-pixel based on B1 field map (43–45). Furthermore, it will be interesting to test how modified pulse sequences and optimized sampling schemes can improve quantitative analysis of CEST MRI (39,41,46).
Further development is needed to extend this algorithm to studies of complex CEST systems with multiple exchangeable sites. This is particularly important for in vivo applications, in which CEST effects from amide, amine and hydroxyl groups have been reported (47–51). In addition to CEST and RF spillover effects, which the proposed solution can adequately address, there are semisolid macromolecular magnetization transfer (MT) and nuclear overhauser effects (NOE) in vivo (49,52,53). Recently, it has been shown that Lorentzian-based analysis can delineate the confounding MT and NOE contribution from APT/CEST effect, which may help establish in vivo qCEST MRI and ultimately promote clinical translation (54–56). Although clinical applications of CEST MRI have been implemented with pulsed-RF irradiation, recent development enables pseudo continuous wave RF irradiation, which simplifies qCEST analysis (18,20,57). Such technical development will be crucial for advancing quantitative in vivo CEST. To summarize, qCEST analysis may ultimately transform the widely used CEST-weighted MRI and enable a host of novel in vivo applications.
5. CONCLUSIONS
We have developed an RF spillover effect-corrected omega-plot analysis for improved quantification of DIACEST MRI. The modified omega plot analysis is simple to use yet determines both labile proton ratio and exchange rate despite non-negligible RF spillover effects, which augments the conventional omega plot analysis.
6. MATERIALS AND METHODS
Numerical Simulation
We simulated CEST MRI using a 2-pool exchange model in Matlab (Mathworks, Natick MA) (25,28), assuming representative T1 and T2 of 2 s and 100 ms for the bulk water, and 1 s and 15 ms for labile protons at 2 ppm at 4.7 Tesla (i.e., 400 Hz), respectively. To evaluate the RF spillover factor as a function of exchange rate, we serially varied the exchange rate from 25 to 500 s−1 for a representative labile proton ratio of 1:2000, with the labile proton chemical shift from bulk water being 2 ppm (i.e., 400 Hz at 4.7 Tesla). In addition to characterize the effect of labile proton ratio, we varied the labile proton ratio from 1:500 to 1:5000 for a representative exchange rate of 200 s−1. To solve for both the labile proton ratio (Eq. 6a) and exchange rate (Eq. 6b) we used the linear regression relationship defined in Eq. 4.
Phantom
We prepared gadolinium-doped (30 μM) phosphate-buffered saline (PBS, Sigma Aldrich, St Louis, MO) and the creatine concentration was varied in increments of 20 mM from 20 to 100 mM, with pH titrated to 6.75 (EuTech Instrument, Singapore). The solution was transferred into centrifuge tubes, sealed and inserted into a phantom holder filled with 1% (weight/weight) agarose gel to minimize susceptibility mismatch. In addition, we prepared phantom with pH of 6.51, 7.02 and 7.28 to study the modified omega plot analysis under varied exchange rate.
MRI
The experiments were conducted using a 4.7 T small-bore Bruker scanner, with single-shot spin-echo echo planar imaging (EPI) (slice thickness = 10 mm, field of view (FOV) = 76 × 76 mm, image matrix was 64 × 64, bandwidth=200 kHz). We varied the RF amplitude in increments of 0.5 μT from 1 to 3 μT, with label and reference offsets set at ±1.9 ppm (375 Hz at 4.7T). The repetition time (TR)/saturation time (TS)/echo time (TE) were 12 s/6 s/28 ms, respectively, and number of signal average (NSA) of 2 (scan time = 1 min 12 s). We used asymmetric spin echo (ASE) MRI for mapping B0 inhomogeneity, with echo times shifted by 1, 3, 5 and 7 ms (TR/TE=12s/36 ms, NSA=2, scan time = 1 min 36 s). The T1 and T2 maps were obtained using the inversion recovery sequence with seven inversion intervals (TI) from 0.1 to 7.5 s (recovery time (Tr)/TE=12 s/25 ms, NSA=2, scan time = 3 min 24 s), and spin-echo EPI (five TEs from 50 to 500 ms, TR=12 s, NSA=2, scan time = 2 min) (58).
Data Processing
Images were processed in Matlab (Mathworks, Natick, MA). The T1 map was obtained by least-squares fitting of the signal intensities (I) as a function of inversion time (I = I0 ⌊1 − (1 + η)e−TI/T1⌋), where η is the inversion efficiency and I0 is the equilibrium signal. In addition, the T2 map was derived by fitting the signal intensity as a function of the echo time, I = I0e−TE/T2. The CEST effect was calculated as , where Iref and Ilabel are the reference and label scans, and I0 is the control scan without RF irradiation. B0 map was derived by fitting the phase map (φ) against the off-centered echo time (Δτ) using . Results were reported as mean ± standard deviation. Data were analyzed in Data Analysis and Statistical Software (STATA, College Station, TX) and P-values less than 0.05 were considered statistically significant.
Acknowledgments
This study was supported in part by grants from NIH/NIBIB K01EB009771, NIH/NINDS 1R01NS083654, NIH/NCRR P41RR14075 and NSFC 30930027. The authors would like to thank Ms. Nichole Eusemann for editorial assistance.
References
- 1.Ward KM, Aletras AH, Balaban RS. A new class of contrast agents for MRI based on proton chemical exchange dependent saturation transfer (CEST) J Magn Reson. 2000;143:79–87. doi: 10.1006/jmre.1999.1956. [DOI] [PubMed] [Google Scholar]
- 2.van Zijl PCM, Jones CK, Ren J, Malloy CR, Sherry AD. MRI detection of glycogen in vivo by using chemical exchange saturation transfer imaging (glycoCEST) Proc Natl Acad Sci. 2007;104(11):4359–4364. doi: 10.1073/pnas.0700281104. [DOI] [PMC free article] [PubMed] [Google Scholar]
- 3.Sherry AD, Woods M. Chemical exchange saturation transfer contrast agents for magnetic resonance imaging. Annu Rev Biomed Eng. 2008;10:391–411. doi: 10.1146/annurev.bioeng.9.060906.151929. [DOI] [PMC free article] [PubMed] [Google Scholar]
- 4.Vinogradov E, Sherry AD, Lenkinski RE. CEST: From basic principles to applications, challenges and opportunities. J Magn Reson. 2013;229(0):155–172. doi: 10.1016/j.jmr.2012.11.024. [DOI] [PMC free article] [PubMed] [Google Scholar]
- 5.Aime S, Delli CD, Terreno E. Highly sensitive MRI chemical exchange saturation transfer agents using liposomes. Angew Chem Int Ed Engl. 2005;44(34):5513–5515. doi: 10.1002/anie.200501473. [DOI] [PubMed] [Google Scholar]
- 6.Liu G, Liang Y, Bar-Shir A, Chan KWY, Galpoththawela CS, Bernard SM, Tse T, Yadav NN, Walczak P, McMahon MT, Bulte JWM, van Zijl PCM, Gilad AA. Monitoring Enzyme Activity Using a Diamagnetic Chemical Exchange Saturation Transfer Magnetic Resonance Imaging Contrast Agent. Journal of the American Chemical Society. 2011;133(41):16326–16329. doi: 10.1021/ja204701x. [DOI] [PMC free article] [PubMed] [Google Scholar]
- 7.Li Y, Sheth VR, Liu G, Pagel MD. A self-calibrating PARACEST MRI contrast agent that detects esterase enzyme activity. Contrast Media Mol Imaging. 2011;6(4):219–228. doi: 10.1002/cmmi.421. [DOI] [PMC free article] [PubMed] [Google Scholar]
- 8.Olatunde AO, Dorazio SJ, Spernyak JA, Morrow JR. The NiCEST Approach: Nickel(II) ParaCEST MRI Contrast Agents. Journal of the American Chemical Society. 2012;134(45):18503–18505. doi: 10.1021/ja307909x. [DOI] [PubMed] [Google Scholar]
- 9.Chan KWY, Liu G, Song X, Kim H, Yu T, Arifin DR, Gilad AA, Hanes J, Walczak P, van Zijl PCM, Bulte JWM, McMahon MT. MRI-detectable pH nanosensors incorporated into hydrogels for in vivo sensing of transplanted-cell viability. Nat Mater. 2013;12(3):268–275. doi: 10.1038/nmat3525. [DOI] [PMC free article] [PubMed] [Google Scholar]
- 10.Zhou J, Payen JF, Wilson DA, Traystman RJ, van Zijl PC. Using the amide proton signals of intracellular proteins and peptides to detect pH effects in MRI. Nat Med. 2003;9(8):1085–1090. doi: 10.1038/nm907. [DOI] [PubMed] [Google Scholar]
- 11.Jones CK, Schlosser MJ, van Zijl PCM, Pomper GM, Golay X, Zhou J. Amide proton transfer imaging of human brain tumors at 3T. Magn Reson Med. 2006;56(3):585–592. doi: 10.1002/mrm.20989. [DOI] [PubMed] [Google Scholar]
- 12.Sun PZ, Zhou J, Huang J, van Zijl P. Simplified quantitative description of amide proton transfer (APT) imaging during acute ischemia. Magn Reson Med. 2007;57(2):405–410. doi: 10.1002/mrm.21151. [DOI] [PubMed] [Google Scholar]
- 13.Sun PZ, Zhou J, Sun W, Huang J, van Zijl PC. Detection of the ischemic penumbra using pH-weighted MRI. J Cereb Blood Flow Metab. 2007;27(6):1129–1136. doi: 10.1038/sj.jcbfm.9600424. [DOI] [PubMed] [Google Scholar]
- 14.Jokivarsi KT, Gröhn HI, Gröhn OH, Kauppinen RA. Proton transfer ratio, lactate, and intracellular pH in acute cerebral ischemia. Magn Reson Med. 2007;57(4):647–653. doi: 10.1002/mrm.21181. [DOI] [PubMed] [Google Scholar]
- 15.Sun PZ, Cheung JS, Wang EF, Lo EH. Association between pH-weighted endogenous amide proton chemical exchange saturation transfer MRI and tissue lactic acidosis during acute ischemic stroke. J Cereb Blood Flow Metab. 2011;31(8):1743–1750. doi: 10.1038/jcbfm.2011.23. [DOI] [PMC free article] [PubMed] [Google Scholar]
- 16.Mougin OE, Coxon RC, Pitiot A, Gowland PA. Magnetization transfer phenomenon in the human brain at 7 T. NeuroImage. 2010;49(1):272–281. doi: 10.1016/j.neuroimage.2009.08.022. [DOI] [PubMed] [Google Scholar]
- 17.Dula AN, Asche EM, Landman BA, Welch EB, Pawate S, Sriram S, Gore JC, Smith SA. Development of chemical exchange saturation transfer at 7T. Magn Reson Med. 2012;66(3):831–838. doi: 10.1002/mrm.22862. [DOI] [PMC free article] [PubMed] [Google Scholar]
- 18.Sun PZ, Wang EF, Cheung JS, Zhang XA, Benner T, Sorensen AG. Simulation and optimization of pulsed radio frequency (RF) irradiation scheme for chemical exchange saturation transfer (CEST) MRI – demonstration of pH-weighted pulsed-amide proton CEST MRI in an animal model of acute cerebral ischemia. Magn Reson Med. 2011;66(4):1042–1048. doi: 10.1002/mrm.22894. [DOI] [PMC free article] [PubMed] [Google Scholar]
- 19.Sun PZ, Cheung JS, Wang E, Benner T, Sorensen AG. Fast multi-slice pH-weighted chemical exchange saturation transfer (CEST) MRI with unevenly segmented RF irradiation. Magn Reson Med. 2011;65(2):588–594. doi: 10.1002/mrm.22628. [DOI] [PMC free article] [PubMed] [Google Scholar]
- 20.Zu Z, Li K, Janve VA, Does MD, Gochberg DF. Optimizing pulsed-chemical exchange saturation transfer imaging sequences. Magn Reson Med. 2011;66(4):1100–1108. doi: 10.1002/mrm.22884. [DOI] [PMC free article] [PubMed] [Google Scholar]
- 21.Jin T, Autio J, Obata T, Kim S-G. Spin-locking versus chemical exchange saturation transfer MRI for investigating chemical exchange process between water and labile metabolite protons. Magn Reson Med. 2011;65(5):1448–1460. doi: 10.1002/mrm.22721. [DOI] [PMC free article] [PubMed] [Google Scholar]
- 22.Sun PZ, van Zijl PCM, Zhou J. Optimization of the irradiation power in chemical exchange dependent saturation transfer experiments. J Magn Reson. 2005;175(2):193–200. doi: 10.1016/j.jmr.2005.04.005. [DOI] [PubMed] [Google Scholar]
- 23.Zaiss M, Bachert P. Exchange-dependent relaxation in the rotating frame for slow and intermediate exchange – modeling off-resonant spin-lock and chemical exchange saturation transfer. NMR in Biomedicine. 2013;26(5):507–518. doi: 10.1002/nbm.2887. [DOI] [PubMed] [Google Scholar]
- 24.Zhou J, Wilson DA, Sun PZ, Klaus JA, van Zijl PCM. Quantitative description of proton exchange processes between water and endogenous and exogenous agents for WEX, CEST, and APT experiments. Magn Reson Med. 2004;51:945–952. doi: 10.1002/mrm.20048. [DOI] [PubMed] [Google Scholar]
- 25.Woessner DE, Zhang S, Merritt ME, Sherry AD. Numerical solution of the Bloch equations provides insights into the optimum design of PARACEST agents for MRI. Magn Reson Med. 2005;53(4):790–799. doi: 10.1002/mrm.20408. [DOI] [PubMed] [Google Scholar]
- 26.McMahon M, Gilad A, Zhou J, Sun PZ, Bulte J, van Zijl PC. Quantifying exchange rates in chemical exchange saturation transfer agents using the saturation time and saturation power dependencies of the magnetization transfer effect on the magnetic resonance imaging signal (QUEST and QUESP): Ph calibration for poly-L-lysine and a starburst dendrimer. Magn Reson Med. 2006;55(4):836–847. doi: 10.1002/mrm.20818. [DOI] [PMC free article] [PubMed] [Google Scholar]
- 27.Li AX, Hudson RHE, Barrett JW, Johns CK, Pasternak SH, Bartha R. Four-pool modeling of proton exchange processes in biological systems in the presence of MRI-paramagnetic chemical exchange saturation transfer (PARACEST) agents. Magn Reson Med. 2008;60(5):1197–1206. doi: 10.1002/mrm.21752. [DOI] [PubMed] [Google Scholar]
- 28.Sun PZ. Simplified and scalable numerical solution for describing multi-pool chemical exchange saturation transfer (CEST) MRI contrast. J Magn Reson. 2010;205(2):235–241. doi: 10.1016/j.jmr.2010.05.004. [DOI] [PMC free article] [PubMed] [Google Scholar]
- 29.Murase K, Tanki N. Numerical solutions to the time-dependent Bloch equations revisited. Magn Reson Imaging. 2011;29(1):126–131. doi: 10.1016/j.mri.2010.07.003. [DOI] [PubMed] [Google Scholar]
- 30.Dixon TW, Ren J, Lubag A, JM, Ratnakar J, Vinogradov E, Hancu I, Lenkinski RE, Sherry AD. A concentration-independent method to measure exchange rates in PARACEST agents. Magn Reson Med. 2010;63(3):625–632. doi: 10.1002/mrm.22242. [DOI] [PMC free article] [PubMed] [Google Scholar]
- 31.Sun PZ. Simplified quantification of labile proton concentration-weighted chemical exchange rate (kws) with RF saturation time dependent ratiometric analysis (QUESTRA): Normalization of relaxation and RF irradiation spillover effects for improved quantitative chemical exchange saturation transfer (CEST) MRI. Magn Reson Med. 2012;67(4):936–942. doi: 10.1002/mrm.23068. [DOI] [PMC free article] [PubMed] [Google Scholar]
- 32.Sun PZ. Simultaneous determination of labile proton concentration and exchange rate utilizing optimal RF power: radio frequency power (RFP) dependence of chemical exchange saturation transfer (CEST) MRI. J Magn Reson. 2010;202(2):155–161. doi: 10.1016/j.jmr.2009.10.012. [DOI] [PMC free article] [PubMed] [Google Scholar]
- 33.Sun PZ, Wang Y, Xiao G, Wu R. Simultaneous experimental determination of labile proton fraction ratio and exchange rate with irradiation radio frequency power-dependent quantitative CEST MRI analysis. Contrast Media & Molecular Imaging. 2013;8(3):246–251. doi: 10.1002/cmmi.1524. [DOI] [PMC free article] [PubMed] [Google Scholar]
- 34.Wu R, Liu C, Liu P, Sun PZ. Improved measurement of labile proton concentration-weighted chemical exchange rate (kws) with experimental factor-compensated and T1-normalized quantitative chemical exchange saturation transfer (CEST) MRI. Contrast Media & Molecular Imaging. 2012;7(4):384–389. doi: 10.1002/cmmi.505. [DOI] [PMC free article] [PubMed] [Google Scholar]
- 35.Sun PZ, Sorensen AG. Imaging pH using the chemical exchange saturation transfer (CEST) MRI: correction of concomitant RF irradiation effects to quantify CEST MRI for chemical exchange rate and pH. Magn Reson Med. 2008;60(2):390–397. doi: 10.1002/mrm.21653. [DOI] [PubMed] [Google Scholar]
- 36.Ward KM, Balaban RS. Determination of pH using water protons and chemical exchange dependent saturation transfer (CEST) Magn Reson Med. 2000;44:799–802. doi: 10.1002/1522-2594(200011)44:5<799::aid-mrm18>3.0.co;2-s. [DOI] [PubMed] [Google Scholar]
- 37.Longo DL, Dastrù W, Digilio G, Keupp J, Langereis S, Lanzardo S, Prestigio S, Steinbach O, Terreno E, Uggeri F, Aime S. Iopamidol as a responsive MRI-chemical exchange saturation transfer contrast agent for pH mapping of kidneys: In vivo studies in mice at 7 T. Magn Reson Med. 2011;65(1):202–211. doi: 10.1002/mrm.22608. [DOI] [PubMed] [Google Scholar]
- 38.Sheth VR, Li Y, Chen LQ, Howison CM, Flask CA, Pagel MD. Measuring in vivo tumor pHe with CEST-FISP MRI. Magn Reson Med. 2012;67(3):760–768. doi: 10.1002/mrm.23038. [DOI] [PMC free article] [PubMed] [Google Scholar]
- 39.Zu Z, Janve VA, Li K, Does MD, Gore JC, Gochberg DF. Multi-angle ratiometric approach to measure chemical exchange in amide proton transfer imaging. Magn Reson Med. 2012;68(3):711–719. doi: 10.1002/mrm.23276. [DOI] [PMC free article] [PubMed] [Google Scholar]
- 40.Sun PZ, Lu J, Wu Y, Xiao G, Wu R. Evaluation of the dependence of CEST-EPI measurement on repetition time, RF irradiation duty cycle and imaging flip angle for enhanced pH sensitivity. Phys Med Biol. 2013 doi: 10.1088/0031-9155/58/17/N229. in press. [DOI] [PMC free article] [PubMed] [Google Scholar]
- 41.Sun PZ, Wang Y, Lu J. Sensitivity-enhanced chemical exchange saturation transfer (CEST) MRI with least squares optimization of Carr Purcell Meiboom Gill multi-echo echo planar imaging. Contrast Media & Molecular Imaging. 2013 doi: 10.1002/cmmi.1546. in press. [DOI] [PMC free article] [PubMed] [Google Scholar]
- 42.Randtke E, Chen LQ, Corrales R, Pagel M. The Hanes-woolf linear QUEST method provies the most accurate determination of fast chemical exchange rates for CEST MRI contrast agents. Salt Lake City, Utah: 2013. [Google Scholar]
- 43.Kim M, Gillen J, Landman BA, Zhou J, van Zijl PCM. Water saturation shift referencing (WASSR) for chemical exchange saturation transfer (CEST) experiments. Magn Reson Med. 2009;61(6):1441–1450. doi: 10.1002/mrm.21873. [DOI] [PMC free article] [PubMed] [Google Scholar]
- 44.Sun PZ, Farrar CT, Sorensen AG. Correction for artifacts induced by B0 and B1 field inhomogeneities in pH-sensitive chemical exchange saturation transfer (CEST) imaging. Magn Reson Med. 2007;58(6):1207–1215. doi: 10.1002/mrm.21398. [DOI] [PubMed] [Google Scholar]
- 45.Singh A, Haris M, Cai K, Kassey VB, Kogan F, Reddy D, Hariharan H, Reddy R. Chemical exchange saturation transfer magnetic resonance imaging of human knee cartilage at 3 T and 7 T. Magn Reson Med. 2012;68(2):588–594. doi: 10.1002/mrm.23250. [DOI] [PMC free article] [PubMed] [Google Scholar]
- 46.Tee YK, Khrapitchev AA, Sibson NR, Payne SJ, Chappell MA. Optimal sampling schedule for chemical exchange saturation transfer. Magn Reson Med. 2013:n/a–n/a. doi: 10.1002/mrm.24567. [DOI] [PubMed] [Google Scholar]
- 47.Cai K, Haris M, Singh A, Kogan F, Greenberg JH, Hariharan H, Detre JA, Reddy R. Magnetic resonance imaging of glutamate. Nat Med. 2012;18(2):302–306. doi: 10.1038/nm.2615. [DOI] [PMC free article] [PubMed] [Google Scholar]
- 48.Jin T, Wang P, Zong X, Kim S-G. Magnetic resonance imaging of the Amine Proton EXchange (APEX) dependent contrast. NeuroImage. 2012;16(2):1218–1227. doi: 10.1016/j.neuroimage.2011.08.014. [DOI] [PMC free article] [PubMed] [Google Scholar]
- 49.Sun PZ, Wang EF, Cheung JS. Imaging acute ischemic tissue acidosis with pH-sensitive endogenous amide proton transfer (APT) MRI – Correction of tissue relaxation and concomitant RF irradiation effects toward mapping quantitative cerebral tissue pH. Neuroimage. 2012;60(1):1–6. doi: 10.1016/j.neuroimage.2011.11.091. [DOI] [PMC free article] [PubMed] [Google Scholar]
- 50.Zhou J, Tryggestad E, Wen Z, Lal B, Zhou T, Grossman R, Wang S, Yan K, Fu D-X, Ford E, Tyler B, Blakeley J, Laterra J, van Zijl PCM. Differentiation between glioma and radiation necrosis using molecular magnetic resonance imaging of endogenous proteins and peptides. Nat Med. 2011;17(1):130–134. doi: 10.1038/nm.2268. [DOI] [PMC free article] [PubMed] [Google Scholar]
- 51.Jia G, Abaza R, Williams JD, Zynger DL, Zhou J, Shah ZK, Patel M, Sammet S, Wei L, Bahnson RR, Knopp MV. Amide proton transfer MR imaging of prostate cancer: A preliminary study. J Magn Reson Imag. 2011;33(3):647–654. doi: 10.1002/jmri.22480. [DOI] [PMC free article] [PubMed] [Google Scholar]
- 52.Hua J, Jones CK, Blakeley J, Smith SA, van Zijl PCM, Zhou J. Quantitative description of the asymmetry in magnetization transfer effects around the water resonance in the human brain. Magn Reson Med. 2007;58(4):786–793. doi: 10.1002/mrm.21387. [DOI] [PMC free article] [PubMed] [Google Scholar]
- 53.Ling W, Regatte RR, Navon G, Jerschow A. Assessment of glycosaminoglycan concentration in vivo by chemical exchange-dependent saturation transfer (gagCEST) Proc Natl Acad Sci. 2008;105(7):2266–2270. doi: 10.1073/pnas.0707666105. [DOI] [PMC free article] [PubMed] [Google Scholar]
- 54.Zaiss M, Schmitt B, Bachert P. Quantitative separation of CEST effect from magnetization transfer and spillover effects by Lorentzian-line-fit analysis of z-spectra. J Magn Reson. 2011;211(2):149–155. doi: 10.1016/j.jmr.2011.05.001. [DOI] [PubMed] [Google Scholar]
- 55.Jones CK, Polders D, Hua J, Zhu H, Hoogduin HJ, Zhou J, Luijten P, van Zijl PCM. In vivo three-dimensional whole-brain pulsed steady-state chemical exchange saturation transfer at 7 T. Magn Reson Med. 2012;67(6):1579–1589. doi: 10.1002/mrm.23141. [DOI] [PMC free article] [PubMed] [Google Scholar]
- 56.Shah T, Lu L, Dell KM, Pagel MD, Griswold MA, Flask CA. CEST-FISP: A novel technique for rapid chemical exchange saturation transfer MRI at 7 T. Magn Reson Med. 2011;65(2):432–437. doi: 10.1002/mrm.22637. [DOI] [PMC free article] [PubMed] [Google Scholar]
- 57.Sun PZ, Benner T, Kumar A, Sorensen AG. Investigation of optimizing and translating pH-sensitive pulsed-chemical exchange saturation transfer (CEST) imaging to a 3T clinical scanner. Magn Reson Med. 2008;60(4):834–841. doi: 10.1002/mrm.21714. [DOI] [PMC free article] [PubMed] [Google Scholar]
- 58.Cheung JS, Wang EF, Zhang XA, Manderville E, Lo EH, Sorensen AG, Sun PZ. Fast radio-frequency enforced steady state (FRESS) spin echo MRI for quantitative T2 mapping: minimizing the apparent repetition time (TR) dependence for fast T2 measurement. NMR Biomed. 2012;25(2):189–194. doi: 10.1002/nbm.1729. [DOI] [PMC free article] [PubMed] [Google Scholar]