

Abstract
Hb9 is a homeodomain-containing transcription factor that acts in combination with Nkx6, Lim3, and Tail-up (Islet) to guide the stereotyped differentiation, connectivity, and function of a subset of neurons in Drosophila. The role of Hb9 in directing neuronal differentiation is well documented, but the lineage of Hb9+ neurons is only partly characterized, its regulation is poorly understood, and most of the downstream genes through which it acts remain at large. Here, we complete the lineage tracing of all embryonic Hb9+ neurons (to eight neuronal lineages) and provide evidence that hb9, lim3, and tail-up are coordinately regulated by a common set of upstream factors. Through the parallel use of micro-array gene expression profiling and the Dam-ID method, we searched for Hb9-regulated genes, uncovering transcription factors as the most over-represented class of genes regulated by Hb9 (and Nkx6) in the CNS. By a nearly ten-to-one ratio, Hb9 represses rather than activates transcription factors, highlighting transcriptional repression of other transcription factors as a core mechanism by which Hb9 governs neuronal determination. From the small set of genes activated by Hb9, we characterized the expression and function of two – fd59a/foxd, which encodes a transcription factor, and Nitric oxide synthase. Under standard lab conditions, both genes are dispensable for Drosophila development, but Nos appears to inhibit hyper-active behavior and fd59a appears to act in octopaminergic neurons to control egg-laying behavior. Together our data clarify the mechanisms through which Hb9 governs neuronal specification and differentiation and provide an initial characterization of the expression and function of Nos and fd59a in the Drosophila CNS.
Keywords: Drosophila, neurogenesis, Hb9, FoxD/fd59a, Nitric oxide synthase
INTRODUCTION
The intricate patterns of neuronal connectivity that drive animal behavior are largely dictated by the action of complex networks of transcription factors acting within developing nervous systems (Reviewed in Jessell, 2000; Thor and Thomas, 2002). These transcription factors, expressed in distinct yet overlapping patterns of neurons, direct cell fate in a combinatorial manner, such that a neuron’s fate depends on the particular combination of transcription factors it expresses.
The combinatorial code model of neuronal specification initially arose from work on Lim-homeodomain (Lim-HD) proteins in vertebrates that showed that classes of motor neurons with disparate axonal trajectories express distinct combinations of these factors (Tsuchida et al., 1994; Appel et al., 1995). Subsequent genetic studies in vertebrates and flies uncovered that axonal projection patterns can be predictably altered by changing the combination of transcription factors expressed in particular groups of neurons (Thor et al. 1999). For example, in vertebrates, the lateral motor column (LMC) contains all motor neurons that project to the limb (Landmesser, 1978a and 1978b). Motor neurons with cell bodies located medially within the LMC project axons to ventrally-derived limb muscle; motor neurons with soma located laterally in the LMC project axons to dorsally-derived limb muscles. Lateral LMC neurons express Lim1; those in the medial LMC express Islet 1. Cross-repressive interactions between these transcription factors establish and maintain their non-overlapping expression in these distinct classes of neurons (Kania et al. 2000; Kania and Jessell, 2003); Lim-1 and Islet-1 then act to direct their respective groups of motor neurons to extend axons dorsally or ventrally into the limb mesenchyme in part by regulating the expression of the repulsive guidance receptor, EphA4 (Kania and Jessell, 2003).
In Drosophila, the Lim-HD proteins, Lim3 and Tail-up (Tup; also referred to as Islet), were the first members of the combinatorial code identified: Lim3 and Tup act in a combinatorial manner to direct the axonal pathway selection of two classes of neurons that innervate distinct sets of ventral body wall muscles (ventrally-projecting motor neurons) (Thor et al., 1999). In their specification of neurons that innervate ventral body wall muscles, Lim3 and Tup act in parallel to Hb9 and Nkx6 (Broihier and Skeath, 2002; Odden et al. 2002; Broihier et al., 2004; Cheesman et al. 2004). Hb9 and Nkx6 (also referred to as exex and HGTX, respectively, in Flybase) are evolutionarily conserved homeodomain-containing transcription factors that promote the specification of motor neurons and interneurons in vertebrates and invertebrates (Broihier and Skeath, 2002; Broihier et al., 2004; Odden et al. 2002; Arber et al., 1999; Sander et al., 2000). Like Lim3 and Tup, Hb9 and Nkx6 are each expressed in a complex mosaic of post-mitotic neurons. The upstream regulation of these genes is unclear, but they are expressed in unique, but largely overlapping sets of neurons that together define all ventrally-projecting motor neurons as well as many interneurons. Genetic studies indicate that these genes are regulated largely independently of each other, and function in a combinatorial, but also partly redundant, manner to direct the specification and differentiation of their respective sets of neurons (Broihier et al. 2004).
A key challenge to a clear understanding of the genetic and molecular basis of neuronal development is the identification of the downstream targets through which transcription factors like Hb9 – individually or in combination – drive neuronal differentiation. Elegant genomic and genetic approaches in C. elegans have uncovered batteries of genes regulated by one or more transcription factor in individual neurons: the transcription factors act directly through these targets to dictate the differentiation of these neurons (reviewed in Hobert, 2008). Progress has, however, been much slower in flies and vertebrates. For example, in Drosophila, Hb9 and Nkx6 have been shown to act in a partially redundant manner to repress the expression of even-skipped (eve) in ventrally-projecting motor neurons (Broihier et al., 2004). Eve is a key determinant of dorsally-projecting motor neurons, and its active repression in ventrally projecting motor neurons is essential for these neurons to adopt their correct identity and innervate appropriate targets (Landgraf et al., 1999). In addition, Nkx6 has been shown to activate the expression of the cell adhesion molecule FasIII during axonogenesis in flies (Broihier et al. 2004). But Hb9 and Nkx6 likely influence neuronal differentiation through the regulation of dozens of target genes, and the logic through which they do so remains elusive.
Here, in addition to completing the lineage tracing of all embryonic Hb9+ neurons and uncovering the likely co-regulation of the hb9, lim3, and tup genes in many neurons, we used micro-array gene expression profiling and the Dam-ID method to begin to identify the downstream factors through which Hb9 (and Nkx6) govern neuronal differentiation. We found that Hb9 and Nkx6 primarily exert their control over neuronal specification via the repression of other transcription factors that govern neuronal specification. Further, we uncovered genes activated by Hb9 and Nkx6. Two of these genes – fd59a and Nitric oxide synthase (Nos) – we characterized in detail and identified as in vivo targets of Hb9 in the CNS. Our data begin to outline the downstream transcriptional networks through which Hb9 and Nkx6 direct neuronal differentiation and provide the first characterization of Fd59a and NOS expression and function in the Drosophila CNS.
MATERIAL AND METHODS
Drosophila stocks
Fly strains of the following genotype were used in the study: wild-type (w− and Canton S), UAS-GFP, UAS-CD8-GFP, Df(2R)BSC863, Df(2R)BSC864, Df(2R)BSC8635, Tdc2-GAL4, UAS-2x-EGFP, dachshund3 (Mardon et al. 1994), hb9kk30, hb9jj154, Nkx6d25, UAS-hb9, UAS-nkx6 (Broihier and Skeath, 2002; Broihier et al., 2004), elav-Gal4 (DiAntonio et al., 2001), en-Gal4 (Brand and Perrimon, 1993), y w hsflp, UAS-tau-myc-GFP, Act5c(FRT. CD2)GAL4 (Harrison and Perrimon, 1993), UAS-NOSIR-X (Caceres et al. 2011), UAS-Nos-iJF03220 (TRiP RNAi collection; BSC28792); Nos-iVDRC (line P{GD12013}v27722 from VDRC RNAi collection).
EMS mutagenesis and allele identification
To identify EMS-induced alleles of fd59a and Nos, we performed a standard autosomal recessive genetic screen. To identify mutant alleles of fd59a, we screened ~2000 lines each one carrying an independently mutagenized second chromomosome that when homozygous produced embryos with greatly reduced or no fd59a protein expression. The approach for Nos was identical except that we screened ~1000 lines and screened for NOS expression in the CNS of late-third instar larvae.
Lineage tracing
The methods used to trace the lineages of Hb9+ and Fd59a+ neurons were followed as described in Lacin et al. 2009.
Antibody production and immunostaining
DNA encoding the entire open-reading frame of the Fd59a protein or corresponding to amino acids 1–370 of NOS were independently PCR-amplified from full-length cDNA clones of Fd59a (SD02951) and Nos (RE15336) (DGRC) and then cloned in-frame into pET29a (Novagen) via the EcoRI and XhoI sites (Fd59a) or the Nde1 and Not1 sites (Nos). Standard methods were then used to express and purify the resulting protein fragment. Protein-specific antibody responses were then mounted in guinea pigs through commercial sources [Pocono Rabbit Farm and Laboratory (www.prfal.com).
RNA In situ hybridization assays and immunochemical staining
Digoxygenin-labeled RNA probes were generated and used to track the expression of specific mRNAs essentially as described in Jiang et al., 1991. Immunofluorescent and immunohistochemical stainings were performed as described by Patel, 1994. We used the following antibodies: Guinea-pig anti-Fd59a (1:1000; this paper), guinea-pig anti-NOS (1:150), rabbit and guinea pig anti-Hb9 (1:1500), rat anti-Nkx6 (1:1000), guinea pig anti-Deadpan (1:1000), and rabbit anti-GFP (1:1000, Torey Pines). Monoclonal antibodies (obtained from the Developmental Studies Hybridoma Bank, Iowa): MAbDAC2-3 (Dachshund 1:200), 1D4 (FasII; 1:10), BP102 (1:10), 4D9 (engrailed/invected; 1:10), 7E8A10 (ELAV; 1:10). Fluorescent secondary antibodies were obtained from Molecular Probes (Alexa 488, Alexa 594) or Jackson Labs (Cy5) and used at a 1:200 dilution. Immunohistochemical stainings were carried out using the Vectastain ABC Elite kit following manufacturers’ protocol (Vector Labs). Octopamine visualization is performed in tissues fixed with 2% EDAC (1-ethyl-3(3-dimethlyaminopropyl) and stained with anti rabbit-Octopamine (1:1000; Millipore).
Microarray Analysis
Fifty stage 14 embryonic nerve cords were dissected from embryos of each genotype; total RNA was purified from each genotype using the RNeasy kit (Quiagen). Purified RNA was linearly amplified and hybridized to Gene-Chip Drosophila Genome 2.0 Array (Affymetrix) by the GeneChip Facility at Washington University. Two biological replicates were prepared and completed for each genotype. Microarray data were normalized and analyzed by the DChip software (Li and Wong, 2001). Genes that showed a 1.8 fold change in expression with minimum absolute signal difference of 100 were assigned as possible targets of studied transcription factors.
Dam-Identification
The Hb9-Dam fusion construct was created by inserting the full-length Hb9 coding region obtained from plasmid pFLC-I-RE39081 (obtained from DGRC) into the Cmyc-Dam vector using the NotI enzyme site (van Steensel and Henikoff, 2001; obtained from S. Parkhurst). The resulting fusion gene contains the myc-tagged Dam portion in a C-terminal position to the Hb9 coding region (plasmid pHb9-Dam). Kc167 cells were transfected with pHb9-Dam, or the control plasmid, pNDam-myc (van Steensel and Henikoff, 2000), using Cellfectin reagent (Invitrogen) according to the manufacturer’s instructions, for 6 hrs. Cells were harvested after 2 days, and genomic DNA was isolated from 5×10⁶ cells using the DNeasy tissue kit (Qiagen) according to the manufacturer’s protocol for cultured cells. Methylated regions were isolated according to a protocol obtained from B. van Steensel (http://research.nki.nl/vansteensellab/) as follows: 2.5 μg of genomic DNA was EtOH precipitated and digested with DpnI (only digesting methylated DNA) for 12 hrs. After heat-inactivation of DpnI, the DNA fragments were ligated to AdR adaptors (annealed oligomers of AdRt: ctaatacgactcactatagggcagcgtggtcgcggccgagga and AdRb: tcctcggccg), followed by digestion with DpnII (to degrade non-methylated DNA). The ligated fragments were then PCR amplified using primer Adr-PCR (ggtcgcggccgaggatc) and PCR Advantage 2 reagents (Clontech). Triplicate samples from independent experiments were processed for hybridization to Drosophila 12Kv2 microarrays (J.T. Westwood, Canadian Drosophila Microarray Centre, Mississauga, Ontario, Canada) and analyzed with GeneTraffic software (Iobion Informatics).
Transgenic flies
UAS-lines
To generate a full-length UAS-fd59a transgene, we amplified the entire fd59a coding region from cDNA clone SD02951 (DGRC) and cloned it into the EcoRI-XhoI restriction sites of pUAST (Brand and Perrimon, 1993). To generate UAS-Nos, the Nos coding region was cloned into the NotI and XhoI (blunt-ended) sites of pUASt as a 4.7 Kb Not1 and BsrG1 (blunt-ended) fragment from the cDNA clone RE15336 (DGRC).
Enhancer-promoter constructs
Hb9, Lim3, and Tup: For each gene, we subdivided adjacent intergenic and internal intronic regions into overlapping ~2.5 kb fragments (see Fig. 2) and cloned each fragment upstream of its endogenous promoter, which itself was fused upstream of the 5′ region of the lacZ reporter gene, within a modified pCasper vector. We then introduced each construct into flies via standard P-element based germ-line transformation methods. Below, we list the coordinates of each genomic region assayed (coordinates refer to version r5.45 of the Drosophila genome sequence), where the Hb9 transcript is defined by the coordinates 3L: 7941286-7944663, that of Lim3 by the coordinates 2L:19,079,256..19,108,427, and that of Tup by the coordinates 2L: 18,859,500..18,881,256.
Figure 2. Identification of conserved sequence motifs in the RP neuron regulatory regions of Lim3, Tup, and Hb9.

(A–C) Wild-type nerve cords from stage 15 embryos stained for β-galactosidase reporter gene expression (green) and Hb9 expression (red). Hb9 expression was visualized in each panel in facilitate unambiguous identification of the neurons labeled by β-galactosidase. Arrows point to the Hb9+ neurons of the NB 2-2 lineage; arrowheads point to the RP neurons; asterisks identify the CoR motor neurons. Regulatory regions denoted by black bars drove reproducible gene expression in the CNS; regions denoted by striped bars did not drive reproducible gene expression in the CNS. (D) Weight matrices of three conserved sequence motifs identified in the RP neuron regulatory regions of Lim3, Tup, and Hb9. Known transcription factor binding sites similar to the identified motifs are shown below two of the motifs. In A, the large Lim3 regulatory region marked by an “*” is the Lim3A tau-myc reporter construct detailed in Thor et al. 1999.
Hb9 transgenes: coordinates of the endogenous Hb9 promoter: 3L: 7940963-7941486. Upstream constructs: Hb9-A: 3L: 7931073-7933277; Hb9-B: 3L: 7932763-7935284; Hb9-C: 3L: 7934786-7937410; Hb9-D: 3L:7936859-7939282; Hb9-E: 3L: 7938783-7940954 Downstream constructs: Hb9-F: 3L: 7944771-7943270; Hb9-G: 3L: 7946366-7948481; Hb9-H: 3L: 7948040-7950171; Hb9-I: 3L: 7949726-7951812; Hb9-J: 3L: 7951233-7953374.
Lim3 transgenes: coordinates of the endogenous Lim3 promoter used: 2L:19083591-19082970. Upstream Constructs: Lim3-A: 2L: 19094250-19091832; Lim3-B: 2L: 19092308-19089909; Lim3-C: 2L: 19090237-19087826; Lim3-D: 2L: 19088296-19085853; Lim3-E: 2L: 19086293-19083882.
Tup transgenes: coordinates of the endogenous Tup promoter used: 2L:18881734.18880689.
Upstream Constructs
Tup-A 2L: 18892245-18889773; Tup-B 2L: 18890235-18887798; Tup-C: 2L: 18888237-18885825; Tup-D: 2L: 18886207-18883858; Tup-E: 2L: 18884190-18881772.
Fd59a transgenes
To generate cis-regulatory enhancer-promoter GFP or GAL4 reporter lines for fd59a, we cloned three upstream fd59a genomic regions (A–C below with coordinates) into pStinger GFP reporter vector (DGRC, J. Posakony) using KpnI and SacII restriction sites and six genomic upstream fd59a genomic regions (67–72 below, with coordinates) into the GAL4 vector pBPGUw vector (Addgene) using Gateway cloning technologies (Invitrogen). The integrity of each construct was verified by sequencing, and commercial sources were used to generate germline transformants of each line via standard P element-based transformation methods (Rainbow Transgenics, Inc). The coordinates of the relevant genomic regions are detailed below (coordinates refer to basepair designations in version r5.45 of the Drosophile genome sequence.
GFP Enhancer-Promoter Lines
Enhancer A: 2R:18746260..18750315; Enhancer B: 2R:18748745..18754075; Enhancer C: 2R:18750930..18754075
Gal4 Enhancer-Promoter Lines: 67-Gal4
2R:18752605.. 18753470; 68-Gal4: 2R:18751808.. 18752527; 69-Gal4: 2R:18751087.. 18751806; 70-Gal4: 2R:18750476.. 18750881; 71-Gal4: 2R:18748976.. 18750100; 72-Gal4: 2R:18750476.. 18754075.
Behavioral Tests
Adult taste assay
The ability of adult flies to discriminate between different tastes was assayed essentially as in Lu et al., 2012. Approximately 50 three to four day-old male flies were starved overnight in plastic vials containing a wet strip of filter paper. On test day, the flies were briefly stunned on ice and transferred to the test plates, 60-well Nunc dishes which had alternate wells filled with 10 μl of either test substrate containing 1% food dye (red or blue). To test for the flies’ ability to distinguish between substrate with or without nutrition, the wells contained either 1% agarose alone or 1% agarose plus 2 mM sucrose. To test for their ability to taste bitter, the test substrates consisted of 4 mM sucrose in 1% agarose with or without 10 mM caffeine. For each genotype 250 flies were analyzed. To determine the proportion of flies that fed, 50 flies per genotype were put on a control plate with all wells containing sucrose only, plus food dye. The flies were allowed to feed for 2 hrs in the dark, frozen at −20°C, and then counted with respect to the dye color showing in their digestive systems to determine whether or not they showed a preference for either substrate.
Larval feeding behavior
To analyze larvae for differences in feeding behavior, the solid food assay developed by Shen (2012) was used. Just-molted 3rd instar larvae of the different genotypes were picked and either assayed immediately (non-starved) or starved for 2 hrs in a plastic vial containing a wet strip of filter paper. The larvae were rinsed in PBS, blotted dry using a Kimwipe, and transferred to a test plate which had been prepared as follows: 2.3% agar containing 10% glucose was poured into 35 mm petri dishes to a thickness of about 3.5 mm, left to solidify, and then cut into sections with a spatula. The cut plates were left to dry overnight to create gaps in the agar. 15 starved or non-starved larvae were added to the plate, allowed to settle for 5 min, and then the number of mouth-hook contractions per 30-second period was counted for each of the animals.
Climbing assay
10 male 2-day-old flies per genotype were transferred to food vials one day prior to the experiment in order to avoid anesthesia on the day of the test. On test day, they were transferred into a cut-off 25 ml plastic pipette, allowed to settle for 2 min, tapped gently to the bottom of the tube, and the time was recorded that it took for all flies to cross a mark at 15 cm from the bottom by walking up the sides of the pipet. 50 flies were tested for each genotype.
Fly Bowl behavioral assay
At least 48 hours prior to the experiment, flies were sorted into groups of 10 females and 10 females and then maintained in dextrose food media vials prior to starvation. 24 hours prior to the experiment, the groups were transferred to agar media vials for wet starvation. Directly prior to the experiment, the group of flies, 3–5 days post-eclosion, were aspirated into the assay arena and allowed to settle for 3.75 min. The behavior of the group of flies in the shallow dish walking assay, Fly Bowl, was recorded by a digital video camera at 30 fps. The flies in these videos were then tracked using the Ctrax software (Branson et al., 2009) and a variety of locomotor and social behaviors were automatically annotated using the JAABA software (Kabra et al., 2013). For each video, we computed the fraction of frames annotated as performing a behavior (walking, stopped), averaged over all flies in the video. These data were significantly different than a normal distribution (Kolmogorov-Smirnov test) thus a non-parametric test, the Mann-Whitney U test, was used to determine statistical significance.
RESULTS
Embryonic Hb9+ neurons arise from at least eight neuronal lineages
Prior gene expression studies mapped Hb9+ neurons to well characterized neurons in five embryonic neuronal lineages: the MP1 lineage, dMP2 of the d/vMP2 lineage, the RP1, RP3-5 motor neurons of NB 3-1, the CoR motor neurons of NB 4-2, and the three EW interneurons of NB 7-3 (Broihier and Skeath, 2002; Odden et al., 2002; Lacin et al., 2009). These studies left unidentified the lineal origin of over half of embryonic Hb9+ neurons. Thus, we used a modified version of the FLP/FRT lineage tracing system (Harrison and Perrimon, 1993; see materials and methods) to map all Hb9+ neurons to their respective neuronal lineages. Briefly, we generated random clones of tau-myc-GFP+ cells in otherwise wildtype embryos and screened for GFP+ lineage clones that contained Hb9+ neurons. Comparison of the morphology and location of these clones relative to those of identified neuroblast lineages as determined by Dil-labeling (Bossing et al., 1996; Schmidt et al., 1997; Schmid et al., 1999) enabled us to map essentially all Hb9+ neurons in abdominal segments to eight neuronal lineages (Fig. 1).
Figure 1. Hb9+ neurons arise from eight different CNS lineages.

(A–H) High magnification ventral views of CNS lineage clones (green) that contain Hb9+ neurons (red); FasII (blue) labels axon fascicles allowing identification of the axon tracts followed by GFP-labeled axons. Arrowheads identify the motor neuron exit(s). (A) Two-cell clone of sibling Hb9+ MP1 intersegmental interneurons. (B) Two-cell clone of d/vMP2 sibling neurons; dMP2 visceral motor neuron (arrow) expresses Hb9. (C) A partial clone of the NB 3-1 lineage contains three Hb9+ motor neurons. (D) A lineage clone of NB4-2 contains the well-characterized Hb9− RP2 motor neuron (asterisk) and three Hb9+CoR motor neurons (arrow); two Hb9+interneurons located ventral to the CoRs are not visible at this focal plane. (E) The well-characterized NB 7-3 lineage generates three EW interneurons, which express Hb9, and the Hb9−GW motor neuron. (F) A single-cell clone of the motor neuron in theNB5-2 lineage extends an axon contralaterally out of the CNS. (G) NB2-2 generates a large clone of motor neurons and interneurons; 6 ventral Hb9+ interneurons reside in the NB2-2 lineage. (H) Lineage clone of NB1-2 contains only interneurons, four of which express Hb9 and project axons contralaterally via the posterior commissure (arrow). (I) Ventral to dorsal views of Hb9+ neurons in abdominal segments with the lineal identity of each cluster shown. (J) Schematic representation of Hb9+cell lineages. White or black line mark the midline of the CNS.
We confirmed that the characterized MP1, dMP2, RP1, RP3-5 and EW neurons express Hb9 (Fig. 1A–C, E). Our work also extended the analysis of Hb9 expression in the NB 4-2 lineage, confirming that the CoR motor neurons express Hb9 (Fig. 1D) and showing that two-to-three additional Hb9+ interneurons reside in the 4-2 lineage in abdominal segments and that three-to-four more Hb9+ interneurons reside in this lineage in thoracic segments (Fig. 1D, J; not shown).
Finally, our studies mapped the remaining Hb9+ neurons in abdominal segments to three other NB lineages. We identified three clones that contained the same cluster of four to six Hb9+ interneurons in abdominal (and thoracic) segments (Fig. 1H–H′). In these clones neurons extend axons contralaterally across the posterior commissure (Fig. H–H′, Fig. S1); the largest clones of this lineage also contain neurons that extend axons across the anterior commissure of the next-most posterior segment (not shown). The morphology of these clones most closely resembles that of NB 1-2, which in abdominal segments generates a clone of interneurons that extend axons across the midline largely via the posterior commissure, but also via the anterior commissure of the next most posterior segment (Schmid et al., 1999; Fig. S1). In this lineag,e Hb9 expression is dynamic: during stage 13–14, four-to-six neurons express Hb9 strongly; by stage 16 only three-to-four of these neurons express Hb9. As detailed below, this set of Hb9+ neurons co-expresses Fd59a, and analysis of fd59a promoter constructs confirms that the Hb9+ neurons of this lineage extend axons across the posterior commissure but not into the periphery (see Fig. 7E).
Figure 7. Hb9 is necessary and sufficient to activate Fd59a expression in the embryonic CNS.

(A–G) Ventral views of stage 16 Drosophila nerve cords of the indicated genotypes labeled for Fd59a (brown/red) and GFP (green). (A) Wildtype pattern of Fd59a expression: arrowheads and arrows point, respectively, to the lateral and medial Fd59a+ neurons that express Hb9; asterisk marks Fd59a+ Hb9− neurons. (B) In hb9kk30 homozygous mutant embryos, Fd59a expression is lost in the medial neurons (arrows) and decreased in the lateral neurons (arrowheads). (C) hb9kk30 nkx6d25 double mutant embryos exhibit a more severe loss of Fd59a expression in these cells. (D) Pan-neuronal expression of hb9 caused a significant increase in the number of lateral Fd59a+ neurons (arrowheads). (E, F) Fd59a+Hb9− medial neuron (asterisk, E) and Fd59a+Hb9+ neurons (arrowheads, F) are labeled by en-Gal4::CD8-GFP. (G) Overexpression of Hb9 by engrailed-GAL4 caused a significant increase in the number of lateral Fd59a+ neurons. Anterior is up; white/black line marks ventral midline.
We also identified six clones that contained a cluster of six Hb9+ neurons located at the most ventral region of the nerve cord. These clones contain both interneurons, which extend axons across the anterior commissure, and motor neurons, which extend axons ipsilaterally out the segmental nerve. The morphology of these clones most closely matches that of the NB 2-2 lineage (Fig. 1 G–G′; Schmid et al., 1999). The Hb9+ neurons in this lineage are interneurons: partial clones of the lineage that lack some of the first-born neurons are composed solely of interneurons and include the six Hb9+ neurons; none of these neurons express the motor neuron markers vGLUT or FasII (not shown). Thus, six Hb9+ interneurons reside in the 2-2 lineage, and the motor neurons of this lineage arise from early NB divisions.
We also identified several single-cell clones of a large, dorsally-positioned Hb9+ motor neuron that extends an axon contralaterally across the posterior commissure and into the periphery (Fig. 1 F–F′, I″). The sole motor neuron of the NB 5-2 lineage is the only motor neuron that projects an axon along this path (Schmid et al., 1999).
We and others have identified extensive overlap between the expression patterns of the Hb9, Nkx6, Tup, and Lim3 transcription factors in the embryonic ventral nerve cord (Thor et al., 1999; Broihier and Skeath, 2002; Odden et al., 2002; Broihier et al. 2004; Certel and Thor, 2004, Cheesman et al., 2004). Our completion of a lineage map of all Hb9+ neurons in the embryonic CNS allows integration of the expression patterns of these transcription factors onto this map (Table 1). Notably, Lim3 and Nkx6 display almost complete co-expression with Hb9 (Table 1). We also find that all Hb9+ motor neurons that innervate body wall muscles co-express Nkx6, Lim3, and Tup, but that dMP2, the sole Hb9+ visceral motor neuron, co-expresses only Nkx6. The ability to link complex gene expression patterns to defined lineages and neurons should facilitate future studies that assess the function of these transcription factors in neuronal specification and differentiation.
Table 1.
Relative expression of Lim3, Islet, and Nkx6 in Hb9+ lineages
| Lineage | Nkx6 | Lim3 | Islet |
|---|---|---|---|
| MP1 | Yes | Yes | No |
| dMP2* | Yes | No | No |
| NB1-2 | Yes | Yes | No |
| NB2-2 | Yes | Yes | No |
| NB3-1* | Yes | Yes | Yes |
| NB4-2* | Yes | Yes | Yes |
| NB5-2* | Yes | Yes | Yes |
| NB7-3 | No | Yes | Yes |
Lineages marked with a ‘*’ generate an Hb9+ motor neuron.
Coordinate regulation of Hb9, Lim3, and Tup expression in the CNS
hb9, lim3, and tup are expressed in largely overlapping patterns of neurons (Fig. S2), turning on in these neurons just after they become post-mitotic (Broihier and Skeath, 2002; Broihier et al. 2004). Nkx6 in contrast is expressed in many neuroblasts and ganglion mother cells in addition to post-mitotic neurons. Functional studies suggest that hb9, lim3, and islet are regulated largely independently of each other (Broihier et al., 2004). Thus, due to the similar temporal and spatial expression dynamics of hb9, lim3, and islet, we combined molecular and bioinformatics approaches to explore whether they are co-regulated by a common set of upstream factors.
First we set out to define the regulatory regions of hb9, lim3, and tup that drive gene expression in the CNS. We subdivided the surrounding intergenic regions of each gene into overlapping 2.5 kb fragments (Fig. 2) and tested each fragment for enhancer activity by cloning it upstream of its endogenous promoter and the lacZ reporter gene. We also made use of a lim3 enhancer construct (Lim3A-Tau-myc) created in a prior study (Fig. 2 top; Thor et al., 1999). Our results are summarized in Fig. 2, and, as expected, indicate that the CNS expression pattern of each gene arises from the activity of multiple regulatory regions. In fact, we were able to identify regulatory constructs of each gene that drove expression in the same cluster of neurons (Fig. 2). For example, if one focuses on the RP1, RP3-5 motor neurons (hereafter referred to as the RP neurons; arrowheads, Fig. 2), we found that our Lim3-C construct and the Lim3A-Tau-myc construct of Thor et al (1999) drove reporter-gene expression in the RP neurons (Fig. 2A); the Tup-A construct drove gene expression in the RP neurons (Fig. 2B), and the Hb9-G construct and to a lesser extent the Hb9-H construct drove gene expression in the RP neurons (Fig. 2C). In some cases, this analysis allowed us to tentatively localize regulatory regions for the RP (and other) neurons to regions of overlap between constructs. For example, our Lim3-C construct and the larger Lim3A-Tau-myc construct made by Thor et al. (1999) overlap by ~1.4 kb and both drove gene expression in the RP neurons (Fig. 2A, arrowheads), suggesting that regulatory elements sufficient to drive expression in the RP neurons reside in the region of overlap between the two constructs.
To see if hb9, lim3, and islet are likely co-regulated by common upstream factors, we focused on the experimentally identified regulatory regions of the RP neurons for each gene and searched for conserved sequence motifs common to all three regions. For each experimentally defined regulatory region, we used BLAST to identify the orthologous region from five other drosophilid species (D. pseudoobscura, D. virilis, D. mojavensis, D. grimshawi, and D. persimilis) and then used the sequence of the 18 regions (three gene-specific regulatory regions x 6 species) as input into PhyloCon, a computer algorithm that leverages phylogenetic and co-regulation data to detect over-represented sequence motifs that are also phylogenetically conserved (Wang and Stormo, 2003). We predicted three top motifs at a statistical cutoff of a p-value less than 1E-40 (shown in Fig. 2D). Further examination of these motifs revealed connections to binding sites of relevant transcription factors. Motif 1 contains a palindrome of the consensus homeodomain-binding site (Fig. 2D, left). When searched against the TransFac database (Matys et al., 2006) we found that motif 2, found in both the RP and CoR motor neuron regulatory regions, resembled the Oct1 binding site (Fig. 2D, middle), and motif 3 resembled the binding site of RP58, a zinc-finger transcriptional repressor that exhibits sequence similarity to a number of Drosophila proteins (Fig. 2D, right), including Kruppel. We next evaluated the statistical significance of the occurrence of each of these motifs in the identified regulatory regions. To do this, we selected random sequences from the D. melanogaster genome while maintaining the length, nucleotide composition, and conservation level of the identified regulatory regions. We scanned the three motifs against these sequences and repeated the test 10,000 times to generate background statistical distribution. Our results indicated that these three motifs occurred more frequently in the identified regulatory regions than expected by chance (motif 1: logodds=5.87, p-value=1.45E-9; motif 2: logodds=3.31, p-value=9.41E-6; motif 3: logodds=3.6, p-value=2.05E-3). Future work is required to address the functional significance of these motifs, but our studies provide evidence that a common set of upstream factors act through functionally equivalent regulatory regions in lim3, hb9, and islet to coordinately regulate the expression of these genes in overlapping sets of neurons.
Identification of genes regulated by Hb9 and Nkx6 in the CNS
Hb9 and Nkx6 are co-expressed in nearly identical sets of motor neurons and interneurons, and act in a partially redundant manner to promote the differentiation of these neurons (Broihier and Skeath, 2002; Odden et al, 2002; Broihier et al., 2004; Cheesman et al., 2004). Despite their importance in neuronal development, few downstream targets of Hb9 and/or Nkx6 have been identified in vertebrates or Drosophila. To identify such targets, we performed microarray analysis to identify mRNAs up- or down-regulated in response to pan-neuronal overexpression of Hb9 and Nkx6, and used the Dam-ID approach to identify genes directly bound by Hb9.
For our micro-array approach, we obtained mRNA from manually dissected stage 14 nerve cords of embryos that expressed Hb9 and Nkx6 (ELAV-GAL4>Hb9, Nkx6) or GFP (ELAV-GAL4>GFP) throughout the nervous system and assessed the expression level of each mRNA via standard micro-array profiling methods (see methods). A comparison of transcript levels between the two genotypes identified 450 transcripts that changed their expression at least 1.8-fold upon Hb9 and Nkx6 mis-expression: the levels of 250 transcripts were reduced; the levels of 200 transcripts were increased (Table S1). In the Dam-ID approach, transcription factor binding sites are marked in vivo by methylation via E. coli DNA adenine methyltransferase (Dam), which has been fused to the transcription factor of interest. Here, we assessed the relative abilities of an Hb9-Dam fusion protein and a Myc-Dam fusion protein to methylate genomic DNA in Kc167 cells, uncovering approximately 800 genes with average log2 ratios of 1 or greater (i.e. with at least a 2-fold difference between the Hb9-Dam and Dam samples), and a Tdist value less than 0.2 (see methods) (Table S2).
To verify the quality of each data set, we assayed for changes in gene expression in embryos overexpressing Hb9 or Hb9 and Nkx6 in their entire nervous system. For the micro-array approach, we selected 54 genes based on high fold-change in mRNA expression level and/or a characterized CNS function. For the Dam-ID approach, we selected 21 genes based on known expression in the CNS or intestine (tissues where Hb9 is expressed) and high fold-change in methylation. Of the 54 genes tested from the micro-array, 26 exhibited the predicted change in expression – 18 were repressed and 8 activated by generalized Hb9/Nkx6 expression (Fig. 3). Of the 21 genes tested from the Dam-ID approach, 14 displayed a change in expression: 9 showed a loss of expression (e.g. painless and nmr2; Fig. 3), and five showed an increase of expression (e.g. thor and Nos; Fig. 3). These results suggest both datasets are enriched for genes regulated by Hb9 (and Nkx6).
Figure 3. Genes regulated by ubiquitous expression of Hb9 and Nkx6 in the CNS.
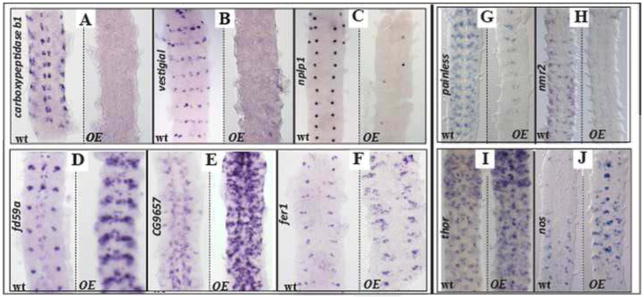
(A–F) Stage 15 embryonic Drosophila nerve cords of the indicated genotype (wild type, wt, or overexpression “OE”) stained for mRNA expression of genes identified in the micro-array screen (written vertically). Anterior is up in all panels. (A–C) Generalized expression of Hb9 and Nkx6 in the CNS represses the expression of carboxypeptidase b1(A), vestigial (encodes a transcription factor) (B), and nplp1 (encodes a neuropeptide) (C). (D–F) Generalized expression of Hb9 and Nkx6 activates expression of fd59a (D), cg9657 (encodes a channel protein) (E), and fer1 (encodes a transcription factor) (F). (G–J) Stage 15 embryonic Drosophila nerve cords of the indicated genotype stained for the mRNA expression of genes identified in the Dam-ID approach. Generalized expression of Hb9 alone represses the expression of (G) painless (encodes an ion channel) and (H) nmr2 (encodes a transcription factor), but activates the expression of (I) thor (encodes 4E-BP) and (J) Nos.
In the micro-array experiment, sequence-specific transcription factors were the most over-represented class of genes regulated by Hb9 and Nkx6. In the CNS of control embryos, we identified 8625 genes expressed above baseline levels, and 564 (6.5%) of these genes encode transcription factors. But 15.8% (n=71/450) of Hb9/Nkx6-regulated genes encode transcription factors (p<1E-11; hypergeometric test). Of the 71 transcription factors (three of which were identified in the Dam-ID approach), 61 were downregulated upon Hb9 and Nkx6 overexpression. Whole mount expression studies of a random sampling of 31 of the 71 transcription factors, confirmed that Hb9/Nkx6 over-expression regulated the CNS expression of 26 of them: in ELAV-GAL4>Hb9/Nkx6 embryos, 23 of the 25 transcription factors predicted to be repressed by Hb9/Nkx6 overexpression showed a clear reduction in CNS expression; 3 of the 6 transcription factors predicted to be activated by Hb9/Nkx6 overexpression displayed a clear increase in CNS expression (Fig. 3; Table S4). Thus, Hb9/Nkx6 appear to regulate neuronal differentiation via the coordinate regulation, in most cases repression, of many transcription factors.
Of note, Hb9 itself was found to repress its own transcription and to bind near its own promoter. We verified that Hb9 represses its own transcription (and that of Nxk6) by using anti-sense digoxygenin-labeled RNA probes made from the 3′ UTR of each gene, regions lacking from the relevant UAS-transgenes: Over-expression of Hb9, but not Nkx6, was alone sufficient to repress Hb9 and Nkx6 expression. Of note, Nkx6 is expressed less strongly in Hb9+ neurons relative to Hb9− neurons (Fig. S3), consistent with the idea that Hb9 represses Nkx6 expression under normal conditions, but loss of hb9 function does not lead to an overt increase in Nkx6 expression in these neurons. Thus, if Hb9 represses nkx6 it acts redundantly with other transcription factors to do so, similar to how Hb9 has been shown to act with Nkx6 to repress eve expression (Broihier et al. 2004) and to activate fd59a expression (see below).
Based on our characterization of the identified genes, we chose two genes activated by Hb9 – Nos and fd59a – for further study. We selected Nos because it was identified by both approaches, was one of the top hits in the Dam-ID method, and was ectopically expressed upon pan-neuronal over-expression of Hb9 in the embryonic CNS. We selected fd59a because it encodes one of the few transcription factors that showed increased expression in response to Hb9 and Nkx6 overexpression and because its mRNA expression showed reciprocal changes in embryos that lacked hb9 and nkx6 function and those that overexpressed hb9/nkx6 in the CNS.
Hb9 activates Nos in the larval CNS
To characterize NOS protein expression at single-cell resolution, we generated affinity-purified anti-sera specific to NOS (Fig. 4, S4–5). We first detect NOS protein expression towards the end of embryogenesis in a stereotyped pattern of cells in the brain and ventral nerve cord. Within expressing cells, Nos localizes to the cell membrane, cell body, and axons (Fig. 4, S4–5). We observe co-expression between NOS and many transcription factors at this stage. NOS is co-expressed with Eve in two-to-four Eve-lateral neurons, with Apterous in one neuron, and with Engrailed in two-to-three progeny of the median neuroblast (Fig. S4). We also observe co-expression between NOS and Hb9 in two neurons in each thoracic hemisegment: one neuron appears to be in the 2-2 lineage (Fig. S4); the other neuron only forms in thoracic segements. Expression of NOS was, however, unaltered in the CNS in hb9 mutant embryos (Fig. S4). Thus, hb9 is sufficient but not necessary to activate NOS protein expression in the embryonic CNS.
Fig. 4. Hb9 regulates NOS expression in the larval CNS.
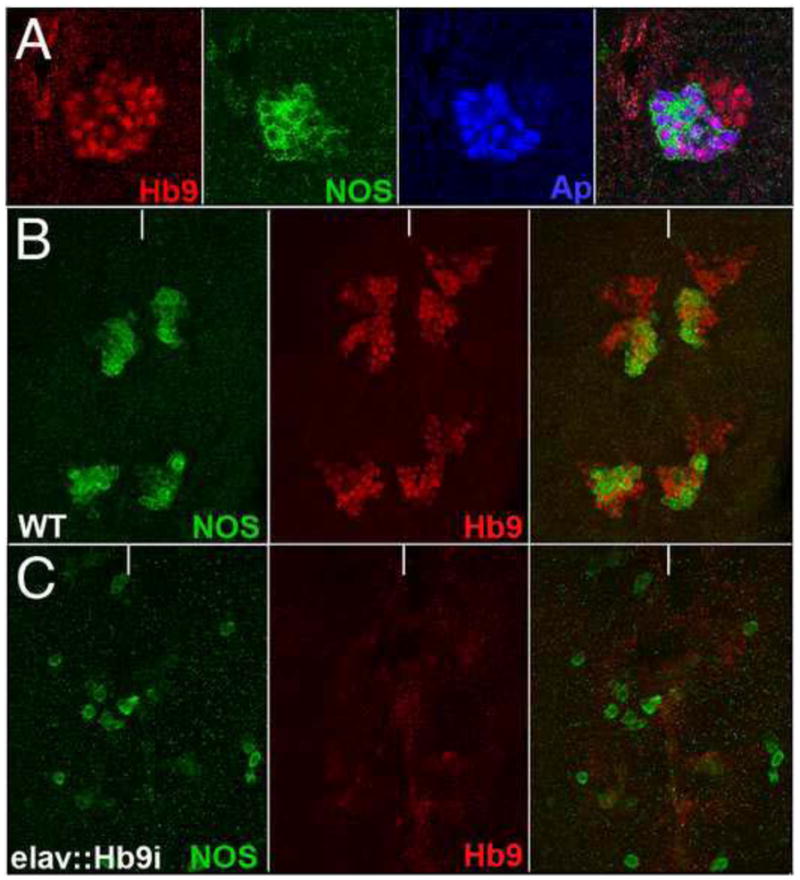
High magnification ventral views of the thoracic region of late-third instar larval nerve cords labeled for Hb9 (red), NOS (green), and Apterous (blue). (A) Hb9, NOS, and Apterous expression in a portion of one thoracic neuromere. (B–C) NOS (green) and Hb9 (red) expression in two thoracic segments of a wild-type nerve cord (B) and a nerve cord in which hb9 function was depleted via RNAi (C). Anterior is up; white line indicates the ventral midline.
In the late-third instar larval central brain and ventral nerve cord, NOS is expressed in a complex pattern of neurons, with many NOS+ neurons being neurosecretory in nature (Fig. S4). For example, NOS is co-expressed with PTTH in the PTTH+ neurons that trigger ecdysone pulses via their innervation of the prothoracic gland (Agui et al., 1979), with perisulfakinin (PSK), a satiety signal (Wicher et al. 2007), in two neurons in the brain, with Diuretic hormone 31 (DH31) in the nerve cord, with dILP2 in two neurons deep inside each brain hemisphere (these are the not the well-characterized insulin-producing cells of the brain), and with Hugin, which regulates feeding behavior (Bader et al. 2007), in the subesophageal ganglion. NOS expression in many neurosecretory neurons suggests a modulatory role for nitric oxide in these neurons.
In the late-third instar larval nerve cord, we observed co-expression between Hb9 and NOS in a small cluster of neurons in each thoracic hemisegment (Fig. 4). Within these Hb9+ clusters, NOS expression also overlapped with the expression of Apterous-lacZ (Fig. 4). To test whether Hb9 or Apterous promote NOS expression in these clusters, we used ELAV-GAL4 to drive expression of a UAS-Apterous-RNAi or a UAS-Hb9-RNAi transgene throughout the larval CNS. Nos expression appeared unchanged when apterous function was depleted in the CNS (not shown), but was clearly reduced upon depletion of hb9 function (Fig. 4C). Overexpression of Apterous or Hb9 in the CNS failed to induce ectopic NOS expression (not shown). Thus, Hb9, but not Apterous, is necessary to promote NOS expression in these clusters of Hb9+ neurons.
Loss of Nos function leads to hyper-active flies
Phenotypic studies on Nos are controversial. A 2004 study concluded Nos is an essential gene required for larval growth and pupariation based on phenotypic analysis of the NosC allele (Regulski et al., 2004). A 2010 study attributed these phenotypes to a linked mutation in a nearby essential gene, and showed that flies homozygous for NosC alone, or for a targeted deletion that removes most of the Nos gene, yield homozygous viable, fertile, overtly normal flies under standard conditions (Yakubovich et al., 2010). A third more recent study found that prothoracic gland-specific depletion of Nos, via the use of a specific Nos-RNAi line, gave rise to large larvae and blocked pupariation, with additional data suggesting that Nos governs developmental transitions by regulating steroid hormone receptor function (Caceres et al., 2011).
To address this controversy and to assay the function of Nos in the CNS, we used a forward EMS-based genetic screen to generate and identify a mutant allele of Nos based on loss of NOS protein expression. From ~1000 lines screened, we identified one Nos allele. The Nos1 allele contains a premature stop codon in place of tryptophan at amino acid 591 of the 1349 NOS protein (using the sequence of isoform A); this tryptophan appears completely conserved between insects and mammals. The brains and nerve cords of third instar larva homozygous mutant for Nos1 lacked detectable NOS protein expression (Fig. S5). Of note, the protein fragment to which we generated our NOS antibody resides entirely N-terminal to the premature stop codon in the Nos1 allele (see Methods). Thus, our inability to detect NOS protein in Nos1/Nos1 larvae suggests that Nos transcripts undergo nonsense-mediated decay in this background.
To assess Nos function in Drosophila, we followed the development of larvae and adult flies homozygous mutant for Nos1 or NosΔ15, a deletion allele of Nos (Yakubovich et al., 2010), of trans-heterozygous for both alleles. Late-third instar larvae of each genotype lacked detectable NOS protein expression (Fig. S5), but exhibited normal development and developmental timing, and gave rise to viable, fertile, and morphologically wild-type adult flies (not shown). Analysis of the larval CNS of each genotype revealed no clear change to CNS architecture, development, or gene expression. Thus, we find that Nos function has no apparent effect on CNS development and is dispensable for viability.
In mammals, Nos has been shown to regulate behavior (Nelson et al., 1995). Thus, we assessed whether loss of Nos function altered fly behavior, focusing on feeding and locomotor tests. Due to the effect of genetic background on behavior, we strictly compared adult flies transheterozygous for Nos1 and NosΔ15 to those tranheterozygous for NosΔ15 and the unmutagenized cn bw sp chromosome in which we generated the Nos1 allele. In two taste-discriminating tests (see Methods), we found no significant difference between the ability of adult flies of these genotypes to distinguish between nutritious and non-nutritious food and bitter and non-bitter food (not shown). Similarly, we found no significant difference between the feeding behavior of fed or starved larvae of each genotype as quantified by the rate of mouth hook contractions (not shown; see Methods). Thus, loss of Nos function had no overt effect on taste or feeding behavior.
To assess locomotor activity, we first compared the climbing rate of groups of adult flies of each genotype, although Nos mutant male flies exhibited a tendency to climb faster than control flies, we failed to observe a significant difference between the two groups (not shown). Thus, we subjected groups of flies of both genotypes to automated video analysis of stereotyped fly behavior (Kabra et al., 2013) and focused on the two most common fly behaviors – walking and stopping. In our analysis, Nos mutant flies walked significantly more and stopped significantly less than control flies (Fig. 5; see methods). Thus, loss of Nos function appears to lead to hyper-active behavior in flies. In mammals loss of Nos function appears to increase aggression (Nelson et al., 1995). Thus, our work supports an evolutionarily conserved role for Nos in regulating animal behavior, and specifically in dampening behaviors marked by heightened activity.
Figure 5. Loss of Nos function leads to over-active flies.
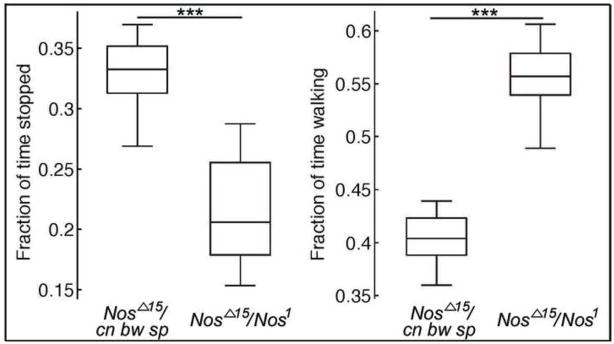
Schematic showing fraction of time spent stopped or walking for flies of the indicated genotype. The center line denotes the median, the rectangle marks the 25th and 75th quartile of the data, and the whiskers show the range of the data. For flies of the NosΔ15/cn bw sp genotype, data are shown for 12 cohorts of 20 flies (10 males and 10 females). For flies of the NosΔ15/Nos1, data are shown for 10 cohorts of flies (10 males and 10 females). Each n is the data forall 20 flies during the entire video). The difference in the fraction of time spent stopped or walking is significant between the two genotyps: p = 1.9 × 10⁻⁴ (stopped); p = 8.7 × 10⁻⁵ (walking). The collected data did not pass normality tests; thus, the Mann-Whitney U test was used to test for significance.
Based on the work of Caceres et al (2011), we also tested the effect of depleting or overexpressing Nos function specifically in the prothoracic gland. We confirmed that prothoracic gland-specific expression of the UAS-Nos-RNAiIR-X line used by Caceres et al (2011) delayed pupariation and resulted in large larvae (Fig. S6). But, in our hands, prothoracic-gland specific expression of two other Nos-RNAi lines failed to yield a developmental delay and gave rise to normal adult flies in the normal time-frame (Fig. S6). We also found that prothoracic gland-specific expression of a wild-type Nos transgene delayed pupariation and resulted in large larvae as observed for the UAS-Nos-RNAiIR-X line (Fig. S6). Our data argue that under standard lab conditions Nos is not an essential gene and its loss does not delay developmental timing. In fact, our data suggest that Nos over-expression, rather than its loss, delays developmental timing. Nitric oxide (NO) has been shown to act as an irreversible inhibitor of cytochrome P450 proteins (Minamiyama, Y., et al., 1997; Drewett, J.G., et al., 2002). In the prothoracic gland, a cascade of P450 proteins convert cholesterol into ecdysone (Rewitz, K.F., et al., 2006). The delayed pupariation and enlarged larvae phenotypes observed upon Nos overexpression in the prothoracic gland are consistent with NO inhibiting ecdysone production in this tissue, and thus developmental transitions, through its inhibition of cytochrome P450 proteins.
We struggle to reconcile our data with that of Caceres et al (2011). Nos is a complex gene with many isoforms. Thus, some of the conflicting results may arise due to isoform-specific functions of Nos as well as the potential for different Nos alleles, RNAi lines, and antibodies to deplete the function of, or to detect, a subset of Nos isoforms. For example, Caceres et al (2011) used Western analysis to identify a 100kDa prothoracic-gland specific isoform of Nos, but using our antibody we failed to detect NOS protein expression reproducibly in the prothoracic gland. NOS also regulates the hypoxic and anoxic response in Drosophila (Dijkers and O’Farrell, 2009) and may be involved in adaptive organismal responses to other environmental conditions. Thus, differences in the conditions used to rear Drosophila between labs may underlie the contrasting results. Clearly, additional work is required to clarify the presently muddy picture of Nos function in flies, but our study does underline a conserved role for Nos in regulating animal behavior, specifically in dampening hyper-active or aggressive behavior.
Fd59a, the Drosophila FoxD ortholog, is expressed in Hb9+ and octopaminergic neurons
Fd59a was one of the few transcription factors that showed increased expression in response to Hb9 and Nkx6 overexpression. fd59A encodes a forkhead-box (FOX) domain-containing transcription factor (Lee and Frasch, 2004). Reciprocal best-Blast analysis between the Drosophila and mouse proteomes identified FOX-D3/4 as the mouse proteins with the greatest sequence similarity to Drosophila Fd59a (Fig. 6A). The closest paralog of fd59a in the Drosophila genome is crocodile, a FOX-C gene family member. Thus, the Drosophila genome encodes a single FOX-D family protein, Fd59a.
Figure 6. FD59A, the Drosophila FoxD ortholog, is expressed exclusively in the CNS.

(A) Amino acid alignment of the forkhead domains of Drosophila Fd59A, Crocodile, and the murine and C. elegans FOX-D family members. Crocodile is a member of the Fox-C protein family and is the Drosophila forkhead domain-containing most closely related protein to Fd59A. Red letters indicate amino-acid differences between Drosophila Fd59A and the other proteins. (B–G) Fd59a expression in the CNS of the embryonic, late third instar, and adult CNS at the indicated stages. (B) Arrows mark a cluster of Fd59a+ cells in each brain lobe. In C–E, arrow labels Fd59a+ midline neurons; arrowheads label Fd59a+ lateral neurons. (F)Ventral view of late third instar brain lobes and CNS labeled for Fd59a expression (green). (G) Fd59a expression in the adult brain, with prominent expression in the optic lobe. (H–I) Ventral views of a single segment from wild-type stage 16 embryos labeled for Fd59a (red) and either Hb9 (green, H) or Tdc2-Gal4 (green, I). (H) The lateral Fd59a+ neurons (arrows) and a single medial Fd59a+ neuron (arrowheads) express Hb9. (I) The midline Fd59a+ neurons and the other medial Fd59a+ neuron, the TB neuron (asterisk), are labeled by Tdc2-GAL4. Black or white bars indicate the midline. Anterior is up.
To initiate a detailed analysis of Fd59a expression in the CNS, we generated Fd59a-specific antibodies (see methods; Fig. 6B–D). During embryogenesis, we first detected Fd59a in two brain NBs and a few of their progeny in early stage 11 (not shown). By stage 12, large clusters of Fd59a+ cells resided in these locations, presumably generated by the Fd59a+ NBs; these Fd59a+ neurons co-express the Dachshund (Dach) transcription factor (Fig. 6B, not shown). In these neurons, Fd59a and Dach are expressed independently of one other: loss of dach function had no effect on Fd59a expression; loss of fd59a function, using the protein null allele of fd59a we generated (see below and Fig. 8), had no effect on Dach expression (not shown).
Figure 8. Cis-regulatory analysis of the fd59a genomic region.

(A) Schematic representation of the genomic region between inaD and fd59a, with the location of the genomic fragments used to create enhancer-reporter constructs indicated. Green lines represent genomic regions cloned directly upstream of the GFP reporter gene; blue lines indicates genomic regions cloned directly upstream of the Gal4 gene. (B–C) Genomic region C (B, not shown) is sufficient to drive GFP reporter gene expression in most Fd59a+ neurons in the embryonic ventral nerve cord (B–B′) and brain (C–C′). Enhancer 69 is sufficient to drive CD8-GFP reporter gene expression in all embryonic Fd59a+ neurons (red) plus several clusters of unrelated neurons (D–D′). 69-Gal4::UAS-CD8-GFP labels the axonal projections of lateral Hb9+Fd59a+ neurons, which cross the midline via the posterior commissure (E). 69-Gal4::UAS-CD8-GFP marks essentially all Fd59a+ neurons in the larval CNS (F–F′). Anterior is up; white line indicates ventral midline.
Within the segmented portion of the nerve cord, Fd59a expression initiates during late stage 11 in a few discrete neurons in the medial and lateral region of the CNS (Fig. 6B). By stage 13, three midline neurons express Fd59a+ strongly in abdominal segments, with additional Fd59a+ midline neurons present in thoracic segments (Fig. 6C). Moving laterally, two bilateral pairs of medial neurons express Fd59a; these pairs of neurons are well separated from each other along the A-P axis, with the posterior pair expressing Fd59a more strongly than the anterior pair (Fig. 6C). In the lateral region of the CNS, a cluster of four neurons expresses Fd59a at moderate levels in each abdominal hemisegment, with six Fd59a+ neurons present per cluster in thoracic segments. This pattern of Fd59a+ neurons persists to the end of embryogenesis, except that in abdominal segments two of the lateral neurons down regulate Fd59a expression, leaving on average two Fd59a+ neurons per lateral cluster (Fig. 6D–E).
Double-label analysis subdivided Fd59a+ neurons into two classes – Hb9+ neurons and octopaminergic neurons. The lateral Fd59a+ neurons and the posterior pair of medial Fd59a+ neurons express Hb9 and Nkx6 (Fig. 6H). As shown below, Hb9 is necessary and sufficient for Fd59a expression in these neurons. Our Hb9 lineage analysis (Fig. 1) and the generation of Fd59a+ lineage clones identified the lateral Fd59a+ neurons as Hb9+ interneurons of NB 1-2 (Fig. S1). We failed to obtain lineage clones of the medial Hb9+ Fd59a+ neuron, but based on its relative location in the Hb9 expression pattern, this neuron arises from either the NB2-2 or NB3-1 lineage, which co-mingle. Analysis of a panel of molecular markers that label defined subsets of midline cells identified the three Fd59a+ midline neurons as the octopaminergic neurosecretory mVUM midline neurons (Fig. 6I), as has been described by Wheeler et al., 2006 and Henry et al. 2012, and the anterior pair of medial Fd59a+ neurons as the TB neuron of the NB1-2 lineage (Fig. 6). Both groups of cells are labeled by TDC2-Gal4, a Gal4 line under the control of the tyrosine decarboxylase gene, which encodes an enzyme required to make octopamine (Cole et al., 2005) – the mVUMs strongly and the TB neuron weakly. Thus, Fd59a+ neurons either express Hb9 or are octopaminergic neurons.
During larval life, the embryonic Fd59a expression pattern in the ventral nerve cord is maintained into the third instar stage with little or no change (Fig. 6F). Many post-embryonic Fd59a+ neurons do, however, arise in the optic lobe and central brain of the larval CNS. In the central brain, several NBs express Fd59a+: a cluster of Fd59a+ neurons surrounds each Fd59a+ NB, suggesting that most progeny of Fd59a+ NBs also express Fd59a+ (not shown). Within the optic lobe, central brain, and ventral nerve cord, most Fd59a+ neurons appear to persist through pupal stages into the adult CNS, with prominent Fd59a expression observed in the postmitotic neurons of the lamina and medulla of the adult optic lobe (Fig. 6G; not shown). Thus, once neurons activate Fd59a expression, they appear to maintain Fd59a expression into the adult.
Hb9 is necessary and sufficient to promote Fd59a expression
We have shown that Hb9 and Nkx6 act in a partially redundant manner to repress the expression of eve in the CNS (Broihier et al. 2004). To define more precisely the genetic relationship between Hb9 and Nkx6 with respect to their activation of Fd59a, we quantified the effect of removing the function of or overexpressing hb9 and nkx6 either singly or in combination on Fd59a expression. In embryos homozygous mutant for hb9kk30, all abdominal hemisegments assayed (n=100) showed a loss or reduction of Fd59a expression in the medial and lateral Hb9+ neurons (Fig. 7B), but no change to Fd59a expression was observed in the mVUM or TB neurons. In contrast, Fd59a expression appeared normal in embryos homozygous mutant for nkx6d25, a null allele of nkx6 (not shown). Removal of hb9 and nkx6 function resulted in the most severe phenotype: in greater than 95% of hemisegments, Fd59a expression was completely lost from Hb9+ neurons while Fd59a expression was unaltered in the mVum and TB neurons (n=120; Fig. 7C). Thus, hb9 plays a primary role, and nkx6 a latent one, to activate Fd59a expression in the CNS. Overexpression of Hb9 throughout the CNS drove the formation of 8.1+1.3 ectopic lateral Fd59a+ neurons (n=100 hemisegment; Fig. 7D); overexpression of Nkx6 alone had no effect on lateral Fd59a+ neurons, but did sporadically result in the presence of one extra medial Fd59a+ cell. Overexpression of Hb9 and Nkx6 drove the formation of 8.7 + 1.4 ectopic lateral Fd59a+ neurons (n= 200 hemisegments), essentially the same phenotype as observed upon overexpression of Hb9 alone. Moreover, overexpression of Hb9 in embryos homozygous mutant for nkx6d25 drove the formation of 8.2 + 1.5 ectopic lateral Fd59a+ neurons (n=120 hemisegments). Thus, Hb9 is by itself necessary and sufficient to activate Fd59a expression: It does not require nkx6 function for this activity, but nkx6 can, in the absence of hb9 function, maintain Fd59a expression in some endogenous lateral Fd59a+ neurons.
The ectopic Fd59a+ neurons observed upon Hb9 overexpression arose adjacent to the endogenous lateral Fd59a+ neurons of the NB 1-2 lineage. To test if these Fd59a+ neurons also derive from the NB 1-2 lineage, we used Engrailed-Gal4 (En), which drives reporter gene expression in this lineage (Fig. 7E–F) and eight other NB lineages (Cui and Doe, 1992). En-GAL4-mediated overexpression of Hb9 resulted in 8.9 + 1.7 ectopic lateral Fd59a+ neurons (n=100); the same phenotype as observed upon Hb9 misexpression throughout the CNS. Thus, we conclude that Hb9 is only competent to produce ectopic Fd59a+ neurons when misexpressed within En-positive neuroblast lineages and expect that over-expression of Hb9 within all neurons of the NB 1-2 lineage drives the formation of the ectopic lateral Fd59a+ neurons (Fig. 7G).
Identification of the transcriptional regulatory regions of fd59a
To identify Fd59a transcriptional regulatory regions and to follow the axonal projections of Fd59a+ neurons, we assessed the ability of Fd59a intergenic DNA to drive GFP reporter gene expression in Fd59a+ neurons. A 3.2 kb genomic region (Enhancer C) located immediately upstream of the fd59a transcriptional start site recapitulated the wild type CNS expression pattern of Fd59a, but the adjacent 4.1 kb genomic region failed to drive reporter gene expression in any embryonic Fd59a+ neurons (Fig. 8A–C). The transcriptional activity of Enhancer C depends on Hb9 function, as reporter gene expression was greatly reduced in embryos homozygous mutant for hb9kk30 (not shown). Thus, Hb9 acts through the Enhancer C regulatory region directly or indirectly to regulate Fd59a expression.
Bioinformatics analysis of the 3.2 kb region revealed five conserved blocks of ~800 bp each. We cloned each block upstream of GAL4 in the pBPGUw transformation vector (Fig. 8A; Pfeiffer et al., 2008) and assayed the ability of each region to drive gene transcription. Four of the regions drove gene expression in many neurons, but few of these neurons expressed Fd59a (not shown). One block of 719 bp, Enhancer 69 was, however, sufficient to recapitulate the Fd59a expression pattern in the embryonic and larval CNS (Fig. 8D–F), but also drove gene expression in Fd59a− neurons. This construct allowed us to trace the axonal projections of the lateral Fd59a+/Hb9+ neurons of the 1–2 lineage contralaterally across the posterior commisure (Fig. 8E); it also enabled us to determine that loss of fd59a function, using the fd59a allele detailed next, did not grossly alter the axonal trajectory of any Fd59a+ neuron (not shown).
fd59a regulates egg laying
No gene-specific alleles of fd59a existed prior to our study. Thus, we used a forward EMS-based genetic screen to generate mutant alleles of fd59a based on decreased Fd59a protein expression. From ~2000 lines screened, we identified two fd59a alleles. fd59a1 contains a point mutation in the splice donor site; fd59a2 contains a nonsense mutation after amino acid 99, truncating the 456 amino acid protein and removing over 75% of the forkhead domain (Fig. 9A). Embryos homozygous mutant for fd59a1 lack detectable Fd59a protein expression (not shown), but fd59a1 mutant third instar larva exhibit significantly reduced but detectable Fd59a protein expression (Fig. 9B, C). Embryos and third instar larvae homozygous mutant for fd59a2 lack detectable Fd59a protein expression (Fig. 9B, D; not shown). Thus, fd59a1 appears to be a hypomorphic mutation, and fd59a2 a null allele.
Figure 9.
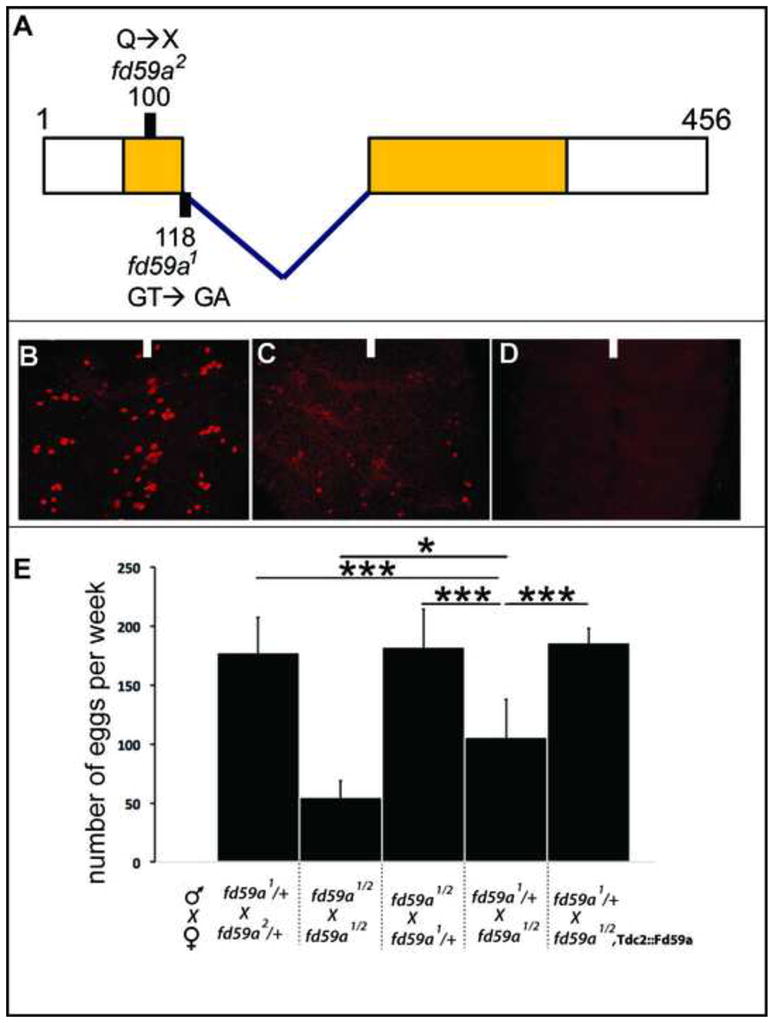
Loss of fd59a function causes defective egg laying.
A) Schematic model of fd59a transcript/coding region with the splice site indicated and the forkhead domain shaded yellow. The location of the two EMS-generated alleles of fd59a are indicated: fd59a1 disrupts a splice site, and fd59a2 introduces a premature stop codon at amino acid 100. (B–D) Fd59a protein expression in the larval CNS of wild type (B), fd59a1 (C) and fd59a2 (D) homozygous mutant animals. (E) Graph displays number of eggs laid per day by females of indicated genotype. Quantification of egg laying was carried out on days 1–7 for each cross, three male and three females were mated in each vial, n:5. “***” denotes P value less than 0.005; “*” denotes P value less than 0.05.
Flies homozygous for fd59a1 or fd59a2 or trans-heterozygous for the two alleles are viable, morphologically normal, yet sub-fertile. The decrease in fertility appears to arise largely due to a defect in females: crosses of wild-type females to fd59a mutant males produced normal numbers of eggs, but crosses of fd59a mutant females to wild-type males produced far fewer eggs (Fig. 9E). Crosses of fd59a mutant males and females produced even fewer eggs, suggesting that fd59a may play a subtle role in male mating or mating behavior that may impact egg laying when such males are crossed to fd59a, but not wild-type, females (Fig. 9E). Octopaminergic neurons regulate egg laying behavior via their secretion of octopamine (Cole et al., 2005), potentially linking fd59a function in these neurons to altered egg-laying behavior. Forced expression of a wild-type fd59a transgene in all octopaminergic neurons of otherwise fd59a mutant females, via use of the TDC2-Gal4 driver line, rescued the egg laying defect, demonstrating that fd59a acts in octopaminergic neurons to regulate egg laying behavior. In the larval CNS, the expression of octopamine, as detected by an antibody specific to octopamine, and the morphology and axonal pathway selction of TDC2+ neurons were essentially identical between wild-type females and fd59a mutant females (not shown). We were unable to follow octopamine expression reliably in the adult CNS, but at least within the CNS of Fd59a mutants the morphology and axonal pathway selection of TDC2+ neurons appeared grossly normal (not shown). Thus, our results suggest that fd59a regulates the function of octopaminergic neurons rather than their ability to synthesize octopamine.
DISCUSSION
A baton pass: the temporal gene cascade to Hb9, Lim3, and Tup?
In the Drosophila CNS, the developmental and molecular mechanisms that impart unique fates on individual neurons are well characterized (reviewed in Skeath and Thor, 2003). Initial patterning events bestow each neuroblast per hemisegment with a unique identity based on its position and time of formation. Within each neuroblast lineage, defined temporal transitions in gene expression direct each successively born secondary precursor cell (and the resulting pair of sibling neurons) to adopt a distinct identity based on birth order. Finally, Notch-Numb mediated asymmetric divisions direct sibling neurons to adopt distinct fates. Integrated together this trio of developmental processes is sufficient, in principle, to direct every neuron in a hemisegment, the developmental unit of the CNS, to adopt a different fate.
Despite this framework, the regulatory basis through which information from parental neuroblast identity, birth order, and asymmetric divisions directs the expression of genes such as hb9, lim3, and islet in discrete sets of post-mitotic neurons remains poorly defined. Our work on hb9, lim3, and tup sheds light on this process. We find that a common set of upstream factors may act through functionally similar regulatory regions in hb9, lim3, and tup to coordinately regulate their expression in the RP, and probably other, neurons. Of note, two conserved motifs in the RP regulatory regions resemble the bindings sites of Oct1 and RP58. The fly homologs of Oct1 are Pdm1 and Pdm2; RP58 is similar to a number of zinc-finger containing proteins in flies, including Kruppel. Kruppel and Pdm1/2 are members of the temporal gene cascade and are typically expressed in consecutive early (Kruppel) and intermediate (Pdm1/2) temporal windows in neuroblast lineages (reviewed in Brody and Odenwald, 2002). RP1, RP3-5, like most motor neurons, are generated in early temporal windows (Schmid et al. 1999), and embryos that lack the CNS function of Kruppel exhibit motor neuron defects (Romani et al., 1996). Thus, Kruppel and Pdm1/2 are good candidates to restrict the expression of hb9, lim3, and islet to defined sets of neurons with future studies required to cement this connection.
The co-regulation of batteries of genes by one or defined combinations of transcription factor(s) is common in development. Pioneering studies in C. elegans have identified a number of transcription factors that regulate the differentiation of one or a small number of neurons via the coordinate, direct regulation of many target genes. For example, the Ast1 transcription factor directs the differentiation of dopaminergic neurons via the direct activation of a battery of genes that encode proteins required for dopamine synthesis, secretion, and reuptake, all of which possess one or more Ast1 binding site in their promoters (Flame and Hobert, 2009). In Drosophila, Dorsal has also been shown to co-activate the expression of rhomboid, vnd, brinker, and vein in the lateral region of the embryo by acting through similar binding sites in each of their enhancer-promoter regions (Erives and Levine, 2004). Thus, we speculate that hb9, lim3, and tup represent a subset of the genes coordinately regulated in the RP neurons by a common set of upstream factors, with future work needed to identify others genes acting with hb9, lim3, and tup in these neurons as well as all of their upstream regulators.
Regulatory interactions between transcription factors – artifacts of overexpression studies or identifiers of in vivo biology?
Once expressed in their respective sets of neurons, our data indicate that Hb9 and Nkx6 direct neuronal development largely via their ability to regulate, typically repress, other transcription factors. Our functional studies of four genes – eve, vnd, fd59a, and hb9 – identify Hb9 as the key mediator of the regulation of transcription factor expression in the CNS, with Nkx6 playing a lesser, often latent, role in this regulation (Broihier et al. 2004; this paper).
Are the regulatory relationships uncovered between Hb9/Nkx6 and other transcription factors via gene misexpression studies relevant to wild-type CNS development? Our work on Hb9 and Fd59a suggests the ability of Hb9 to activate Fd59a expression when ubiquitously expressed throughout the CNS is confined to lineages in which both genes are normally expressed. Hb9 and Fd59a are co-expressed in a lateral and medial set of neurons; hb9 activates Fd59a expression in these neurons. Misexpression of Hb9 throughout the CNS leads to a dramatic increase in the lateral Fd59a+ neurons; misexpression of Hb9 in Engrailed-positive NB lineages yields the same phenotype. The endogenous lateral Fd59+ neurons derive from the Engrailed-positive NB 1-2 lineage. Thus, a simple interpretation of these data is that Hb9 is only competent to drive the formation of ectopic Fd59a+ neurons when driven in all cells of the NB 1-2 lineage, but not in any of the other 29 NB lineages. We have observed similar results with Dbx, Eve, and Hb9 in the CNS: when misexpressed throughout the CNS, the ability of these genes to repress the expression of other transcription factors, including each other, is largely restricted to those lineages (but not cells) in which they are normally expressed (Broihier et al., 2004; Lacin et al. 2009). These findings suggest that regulatory relationships unearthed by gene misexpression studies often highlight those relevant to normal CNS development.
Within the CNS, why are transcription factors often sufficient but not (or barely) necessary to regulate each others expression? Here, the expression, regulation, and function of Hb9, Nkx6, Lim3, and Tup hint of a robust system that drives (largely) normal development in the face of genetic insult. Hb9, Nkx6, Lim3, and Tup are co-expressed in overlapping sets of neurons (Fig. S2). Single-mutant studies reveal these genes are regulated largely independently of each other; double-mutant studies highlight functional redundancy between at least hb9 and nkx6 (Broihier et al. 2004; Lacin et al., 2009; this paper). If these genes partly substitute for each other’s function, as observed for hb9 and nkx6 in the regulation of Eve, Fd59a, and Vnd expression, loss of function in one gene would yield a subtle effect, but gene misexpression could lead to much more dramatic effects. Thus, if the co-expression of multiple (partly) redundant genes in defined sets of neurons is a theme in CNS development, it would account for the sufficiency but rare necessity of many transcription factors to regulate each other’s expression.
Fd59a, Nos, and the control of fly behavior
Fd59a is expressed in two distinct sets of neurons: Hb9+ neurons and octopaminergic neurons. We failed to identify a clear function for Fd59a in Hb9+ neurons, but did find that Fd59a acts in octopaminergic neurons to regulate egg laying behavior. The octopaminergic neurons of the thoracic-abdominal ganglion project to the female reproductive tissues (Rodriguez-Valentin et al., 2006; Middleton et al., 2006). Loss of fd59a function, however, does not result in gross defects to the presence or accumulation of octopamine in these neurons at least in the larval CNS. Thus, fd59a likely regulates egg laying via a function other than promoting octopamine synthesis. In the future, it will be important to dissect the molecular pathways through which fd59a controls the function of these octopaminergic neurons, and with them egg-laying behavior, with the non-essential nature of fd59a in flies likely to facilitate both endeavors.
Our work indicates that loss of Nos function in Drosophila leads to hyperactive flies. But, how at the cellular and molecular level does Nos mediates its tranquilizing effect on fly behavior? In the developing adult CNS, Nos is expressed in discrete clusters of cells in the nerve cord and more broadly in the central brain. The Drosophila central brain regulates many fly behaviors, including locomotor activity (Strauss and Heisenberg, 1993). Thus, we expect that Nos mediates its anxiolytic effect by acting in specific cells in the central brain. At the molecular level, studies in mammalian systems suggest a link between Nos and serotonin (5-HT) function. In mice, loss of Nos has been shown to induce aggressive behavior (Nelson et al., 1995); this aggressive phenotype can be reversed by the application of 5-HT precursors and agonists of 5-HT receptors (Demas et al., 1997), suggesting that Nos’s effect on behavior runs through serotonin. In support of this model, Nos has been shown to inhibit serotonin uptake by decreasing cell surface expression of the serotonin transporter, with loss of Nos function leading to increased uptake of 5-HT and presumably reduced levels of extracellular 5-HT (Chanrion et al, 2007). Clearly, future work is required to determine whether Nos regulates fly behavior by acting through serotonin. But, regardless of future results, our study supports an evolutionarily conserved anxiolytic role for Nos in regulating animal behavior and identifies a simple model system in which to dissect the tranquilizing effect of Nos on animal behavior at fine resolution. It also suggests that imbalances in Nos function may contribute to human disorders marked by heightened activity, such as hyper-activity and ADHD.
Supplementary Material
Highlights.
We complete the lineage of all Hb9+ neurons in the Drosophila nerve cord.
We identify the Fd59a/Fox-D and Nitric oxide synthase as targets of Hb9.
We report that loss of Nitric oxide synthase function leads to over-active flies.
We report that Fd59a regulates egg-laying behavior.
Acknowledgments
We thank Nikita Yakubovich and Patrick O’Farrell for stocks and helpful discussions. We thank Gary Stormo for help and advice in using PhyloCon and Austin Edwards for technical assistance in the fly behavior tests. We thank Kathy Matthews, Kevin Cook, the Bloomington Stock Center, and the Developmental Studies Hybridoma Bank for strains/reagents. This research was funded by grants from NSF (IOS-0744261) and NIH (NS036570) to JBS, a grant from NIH (GM050231) to JBJ, a grant from NSF (MCB-0818118) to JBJ and MF, and a grant from NIH to T. W. (HG007354).
Footnotes
Publisher's Disclaimer: This is a PDF file of an unedited manuscript that has been accepted for publication. As a service to our customers we are providing this early version of the manuscript. The manuscript will undergo copyediting, typesetting, and review of the resulting proof before it is published in its final citable form. Please note that during the production process errors may be discovered which could affect the content, and all legal disclaimers that apply to the journal pertain.
References
- Adryan B, Teichmann SA. FlyTF: a systematic review of site-specific transcription factors in the fruit fly Drosophila melanogaster. Bioinformatics. 2006;22:1532–1533. doi: 10.1093/bioinformatics/btl143. [DOI] [PubMed] [Google Scholar]
- Appel B, Korzh V, Glasgow E, Thor S, Edlund T, Dawid IB, Eisen JS. Motoneuron fate specification revealed by patterned LIM homeobox gene expression in embryonic zebrafish. Development. 1995;121:4117–4125. doi: 10.1242/dev.121.12.4117. [DOI] [PubMed] [Google Scholar]
- Arber S, Han B, Mendelsohn M, Smith M, Jessell TM, Sockanathan S. Requirement for the homeobox gene Hb9 in the consolidation of motor neuron identity [see comments] Neuron. 1999;23:659–674. doi: 10.1016/s0896-6273(01)80026-x. [DOI] [PubMed] [Google Scholar]
- Bader R, Colomb J, Pankratz B, Schrock A, Stocker RF, Pankratz MJ. Genetic dissection of neural circuit anatomy underlying feeding behavior in Drosophila: distinct classes of hugin-expressing neurons. The Journal of comparative neurology. 2007;502:848–856. doi: 10.1002/cne.21342. [DOI] [PubMed] [Google Scholar]
- Bossing T, Udolph G, Doe CQ, Technau GM. The embryonic central nervous system lineages of Drosophila melanogaster. I. Neuroblast lineages derived from the ventral half of the neuroectoderm. Dev Biol. 1996;179:41–64. doi: 10.1006/dbio.1996.0240. [DOI] [PubMed] [Google Scholar]
- Brand AH, Perrimon N. Targeted gene expression as a means of altering cell fates and generating dominant phenotypes. Development. 1993;118:401–415. doi: 10.1242/dev.118.2.401. [DOI] [PubMed] [Google Scholar]
- Branson K, Robie AA, Bender J, Perona P, Dickinson MH. High-throughput ethomics in large groups of Drosophila. Nat Methods. 2009;6:451–457. doi: 10.1038/nmeth.1328. [DOI] [PMC free article] [PubMed] [Google Scholar]
- Brody T, Odenwald WF. Cellular diversity in the developing nervous system: a temporal view from Drosophila. Development. 2002;129:3763–3770. doi: 10.1242/dev.129.16.3763. [DOI] [PubMed] [Google Scholar]
- Broihier HT, Kuzin A, Zhu Y, Odenwald W, Skeath JB. Drosophila homeodomain protein Nkx6 coordinates motoneuron subtype identity and axonogenesis. Development. 2004;131:5233–5242. doi: 10.1242/dev.01394. [DOI] [PubMed] [Google Scholar]
- Broihier HT, Skeath JB. Drosophila homeodomain protein dHb9 directs neuronal fate via crossrepressive and cell-nonautonomous mechanisms. Neuron. 2002;35:39–50. doi: 10.1016/s0896-6273(02)00743-2. [DOI] [PubMed] [Google Scholar]
- Caceres L, Necakov AS, Schwartz C, Kimber S, Roberts IJ, Krause HM. Nitric oxide coordinates metabolism, growth, and development via the nuclear receptor E75. Genes Dev. 2011;25:1476–1485. doi: 10.1101/gad.2064111. [DOI] [PMC free article] [PubMed] [Google Scholar]
- Certel SJ, Thor S. Specification of Drosophila motoneuron identity by the combinatorial action of POU and LIM-HD factors. Development. 2004;131:5429–5439. doi: 10.1242/dev.01418. [DOI] [PubMed] [Google Scholar]
- Chanrion B, Mannoury la Cour C, Bertaso F, Lerner-Natoli M, Freissmuth M, Millan MJ, Bockaert J, Marin P. Physical interaction between the serotonin transporter and neuronal nitric oxide synthase underlies reciprocal modulation of their activity. Proc Natl Acad Sci U S A. 2007;104:8119–8124. doi: 10.1073/pnas.0610964104. [DOI] [PMC free article] [PubMed] [Google Scholar]
- Cheesman SE, Layden MJ, Von Ohlen T, Doe CQ, Eisen JS. Zebrafish and fly Nkx6 proteins have similar CNS expression patterns and regulate motoneuron formation. Development. 2004;131:5221–5232. doi: 10.1242/dev.01397. [DOI] [PubMed] [Google Scholar]
- Cui X, Doe CQ. ming is expressed in neuroblast sublineages and regulates gene expression in the Drosophila central nervous system. Development. 1992;116:943–952. doi: 10.1242/dev.116.4.943. [DOI] [PubMed] [Google Scholar]
- Demas GE, Eliasson MJ, Dawson TM, Dawson VL, Kriegsfeld LJ, Nelson RJ, Snyder SH. Inhibition of neuronal nitric oxide synthase increases aggressive behavior in mice. Mol Med. 1997;3:610–616. [PMC free article] [PubMed] [Google Scholar]
- DiAntonio A, Haghighi AP, Portman SL, Lee JD, Amaranto AM, Goodman CS. Ubiquitination-dependent mechanisms regulate synaptic growth and function. Nature. 2001;412:449–452. doi: 10.1038/35086595. [DOI] [PubMed] [Google Scholar]
- Dijkers PF, O’Farrell PH. Dissection of a hypoxia-induced, nitric oxide-mediated signaling cascade. Mol Biol Cell. 2009;20:4083–4090. doi: 10.1091/mbc.E09-05-0362. [DOI] [PMC free article] [PubMed] [Google Scholar]
- Drewett JG, Adams-Hays RL, Ho BY, Hegge DJ. Nitric oxide potently inhibits the rate-limiting enzymatic step in steroidogenesis. Mol Cell Endocrinol. 2002;194:39–50. doi: 10.1016/s0303-7207(02)00214-9. [DOI] [PubMed] [Google Scholar]
- Erives A, Levine M. Coordinate enhancers share common organizational features in the Drosophila genome. Proc Natl Acad Sci U S A. 2004;101:3851–3856. doi: 10.1073/pnas.0400611101. [DOI] [PMC free article] [PubMed] [Google Scholar]
- Flames N, Hobert O. Gene regulatory logic of dopamine neuron differentiation. Nature. 2009;458:885–889. doi: 10.1038/nature07929. [DOI] [PMC free article] [PubMed] [Google Scholar]
- Harrison DA, Perrimon N. Simple and efficient generation of marked clones in Drosophila. Curr Biol. 1993;3:424–433. doi: 10.1016/0960-9822(93)90349-s. [DOI] [PubMed] [Google Scholar]
- Henry GL, Davis FP, Picard S, Eddy SR. Cell type-specific genomics of Drosophila neurons. Nucleic Acids Res. 2012;40:9691–9704. doi: 10.1093/nar/gks671. [DOI] [PMC free article] [PubMed] [Google Scholar]
- Hobert O. Regulatory logic of neuronal diversity: terminal selector genes and selector motifs. Proc Natl Acad Sci U S A. 2008;105:20067–20071. doi: 10.1073/pnas.0806070105. [DOI] [PMC free article] [PubMed] [Google Scholar]
- Jessell TM. Neuronal specification in the spinal cord: inductive signals and transcriptional codes. Nat Rev Genet. 2000;1:20–29. doi: 10.1038/35049541. [DOI] [PubMed] [Google Scholar]
- Jiang J, Hoey T, Levine M. Autoregulation of a segmentation gene in Drosophila: combinatorial interaction of the even-skipped homeo box protein with a distal enhancer element. Genes Dev. 1991;5:265–277. doi: 10.1101/gad.5.2.265. [DOI] [PubMed] [Google Scholar]
- Kabra M, Robie AA, Rivera-Alba M, Branson S, Branson K. JAABA: interactive machine learning for automatic annotation of animal behavior. Nat Methods. 2013;10:64–67. doi: 10.1038/nmeth.2281. [DOI] [PubMed] [Google Scholar]
- Kania A, Jessell TM. Topographic motor projections in the limb imposed by LIM homeodomain protein regulation of ephrin-A:EphA interactions. Neuron. 2003;38:581–596. doi: 10.1016/s0896-6273(03)00292-7. [DOI] [PubMed] [Google Scholar]
- Kania A, Johnson RL, Jessell TM. Coordinate roles for LIM homeobox genes in directing the dorsoventral trajectory of motor axons in the vertebrate limb. Cell. 2000;102:161–173. doi: 10.1016/s0092-8674(00)00022-2. [DOI] [PubMed] [Google Scholar]
- Lacin H, Zhu Y, Wilson BA, Skeath JB. dbx mediates neuronal specification and differentiation through cross-repressive, lineage-specific interactions with eve and hb9. Development. 2009;136:3257–3266. doi: 10.1242/dev.037242. [DOI] [PMC free article] [PubMed] [Google Scholar]
- Landgraf M, Roy S, Prokop A, VijayRaghavan K, Bate M. even-skipped determines the dorsal growth of motor axons in Drosophila. Neuron. 1999;22:43–52. doi: 10.1016/s0896-6273(00)80677-7. [DOI] [PubMed] [Google Scholar]
- Landmesser L. The development of motor projection patterns in the chick hind limb. J Physiol. 1978a;284:391–414. doi: 10.1113/jphysiol.1978.sp012546. [DOI] [PMC free article] [PubMed] [Google Scholar]
- Landmesser L. The distribution of motoneurones supplying chick hind limb muscles. J Physiol. 1978b;284:371–389. doi: 10.1113/jphysiol.1978.sp012545. [DOI] [PMC free article] [PubMed] [Google Scholar]
- Lee HH, Frasch M. Survey of forkhead domain encoding genes in the Drosophila genome: Classification and embryonic expression patterns. Dev Dyn. 2004;229:357–366. doi: 10.1002/dvdy.10443. [DOI] [PubMed] [Google Scholar]
- Li C, Wong WH. Model-based analysis of oligonucleotide arrays: expression index computation and outlier detection. Proc Natl Acad Sci U S A. 2001;98:31–36. doi: 10.1073/pnas.011404098. [DOI] [PMC free article] [PubMed] [Google Scholar]
- Lu B, LaMora A, Sun Y, Welsh MJ, Ben-Shahar Y. ppk23-Dependent chemosensory functions contribute to courtship behavior in Drosophila melanogaster. PLoS genetics. 2012;8:e1002587. doi: 10.1371/journal.pgen.1002587. [DOI] [PMC free article] [PubMed] [Google Scholar]
- Mardon G, Solomon NM, Rubin GM. dachshund encodes a nuclear protein required for normal eye and leg development in Drosophila. Development. 1994;120:3473–3486. doi: 10.1242/dev.120.12.3473. [DOI] [PubMed] [Google Scholar]
- Marygold SJ, Leyland PC, Seal RL, Goodman JL, Thurmond J, Strelets VB, Wilson RJ. FlyBase: improvements to the bibliography. Nucleic Acids Res. 2013;41:D751–757. doi: 10.1093/nar/gks1024. [DOI] [PMC free article] [PubMed] [Google Scholar]
- Matys V, Fricke E, Geffers R, Gossling E, Haubrock M, Hehl R, Hornischer K, Karas D, Kel AE, Kel-Margoulis OV, Kloos DU, Land S, Lewicki-Potapov B, Michael H, Munch R, Reuter I, Rotert S, Saxel H, Scheer M, Thiele S, Wingender E. TRANSFAC: transcriptional regulation, from patterns to profiles. Nucleic Acids Res. 2003;31:374–378. doi: 10.1093/nar/gkg108. [DOI] [PMC free article] [PubMed] [Google Scholar]
- Middleton CA, Nongthomba U, Parry K, Sweeney ST, Sparrow JC, Elliott CJ. Neuromuscular organization and aminergic modulation of contractions in the Drosophila ovary. BMC Biol. 2006;4:17. doi: 10.1186/1741-7007-4-17. [DOI] [PMC free article] [PubMed] [Google Scholar]
- Minamiyama Y, Takemura S, Imaoka S, Funae Y, Tanimoto Y, Inoue M. Irreversible inhibition of cytochrome P450 by nitric oxide. J Pharmacol Exp Ther. 1997;283:1479–1485. [PubMed] [Google Scholar]
- Nelson RJ, Demas GE, Huang PL, Fishman MC, Dawson VL, Dawson TM, Snyder SH. Behavioural abnormalities in male mice lacking neuronal nitric oxide synthase. Nature. 1995;378:383–386. doi: 10.1038/378383a0. [DOI] [PubMed] [Google Scholar]
- Odden JP, Holbrook S, Doe CQ. Drosophila HB9 is expressed in a subset of motoneurons and interneurons, where it regulates gene expression and axon pathfinding. J Neurosci. 2002;22:9143–9149. doi: 10.1523/JNEUROSCI.22-21-09143.2002. [DOI] [PMC free article] [PubMed] [Google Scholar]
- Patel NH. Imaging neuronal subsets and other cell types in whole-mount Drosophila embryos and larvae using antibody probes. Methods in cell biology. 1994;44:445–487. doi: 10.1016/s0091-679x(08)60927-9. [DOI] [PubMed] [Google Scholar]
- Regulski M, Stasiv Y, Tully T, Enikolopov G. Essential function of nitric oxide synthase in Drosophila. Curr Biol. 2004;14:R881–882. doi: 10.1016/j.cub.2004.09.068. [DOI] [PubMed] [Google Scholar]
- Rewitz KF, Rybczynski R, Warren JT, Gilbert LI. The Halloween genes code for cytochrome P450 enzymes mediating synthesis of the insect moulting hormone. Biochem Soc Trans. 2006;34:1256–1260. doi: 10.1042/BST0341256. [DOI] [PubMed] [Google Scholar]
- Rodriguez-Valentin R, Lopez-Gonzalez I, Jorquera R, Labarca P, Zurita M, Reynaud E. Oviduct contraction in Drosophila is modulated by a neural network that is both, octopaminergic and glutamatergic. J Cell Physiol. 2006;209:183–198. doi: 10.1002/jcp.20722. [DOI] [PubMed] [Google Scholar]
- Romani S, Jimenez F, Hoch M, Patel NH, Taubert H, Jackle H. Kruppel, a Drosophila segmentation gene, participates in the specification of neurons and glial cells. Mech Dev. 1996;60:95–107. doi: 10.1016/s0925-4773(96)00603-x. [DOI] [PubMed] [Google Scholar]
- Sander M, Paydar S, Ericson J, Briscoe J, Berber E, German M, Jessell TM, Rubenstein JL. Ventral neural patterning by Nkx homeobox genes: Nkx6.1 controls somatic motor neuron and ventral interneuron fates. Genes Dev. 2000;14:2134–2139. doi: 10.1101/gad.820400. [DOI] [PMC free article] [PubMed] [Google Scholar]
- Schmid A, Chiba A, Doe CQ. Clonal analysis of Drosophila embryonic neuroblasts: neural cell types, axon projections and muscle targets. Development. 1999;126:4653–4689. doi: 10.1242/dev.126.21.4653. [DOI] [PubMed] [Google Scholar]
- Schmidt H, Rickert C, Bossing T, Vef O, Urban J, Technau GM. The embryonic central nervous system lineages of Drosophila melanogaster. II. Neuroblast lineages derived from the dorsal part of the neuroectoderm. Dev Biol. 1997;189:186–204. doi: 10.1006/dbio.1997.8660. [DOI] [PubMed] [Google Scholar]
- Shen P. Analysis of feeding behavior of Drosophila larvae on solid food. Cold Spring Harbor protocols. 2012 doi: 10.1101/pdb.prot069328. 2012. [DOI] [PubMed] [Google Scholar]
- Skeath JB, Thor S. Genetic control of Drosophila nerve cord development. Curr Opin Neurobiol. 2003;13:8–15. doi: 10.1016/s0959-4388(03)00007-2. [DOI] [PubMed] [Google Scholar]
- Strauss R, Heisenberg M. A higher control center of locomotor behavior in the Drosophila brain. J Neurosci. 1993;13:1852–1861. doi: 10.1523/JNEUROSCI.13-05-01852.1993. [DOI] [PMC free article] [PubMed] [Google Scholar]
- Thor S, Andersson SG, Tomlinson A, Thomas JB. A LIM-homeodomain combinatorial code for motor-neuron pathway selection. Nature. 1999;397:76–80. doi: 10.1038/16275. [DOI] [PubMed] [Google Scholar]
- Tsuchida T, Ensini M, Morton SB, Baldassare M, Edlund T, Jessell TM, Pfaff SL. Topographic organization of embryonic motor neurons defined by expression of LIM homeobox genes [see comments] Cell. 1994;79:957–970. doi: 10.1016/0092-8674(94)90027-2. [DOI] [PubMed] [Google Scholar]
- van Steensel B, Delrow J, Henikoff S. Chromatin profiling using targeted DNA adenine methyltransferase. Nat Genet. 2001;27:304–308. doi: 10.1038/85871. [DOI] [PubMed] [Google Scholar]
- Wang T, Stormo GD. Identifying the conserved network of cis-regulatory sites of a eukaryotic genome. Proc Natl Acad Sci U S A. 2005;102:17400–17405. doi: 10.1073/pnas.0505147102. [DOI] [PMC free article] [PubMed] [Google Scholar]
- Wheeler SR, Kearney JB, Guardiola AR, Crews ST. Single-cell mapping of neural and glial gene expression in the developing Drosophila CNS midline cells. Dev Biol. 2006;294:509–524. doi: 10.1016/j.ydbio.2006.03.016. [DOI] [PMC free article] [PubMed] [Google Scholar]
- Wicher D, Derst C, Gautier H, Lapied B, Heinemann SH, Agricola HJ. The satiety signaling neuropeptide perisulfakinin inhibits the activity of central neurons promoting general activity. Frontiers in cellular neuroscience. 2007;1:3. doi: 10.3389/neuro.03.003.2007. [DOI] [PMC free article] [PubMed] [Google Scholar]
- Yakubovich N, Silva EA, O’Farrell PH. Nitric oxide synthase is not essential for Drosophila development. Curr Biol. 2010;20:R141–142. doi: 10.1016/j.cub.2009.12.011. [DOI] [PMC free article] [PubMed] [Google Scholar]
- Zhang Y, Ma C, Delohery T, Nasipak B, Foat BC, Bounoutas A, Bussemaker HJ, Kim SK, Chalfie M. Identification of genes expressed in C. elegans touch receptor neurons. Nature. 2002;418:331–335. doi: 10.1038/nature00891. [DOI] [PubMed] [Google Scholar]
Associated Data
This section collects any data citations, data availability statements, or supplementary materials included in this article.