

Abstract
Background:
In critically ill patients, several scoring systems have been developed over the last three decades. The Acute Physiology and Chronic Health Evaluation (APACHE) and the Simplified Acute Physiology Score (SAPS) are the most widely used scoring systems in the intensive care unit (ICU). The aim of this study was to assess the prognostic accuracy of SAPS II and APACHE II and APACHE III scoring systems in predicting short-term hospital mortality of surgical ICU patients.
Materials and Methods:
Prospectively collected data from 202 patients admitted to Mashhad University Hospital postoperative ICU were analyzed. Calibration was estimated using the Hosmer-Lemeshow goodness-of-fit test. Discrimination was evaluated by using the receiver operating characteristic (ROC) curves and area under a ROC curve (AUC).
Result:
Two hundred and two patients admitted on post-surgical ICU were evaluated. The mean SAPS II, APACHE II, and APACHE III scores for survivors were found to be significantly lower than of non-survivors. The calibration was best for APACHE II score. Discrimination was excellent for APACHE II (AUC: 0.828) score and acceptable for APACHE III (AUC: 0.782) and SAPS II (AUC: 0.778) scores.
Conclusion:
APACHE II provided better discrimination than APACHE III and SAPS II calibration was good at APACHE II and poor at APACHE III and SAPS II. Use of APACHE II was excellent in this post-surgical ICU.
Keywords: APACHE II, APACHE III, ICU mortality, SAPS
INTRODUCTION
The prognostic and general severity scoring systems that are used in the intensive care unit (ICU) are beneficial in predicting risk of mortality. Mortality prediction is important for patient or family information and consent, comparison of ICU results, monitoring quality of ICU care and can be used to stratify patients for clinical research.
Several criteria should be taken into consideration when judging the value of any scoring system in clinical practice. Validity and reliability are important issues that allow confident use of a scoring system in ICU patients with different disease and baseline characteristics.
In critically ill patients, several scoring systems have been developed over the last three decades. Acute Physiology and Chronic Health Evaluation (APACHE) II and III scores were developed by Knause et al.1, in 1985 and 1991, respectively, and Simplified Acute Physiology Score (SAPS) II was developed by Le Gall et al.2, in 1993. These are the most widely used scoring system in the ICUs. Nevertheless, there are still conflicting data concerning which of them is the best predictor tool.
The aim of this study was, therefore, to compare and evaluate the performance of APACHE II, APACHE III and SAPS II as scores in predicting the mortality and morbidity of surgical ICU patients.
MATERIALS AND METHODS
This prospective study included 202 consecutive patients admitted to the surgical ICU of university hospital of Imam Reza-Mashhad-Iran, during the 6 months, from April 2010 through September 2010.
For the purpose of the study, each admission (elective or urgent) was considered as one patient. Patients with ICU Length of Study (LOS) less than 24 hours were excluded from the analysis as SAPS II and APACHE II and III cannot be calculated in these patients.
To calculate the APACHE II score, twelve common physiological and laboratory values are marked and calculated with APACHE II software. The sum of these values is added to a mark adjusting for chronic health problems (severe organ insufficiency or immune-compromised patients) and a mark adjusting for patient age to achieve the APPACHE II score.
APACHE III scores are derived from marks for the extent of abnormality of 17 physiological measurements, adjusts for seven comorbidities that reduce immune function and influence hospital survival, and adjusts for age, and range from 0 to 299.
Clinical and laboratory data necessary for the SAPS II and APACHE II and III systems were recorded on the first day of admission for all patients. Physiological data were recorded 3-hourly during the first day. The calculation of APACHE II and III and SAPS II scores was based on the worst values taken during the first 24 hours after admission.
Statistical analysis
Analysis of Data and Results was done with SPSS V.18 software. Individual relationship of each score (SAPS II, APACHE III and II) and length of admission to the risk of death and comparison of score was assessed by t-test and ANOVA, P-value less than 0.05 was significant statistically. Discrimination was tested using the receiver operating characteristic (ROC) curves and by comparing areas under the curve (AUC). AUCs more than 0.8 were excellent and 0.6-0.8 were acceptable.
The calibration of the systems (prognostic accuracy at different levels of risk) was studied using Youden index and Hosmer-Lemeshow goodness of fit statistics which divides subjects into deciles based on predicted probabilities of death and then computes a Chi-square from observed and expected frequencies. Lower Chi-square values and higher P values (P > 0.5) are associated with a better fit. For the different scoring systems tested, the sensitivity, specificity, positive and negative predictive values were calculated, and the cutoff point giving the best Youden index was determined. This cutoff point was also used to calculate the predicted and observed outcome for patients.
RESULTS
During the study period, 202 patients were admitted to the ICU which 118 (58.8%) were men and 84 (41.8%) were women. The mean age was 53.1 ± 20.3 years (range 14-85 years). Elective surgery was performed before admission to the ICU in 195 patients and emergency surgery in seven patients.
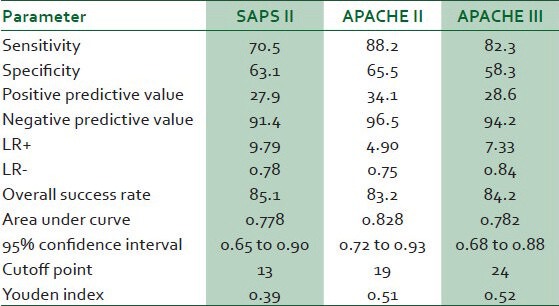
Table 1 reports predictive values of the various scoring systems calculated at the cutoff point giving the best Youden index, sensitivity, specificity, positive and negative predictive value and overall success rate.
Table 1.
Comparison of the predictive values of the scoring systems
The mean ±SD SAPS II, APACHE II and APACHEIII score, calculated within 24 h of admission to the ICU, were 13.42 ± 6.65, 18.56 ± 7.32 and 23.66 ± 11.50, respectively [Table 2]. Table 3 shows relationship of mortality with scores and there were significant differences in SAPS II score, APACHE II score and APACHE III score between survivors and non-survivors (P < 0.001 at all).
Table 2.
Mean, standard deviation and range of three scoring
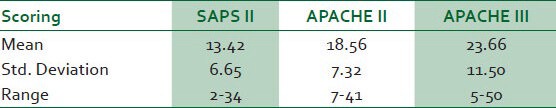
Table 3.
Comparison of three scoring systems with survivor and non-survivor Mean (st deviation)

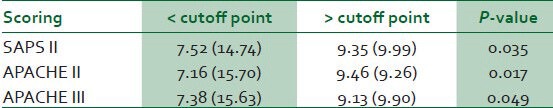
Table 4 shows that admission duration correlated with SAPS II, APACHE II and III scores and length of admission in ICU increased significantly with higher SAPS II, APACHE II and APACHE III scores (P = 0.035, 0.017 and 0.049, respectively).
Table 4.
Comparison of three scoring systems with length of admission (days). Mean (st deviation)
Calibration measured with Hosmer-Lemeshow goodness-of-fit tests are shown in Table 5. The Hosmer-Lemeshow statistic was best for APACHE II score (P = 0.71). However, for the APACHE III and SAPS II scores, calibration was poor (P value = 0.392 and 0.379, respectively).
Table 5.
Hosmer-lemeshow goodness of fit tests for three scoring systems

Discrimination power evaluated with ROC curve and area under curve (AUC). ROC curves are shown in Figure 1. AUC of APACHE II was 0.828 and excellent, while that of APACHE III (0.782) and SAPS II (0.778) was acceptable.
Figure 1.
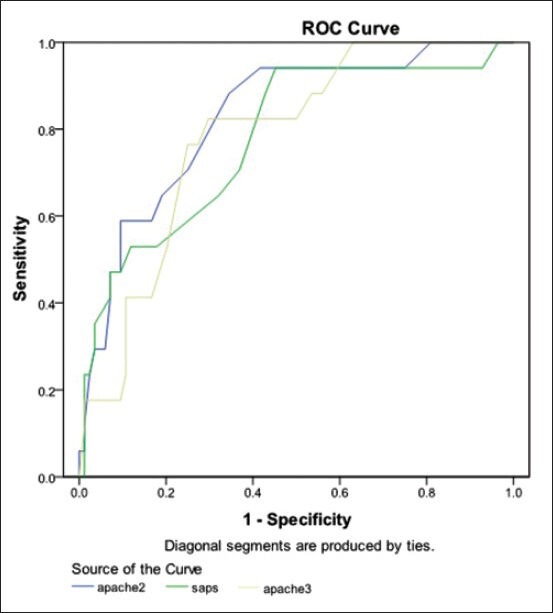
ROC curves for SAPS II, APACHE II and APACHE III scoring systems
DISCUSSION
The performance of the prognostic models is evaluated by tow objective measures: Calibration and discrimination. Calibration refers to how closely the estimated probabilities of mortality correlate with the observed mortality over the entire range of probabilities and can be tested using Hosmer-Lemeshow goodness-of-fit statistic. Discrimination refers to the ability of a prognostic score to classify patients correctly as survivors or non-survivors and is measured by AUC. From the individual patient's point of view, it would be interesting to have perfect discrimination; however, for clinical trials or comparison of care between ICUs better calibration is needed.
In our study, the discriminative ability of APPACHE II is excellent. Moreover, it has greater discriminative power than APACHE III or SAPS II in our critically ill patient. APACHE II also has a better, more appropriate calibration than APACHE III or SAPS II, so only APACHE II properly predicts mortality risk in our ICU.
Although ICU admission policies generally are unknown, they probably also influence outcome. The APACHE model differs in risk assessment of medical or surgical patients. Nevertheless, APACHE II prediction has been more consistent across a wide range of mortality risks than APACHE III or SAPS II.2,3
Our results are in agreement with other reports on the performance of the APACHE scoring system in UK.4,5,6 The same pattern was observed in the external validation of the SAPS II, APACHE II and APACHE III models in Scottish intensive care patients.7 One study reported good calibration for the APACHE II model, but again imperfect calibration for the two other score tested.8,9
In one study, Beck and colleagues validated the SAPS II and APACHE II and III prognostic models in 16,646 adult intensive care patients in Southern UK. The external validation showed a similar pattern for all three models tested: Good discrimination, but imperfect calibration.10 Differences in the performance of scoring systems reinforce the need to validate them using data of independent samples from different ICUs in different countries, due to variation in case mix, structure and organization of acute medical care, lifestyles and genetic makeup between populations.11 Adequate discrimination by APACHE II previously has been described with an AUROC of 0.91 in Thailand, 0.88 in Hong Kong, 0.83 in Greece and Saudi Arabia and 0.79 in Portugal.12 Its calibration, however, always has been poor, as evidenced by recent studies, primarily due to differences in case mix, data collection and lead-time bias.2,12
The present study has some limitations. First, as a single-centre study, there may be bias with regard to case mix, quality of ICU care and ICU policy. Second, our relatively small sample size is a limiting factor in stratified analysis of calibration. Third, APACHE II is based on retrospective data that is available within 24 h of ICU admission; consequently, the sampling rate that is used can influence mortality estimation. A multi-centre study would mitigate the concerns over case mix and benefit from a larger sample size.
CONCLUSIONS
We found a better calibration of APACHE II than APACHE III or SAPS II such that APACHE II improves the ability to predict hospital mortality in comparison with APACHE III or SAPS II. The discrimination of APACHE II is excellent, but of APACHE III and SAPS II is acceptable.
Footnotes
Source of Support: Nil
Conflict of Interest: None declared.
REFERENCES
- 1.Knaus WA, Draper EA, Wagner DP, Zimmerman JE. APPACHE II: A severity of disease classification system. Crit Care Med. 1985;13:818–29. [PubMed] [Google Scholar]
- 2.Le Gall JR, Lemeshow S, Saulnier F. A new Simplified Acute Phusiology Score (SAPS II) based on a European/North American Multicenter study. JAMA. 1993;270:2957–63. doi: 10.1001/jama.270.24.2957. [DOI] [PubMed] [Google Scholar]
- 3.Markgraf R, Deutschinoff G, Pientka L, Scholten T. Comparison of Acute Physiology and Chronic Health Evaluations II and III and Simplified acute physiology Score II: A prospective cohort study evaluating these method to predict outcome in a German interdisciplinary intensive care unit. Crit Care Med. 2000;28:26–33. doi: 10.1097/00003246-200001000-00005. [DOI] [PubMed] [Google Scholar]
- 4.Rowan KM, Kerr JH, Major E, McPhersonk, Short A, Vessey MP. Intensive Care Society's APACHE II study in Britain and Ireland II: Outcome comparison of intensive care units after adjustment for case mix by the American APACHE II method. BMJ. 1993;307:977–810. doi: 10.1136/bmj.307.6910.977. [DOI] [PMC free article] [PubMed] [Google Scholar]
- 5.Pappachan JV, Millar B, Bennett ED, Smith GB. Comparison of outcome from intensive care admission after adjustment for case mix by the APACHE III prognostic system. Chest. 1999;115:802–10. doi: 10.1378/chest.115.3.802. [DOI] [PubMed] [Google Scholar]
- 6.Apolone G, Bertolini G, D’Amico R, Iapichino G, Cattaneo A, De Salvo G, et al. The performance of SAPS II in a cohort of patients admitted to 99 Italian ICUs. Intensive Care Med. 1996;22:1368–78. doi: 10.1007/BF01709553. [DOI] [PubMed] [Google Scholar]
- 7.Livingston BM, MaKirdy FN, Howic JC, Jones R, Norrie JD. Assessment of the performance of five intensive care scoring models within a larger Scottish database. Crit Care Med. 2000;28:1820–70. doi: 10.1097/00003246-200006000-00023. [DOI] [PubMed] [Google Scholar]
- 8.Markgraf R, Deutschinoff G, Pientka L, Scholten T. camparison of APACHE III and SAPS II in a German interdisciplinary ICU. Crit Care Med. 2001;28:33–5. doi: 10.1097/00003246-200001000-00005. [DOI] [PubMed] [Google Scholar]
- 9.Bosman RJ, Oudemane Van Straaten HM, Zandstra DF. The use of intensive care information systems alters outcome prediction. Intensive Care Med. 1998;24:953–8. doi: 10.1007/s001340050695. [DOI] [PubMed] [Google Scholar]
- 10.Beck DH, Smith GB, Pappachan JV, Millar B. External validation of the SAPS II, APACHE II and APACHE III prognostic models in South England: A multicenter study. Intensive Care Med. 2003;29:249–56. doi: 10.1007/s00134-002-1607-9. [DOI] [PubMed] [Google Scholar]
- 11.Moreno RP, Metnitz PG, Almeida E, Jordan B, Bauer P, Campos RA, et al. SAP 3 Investigators. SAPS 3- from evaluation of the patient to evaluation of the intensive care unit. Part 2: Development of a prognostic model for hospital mortality at ICU admission. Intensive Care Med. 2005;31:1345–55. doi: 10.1007/s00134-005-2763-5. [DOI] [PMC free article] [PubMed] [Google Scholar]
- 12.Khwannimit B, Geater A. A comparison of APACHE II and SAPS II Scoring systems in predicting hospital mortality in Thai and intensive care units. J Med Assoc Thai. 2007;90:643–52. [PubMed] [Google Scholar]