Abstract
Aspirin, along with its analgesic-antipyretic uses, is now also being considered for prevention of cardiovascular disease, cancer, and treatment of human immunodeficiency virus infection. Although many of aspirin's pharmacological actions are related to its ability to inhibit prostaglandin biosynthesis, some of its beneficial therapeutic effects are not completely understood. Transcription factor activator protein 1 (AP-1) is critical for the induction of neoplastic transformation and induction of multiple genes involved in inflammation and infection. We have used the JB6 mouse epidermal cell lines, a system that has been used extensively as an in vitro model for the study of tumor promotion and anti-tumor promotion, to study the anti-carcinogenesis effect of aspirin at the molecular level. Aspirin and aspirin-like salicylates inhibited the activation of AP-1 in the same dose range as seen for the inhibition of tumor promoter-induced transformation. The inhibition of AP-1 and tumor promoter-induced transformation in JB6 cells occurs through a prostaglandin independent- and an Erk1- or Erk2-independent pathway. The mechanism of AP-1 and transformation inhibition in this cell culture model may involve the elevation of H+ concentration. The inhibition effects on the activation of AP-1 activity by aspirin and aspirin-like salicylates may further explain the anti-carcinogenesis mechanism of action of these drugs.
Acetylsalicylic acid (aspirin) was introduced as a potent anti-inflammatory and analgesic drug in 1892. Since then, aspirin and other nonsteroidal anti-inflammatory drugs (NSAIDs)1 or salicylates have been shown to exhibit additional effects. For example, administration of low dose aspirin to physicians and patients suffering from angina pectoris significantly reduced the rate of heart attack and stroke (by up to 50%) (1). Long term use of aspirin in men and women has also been reported to protect against the development of colon cancer (40% decrease in risk) and other digestive system cancers, including cancers of the esophagus and stomach (2–5). In animal studies, NSAIDs were found to inhibit chemically induced tumors of colon, tongue, esophagus, pancreas, bladder, breast, liver, skin, and various sarcomas (6–14). The experimental evidence of NSAIDs is strongest for inhibiting colon carcinogenesis in rodents, a model that closely resembles human colon cancer. Since plants, particularly fruits and vegetables such as apples, apricots, cherries, grapes, peaches, plums, cucumbers, peppers, and tomatoes contain natural salicylates, it has been suggested that these naturally occurring salicylates contribute to the reduced risk of human stomach and colorectal cancer associated with fruit and vegetable consumption (15).
The effectiveness of NSAIDs to treat inflammation and to prevent cancer has been attributed to their ability to inhibit prostaglandin production by inhibiting the cyclooxygenase enzyme prostaglandin H (PGH) synthase (16, 17). However, other mechanisms cannot be excluded (18). For example, aspirin doses used to treat chronic inflammatory diseases or prevent cancer are higher than those required to inhibit prostaglandin synthesis (19–21). Furthermore, because aspirin inhibits PGH synthase by irreversibly acetylating it, salicylic acid and sulindac sulfone are ineffective as PGH synthase inhibitors. Nevertheless, they are able to reduce inflammation or cancer rate at doses comparable with aspirin (19, 20, 22). More recently, both PGH synthase cyclooxygenase 1 (COX-1)- and cyclooxygenase 2 (COX-2)-deficient mice have been developed (23, 24). Both animals showed the same swelling response in the ear to the tumor promoter TPA as did wild-type mice (23, 24) and they also exhibited a normal inflammatory response to bacterial invasion of the peritoneum (23–25).
The JB6 mouse epidermal cell system of clonal genetic variants that are promotion-sensitive (P+) or promotion-resistant (P–) allows the study of genetic susceptibility to transformation promotion and progression at the molecular level. These P–, P+, and transformed (Tx) variants are a series of cell lines representing earlier-to-later stage of preneoplastic-to-neoplastic progression. P– variants gain P+ phenotype upon transfection with mutated p53 (26, 27). The P+ cells gain Tx phenotype irreversibly upon TPA, epidermal growth factor, or other tumor promoter treatment or with c-jun overexpression (28–30). Transformed variants grow under anchorage-independent conditions and are tumorigenic in nude or BALB/c mice in the absence of tumor promoting conditions. One of the few molecular events known to distinguish P– and P+ cellular responses to tumor promoters is the activation of AP-1 driven transcriptional activity in P+ cells but not in P– cells (31, 32). There are no mutations of ras, p53, or WAF-1 in P–, P+, or Tx cells (26, 27). Furthermore, we have demonstrated that induced AP-1 activity appears to be required in the tumor promoter-induced transformation in P+ cells (30). That is, P+ cells revert to P– phenotype when AP-1 induction is blocked (30). AP-1 is an inducible eukaryotic transcription factor containing products of the jun and fos oncogene families (33, 34). AP-1 is activated in response to a number of stimulants including the tumor promotors phorbol esters (TPA), epidermal growth factor, tumor necrosis factor-α, and interleukin-1 (33). Some of the genes known to be regulated by AP-1 are involved in the immune and inflammatory responses, tumor promotion, and tumor progression. These include cytokines such as interleukin-1, tumor necrosis factor-α, granulocyte-macrophage colony-stimulating factor, collagenase IV, and stromelysin (35–39). Salicylic acid also plays a role in transcription of the pathogenesis-related genes in plants and heat shock transcription factor in mammalian cells (40–43). More recently, it has been reported that aspirin and sodium salicylate inhibit transcription factor NF-κB activity that may be relevant in treatment of patients with human immunodeficiency virus (20). Here, we have investigated the possible involvement of AP-1 transcriptional activity in the anti-tumor promotion of aspirin in JB6 cells, a well developed cell culture model for studying tumor promotion and anti-tumor promotion.
EXPERIMENTAL PROCEDURES
Materials
Eagle's minimum essential medium and fetal bovine serum were from Whittaker Biosciences; l-glutamine was from Life Technologies, Inc.; gentamicin was from Quality Biological, Inc; aspirin, salicylic acid (SA), and diethylstilbestrol (DES) were from Sigma; dimethyl sulfoxide (Me2SO) was from Pierce. T-150 flasks were from Corning (Corning, NY); formamide was from Fluka; luciferase assay substrate was from Promega.
Cell Culture
Mouse epidermal JB6 P+ Cl41 and its AP-1 luciferase reporter stable transfectant 41–19 cells were grown at 36 °C in Eagle's minimal essential medium supplemented with 5% heat-inactivated fetal bovine serum, 2 mm l-glutamine, and 25 mg/ml gentamicin (30–32, 44).
Immunoblot Assay
Immunoblot assays were carried out as described in the PhosphoPlus MAPK antibody Kit or the PhosphoPlus c-Jun Kit (New England Biolabs) using antibodies against Erk1 and Erk2 (p44 and p42), phosphorylated tyrosine 204 of p44 and p42 MAPKs (45, 46), and phosphorylated c-Jun protein at Ser-63/-73 (47).
Soft Agar Assay
JB6 P+ cells or H-ras12 or c-jun-transformed JB6 cells were exposed to 0.01% Me2SO, TPA, inhibitors, or TPA with inhibitors in 1.5 ml of 0.33% agar medium over 7 ml of 0.5% agar medium as described previously (29, 30). Colonies were scored at 14 days. The size of colonies counted by the computerized image analyzer was more than 8 cells.
Transfection and Luciferase Assay of AP-1 Activity
Col-Luc plasmid DNA was used as the AP-1 reporter plasmid. Col-Luc is the 73/63 collagenase promoter driving luciferase containing an AP-1 binding site at –73/63 (48). AP-1 activity was assayed in both transient transfected Cl41 cells or in a stable Col-Luc transfectant in JB6 P+ cells, 41-19 (32). For Col-Luc stable transfectants, after seeding overnight, the cells were exposed to TPA with or without aspirin for 24 h, and cells were harvested by lysis buffer. The results are expressed as the relative rate of acetylated product production. Relative AP-1-dependent activity was calculated as described previously (30). Luciferase activity was measured by a luminometer (Monolight 2010, Analytical Luminescence Laboratory) 10 s after mixing the extract and luciferase assay reagent.
Prostaglandin E Enzyme Immunoassay
5 × 10⁴ P+ cells were seeded in each well of 6-well plates and cultured overnight. Then the cells were washed with serum-free medium and changed to 2 ml of serum-free medium plus 1 mg/ml delipidized bovine serum albumin with or without indomethacin or TPA. After 3 days of culture, the medium was aspirated from each well for prostaglandin E enzyme immunoassays with a prostaglandin E EIA Assay Kit (PerSeptive Diagnostics, Cambridge, MA). The assay was performed according to the manufacturer's instructions. The plates were read at 405 nm by a spectrophotometer (Multiskan MS, Labsystems, Helsinki, Finland). The prostaglandin concentrations derived from a standard curve were expressed as picograms of prostaglandin per ml of culture medium.
Measurement of Intracellular pH (pHi)
Intracellular pH was determined by fluorescence of 2′,7′-bis(2-carboxyethyl)-5,6-carboxyfluorescein (BCECF) (49–51). The cells were loaded with the acetoxymethyl ester of BCECF (BCECF-AM) for 30 min. Unlike BCECF, BCECF-AM is not fluorescent, but highly permeable to cell membranes, and is readily cleaved by intracellular esterases to become BCECF. The fluorescence intensity of BCECF is exquisitely pH-dependent, increasing with alkalinity. 5 × 10⁵ Cl41 JB6 cells were seeded into each well over a coverslip of the 6-well plate. After overnight culture, the medium was changed to serum-free medium, and the cells were exposed to BCECF-AM (1 μg/ml) for 30 min. After this incubation, cells were rinsed with serum-free medium and incubated in dye-free medium for 20 min to ensure complete ester hydrolysis and allow stabilization after the dye-loading procedure. Fluorescence intensity was determined using a FluoroMax spectrofluorometer (SPEX Industries, Edison, NJ) with a coverslip containing cells that were mounted in a cuvette. Different concentrations of aspirin or SA were added into the cuvette. Sample temperature was maintained at 37 °C with a water-jacketed cuvette holder via a circulating water bath. The pHi-dependent fluorescence emission peak at 525 nm (emission slits = 1 nm) was measured by using an excitation of 500 nm (excitation slits = 1 nm). The pHi was calculated using an internal calibration curve. For the internal calibration, the cells were lysed with Triton X-100 (0.05%, v/v final), and the pH of the medium was changed stepwise by addition of small volumes of concentrated acid (e.g. 1 m MES) or base (e.g. 1 m Tris), while monitoring fluorescence and measuring pH by inserting a small combination probe into the cuvette. The data were plotted in a linear graph of pH versus fluorescence intensity (in arbitrary units). The pHi values of the test samples were then directly interpolated from the resulting calibration curve as described previously (49–51).
Assay for Cell Proliferation
The cell proliferation was determined by [3H]thymidine incorporation assay. 5 × 10³ of JB6 Cl41-19 cells were seeded in 96-well microtiter plates in the presence of aspirin or SA. After 36 h culture, [3H]thymidine ([3H]TdR) (0.5 μCi/well) was added to each well. The cells were harvested 12 h later, and incorporation of [ 3H]thymidine was detected using a liquid scintillation counter. The results were presented as counts per min (cpm). Each bar indicates the average and standard deviation of assays from the triplicate wells.
Northern Blot Analysis
Northern analysis was performed as described previously (26–27). Briefly, total RNA was fractionated on a denaturing formaldehyde-agarose (1.2%) gel and transferred to Zetabind membrane (Cuno, Inc., Meriden, CT). Then the membranes were hybridized with random-primed, 32P-labeled cDNA probes. The cDNA probes utilized are 350 base pairs (+189 to 520) fragment of mouse tissue inhibitor of metalloproteinase-1 (TIMP-1) (52).
RESULTS
Aspirin and SA Inhibit TPA-induced Transformation
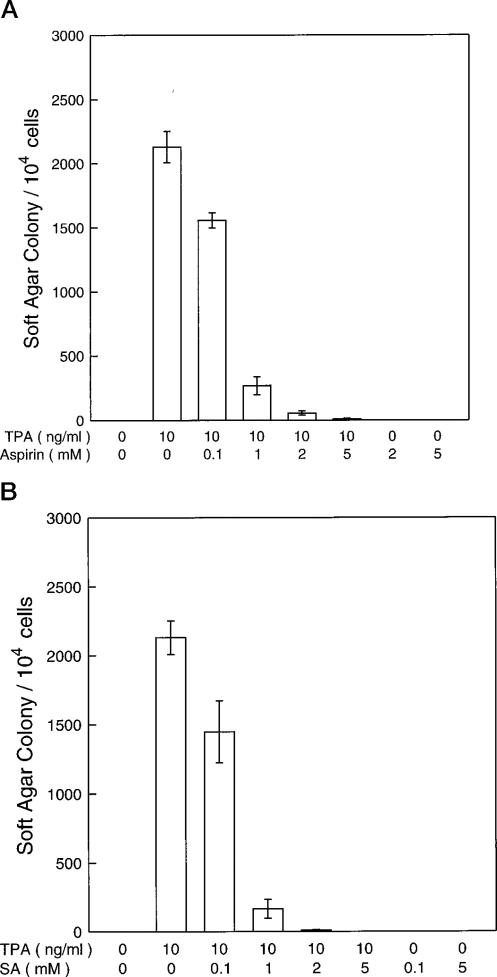
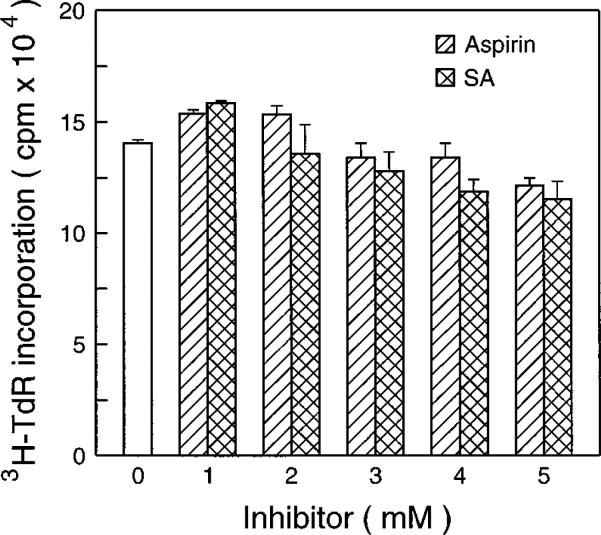
One of the most important anti-carcinogenesis mechanisms of aspirin is anti-tumor promotion (17). The mouse epidermal JB6 cell system is a well developed model for studying tumor promotion. We therefore have used the JB6 cell model as a cell culture model to test the anti-tumor promoting effect of aspirin and SA. As shown in Fig. 1, aspirin and SA inhibit tumor promotor (TPA)-induced transformation in a concentration-dependent manner. The inhibiting concentration range of aspirin and SA was from 0.5 to 5 mm for which no cytotoxic effects on JB6 cells were observed by trypan blue exclusion (data not shown). There were no significant effects of aspirin or SA on the [3H]TdR incorporation into DNA (Fig. 2).
Fig. 1. Inhibition of TPA-induced transformation by aspirin and SA.
104 JB6 P+ cells (Cl41-19) were exposed simultaneously to Me2SO (0.01%, control) or TPA with or without aspirin (A) or SA (B) in 0.33% agar for 14 days and scored for colonies at the end of the experiment. Results are expressed as the mean of three independent experiments ± standard error.
Fig. 2. The effects of aspirin or SA on [3H]TdR incorporation into cells DNA.
5 × 10³ JB6 Cl41-19 cells were exposed to aspirin or SA for 36 h. Then [3H]TdR (0.5 μCi/well) was added to each well. The cells were harvested 12 h later, and incorporation of [3H]TdR was detected.
Aspirin and SA Inhibit TPA-induced AP-1 Activity
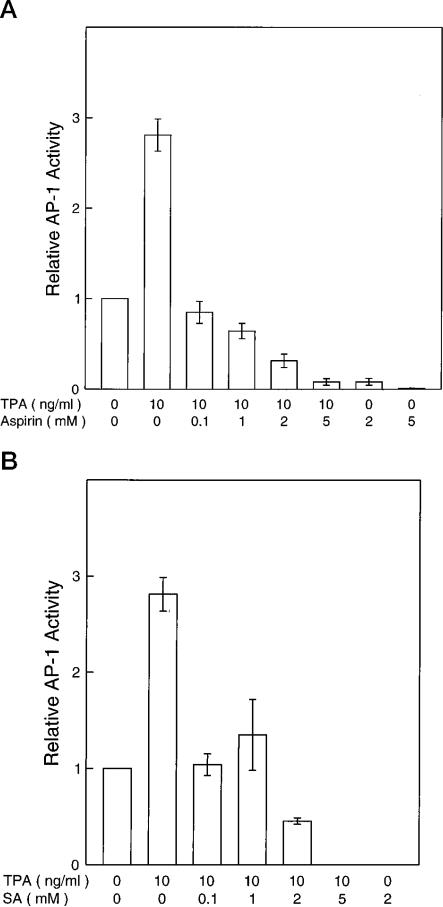
Previously we showed that induced AP-1 activity is required for neoplastic transformation in JB6 cells. To test whether the inhibition of transformation by aspirin and SA involves the inhibition of AP-1 activity, we used both stably transfected and transiently transfected JB6 cells with AP-1 reporters. By using the Col-Luc stable transfectant Cl41-19, we found that TPA-induced AP-1 activity was inhibited by aspirin or SA (Fig. 3). Inhibition of AP-1 transcriptional activity was also seen in other tested AP-1-Luc P+ stable transfectants or in transiently transfected P+ Cl41 cells using either the Col-Luc or 4 × TPA-responsive element luciferase reporters (data not shown). In JB6 cells, the inhibition of AP-1 by aspirin or SA was relatively specific, since both compounds did not affect the Rous sarcoma virus promoter-dependent transcriptional activation (data not shown). A previous report indicated that the same concentration of aspirin or SA did not affect the transcription and translation of a cytomegalovirus early promoter and T7 promoter-dependent luciferase gene (20).
Fig. 3. Inhibition of AP-1 activity of JB6 P+ cells by aspirin and SA.
Stable AP-1-Luc transfectants Cl41-19 cells were exposed to TPA with or without aspirin (A) or SA (B) at different concentrations for 24 h. Results are expressed as the mean of three independent experiments ± standard error.
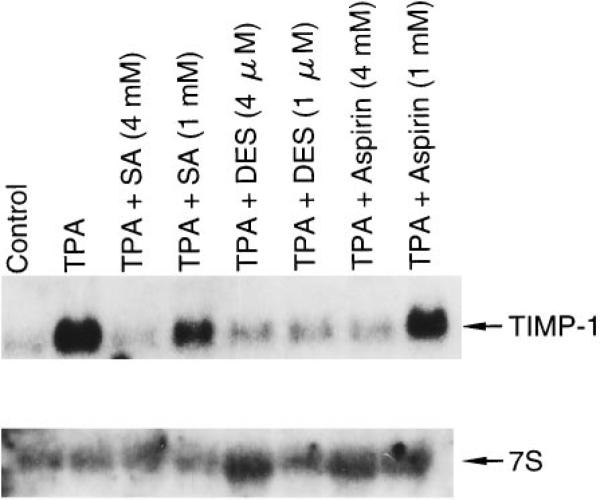
We also investigated the effect of aspirin on the expression of the TIMP-1 gene that is normally regulated by AP-1. As shown in Fig. 4, aspirin or SA inhibited TPA-induced TIMP-1 mRNA expression.
Fig. 4. Inhibition of TIMP-1 mRNA expression by aspirin and SA.
RNA from Cl41-19 cells exposed with or without aspirin or SA for 24 h was analyzed by Northern blots.
Inhibition of Anchorage-independent Growth of H-ras12- and c-jun-Transformed JB6 Cells by Aspirin or SA
Transformation of cells by H-ras is dependent on AP-1 activation. Also, overexpression of the AP-1 protein, c-Jun, causes transformation of JB6 cells. Comparison study of aspirin and SA on H-ras-transformed and c-jun-transformed JB6 cells may provide information of the molecular mechanisms of the anti-transformation effects of aspirin or SA. We therefore have investigated the effects of aspirin or SA on the anchorage-independent growth of H-ras12- and c-jun-transformed JB6 cells. Aspirin or SA inhibited the anchorage-independent growth of both cell lines in a concentration-dependent manner (Table I). Inhibition of the anchorage-independent growth of c-jun-transformed JB6 cells appears more sensitive than that of H-ras12-transformed cells (Table I).
Table I. Inhibition of anchorage-independent growth of H-ras12 -and c-jun-transformed JB6 cells by aspirin or SA.
104 H-ras12 - or c-jun-transformed JB6 cells were exposed to Me2SO (control group), aspirin, or SA in 0.33% agar for 14 days.
| Cell line | Chemical | Agar colonies (104 cells seeded) |
Inhibition | ||
|---|---|---|---|---|---|
| Experiment 1 | Experiment 2 | Average | |||
| mm | % | ||||
| H-ras12-transformed JB6 cells | Control 0 | 3590 | 3380 | 3485 | |
| Aspirin 0.1 | 3040 | 2780 | 2910 | 16.5 | |
| Aspirin 0.5 | 2420 | 2120 | 2270 | 34.9 | |
| Aspirin 1 | 80 | 20 | 50 | 98.6 | |
| Aspirin 3 | 0 | 0 | 0 | 100.0 | |
| Aspirin 4 | 10 | 0 | 5 | 99.9 | |
| SA 0.1 | 2590 | 2100 | 2345 | 32.7 | |
| SA 0.5 | 1650 | 1720 | 1685 | 51.6 | |
| SA 1 | 660 | 450 | 555 | 84.1 | |
| SA 3 | 10 | 0 | 5 | 99.9 | |
| SA 4 | 0 | 0 | 0 | 100.0 | |
| c-jun-transformed JB6 cells (PMJ8c) | Control 0 | 810 | 830 | 820 | |
| Aspirin 0.1 | 760 | 730 | 745 | 9.1 | |
| Aspirin 0.5 | 300 | 270 | 285 | 65.2 | |
| Aspirin 1 | 90 | 50 | 70 | 91.5 | |
| Aspirin 3 | 0 | 0 | 0 | 100.0 | |
| Aspirin 4 | 0 | 0 | 0 | 100.0 | |
| SA 0.1 | 730 | 700 | 715 | 2.8 | |
| SA 0.5 | 390 | 380 | 385 | 53.0 | |
| SA 1 | 70 | 70 | 70 | 91.5 | |
| SA 3 | 0 | 0 | 0 | 100.0 | |
| SA 4 | 0 | 0 | 0 | 100.0 | |
Indomethacin, a Potent Cyclooxygenase Inhibitor, Did Not Inhibit TPA-induced AP-1 Activity and Transformation
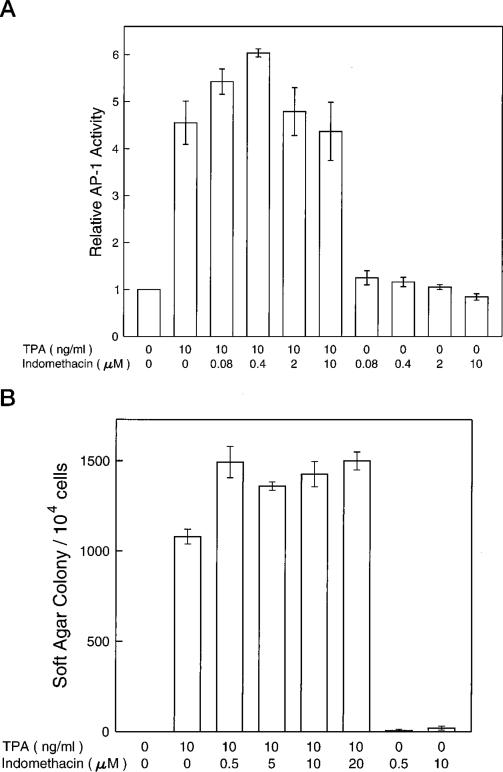
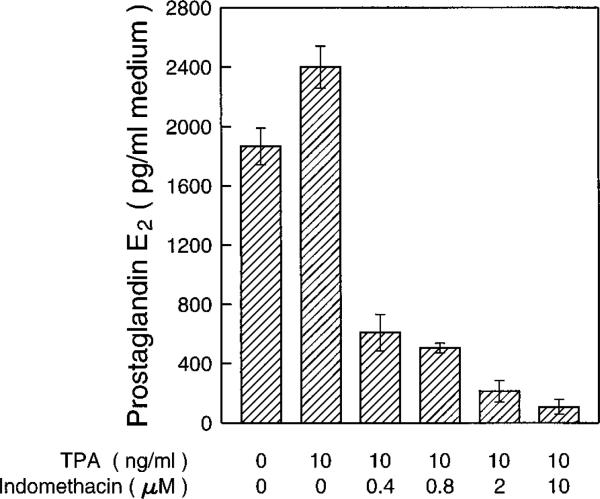
PGH synthase is the rate-limiting enzyme in prostaglandin biosyn-thesis. PGH synthase has two enzymic activities as follows: a dioxygenase (cyclooxygenase) activity, which site-specifically and stereospecifically inserts two molecules of oxygen into one molecule of arachidonic acid to generate the hydroperoxyendoperoxide prostaglandin G2, and a hydroperoxidase activity that attacks the peroxide group of prostaglandin G2 to yield prostaglandin H2 (17). Prostaglandin H2 is the precursor of prostaglandin E2 (PGE2) and prostaglandin 2α (PGF2α), the major prostaglandins found in skin (1, 17, 53, 54). Cyclooxygenase is the exclusive target of aspirin but not SA, which lacks an acetyl group, and therefore is ineffective as a PGH synthase inhibitor. Since both aspirin and SA inhibit AP-1 activity and transformation in JB6 cells, we hypothesized that the anti-transformation effect of NSAIDs does not occur through cyclooxygenase and prostaglandins. To test this hypothesis, we investigated the effects of indomethacin, a potent cyclooxygenase inhibitor, in JB6 cells. As shown in Fig. 5, indomethacin did not inhibit TPA-induced AP-1 activity over the concentration range that inhibited cyclooxygenase or at a concentration much higher than the one required to inhibit cyclooxygenase (Fig. 6). If there is any effect of indomethacin on TPA-induced transformation, it is an increase rather than a decrease of the transformation rate in JB6 P+ cells.
Fig. 5. Lack of effects on TPA-induced AP-1 activity or transformation by indomethacin.
For assaying AP-1 activity (A), JB6 Cl41-19 cells were exposed to 0.01% of Me2SO (the solvent control group) or TPA or different concentrations of indomethacin for 24 h. The AP-1 luciferase enzyme activity was measured using the luminometer. For measuring transformation activity (B), 104 JB6 P+ cells (Cl41-19) were exposed simultaneously to Me2SO (0.01%, control) or TPA with or without indomethacin in 0.33% agar and scored for colonies at 14 days.
Fig. 6. Inhibition of prostaglandin E2 synthesis by indomethacin.
5 × 10⁴ P+ cells were seeded in each well of 6-well plates and cultured overnight. Then the cells were washed with serum-free medium and changed to 2 ml of serum-free medium with or without indomethacin or TPA. After 3 days culture, the medium was aspirated from each well for prostaglandin E enzyme immunoassays with a prostaglandin E2 EIA Assay Kit (PerSeptive Diagnostics, Cambridge, MA). The results are expressed as the mean of three independent experiments ± standard error.
Prostaglandins E1, E2, or F2α Did Not Induce AP-1 Activity Nor Increase Transformation of JB6 Cells
The above results suggested that the anti-AP-1 or anti-transformation effects of aspirin may not occur through a PGE synthesis inhibition event. To clarify this issue further, we directly determined the role of PGE1, E2, and F2α in the induction of AP-1 activity and transformation in JB6 cells. As summarized in Table I, prostaglandins have no effect on the basal or TPA-induced level of AP-1 activity. They did not induce transformation nor increase TPA-induced transformation (Table II). A high concentration of prostaglandins (4 μg/ml) caused a decrease of soft agar colonies due to the cytotoxic effect (Table II and data not shown). These results and the data with indomethacin clearly demonstrate that cyclooxygenase and prostaglandins are not involved in the inhibitory effect of aspirin/SA on TPA-induced AP-1 activity or transformation in JB6 cells.
Table II. Lack of effect of prostaglandins on JB6 cell transformation.
Experiments were carried out using JB6 P+ cells (C141–19) as described under “Experimental Procedures.”
| PG concentration | Relative AP-1 activity |
Soft agar colony/104 cells |
||
|---|---|---|---|---|
| –TPA | +TPA | –TPA | +TPA | |
| μg/ml | ||||
| PGE1 | ||||
| 0 | 1 | 7.67 ± 0.225 | 20 ± 11 | 906 ± 63 |
| 0.0625 | 1.09 ± 0.12 | 6.62 ± 0.015 | 20 ± 11 | 900 ± 115 |
| 0.25 | 1.12 ± 0.02 | 7.2 ± 0.6 | 40 ± 11 | 933 ± 76 |
| 1 | 1.11 ± 0.03 | 6.6 ± 0.34 | 0 | 666 ± 17 |
| 4 | 1.05 ± 0.02 | 6.1 ± 0.3 | 40 ± 11 | 580 ± 64 |
| PGE2 | ||||
| 0 | 1 | 5.60 ± 0.58 | 20 ± 11 | 906 ± 63 |
| 0.015 | 0.98 ± 0.01 | 5.12 ± 0.02 | NDa | NDa |
| 0.0625 | 0.96 ± 0.01 | 5.37 ± 0.08 | 20 ± 11 | 1020 ± 11 |
| 0.25 | 0.95 ± 0.02 | 5.05 ± 0.15 | 26 ± 17 | 800 ± 20 |
| 1 | 0.98 ± 0.02 | 4.92 ± 0.42 | 40 ± 23 | 753 ± 52 |
| 4 | 0.94 ± 0.01 | 4.93 ± 0.44 | 66 ± 38 | 873 ± 64 |
| PGF2α | ||||
| 0 | 1 | 5.00 ± 0.13 | 20 ± 11 | 906 ± 63 |
| 0.015 | 1.2 ± 0.04 | 5.24 ± 0.09 | ND | ND |
| 0.0625 | 1.07 ± 0.18 | 5.23 ± 0.35 | 0 | 973 ± 37 |
| 0.25 | 0.90 ± 0.02 | 5.05 ± 0.01 | 0 | 966 ± 88 |
| 1 | 0.99 ± 0.08 | 4.75 ± 0.58 | 0 | 913 ± 52 |
| 4 | 0.94 ± 0.08 | 4.7 ± 0.03 | 0 | 840 ± 40 |
ND, not done.
Inhibition of AP-1 and Transformation by Aspirin and SA Is Not through the Inhibition of Erk1 or Erk2 or Phosphorylation of c-jun
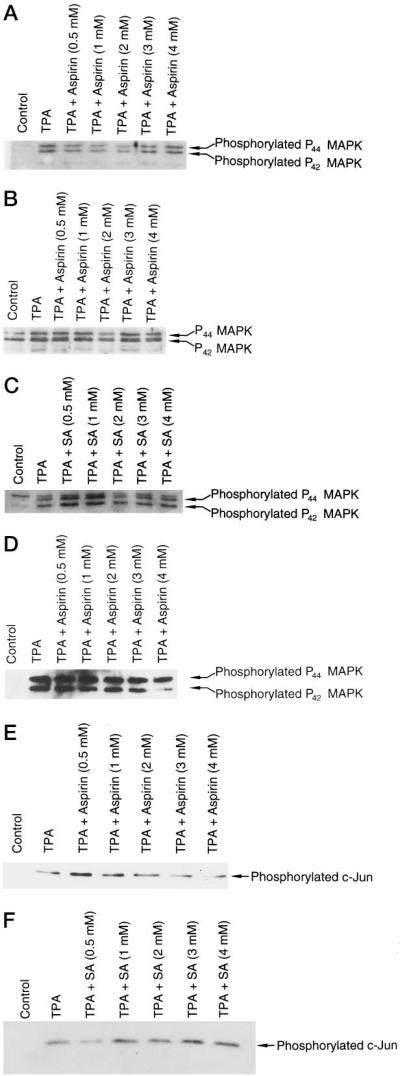
Since MAPKs, especially Erk1 and Erk2 (p44 and p42 MAPK), have been reported as major activators for AP-1 proteins (Jun/Fos) in TPA- or growth factor-induced signal transduction pathways, we tested whether aspirin or SA inhibits AP-1 and transformation through the inhibition of Erk1 or Erk2 or kinases upstream of them. Using antibodies specific for p44 and p42mapk and phospho-specific for the phosphorylated tyrosine 204 of p44 and of p42mapk, we studied the total p44 and p42 protein and the protein phosphorylation in p44 and p42. Aspirin and SA did not affect the protein levels of Erk1 and Erk2 or the phosphorylation level of the two proteins (Fig. 7 and data not shown). Even pretreating the cells with aspirin or SA for 24 h still showed no effect on the protein levels of Erk1 or Erk2 (Fig. 7 and data not shown). This indicated that inhibition of AP-1 is through an Erk1- or Erk2-independent pathway. This also suggested kinases upstream of Erk1 or Erk2 may not be involved in the aspirin-mediated inhibition of AP-1.
Fig. 7. Aspirin or SA does not inhibit basal or TPA-induced Erk1 or Erk2 or phosphorylated c-jun.
JB6 Cl41-19 cells were pretreated with aspirin, SA, or medium alone for 24 h and then exposed to TPA with or without aspirin or SA for 30 min (A and B) or 24 h (C and D). The cells were lysed and Erk1 and Erk2 proteins and phosphorylation proteins were assayed by a PhosphoPlus MAPKs kit from New England Biolabs. For measuring the phosphorylation level of c-Jun protein (E and F), protein extracts from the same samples as described in C were assayed by a PhosphoPlus c-Jun kit from New England Biolabs.
Extracellular signals, including growth factors, phorbol ester, transforming oncoproteins, and UV irradiation (47), also stimulate phosphorylation of c-Jun at Ser-63/-73 by SAPK/JNK and activate c-Jun-dependent transcription. Mutation of Ser-63/-73 renders c-Jun nonresponsive to stress-induced signaling pathways (47). Since JNK MAPKs may also be involved in the activation of AP-1 by phosphorylation of c-Jun protein Ser-63 and Ser-73, we examined the phosphorylated c-Jun protein levels by specific antibodies against the phosphorylation of c-Jun at Ser-63 or Ser-73. As shown in Fig. 7, E and F, aspirin or SA did not affect the phosphorylation of c-Jun at Ser-63/-73. Since SAPK/JNK can direct activated c-Jun-dependent transcription by phosphorylation of c-Jun at Ser-63/-73, this result also suggested that SAPK/JNK is not involved in the inhibition effect of aspirin or SA on AP-1 activation.
Intracellular H+ May Be Involved in the Inhibition of AP-1 and Transformation by Aspirin and SA
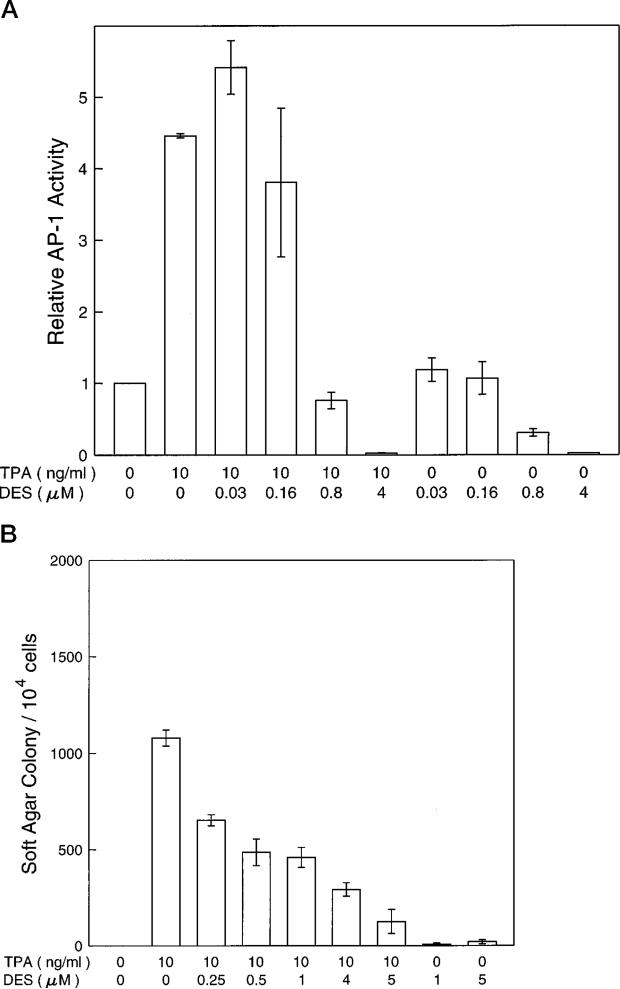
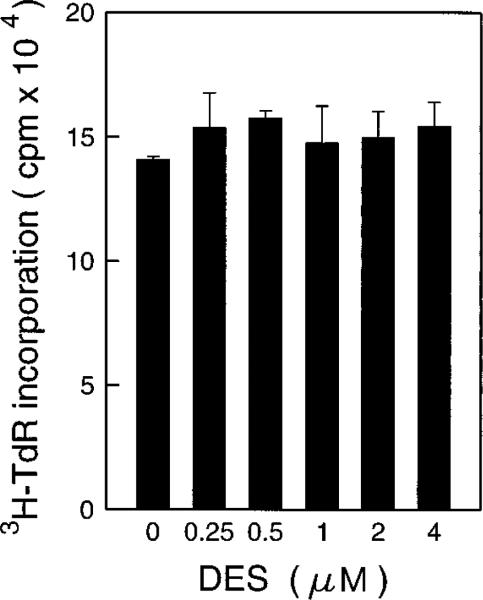
Recently, Lis and Giardina (43) have reported that a H+ pump inhibitor, diethylstilbestrol (DES), could affect the transcription factor for heat shock protein (43). Increasing the intracellular pH by overexpression of a proton-pumping ATPase PMA1 protein in 3T3 cells caused neoplastic transformation of the 3T3 cells and elevated the level of AP-1 activity (55). We therefore hypothesized that the inhibition of AP-1 activity and transformation by aspirin and SA may occur through elevation of the intracellular H+ concentration. By using the H+ pump inhibitor DES, we observed that AP-1 activities were inhibited in a dose-dependent manner (Fig. 8A). Furthermore, DES also inhibited the TPA-induced transformation in a similar dose range (Fig. 8B). This inhibition on anchorage-independent growth is disassociated with the anchorage-dependent growth as measured by [3H]TdR incorporation to DNA (Fig. 9).
Fig. 8. DES inhibits TPA-induced AP-1 activity and transformation.
For assaying AP-1 activity (A), JB6 Cl41-19 cells were exposed to 0.01% of Me2SO (the solvent control group) or TPA or different concentrations of DES for 24 h. The luciferase enzyme activity was measured using the luminometer. For assaying transformation activity (B), 104 JB6 Cl41-19 cells were exposed to TPA with or without DES in 0.33% agar for 14 days. The results are expressed as the mean of three independent experiments ± standard error.
Fig. 9. The effects of DES on [3H]TdR incorporation into cells DNA.
5 × 10³ JB6 Cl41-19 cells were exposed to DES for 36 h. Then [ 3H]TdR (0.5 μCi/well) was added to each well. The cells were harvested 12 h later, and incorporation of [3H]TdR was detected.
To test directly the effect of aspirin or SA on intracellular pH, we used the BCECF fluorescence assay (49–52). The fluorescence intensity of BCECF is exquisitely pH-dependent and increases with alkalinity. To load and trap BCECF into viable cells, the nonfluorescent acetoxymethyl ester derivative of BCECF was used. After incubation, intracellular esterases rendered the BCECF fluorescent and entrapped (see “Experimental Procedures”). As shown in Table III, the same dose ranges of aspirin, SA, or DES that inhibited TPA-induced AP-1 activity or cell transformation caused decreases in intracellular pH. For instance, we noted that a DES-induced pH change to 6.8 resulted in over an 80% decrease in TPA-induced AP-1 activity (Fig. 8A). A similar aspirin- or SA-induced pH change to 6.8 or 6.7, respectively, reduced the TPA-induced AP-1 activities by 90% or more (Fig. 3, A and B). In the case of TPA-induced cell transformation, changes in pH to 6.8 by DES resulted in a 60% inhibition (Fig. 8B), whereas changes in pH to 6.8 or 6.7 by aspirin or SA, respectively, were over 95% inhibitory. These results suggest that the noted changes in pH are sufficient to account for a substantial part of the effect of aspirin or SA on cells.
Table III. The effect of aspirin or SA on pHi.
pHi was determined by fluorescence of BCECF as described under “Experimental Procedures.”
| Chemicals | Concentrations | pHi |
|---|---|---|
| m ± SE | ||
| Control | 0 | 7.4 ± 0 |
| Aspirin | 1 mm | 7.2 ± 0 |
| Aspirin | 2 mm | 7.0 ± 0.02 |
| Aspirin | 4 mm | 6.8 ± 0.03 |
| SA | 1 mm | 7.2 ± 0.03 |
| SA | 2 mm | 6.9 ± 0.03 |
| SA | 4 mm | 6.7 ± 0.05 |
| DES | 0.5 μm | 7.1 ± 0.07 |
| DES | 1 μm | 6.8 ± 0.03 |
| DES | 2 μm | 6.4 ± 0.06 |
| DES | 4 μm | 6.1 ± 0.06 |
DISCUSSION
Our results indicate that aspirin and SA inhibit transcription factor AP-1 activity and tumor promoter-induced transformation through a mechanism independent of prostaglandin synthesis. The concentrations of salicylates required to exert these effects in vitro (1–3 mm) approach those required for the clinical effects in vivo (1, 2, 20). Inhibition of AP-1 luciferase activity by aspirin or SA is relatively more sensitive than the inhibition of cell transformation. This probably is due to one of the following reasons: (i) the luciferase assay is more sensitive for measuring transcriptional dependent activity than are other methods such as measuring RNA levels or chloramphenicol acetyltransferase activity, or (ii) the decay of aspirin or SA in the long term soft agar anti-transformation assay (14 days). Previously, we have reported that induced AP-1 activity is required for tumor promoter-induced transformation (30). Therefore, the inhibition of AP-1 activity may be functionally linked to the anti-cancer effect of salicylates.
The prostaglandins are a diverse group of autocrine and paracrine hormones. These lipid-derived signaling molecules are critical regulators of immune response, inflammation, and other cellular and physiological processes. One well-characterized activity of aspirin is its ability to inhibit prostaglandin synthesis. Hence, many biological effects of aspirin have been attributed to this inhibition activity on prostaglandin synthesis (16, 17). However, the ability of SA to influence prostaglandin-independent signaling processes is well documented (18–21). It is unlikely that the inhibition of prostaglandin synthesis is the mechanism responsible for the inhibition of AP-1 transactivation and neoplastic transformation. We have further excluded the involvement of the prostaglandin pathway in the inhibition of AP-1 and transformation by salicylates by using the potent cyclooxygenase inhibitor indomethacin. In the dose range that inhibited the PGE2 synthesis (Fig. 6), indomethacin did not inhibit basal or TPA-induced AP-1 activity (Fig. 5A). If indomethacin has any effect on TPA-induced transformation, it is an enhancement of the transformation rate (Fig. 5B). This result agrees with the clinical report that indomethacin did not induce the regression of polyposis, whereas sulindac did (17). Fisher et al. (56) have reported that indomethacin did not inhibit skin tumor promotion in SENCAR mice. Furthermore, we have investigated prostaglandins in vitro to test their involvement in transformation and AP-1 activity of JB6 cells in this report. This work has also shown that prostaglandins PGE2 and PGF2α, major isoforms in epidermal cells, as well as PGE1 did not induce AP-1 activity or increase background or TPA-induced transformation (Table II). If there is any effect of PGEs or PGF2α, it is a decrease in the AP-1 activity and transformation rate caused by their cytotoxic effect at high doses. Therefore, we concluded that the inhibition of transformation in JB6 cells by aspirin and other salicylates is a pros-taglandin/cyclooxygenase-independent event. While most reports support the role of inhibition of prostaglandin in anti-carcinogenesis by aspirin (16, 17), some experimental evidence contradicts the concept that inhibition of prostaglandin synthesis plays a central role in the anti-tumor effects of aspirin and other NSAIDs. For example, instead of promoting cell growth, relatively high levels of prostaglandins have been reported to inhibit tumor cell growth both in vitro and in vivo (57–59). Exogenous prostaglandins were shown to inhibit basal mucosal DNA synthesis in colon explants from animals (60). DeMello et al. (61) reported that NSAID concentrations that inhibited cell growth in rat hepatoma cell lines in vitro correlated poorly with concentrations that inhibited cyclooxygenase activity. Alberts et al. (22) reported that sulinac sulfone, a NSAID lacking anti-prostaglandin synthetase activity, inhibited azoxymethane-induced colon carcinogenesis in rats. Also, sulindac sulfone had no effect on mucosal PGE concentrations (22). More recently, the results from COX-1 and COX-2 knockout mice indicated that the TPA-induced ear swelling response was similar in both wild-type and COX-1- or COX-2-deficient mice (23, 24). These data also support the concept that inhibition of tumor promotor (TPA)-mediated effects by aspirin may be through a prostaglandin-independent pathway.
Both p44mapk and p42mapk (Erk1 and Erk2) function in a protein kinase cascade and in the regulation of transcription factor AP-1 proteins (Jun/Fos) (47, 62–65). It has been reported that Erk1 and Erk2 are the major mediators for the TPA- or growth factor-induced signal transduction pathway in many cells (47, 62–64). By contrast, JNK mediates ultraviolet radiation (UV) and other stress-induced signal transductions by phosphorylation of c-jun at Ser-63/-73 (66). Mutation of Ser-63/ -73 renders c-Jun nonresponsive to growth factor, phorbol ester, and UV-induced signaling pathways (55). Activation of MAPKs occurs through phosphorylation of threonine and tyrosine (202 and 204 of MAPK) at the sequence T*EY* by upstream MAPK kinase (45, 46). In JB6 cells, MAPKs have been reported to bind to the Jun·AP-1 complex (65). If aspirin or SA targets the protein kinase cascade induced by TPA, then the aspirin or SA should decrease the phosphorylation level or the total amount of Erk1 or Erk2. If JNK is involved in the inhibition of AP-1 activity by aspirin or SA, then the phosphorylation of c-Jun protein at Ser-63/-73 should be decreased (47, 65) Our data indicate that there is no inhibition of Erk1 or Erk2 kinases and phosphorylation of c-Jun protein at Ser-63/-73 by aspirin and SA. Thus, the inhibition of AP-1 and transformation by aspirin or SA probably does not involve Erk1, Erk2, or JNK or kinases upstream above them (e.g. PKC, Ras/Raf, MAPK kinase). Moreover, we found that aspirin or SA inhibited anchorage-independent growth of H-ras12 or c-jun-transformed JB6 cells. Interestingly, AP-1 activities of these cell lines are also inhibited by aspirin or SA.2 These data also suggest that inhibition of cell transformation by aspirin or SA might directly be targeted at transcriptional factor AP-1 but not the kinase cascade.
Aspirin or SA causes a decrease in the intracellular pH in JB6 cells. Lis and Giardina (43) have recently reported that intracellular H+ may be involved in yeast heat shock gene transcription by aspirin and SA. Inhibition of the plasma membrane proton pump, either by DES or by mutation, also inhibits heat shock gene expression (43, 67). Overexpression of yeast proton pumping ATPase (PMA1) in NIH/3T3 cells causes neo-plastic transformation of the cells (68). These cells have a higher intracellular pH than parental cells even in the presence of bicarbonate (69). Interestingly, AP-1 activity also increases severalfold in the PMA1-transformed cells (55). Our data indicate that aspirin, SA, or DES alter intracellular pH over similar dose ranges required for inhibition of TPA-induced AP-1 activity and transformation. These results suggest inhibition of AP-1 activity and transformation by aspirin or SA may be through the elevation of intracellular H+ concentration.
Although the benefit of aspirin and other NSAIDs is obvious, side effects of these drugs can be significant, including incidence of gastrointestinal toxicity and impaired renal function (70, 71). Renal problems for patients with a variety of diseases can become especially severe if prostaglandin synthesis is inhibited by NSAIDs (72). COX-2 message and protein are normally undetectable in most tissues but can be rapidly induced in certain tissues by proinflammatory agents, tumor promoters, and mitogens (25, 73). In contrast, COX-1 is a constitutive housekeeping enzyme whose expression appears to be regulated only developmentally and is primarily responsible for prostaglandin production in stomach and kidney (25). COX-1 is thus believed to be the target for NSAIDs-induced side effects (25). Indeed, selective inhibitors of COX-2 cause low to negligible levels of gastric irritation in animal models (74, 75). However, results from COX-2 knockout mice indicate COX-2 might also be involved in the side effect of renal impairment by NSAIDs (24). The finding of AP-1 inhibition but not prostaglandin synthesis for the inhibition of carcinogenesis in this study may reveal additional molecular targets for development of “better NSAIDs” with fewer side effects and more effective chemoprevention of carcinogenesis.
In summary, we have provided evidence for a novel mechanism of the anti-tumor promotion action by aspirin and SA. Our experiments suggest that inhibition of tumor promoter induced-neoplastic transformation in JB6 cells may be through the inhibition of AP-1 transactivation. The inhibition effects on AP-1 activity and neoplastic transformation is not mediated through the inhibition of prostaglandin pathway nor through the inhibition of Erk1 and Erk2 pathway. Intracellular H+ concentration may be involved in the inhibition mechanism for AP-1 and transformation by aspirin and SA. These results may provide insight regarding the molecular basis for the development of new chemoprotective agents for cancer.
Acknowledgments
We thank Dr. Lynn M. Matrisian for providing the TIMP-1 probes.
Footnotes
This work was supported by the Hormel Foundation. The spectrofluorometer used in this study received major support from United States Public Health Service Grant GM45928 (to R. E. B.). The costs of publication of this article were defrayed in part by the payment of page charges. This article must therefore be hereby marked “advertisement” in accordance with 18 U.S.C. Section 1734 solely to indicate this fact.
The abbreviations used are: NSAIDs, nonsteroidal anti-inflammatory drugs; TPA, 12-O-tetradecanoylphorbol-13-acetate; P+, promotion-sensitive; P–, promotion-resistant; AP-1, activator protein 1; Me2SO, dimethyl sulfoxide; PGH, prostaglandin H; PGE1, prostaglandin E1; PGE2, prostaglandin E2; PGF2α, prostaglandin F2α; SA, sodium salicylate; DES, diethylstilbestrol; COX-1, cyclooxygenase-1; COX-2, cyclooxygenase-2; MAPK, mitogen-activated protein kinase; JNK, c-Jun N-terminal kinase; BCECF, 2′,7-bis(2-carboxyethyl)-5,6-carboxyfluorescein; BCECF-AM, acetoxymethyl ester of BCECF; TIMP-1, tissue inhibitor of metalloproteinase; MES, 2-(N-morpholino)ethanesulfonic acid; [3H]TdR, [3H]thymidine; pHi, intracellular pH; Tx, transformed.
C. Huang and Z. Dong, unpublished data.
REFERENCES
- 1.Meade TW. In: Aspirin and Other Salicylates. Vane JR, Botting RM, editors. Chapman and Hall Ltd.; London: 1992. pp. 321–353. [Google Scholar]
- 2.Thun MJ, Namboodiri MM, Calle EE, Flanders WD, Health CW. N. Engl. J. Med. 1991;25:1593–1596. doi: 10.1056/NEJM199112053252301. [DOI] [PubMed] [Google Scholar]
- 3.Thun MJ, Namboodiri MM, Calle EE, Flanders WD, Heath CW. Cancer Res. 1993;53:1322–1327. [PubMed] [Google Scholar]
- 4.Kune GA, Kuns S, Watson LF. Cancer. 1988;48:399–404. [Google Scholar]
- 5.Logan RFA, Little J, Hartwin LF, Hardcastle JD. Brit. Med. J. 1993;307:285–289. [Google Scholar]
- 6.Narisawa T, Satoh M, Sano M, Takahashi T. Carcinogenesis. 1983;4:1225–1227. doi: 10.1093/carcin/4.10.1225. [DOI] [PubMed] [Google Scholar]
- 7.Metzger U, Meier J, Uhlschmid G, Weihe H. Dis. Colon Rectum. 1984;27:366–369. doi: 10.1007/BF02553001. [DOI] [PubMed] [Google Scholar]
- 8.Nigro DN, Bull AW, Boyd ME. J. Natl. Cancer Inst. 1986;77:1309–1313. [PubMed] [Google Scholar]
- 9.Moorghen M, Ince P, Finney K, Sunter JP, Appleton DR, Watson AJ. J. Pathol. 1988;156:341–347. doi: 10.1002/path.1711560411. [DOI] [PubMed] [Google Scholar]
- 10.Takahashi M, Furukawa F, Toyoda K, Sato H, Hasegawa R, Imaida K, Hayashi Y. Carcinogenesis. 1990;11:393–395. doi: 10.1093/carcin/11.3.393. [DOI] [PubMed] [Google Scholar]
- 11.Murasaki G, Zenser YV, Davis BB, Cohen SM. Carcinogenesis. 1984;5:53–55. doi: 10.1093/carcin/5.1.53. [DOI] [PubMed] [Google Scholar]
- 12.Sakata T, Hasegawa R, Johansson SL, Zenser TV, Cohen SM. Cancer Res. 1986;46:3903–3906. [PubMed] [Google Scholar]
- 13.Cohen SM, Hasegawa R, Sakata T, Johansson SL. Cancer Res. 1989;49:372–377. [PubMed] [Google Scholar]
- 14.McCormick DL, Madigan MJ, Moon RC. Cancer Res. 1985;45:1803–1808. [PubMed] [Google Scholar]
- 15.Lynch NR, Castes M, Astoin M, Salomon JC. Br. J. Cancer. 1978;38:503–512. doi: 10.1038/bjc.1978.237. [DOI] [PMC free article] [PubMed] [Google Scholar]
- 16.Thun MJ. Cancer Metastasis Rev. 1994;13:269–277. doi: 10.1007/BF00666097. [DOI] [PubMed] [Google Scholar]
- 17.Marnett LJ. Cancer Res. 1992;52:5575–5589. [PubMed] [Google Scholar]
- 18.Vane J. Nature. 1994;367:215–216. doi: 10.1038/367215a0. [DOI] [PubMed] [Google Scholar]
- 19.Weissmann G. Sci. Am. 1991;264:84–90. doi: 10.1038/scientificamerican0191-84. [DOI] [PubMed] [Google Scholar]
- 20.Kopp E, Ghosh S. Science. 1994;265:956–959. doi: 10.1126/science.8052854. [DOI] [PubMed] [Google Scholar]
- 21.Rainsford KD. Aspirin and the Salicylates. Butterworths & Co.; Boston, MA: 1984. [Google Scholar]
- 22.Alberts DS, Hixson L, Ahnen D, Bogert C, Einspahr J, Paranka N, Brendel K, Gross PH, Pamukcu R, Burt RW. J. Cell. Biochem. 1995;22:18–23. doi: 10.1002/jcb.240590804. [DOI] [PubMed] [Google Scholar]
- 23.Langenbach R, Morham SG, Tiano HF, Loftin CD, Ghanayem BI, Chulada PC, Mahler JF, Lee CA, Goulding EH, Kluckman KD, Kim HS, Smithies O. Cell. 1995;83:483–492. doi: 10.1016/0092-8674(95)90126-4. [DOI] [PubMed] [Google Scholar]
- 24.Morham SG, Langenbach R, Loftin CD, Tiano HF, Vouloumanos N, Jennette JC, Mahler JF, Kluckman KD, Ledford A, Lee CA, Smithies O. Cell. 1995;83:473–482. doi: 10.1016/0092-8674(95)90125-6. [DOI] [PubMed] [Google Scholar]
- 25.DeWitt D, Smith WL. Cell. 1995;83:345–348. doi: 10.1016/0092-8674(95)90109-4. [DOI] [PubMed] [Google Scholar]
- 26.Sun Y, Nakamura K, Hegamyer G, Dong Z, Colburn N. Mol. Carcinogen. 1993;8:49–57. doi: 10.1002/mc.2940080111. [DOI] [PubMed] [Google Scholar]
- 27.Sun Y, Dong Z, Jackman J, Hegamyer G, Kim H, Sithanandam K, Colburn NH. Int. J. Oncol. 1995;6:465–471. doi: 10.3892/ijo.6.2.465. [DOI] [PubMed] [Google Scholar]
- 28.Colburn NH, Wandel E, Srinivas L. J. Cell. Biochem. 1982;18:261–270. doi: 10.1002/jcb.1982.240180302. [DOI] [PubMed] [Google Scholar]
- 29.Colburn NH, Former BF, Nelson KA, Yuspa SH. Nature. 1979;281:589–591. doi: 10.1038/281589a0. [DOI] [PubMed] [Google Scholar]
- 30.Dong Z, Birrer MJ, Watts RG, Matrisian LM, Colburn NH. Proc. Natl. Acad. Sci. U. S. A. 1994;91:609–613. doi: 10.1073/pnas.91.2.609. [DOI] [PMC free article] [PubMed] [Google Scholar]
- 31.Bernstein LR, Colburn NH. Science. 1989;244:566–569. doi: 10.1126/science.2541502. [DOI] [PubMed] [Google Scholar]
- 32.Li JJ, Dong Z, Dawson MI, Colburn NH. Cancer Res. 1996;56:483–489. [PubMed] [Google Scholar]
- 33.Angel P, Karin M. Biochim. Biophys. Acta. 1991;1072:129–157. doi: 10.1016/0304-419x(91)90011-9. [DOI] [PubMed] [Google Scholar]
- 34.Curran T, Franza BR., Jr. Cell. 1988;55:395–397. doi: 10.1016/0092-8674(88)90024-4. [DOI] [PubMed] [Google Scholar]
- 35.Imbra RJ, Karin M. Nature. 1986;323:555–558. doi: 10.1038/323555a0. [DOI] [PubMed] [Google Scholar]
- 36.Angel P, Baumann I, Stein B, Delius H, Rahmsdorf HJ, Herrlich P. Mol. Cell. Biol. 1987;7:2256–2266. doi: 10.1128/mcb.7.6.2256. [DOI] [PMC free article] [PubMed] [Google Scholar]
- 37.Ye J, Zhang X, Young HA, Mayo Y, Shi X. Carcinogenesis. 1995;16:2401–2405. doi: 10.1093/carcin/16.10.2401. [DOI] [PubMed] [Google Scholar]
- 38.Kerr LD, Miller DB, Matrisian LM. Cell. 1990;61:267–278. doi: 10.1016/0092-8674(90)90807-q. [DOI] [PubMed] [Google Scholar]
- 39.Ye J, Zhang X, Dong Z. Mol. Cell. Biol. 1996;16:157–167. doi: 10.1128/mcb.16.1.157. [DOI] [PMC free article] [PubMed] [Google Scholar]
- 40.Malamy J, Carr JP, Klessig DF, Raskin I. Science. 1990;250:1002–1004. doi: 10.1126/science.250.4983.1002. [DOI] [PubMed] [Google Scholar]
- 41.Metraux JP, Signer H, Ryals J, Ward E, Wyss-Benz M, Gaudin J, Raschdore K, Schmid E, Blum W, Inverardi B. Science. 1990;250:1004–1006. doi: 10.1126/science.250.4983.1004. [DOI] [PubMed] [Google Scholar]
- 42.Jurivich DA, Sistonen L, Kroes RA, Morimoto RI. Science. 1992;255:1243–1245. doi: 10.1126/science.1546322. [DOI] [PubMed] [Google Scholar]
- 43.Giardina C, Lis JT. J. Biol. Chem. 1995;270:10369–10372. doi: 10.1074/jbc.270.18.10369. [DOI] [PubMed] [Google Scholar]
- 44.Lavrosky V, Dong Z, Ma WY, Colburn N. In Vitro Cell. & Dev. Biol. 1996;32:234–237. doi: 10.1007/BF02722951. [DOI] [PubMed] [Google Scholar]
- 45.Sturgill TW, Ray LB, Erikson E, Maller JL. Nature. 1988;334:715–718. doi: 10.1038/334715a0. [DOI] [PubMed] [Google Scholar]
- 46.Payne DM, Rossomando AJ, Martino P, Erickson AK, Her J-H, Shabanowitz J, Hunt DF, Weber MJ, Sturgill TW. EMBO J. 1991;10:885–892. doi: 10.1002/j.1460-2075.1991.tb08021.x. [DOI] [PMC free article] [PubMed] [Google Scholar]
- 47.Derijard B, Hibi M, Wu I-H, Barrett T, Su B, Deng T, Karin M, Davis RJ. Cell. 1994;76:1025–1037. doi: 10.1016/0092-8674(94)90380-8. [DOI] [PubMed] [Google Scholar]
- 48.Schule R, Rangarajan P, Yang N, Kliewer S, Ransone L, Bolado J, Verma IM, Evans RM. Proc. Natl. Acad. Sci. U. S. A. 1991;88:6092–6096. doi: 10.1073/pnas.88.14.6092. [DOI] [PMC free article] [PubMed] [Google Scholar]
- 49.Grinstein S, Cohen S, Goetz-Smith J, Dixon SJ. Methods Enzymol. 1989;173:782–790. doi: 10.1016/s0076-6879(89)73050-0. [DOI] [PubMed] [Google Scholar]
- 50.Nanda A, Brumell JH, Nordstrom T, Kjeldsen L, Sengelov H, Borregaard N, Rotstein OD, Grinstein S. J. Biol. Chem. 1996;271:15963–15970. doi: 10.1074/jbc.271.27.15963. [DOI] [PubMed] [Google Scholar]
- 51.Bischof G, Cosentini E, Hamilton G, Riegler M, Zacherl J, Teleky B, Feil W, Schiessel R, Machen TE, Wenzl E. Biochim. Biophys. Acta. 1966;1282:131–139. doi: 10.1016/0005-2736(96)00050-8. [DOI] [PubMed] [Google Scholar]
- 52.Edwards DR, Waterhouse P, Holman ML, Denhardt DT. Nucleic Acids Res. 1986;43:8863–8878. doi: 10.1093/nar/14.22.8863. [DOI] [PMC free article] [PubMed] [Google Scholar]
- 53.Smith WL, Marnett LJ. Biochim. Biophys. Acta. 1991;1083:1–17. doi: 10.1016/0005-2760(91)90119-3. [DOI] [PubMed] [Google Scholar]
- 54.Furstenberger G. Cell Biol. Rev. 1990;24:1–90. [PubMed] [Google Scholar]
- 55.Murguia JR, Vries LD, Gomez-Garcia L, Schonthal A, Perona R. J. Cell. Biochem. 1995;57:630–640. doi: 10.1002/jcb.240570407. [DOI] [PubMed] [Google Scholar]
- 56.Fisher SM, Furstenberger G, Marks F, Slaga TJ. Cancer Res. 1987;47:3174–3179. [PubMed] [Google Scholar]
- 57.Tutton J, Barkla D. Br. J. Cancer. 1980;41:47–51. doi: 10.1038/bjc.1980.6. [DOI] [PMC free article] [PubMed] [Google Scholar]
- 58.Goodlad R, Mandir N, Levin S, Allen JL, Wright NA. Gastroenterology. 1991;101:1229–1234. [PubMed] [Google Scholar]
- 59.Santoro M, Philpott G, Jaffe BM. Nature. 1976;263:777–779. doi: 10.1038/263777a0. [DOI] [PubMed] [Google Scholar]
- 60.Craven P, Saito R, Derubertis R. J. Clin. Invest. 1983;72:1365–1375. doi: 10.1172/JCI111093. [DOI] [PMC free article] [PubMed] [Google Scholar]
- 61.DeMello M, Bayer B, Beaven MA. Biochem. Pharmacol. 1980;29:311–318. doi: 10.1016/0006-2952(80)90506-7. [DOI] [PubMed] [Google Scholar]
- 62.Marshall CJ. Cell. 1995;80:179–185. doi: 10.1016/0092-8674(95)90401-8. [DOI] [PubMed] [Google Scholar]
- 63.Hill CS, Treisman R. Cell. 1995;80:199–211. doi: 10.1016/0092-8674(95)90403-4. [DOI] [PubMed] [Google Scholar]
- 64.Hunter T. Cell. 1995;80:225–236. doi: 10.1016/0092-8674(95)90405-0. [DOI] [PubMed] [Google Scholar]
- 65.Bernstein LR, Ferris DK, Colburn NH, Sobel ME. J. Biol. Chem. 1993;269:9401–9404. [PubMed] [Google Scholar]
- 66.Kyriakis JM, Banerjee P, Nikolakaki E, Dai T, Rubie EA, Ahmad MF, Avrunch J, Woodgett JR. Nature. 1994;369:156–160. doi: 10.1038/369156a0. [DOI] [PubMed] [Google Scholar]
- 67.Piper PW, Cheng LL. Microbiology. 1994;140:1085–1096. doi: 10.1099/13500872-140-5-1085. [DOI] [PubMed] [Google Scholar]
- 68.Perona R, Serrano R. Nature. 1988;334:438–440. doi: 10.1038/334438a0. [DOI] [PubMed] [Google Scholar]
- 69.Gilles RJ, Martinez-Zaguilan R, Martinez GM, Serrano R, Perona R. Proc. Natl. Acad. Sci. U. S. A. 1990;87:7414–7418. doi: 10.1073/pnas.87.19.7414. [DOI] [PMC free article] [PubMed] [Google Scholar]
- 70.Brooks PM, Day RO. N. Engl. J. Med. 1991;324:1716–1725. doi: 10.1056/NEJM199106133242407. [DOI] [PubMed] [Google Scholar]
- 71.Clive DM, Stoff JS. N. Engl. J. Med. 1984;310:563–572. doi: 10.1056/NEJM198403013100905. [DOI] [PubMed] [Google Scholar]
- 72.Whelton A, Stout RL, Spilman PS, Klassen DK. Ann. Intern. Med. 1990;112:568–576. doi: 10.7326/0003-4819-112-8-568. [DOI] [PubMed] [Google Scholar]
- 73.Muller-Decker K, Scholz K, Marks F, Furstenberger G. Mol. Carcinogen. 1995;12:31–41. doi: 10.1002/mc.2940120106. [DOI] [PubMed] [Google Scholar]
- 74.Masferrer JL, Zweifel BS, Manning PT, Hauser SD, Leahy KM, Smith WG, Isakson PC, Seibert K. Proc. Natl. Acad. Sci. U. S. A. 1994;91:3228–3232. doi: 10.1073/pnas.91.8.3228. [DOI] [PMC free article] [PubMed] [Google Scholar]
- 75.Futaki N, Takahashi S, Yokoyama M, Arai I, Higuchi S, Otomo S. Prostaglandins. 1994;47:55–59. doi: 10.1016/0090-6980(94)90074-4. [DOI] [PubMed] [Google Scholar]


