

Abstract
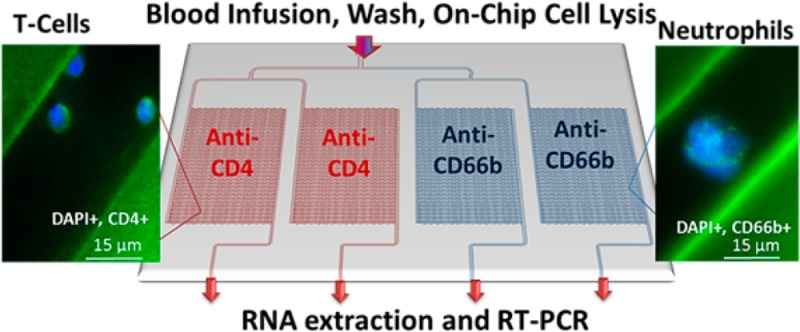
We report the design and performance of a polymer microfluidic device that can affinity select multiple types of biological cells simultaneously with sufficient recovery and purity to allow for the expression profiling of mRNA isolated from these cells. The microfluidic device consisted of four independent selection beds with curvilinear channels that were 25 μm wide and 80 μm deep and were modified with antibodies targeting antigens specifically expressed by two different cell types. Bifurcated and Z-configured device geometries were evaluated for cell selection. As an example of the performance of these devices, CD4+ T-cells and neutrophils were selected from whole blood as these cells are known to express genes found in stroke-related expression profiles that can be used for the diagnosis of this disease. CD4+ T-cells and neutrophils were simultaneously isolated with purities >90% using affinity-based capture in cyclic olefin copolymer (COC) devices with a processing time of ∼3 min. In addition, sufficient quantities of the cells could be recovered from a 50 μL whole blood input to allow for reverse transcription-polymerase chain reaction (RT-PCR) following cell lysis. The expression of genes from isolated T-cells and neutrophils, such as S100A9, TCRB, and FPR1, was evaluated using RT-PCR. The modification and isolation procedures demonstrated here can also be used to analyze other cell types as well where multiple subsets must be interrogated.
Isolation of pure leukocyte subsets and their molecular analysis from whole blood is challenged by the presence of numerous interfering cells.1 The use of conventional isolation methods such as density gradient centrifugation, sedimentation, and fluorescence assisted cell sorting (FACS) is typically time-consuming, requires large volumes of blood, and employs sophisticated equipment. Microfluidics, however, are extremely attractive for blood analysis because of the potentially short assay turnaround times and the ability to design devices for point-of-care applications.2,3
The use of microfluidics to isolate certain types of leukocytes has attracted wide interest. For example, Cheng et al. reported a two-stage microfluidic for the isolation of CD4+ T-cells; a purity of ∼90% was achieved.4−6 Lee and co-workers constructed a functionalized silicon and quartz nanowire array to separate CD4+ T-cells from mouse splenocytes.7,8 Thorslund et al. fabricated a glass/PDMS/anti-CD4 microfluidic chip containing different architectural features for CD4+ T-cell isolation.9 Warner et al. reported a microfluidic neutrophil-capture device followed by gene expression analysis to observe changes after trauma injury.10 They obtained purities of 95% by processing 150 μL of whole blood through the chip that isolated ∼25,000 cells and yielded 69 ng of RNA. Common to these elegant examples was that only a single cell type was isolated from the sample.
Stroke is the third leading cause of disability and death in the United States.11 There are two types of stroke: (i) ischemic stroke, caused by vessel occlusion, occurs at a frequency of 80–85% and (ii) hemorrhagic stroke, resulting from vessel rupture, is identified in 15–20% of all stroke-related cases. Unfortunately, these two conditions cannot be differentiated using existing clinical tests, which typically employ computed tomography (CT) or magnetic resonance imaging (MRI). Additionally, a third of all patients presenting stroke-like symptoms actually suffer from nonvascular disease.12 It is imperative that stroke diagnosis be made quickly and accurately because treatments for ischemic and hemorrhagic stroke differ and there is a short time window (∼4.5 h) for effective treatment.13−17
Because head-related trauma or stroke tissue is not easily acquired and researchers have looked for markers in the peripheral blood due to its accessibility,18−20 there have been ongoing efforts to find reliable blood-based stroke biomarkers that afford high clinical sensitivity and specificity.21 Several potential biomarker candidates that can be measured in serum or plasma have been identified with their role in the underlying pathophysiology.22
Reports have shown that T-lymphocyte mediated anti-inflammatory responses in ischemic brain injury23−26 and the expression of nearly 5,700 genes related to T-cell function change in cases of head trauma.27 mRNA can be harvested from specific types of blood cells and used as biomarkers that reflect the systemic changes in stroke.28 Transcripts of promise for detecting and differentiating between ischemic and hemorrhagic stroke include S100A9 and IL1R2.29−32 Gene expression studies conducted by Adamski et al. identified differential expression across different leukocyte subsets, such as CD4+ T-cells and neutrophils.33 These cells are known to express genes found in stroke-related expression profiles.34 Therefore, the ability to rapidly isolate these leukocyte subsets and secure their mRNA expression profile without interference from other leukocyte subsets could provide a viable test for diagnosing various types of stroke.35−38 Isolation of pure fractions of these subsets is critical to provide unbiased expression data.
In this manuscript, we report a microfluidic device that can simultaneously isolate different types of cells using affinity agents. As an example, we show the positive selection of CD4+ T-cells and CD66b+ neutrophils from minute amounts of unprocessed blood. Total RNA (TRNA) was extracted from the isolated cells and reverse transcribed to monitor mRNA expression changes from the isolated cells. The selected subsets were used to expression profile certain genes that possess diagnostic value for stroke. The figures-of-merit for two device geometries were evaluated as well as the applicability of two different polymers, poly(methyl methacrylate), PMMA, and cyclic olefin copolymer, COC, for optimizing antibody load and cell recovery. We also introduce a chemical-based polymer surface activation method that utilized sodium hydroxide and isopropanol, which provided efficient and simple polymer surface activation resulting in high antibody loads to improve recovery.
Experimental Section
Materials and Reagents
PMMA (cover plates and substrates), 6013S-04 COC cover plates, and 5013L-10 COC substrates were purchased from Plaskolite (Columbus, OH) and TOPAS Advanced Polymers (Florence, KY). Reagent-grade isopropyl alcohol (IPA), 1-ethyl-3-[3-dimethylaminopropyl] carbodimide hydrochloride (EDC), N-hydroxysuccinimide (NHS), 2-(4-morpholino)-ethane sulfonic acid (MES), bovine serum albumin (BSA), Triton X-100, and paraformaldehyde (PFA) were obtained from Sigma-Aldrich (St. Louis, MO). Phosphate buffered saline (PBS, pH = 7.4) was purchased from Life Technologies (Grand Island, NY). Sodium dodecyl sulfate (SDS), Micro-90, sodium hydroxide (NaOH), and histological and laboratory grade IPA were received from Fisher Scientific (Houston, TX), and toluidine blue O (TBO) was from Carolina Biological Supply (Burlington, NC). Cy3-labeled oligonucleotides (5′NH2-C6-TTT-TTT-TTT-TTC-CGA-CAC-TTA-CGT-TTT-TTT-T-Cy3-3′) were purchased from Integrated DNA Technology (Coralville, IA). Low endotoxin antihuman CD4 antibodies (clone RPA-T4), FITC-conjugated antihuman CD20 antibodies (clone AT80), and PE-conjugated antihuman CD14 antibodies (clone TÜK4) were purchased from AbD Serotec (Raleigh, NC). FITC-conjugated anti-CD66b (clone CLB-B13.9) antibody was obtained from Abcam (Cambridge, MA). Antihuman CD66b antibodies (clone- G10F5) and 4′,6-diamidino-2-phenylindole (DAPI) were obtained from BD Biosciences (San Jose, CA).
Microfluidic Device Fabrication and Assembly
Information on device fabrication can be found in the Supporting Information. The architectures for the 2 devices evaluated herein differed in terms of addressing the selection beds (4 per device), employing either a bifurcation network or Z-configuration (Figures 1A,B,D,E and S1, Supporting Information). In the Z-configuration device (Figure S1B, Supporting Information), each cell isolation unit consisted of 64 curvilinear channels that were 9,000 × 25 × 80 μm (l × w × h) with a center-to-center spacing of 200 μm. Two 150 μm wide inlet and outlet channels poised orthogonally to the isolation channels addressed the selection bed. The surface area of a single bed including inlet and outlet channel was 132.3 mm2 (1.9 mm2, 1.15 μL per channel).
Figure 1.

(A, D) Photograph of the four isolation beds filled with red dye in Z and bifurcated designs. (B, E) SEMs of the isolation beds for both the bifurcated and Z devices. (C, F) Computational simulations showing the shear stresses in the inlet of the Z-configuration device and in the parallel channels of the bifurcated device. (G) T-cells isolated from blood from the left in the 3, 2, 1, and 0 bifurcation levels of the bifurcated device. All curvilinear channel dimensions are 25 × 80 μm (w × h), and the SEM scale bars are 1 mm for all micrographs.
The bifurcated device contained isolation beds with 16 curvilinear channels that were 11,000 × 25 × 80 μm (l × w × h) with a center-to-center spacing of 330 μm between channels (Figure S1A, Supporting Information). Each isolation bed’s surface area was 36.8 mm2 (2.3 mm2/channel) with a volume of 352 nL. Addressing each bed required four bifurcations with an additional two bifurcations for the four independent isolation units. All four isolation beds shared a common inlet port with different outlet ports for each cell isolation unit (Figure 1D,E). The total surface area, including the bifurcation network, was 43.4 mm2.
Chemical Surface Modification
Assembled devices were filled with a mixture of 5:1 (v/v) 2 M NaOH/100% IPA using input/output tubing sealed to the chip. Once filled, the chips were incubated with the activating solution in a hybridization oven (Boekel Scientific) for 12 h at 65 °C for COC and 30 min at room temperature for PMMA unless otherwise noted. Chips were rinsed with 1 mL of nanopure water.
Antibody (Ab) Immobilization to Activated Polymer Surfaces
Ab immobilization was a two-step process. In the first step, 50 mg/mL EDC and 5 mg/mL NHS in 100 mM MES (pH = 4.8) was introduced into the device and incubated for 15 min at room temperature followed by flushing with PBS. Then, a 15 μL aliquot of 0.5 mg/mL mouse antihuman CD4 or antihuman CD66b monoclonal antibody (mAb) was introduced into the device and incubated overnight at 4 °C. The selection bed was then rinsed with 1 mL of PBS (pH = 7.4).
Cell Isolation from Whole Blood and Staining
Whole blood samples were obtained from anonymous healthy donors at the UNC Blood Bank in accordance with UNC Institutional Review Board (IRB) procedures. Peripheral blood samples were collected by venipuncture in Vacutainer tubes containing EDTA (7.5% in 0.06 mL; Tyco Health Care). Samples were processed within 4 h following collection. Processing steps for the blood samples using the microfluidic device are described in the Supporting Information.
Flow Cytometric (FC) Analysis of Selected MOLT-3 Cells
MOLT-3 cells (human acute lymphoblastic leukemia) were cultured as a suspension in 25 cm2 culture flasks (Cell Treat Scientific, Shirley, MA) containing RPMI 1640 Medium (Life Technologies, Grand Island, NY) supplemented with 10% FBS (Life Technologies, Grand Island, NY). FC was performed using a Beckman-Coulter CyAn instrument equipped with a 25 mW, 488 nm Coherent sapphire (blue) laser. Detailed protocols for the FC analysis are presented in the Supporting Information.
Evaluation of Carboxylic Acid Surface Densities
Cy3-modified oligonucleotides containing a 5′ pendant amino group served as fluorescent reporters by covalently labeling surface confined carboxylic acids. Carboxylic acid surface densities were also quantified by a colorimetric assay using TBO. Changes in surface hydrophobicity were measured via water contact angle measurements. Experimental details for these assays are described in the Supporting Information.
Fluorescence Microscopy
Cell characterization was performed by acquiring images on an Olympus IX71-DSU Spinning Disk Confocal inverted microscope with DAPI, FITC, and Texas Red filter sets, a mercury burner arc lamp, and high sensitivity Hamamatsu EMCCD and high resolution Hamamatsu ORCA-03G CCD cameras. Metamorph software was used for analyzing and processing images. Exposure times for DAPI, FITC, and Texas Red were 10, 300, and 500 ms, respectively.
Reverse Transcription (RT) and Polymerase Chain Reaction (PCR)
CD4+ T-cells and neutrophils isolated on-chip were lysed by infusing ∼20 μL of lysis solution (GenElute Mammalian Total RNA Miniprep Kit, Sigma, St. Louis, MO) through the cell selection bed. The effluent was collected into a microfuge tube and purified using a total RNA miniprep kit (Sigma) according to the manufacturer’s protocol with DNase treatment (On-Column DNase I, Sigma, St. Louis, MO). After purification of TRNA, reverse transcription (RT) was accomplished using a ProtoScript II First Strand cDNA Synthesis Kit (New England BioLabs, Ipswich, MA). Samples were prepared by mixing 10 μL of reaction mix, 2 μL of poly-T primer, 2 μL of enzyme (no enzyme, 2 μL of water for RT), and 6 μL of TRNA. The samples were then incubated at 42 °C for 1 h and heated to 80 °C for 5 min to deactivate the RT enzyme. See Supporting Information for experimental details on PCR.
Statistical Analysis and Computational Methods
Data were analyzed using a student’s two-tailed t test (ANOVA). Statistical significance was assigned where p < 0.0500. Shear stress and flow uniformity through the bifurcated device was evaluated using COMSOL Multiphysics 4.3b.39 Flow distribution analysis in the Z-configuration device employed a custom numerical algorithm detailed elsewhere.40
Results and Discussion
Polymer Surface Activation for Ab Attachment
Stable attachment of mAbs to the surfaces of the selection bed, which were made from a polymer, is critical for efficient recovery and purity of the target cells. mAb surface density and uniformity throughout the selection channel is dependent on the activation protocol employed in cases where the mAb concentration exceeds the surface functional group number (see Figure S2, Supporting Information). We have reported that activating microchannel surfaces via UV/ozone irradiation causes two effects: (i) optical absorption by the bulk polymer with transmission decreasing with higher dose levels, which can cause functional group surface densities to become increasingly nonuniform as the aspect ratio of the channel is increased and (ii) fragmentation of the polymer during irradiation reducing functional group surface density, especially during thermal fusion bonding. UV and thermally treated COC devices were less susceptible to these artifacts compared to PMMA.39
We sought to avoid these effects by filling assembled devices with an activating chemical solution. Therefore, we investigated the use of a chemical modification protocol following thermal assembly of the device. Microchannels were chemically activated via incubation in 5:1 (v/v) 2 M NaOH/IPA solution. In the case of PMMA, NaOH is known to hydrolyze PMMA’s ester groups and we hypothesized that IPA encouraged interaction with the hydrophobic polymer (water contact angle of PMMA = 76.4 ± 1.4°, see Supporting Information) and/or solvation of methoxide byproducts.41,42 Incubation of PMMA with higher IPA/NaOH concentrations caused irreversible channel deformation due to solvent swelling (Figure S3C,D, Supporting Information).
Chemical activation of PMMA did not change the water contact angle or carboxylic acid surface density as determined by a TBO assay (see Supporting Information) relative to the pristine surface; this was likely due to poor sensitivity of the TBO assay in comparison to fluorescence assays using Cy3-labeled oligonucleotides containing a pendant amino group that served as a fluorescent reporter of surface-confined carboxylic acids. Chemically activated PMMA microchannels derivatized with Cy3-labeled oligonucleotides showed 232 ± 47 cps compared to 503 ± 72 cps for UV-activated and thermally treated PMMA microchannels (Figure S3A,E, Supporting Information).
COC microchannels were subjected to a similar treatment (5:1 (v/v) 2 M NaOH/IPA, see Supporting Information). Chemical activation decreased COC’s water contact angle from 95.5 ± 1.8° (pristine) to 63.3 ± 3.2° and increased the carboxyl surface density to 0.6 ± 0.2 nmol/cm2 as determined by the TBO assay, which approached a theoretical monolayer (0.83 nmol/cm2). Carboxyl formation was also evident by fluorescence analysis using Cy3-labeled oligonucleotide probes, where the surface fluorescence intensity (4369 ± 437 cps) for chemical modification was significantly greater than that observed for the UV activated and thermally treated COC microchannels (2357 ± 218 cps, see Figure S3B, Supporting Information). The mechanism for carboxyl formation for COC using these chemical conditions is currently unknown; literature precedence necessitates a radical-forming catalyst, such as Cu, Fe, or other heavy metals to convert alkanes, such as those found in COC, directly to carboxylic acid groups.43 We suspect that additives incorporated into the COC polymer during manufacturing assist in forming the surface carboxylic acids. On the basis of covalent labeling of surface-confined carboxylic acids, chemical treatment of COC resulted in the highest production of these surface functional groups.
Microfluidic Architectures and Performance Evaluation
Two microfluidic devices were fabricated both of which contained four separate isolation beds to facilitate the simultaneous positive selection of multiple types of cells. We chose to target T-cells using anti-CD4 and neutrophils using anti-CD66b mAbs. In all cases, the concentration of mAb used to optimize recovery was 0.5 mg/mL (see Figure S2, Supporting Information). To facilitate simultaneous isolation of T-cells within two beds and neutrophils in the remaining two beds from a blood sample (Figure 1A,D), the beds were modified by introducing the EDC/NHS solution through the common inlet followed by mAb infusion through the individual isolation bed outlets so that beds could be functionalized with different mAbs. This design also enabled the lysis of each subset contained within a bed for downstream analysis, such as mRNA expression, by infusing a lysis solution through the common inlet and lysate collection from the four separate outlets.
The two microfluidic devices differed in how the parallel channels were addressed. In the first device (Figure 1D), a bifurcation network was utilized to address 16 channels, thereby requiring four bifurcations per isolation unit. The second device (Figure 1A) employed a Z-configuration, where inlet and outlet channels were poised orthogonal to the cell selection channels (64 per device).39,40 Due to the larger number of channels within the Z-configuration, this device had a higher throughput; 50 μL of blood could be processed in 3 min maintaining a 2 mm/s linear velocity to optimize recovery44 compared to 13 min for the bifurcated design. Using a previously reported and experimentally validated numerical algorithm,40 we calculated the flow distribution through the Z-configuration and found that the linear velocity ranged between 1.7 and 2.5 mm/s for each isolation bed in the parallel arrangement (Figure S4B, Supporting Information). For the bifurcated device (Figures S4A and S5, Supporting Information), the fluid velocity within each isolation bed was uniform. The variability in the flow velocity seen within each isolation bed of the Z-configuration can result in variable cell recoveries.
To evaluate the performance of the two microfluidic designs and surface activation chemistry, T-cells and neutrophils were isolated from blood and their recoveries determined. All cell counts and purities are summarized in Table S1, Supporting Information, and a box plot is shown in Figure 2A. In this discussion, we differentiate the UV and chemical activation modalities by UV- and CH-, respectively. For COC chips and the bifurcated or Z-configuration, these were designated as UV-COCbif and UV-COCZ, respectively, when UV activated and CH-COCbif and CH-COCZ when chemically activated.
Figure 2.

(A) Box plot comparing CD4+ T-cell recoveries from 50 μL of healthy human blood in UV and chemically modified PMMA and COC devices utilizing either bifurcated or Z-configuration. (∗) indicates a statistically significant difference (student’s two tailed t test p < 0.0500), while (∗∗) implies no statistically different results. Solid lines in the boxes represent the median; the dotted line represents the mean; the upper and lower edges of the boxes indicate third and first quartiles, respectively; and error bars show maximum and minimum values. (B) Distribution of T-cells and neutrophils in Z-configuration parallel channels, which have varying linear velocities. (C) Scatter plot of the data in (B) showing negative correlation between the percentage of cells isolated in a parallel channel with the linear velocity in that channel.
Initial testing of the bifurcated design indicated that, with either activation protocol, COC outperformed PMMA devices. UV-COCbif isolated 798 ± 167 CD4+ T-cells cells compared to 325 ± 85 cells for UV-PMMAbif from a 50 μL blood sample input (Table S1, Supporting Information). These agree with our previous results, which indicated efficient and uniform activation in COC microchannels providing a higher mAb load and, thus, higher recoveries for circulating tumor cells.39 CH-PMMAbif devices demonstrated poor performance (7 ± 3 cells), which reflected the inability to chemically activate PMMA without degrading microstructures (see Figure S3, Supporting Information). Results for CH-COCbif devices (702 ± 386 cells) showed no statistical difference (p = 0.631) to UV-COCbif devices (798 ± 167) (Figure 2A). Chemical was as efficient as UV activation for the bifurcated COC devices. Both UV-COC devices produced nearly equally recovered T-cells for the common input volume employed (50 μL): 798 ± 167 and 596 ± 154 using UV-COCbif and UV-COCZ devices, respectively. Considering nearly the same cell recovery and higher throughput, Z-configuration devices were used for the remainder of these studies. While the bifurcation design could be configured with a larger number of channels to increase throughput, it comes at the expense of device footprint; the 64-channel Z-configuration occupied an area of 35 × 45 mm2 (4 selection beds) while the same number of channels for 4 selection beds using the bifurcation configuration would have required an area of 128 × 160 mm2.
We observed higher cell recovery using CH-COCZ devices; absolute cell counts increased from 596 ± 25 for UV-COCZ to 2565 ± 1194 for the CH-COCZ devices for T-cell isolation. In the case of neutrophils, 1096 ± 537 cells were selected for the UV-COCZ device compared to 2949 ± 901 for the CH-COCZ device. However, we did not observe differences between the activation modalities for bifurcated COC devices, which can be explained by shear stress considerations.45 In bifurcated devices, ∼40% of cells was isolated in the bifurcation regions (Figure 1G), whereas only 4% was observed in the inlet and outlet addressing channels of the Z-configuration. Inspection of the bifurcation network showed that fluidic shear stress was reduced from 11 dyn/cm2 in the parallel channels to 6–7 dyn/cm2 through the bifurcation network, where ∼17.7% of the device’s surface area accounted for ∼40% of cell isolation. Conversely, shear stress through the Z-configuration inlet and outlet channels ranged between 1 and 38 dyn/cm2 along the channel’s length and was <11 dyn/cm2 through the selection channels.
For the Z-configuration, recovery occurred predominantly in the cell isolation channels, where optical absorption of the activating UV radiation may lead to reduced mAb loads; activating polymer surfaces using chemical modification is not sensitive to device aspect ratio. These effects may be precluded in bifurcated devices due to cell isolation in the low aspect ratio bifurcation regions (Figure 1F).
Recovery of Different Leukocyte Subsets
We observed higher recoveries for CD4 T-cells (10.3 ± 0.5%) compared to CD66b neutrophils (1.5 ± 0.1%) in the CH-COCZ devices, assuming relative abundances of 25,000 and 200,000 cells/50 μL of blood for T-cells and neutrophils, respectively.46 This difference in recovery may be related to the number of mAb molecules immobilized to the surface. With the size of anti-CD4 and anti-CD66b being 150 kDa IgG1 and 900 kDa IgM, respectively, they will form monolayers where IgM is ∼36× less abundant than a monolayer of IgG, possibly leading to lower neutrophil recovery.39,47
Flow cytometric analysis was performed on T-cells and neutrophils isolated from a buffy coat (as described in the Supporting Information). For T-cells, CD4-FITC fluorescence intensity was 5.3× greater than the IgG isotype control, and for neutrophils, CD66b-FITC showed 4.6× greater intensity compared to its IgM control. However, due to the surface area of neutrophils (∼707 μm2) compared to smaller T-cells (113 μm2), antigen density (C∞) of CD4 on T-cells is roughly 7× denser than CD66b on neutrophils. Consequently, the rate of adhesion (kad) of T-cells to surface mAbs is ∼7× greater than for neutrophils as stipulated by Chang and Hammer47
| 1 |
where (kf) is the effective antibody–antigen binding rate and (Nr) is the antibody number. Thus, the ∼10-fold lower recovery observed for neutrophils could be attributed to lower surface density of the IgM anti-CD66b selection antibody and/or reduced surface density of CD66b antigens on the neutrophils. We also evaluated recovery of the MOLT-3 cell line, which demonstrated a similar T-cell size but lower expression of CD4 (Figure S6, Supporting Information). The recovery of MOLT-3 cells was 0.5 ± 0.1% in the CH-COCZ (see detailed discussion in Supporting Information).
We inspected the distribution of isolated cells throughout the parallel channels of the Z-configuration device to relate cell counts to linear velocity (Figure 2B). To discern the effects of varying linear velocity on recovery, we normalized the recovered cell counts to the total cell counts and plotted these results as a function of linear velocity (Figure 2C). A negative correlation between linear velocity and cell recovery was observed for both T-cells (Pearson’s correlation, r = −0.65; R2 = 0.42) and neutrophils (r = −0.72; R2 = 0.52). The magnitude of the slope suggested that neutrophils (m = −10.03 cells/mm/s) are more sensitive to linear velocity and fluidic shear stress than T-cells (m = −5.17 cells/mm/s) due to the effects of lower CD66b antigen surface density.
Purity of Isolated Leukocytes
When designing systems for mRNA expression analysis of cell subsets isolated from blood, it is critical to isolate pure fractions of the targets. For T-cell isolation via CD4 positive selection, this is challenged by the fact that CD4 is also expressed on the surface of monocytes, macrophages, and dendritic cells at a frequency of 3–8% of the total leukocyte population, but CD4 expression is lower compared to T-cells (46,000–202,000 molecules/cell); thus, their kad is lower as noted by eq 1.4,48−50 This means that fluidic shear stress can be used to potentially remove these low CD4 expressing cells due to low kad values.
Purity of isolated CD4+ T-lymphocytes was assessed by immunostaining with CD66b, CD14, and CD20 Abs to identify neutrophils (comprising 40–66% of total leukocyte population), monocytes (4–8%), and B-cells (8–12%), respectively.3 Purity was defined as the ratio of DAPI+, CD14-, CD66b-, and CD20-cells to the total number of nucleated cells. Fluorescence images (Figure 3A–C) showed the absence of cells labeled with CD14/66b/20 antibodies. Isolated cells showed intact structures without an obvious change in morphology. It was also observed that T-cells and neutrophils were distributed randomly within the channel (outer and inner curvatures of the curvilinear channels, Figure 1G) unlike circulating tumor cells, which we have reported to be predominantly isolated along the inner curvature.44 To confirm proper identification of T-cells, an anti-CD3 marker was chosen because 87% of T-cells are CD3+ and CD4+ (Figure 3D–F).51 For the UV-COCbif devices, purities were 97 ± 1%, and CH-COCbif purities were 92 ± 5%, while the purity for the CH-COCZ for the CD4+ T-cells was found to be 98 ± 1% (Table S1, Supporting Information, and Figure 2A). The lack of contaminating cells most likely resulted from their low CD4 expression and the application of a shear stress between 6 and 11 dyn/cm2.48,50,52,53
Figure 3.
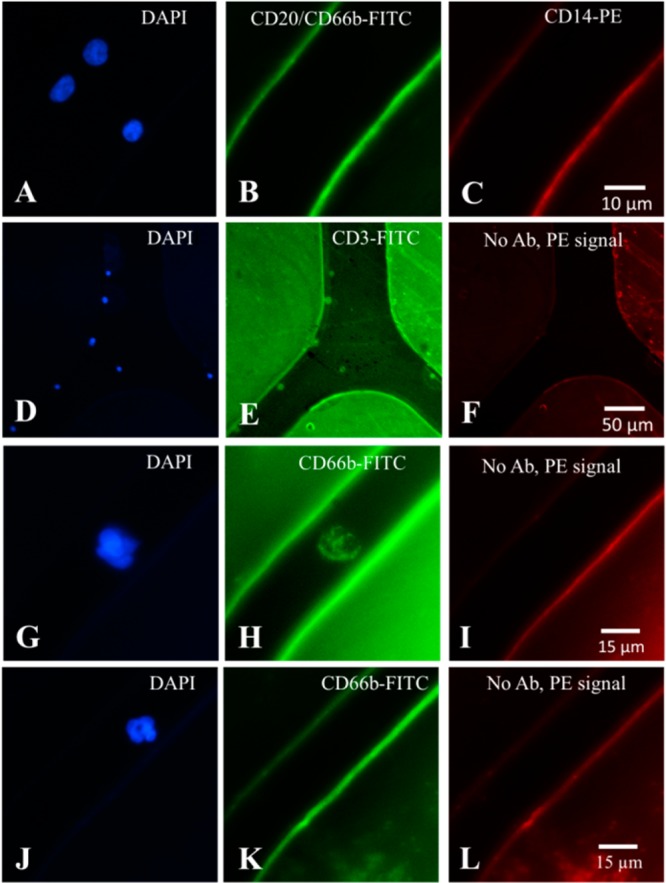
(A–F) Fluorescence microscopy images of CD4+ T-cells isolated from whole blood using a bifurcated microfluidic device immobilized with anti-CD4 Ab and stained with (A, D) DAPI (nuclear stain); (B) CD20- and CD66b-FITC specific for B-lymphocytes and neutrophils, respectively; (C) CD14-PE specific for monocytes; (E) CD3-FITC specific for T-cells; and (F) no Ab used. Purity of CD4+ T cells was defined as positive for DAPI and negative for PE and FITC stains in (A–C), while specificity was demonstrated by dual staining of cells with CD3-FITC and DAPI (D–F). Fluorescence microscopic images of isolated neutrophils: (G) DAPI stained; (H) CD66b-FITC stained; (I) no Ab used; and (J–L) a neutrophil that was (J) DAPI stained with neutrophil morphology, (K) showed lack of CD66b-FITC signal, and (L) no Ab used. Neutrophils were identified only if positive for both DAPI and CD66b.
Lastly, we assessed neutrophil purity by counting double positive DAPI and CD66b-FITC cells (Figure 3G–I). We observed that some cells were DAPI+ and faint for CD66b-FITC, but the dimensions and morphology of these cells were consistent with neutrophils (Figure 3J–L).54 Neutrophil counts isolated from 50 μL of blood using the UV-COCbif devices averaged 918 ± 91 with a purity of 94 ± 3% and CH-COCZ yielded purities of 97 ± 2% (see Table S1, Supporting Information, for the raw data and Figure 2A for a box plot).
Reverse Transcription-Polymerase Chain Reaction (RT-PCR)
The total number of isolated cells in the CH-COCZ devices ranged from 500 to 3,500 CD4+ T-cells and CD66b+ neutrophils. Considering an average of 10 pg of TRNA per leukocyte, we expected to obtain 5–35 ng TRNA (0.25 – 1.7 ng of mRNA) per bed, which should provide sufficient material for cDNA synthesis and gene expression analysis. To make sure that sufficient mRNA was harvested from the T-cells and neutrophils for the expression analysis, two beds were used for each cell type. T-cells and neutrophils were isolated from the same blood sample using the CH-COCZ chip, and because of the high purity of isolated fractions, cell lysis was performed directly within each cell isolation bed. Following lysis and TRNA extraction, an RT reaction was performed. cDNA was then used for PCR with expression analysis of 4 genes; S100A9, which has been shown to be overexpressed following stroke38 and plays a prominent role in the regulation of inflammatory processes and immune response;55−57TCRB and FPR1 genes, which are expressed at various levels in T-cells and neutrophils;58−60 and GAPDH, a housekeeping gene used as a reference. Figure 4A shows a fluorescence image of the amplicons following gel electrophoresis. Although the expression of GAPDH can vary between different types of cells,61 for these initial results, we normalized the amplicon intensities to the intensity of the GAPDH product.
Figure 4.

(A) Gel electrophoresis image of amplicons generated from mRNA isolated from neutrophils. Negative control (−) and positive (+) amplification reactions for tested genes were performed with products from negative (−) RT (without RT enzyme) and positive (+) RT. Amplicon lengths are shown in the gel image. Separation was performed at 4.8 V/cm in a TBE buffer. (B) Normalized to GAPDH gene signals (n = 3) from the amplicons identified on an agarose gel stained with ethidium bromide for T-cells and neutrophils.
As shown in Figure 4B for the T-cell population, we observed significantly lower expression of S100A9 compared to the neutrophil subset for this blood donor. T-cells showed a higher expression of the TCRB gene compared to neutrophils; however, some studies have demonstrated neutrophils that express TCRB mRNA.62FPR1 gene was expressed to a higher level in neutrophils compared to T-cells, similar to that reported in the literature.63 In the case of mRNA expression profiling, if the purity of cell populations were not high, then the expression differences we noted in Figure 4B would not be evident. For example, the differences in S100A9 expression between neutrophils and T-cells would not have been observed if either fraction was contaminated with other leukocyte types.
Conclusions
We have demonstrated an affinity-based microfluidic system capable of isolating highly pure subsets of leukocytes from whole blood. Processing 50 μL of whole blood within ∼3 min provided sufficient genetic material for gene expression profiling. Special emphasis was placed on the fluid dynamics and design architecture of the device for T-cell and neutrophil isolation to obtain high purity leukocytes fractions using a single step. The isolation of two types of cells from whole blood was accomplished with purity >90%.
We assessed the effects of polymer substrate and surface activation modalities on cell recovery and discovered a chemical activation method for COC, which can be useful for ultrahigh aspect ratio microfluidic devices. High aspect ratio microchannels can be used to improve throughput reducing processing time, which may be important for securing time-sensitive diagnosis. For example, an FDA-approved therapeutic treatment (tissue plasminogen activator) must be administered within 3−4 h following onset of a stroke event.
The demonstrated results are not limited only to CD4+ T-cells and CD66b+ neutrophils but can be expanded to analyze other cell types simply by choosing different affinity agents for the cells of interest. Furthermore, our microfluidic device contains four individually addressable beds, permitting simultaneous isolation of four individual cell subpopulations from the same blood sample with sufficient material to perform mRNA expression analysis on the isolated cells and can be scaled to handle more subsets.
Acknowledgments
We thank National Institute of Biomedical Imaging and Bioengineering (EB10087A) for supporting this work. We also acknowledge Tom Neish, supervisor at the Blood Bank, UNC Hospital, for providing the healthy donor blood samples required for the research. We thank Dr. Robert Currin at the UNC-Olympus Imaging Research Center for his help and access to the Olympus IX71-DSU Spinning Disk Confocal inverted microscope and Nancy Fisher and Barry Udis at the UNC flow cytometry core facility.
Supporting Information Available
Additional information as noted in text. This material is available free of charge via the Internet at http://pubs.acs.org.
The authors declare no competing financial interest.
Funding Statement
National Institutes of Health, United States
Supplementary Material
References
- Feezor R. J.; Baker H. V.; Mindrinos M.; Hayden D.; Tannahill C. L.; Brownstein B. H.; Fay A.; MacMillan S.; Laramie J.; Xiao W.; Moldawer L. L.; Cobb J. P.; Laudanski K.; Miller-Graziano C. L.; Maier R. V.; Schoenfeld D.; Davis R. W.; Tompkins R. G. Physiol. Genomics 2004, 19, 247–254. [DOI] [PubMed] [Google Scholar]
- Gao Y.; Li W.; Pappas D. Analyst 2013, 138, 4714–4721. [DOI] [PMC free article] [PubMed] [Google Scholar]
- Toner M.; Irimia D. Annu. Rev. Biomed. Eng. 2005, 7, 77–103(3 plates). [DOI] [PMC free article] [PubMed] [Google Scholar]
- Cheng X.; Irimia D.; Dixon M.; Sekine K.; Demirci U.; Zamir L.; Tompkins R. G.; Rodriguez W.; Toner M. Lab Chip 2007, 7, 170–178. [DOI] [PMC free article] [PubMed] [Google Scholar]
- Cheng X.; Liu Y.-s.; Irimia D.; Demirci U.; Yang L.; Zamir L.; Rodriguez W. R.; Toner M.; Bashir R. Lab Chip 2007, 7, 746–755. [DOI] [PMC free article] [PubMed] [Google Scholar]
- Rodriguez W. R.; Christodoulides N.; Floriano P. N.; Graham S.; Mohanty S.; Dixon M.; Hsiang M.; Peter T.; Zavahir S.; Thior I.; Romanovicz D.; Bernard B.; Goodey A. P.; Walker B. D.; McDevitt J. T. PLoS Med. 2005, 2, 663–672. [DOI] [PMC free article] [PubMed] [Google Scholar]
- Kim S. T.; Kim D.-J.; Kim T.-J.; Seo D.-W.; Kim T.-H.; Lee S.-Y.; Kim K.; Lee K.-M.; Lee S.-K. Nano Lett. 2010, 10, 2877–2883. [DOI] [PubMed] [Google Scholar]
- Kim D.-J.; Seol J.-K.; Wu Y.; Ji S.; Kim G.-S.; Hyung J.-H.; Lee S.-Y.; Lim H.; Fan R.; Lee S.-K. Nanoscale 2012, 4, 2500–2507. [DOI] [PubMed] [Google Scholar]
- Thorslund S.; Larsson R.; Bergquist J.; Nikolajeff F.; Sanchez J. Biomed. Microdevices 2008, 10, 851–857. [DOI] [PubMed] [Google Scholar]
- Warner E. A.; Kotz K. T.; Ungaro R. F.; Abouhamze A. S.; Lopez M. C.; Cuenca A. G.; Kelly-Scumpia K. M.; Moreno C.; O’Malley K. A.; Lanz J. D.; Baker H. V.; Martin L. C.; Toner M.; Tompkins R. G.; Efron P. A.; Moldawer L. L. Lab. Invest. 2011, 91, 1787–1795. [DOI] [PMC free article] [PubMed] [Google Scholar]
- Feigin V. L.; Lawes C. M. M.; Bennett D. A.; Barker-Collo S. L.; Parag V. Lancet Neurol. 2009, 8, 355–369. [DOI] [PubMed] [Google Scholar]
- Hand P. J.; Kwan J.; Lindley R. I.; Dennis M. S.; Wardlaw J. M. Stroke 2006, 37, 769–775. [DOI] [PubMed] [Google Scholar]
- Norris J. W.; Hachinski V. C. Lancet 1982, 1, 328–331. [DOI] [PubMed] [Google Scholar]
- Goldstein L. B.; Simel D. L. JAMA 2005, 293, 2391–2402. [DOI] [PubMed] [Google Scholar]
- Furlan A.; Higashida R.; Wechsler L.; Gent M.; Rowley H.; Kase C.; Pessin M.; Ahuja A.; Callahan F.; Clark W. M.; Silver F.; Rivera F. JAMA 1999, 282, 2003–2011. [DOI] [PubMed] [Google Scholar]
- Hacke W.; Kaste M.; Bluhmki E.; Brozman M.; Dvalos A.; Guidetti D.; Larrue V.; Lees K. R.; Medeghri Z.; Machnig T.; Schneider D.; von Kummer R.; Wahlgren N.; Toni D. N. Engl. J. Med. 2008, 359, 1317–1329. [DOI] [PubMed] [Google Scholar]
- Goldstein L. B. Stroke 2006, 37, 754–755. [DOI] [PubMed] [Google Scholar]
- Whiteley W.; Tseng M.-C.; Sandercock P. Stroke 2008, 39, 2902–2909. [DOI] [PubMed] [Google Scholar]
- Hasan N.; McColgan P.; Bentley P.; Edwards R. J.; Sharma P. Br. J. Clin. Pharmacol. 2012, 74, 230–240. [DOI] [PMC free article] [PubMed] [Google Scholar]
- Jickling G. C.; Sharp F. R. Neurotherapeutics 2011, 8, 349–360. [DOI] [PMC free article] [PubMed] [Google Scholar]
- Saah A. J.; Hoover D. R. Ann. Intern. Med. 1997, 126, 91–94. [DOI] [PubMed] [Google Scholar]
- Maas M. B.; Furie K. L. Biomarkers Med. 2009, 3, 363–383. [DOI] [PMC free article] [PubMed] [Google Scholar]
- Yilmaz G.; Arumugam T. V.; Stokes K. Y.; Granger D. N. Circulation 2006, 113, 2105–2112. [DOI] [PubMed] [Google Scholar]
- Marsh B. J.; Williams-Karnesky R. L.; Stenzel-Poore M. P. Neuroscience 2009, 158, 1007–1020. [DOI] [PMC free article] [PubMed] [Google Scholar]
- Tang S.-C.; Arumugam T. V.; Xu X.; Cheng A.; Mughal M. R.; Jo D. G.; Lathia J. D.; Siler D. A.; Chigurupati S.; Ouyang X.; Magnus T.; Camandola S.; Mattson M. P. Proc. Natl. Acad. Sci. U. S. A. 2007, 104, 13798–13803. [DOI] [PMC free article] [PubMed] [Google Scholar]
- Gee J. M.; Kalil A.; Shea C.; Becker K. J. Stroke 2007, 38, 783–788. [DOI] [PubMed] [Google Scholar]
- Laudanski K.; Miller-Graziano C.; Xiao W.; Mindrinos M. N.; Richards D. R.; De A.; Moldawer L. L.; Maier R. V.; Bankey P.; Baker H. V.; Brownstein B. H.; Cobb J. P.; Calvano S. E.; Davis R. W.; Tompkins R. G. Proc. Natl. Acad. Sci. U. S. A. 2006, 103, 15564–15569. [DOI] [PMC free article] [PubMed] [Google Scholar]
- Baird A. E. Curr. Atheroscler. Rep. 2006, 8, 267–275. [DOI] [PubMed] [Google Scholar]
- Moore D. F.; Goldin R.; Violet W. Ann. Neurol. 2007, 62, S8. [Google Scholar]
- Moore D. F.; Li H.; Jeffries N.; Wright V.; Cooper R. A.; Elkahloun A.; Gelderman M. P.; Zudaire E.; Blevins G.; Yu H.; Goldin E.; Baird A. E. Circulation 2005, 111, 212–221. [DOI] [PubMed] [Google Scholar]
- Oh S.-H.; Kim O.-J.; Shin D.-A.; Song J.; Yoo H.; Kim Y.-K.; Kim J.-K. J. Neuroimmunol. 2012, 249, 60–65. [DOI] [PubMed] [Google Scholar]
- Tang Y.; Xu H.; Du X.; Lit L.; Walker W.; Lu A.; Ran R.; Gregg J. P.; Reilly M.; Pancioli A.; Khoury J. C.; Sauerbeck L. R.; Carrozzella J. A.; Spilker J.; Clark J.; Wagner K. R.; Jauch E. C.; Chang D. J.; Verro P.; Broderick J. P.; Sharp F. R. J. Cereb. Blood Flow Metab. 2006, 26, 1089–1102. [DOI] [PubMed] [Google Scholar]
- Adamski M. G.; Li Y.; Wagner E.; Yu H.; Seales-Bailey C.; Soper S. A.; Murphy M.; Baird A. E. J. Biomol. Screening 2013, 18, 1008–1017. [DOI] [PubMed] [Google Scholar]
- Du X.; Tang Y.; Xu H.; Lit L.; Walker W.; Ashwood P.; Gregg J. P.; Sharp F. R. Genomics 2006, 87, 693–703. [DOI] [PubMed] [Google Scholar]
- Siliciano R. F.; Lawton T.; Knall C.; Karr R. W.; Berman P.; Gregory T.; Reinherz E. L. Cell 1988, 54, 561–575. [DOI] [PubMed] [Google Scholar]
- O’Brien W. A.; Hartigan P. M.; Daar E. S.; Simberkoff M. S.; Hamilton J. D. Ann. Intern. Med. 1997, 126, 939–945. [DOI] [PubMed] [Google Scholar]
- Yarchoan R.; Tosato G.; Little R. F. Nat. Clin. Pract. Oncol. 2005, 2, 406–415. [DOI] [PubMed] [Google Scholar]
- Adamski M. G.; Li Y.; Wagner E.; Yu H.; Seales-Bailey C.; Soper S. A.; Murphy M.; Baird A. E. J. Biomol. Screening 2013, 18, 1008–1017. [DOI] [PubMed] [Google Scholar]
- Jackson J. M.; Witek M. A.; Hupert M. L.; Brady C.; Pullagurla S.; Kamande J.; Aufforth R. D.; Tignanelli C. J.; Torphy R. J.; Yeh J. J.; Soper S. A. Lab Chip 2014, 14, 106–107. [DOI] [PMC free article] [PubMed] [Google Scholar]
- Kamande J. W.; Hupert M. L.; Witek M. A.; Wang H.; Torphy R. J.; Dharmasiri U.; Njoroge S. K.; Jackson J. M.; Aufforth R. D.; Snavely A.; Yeh J. J.; Soper S. A. Anal. Chem. 2013, 85, 9092–9100. [DOI] [PMC free article] [PubMed] [Google Scholar]
- Holmberg K.; Hyden H. Prep. Biochem. 1985, 15, 309–319. [DOI] [PubMed] [Google Scholar]
- Patel S.; Thakar R. G.; Wong J.; McLeod S. D.; Li S. Biomaterials 2006, 27, 2890–2897. [DOI] [PubMed] [Google Scholar]
- Kirillova M. V.; Kirillov A. M.; Kuznetsov M. L.; Silva J. A. L.; da Silva J. J. R. F.; Pombeiro A. J. L. Chem. Commun. 2009, 2353–2355. [DOI] [PubMed] [Google Scholar]
- Adams A. A.; Okagbare P. I.; Feng J.; Hupert M. L.; Patterson D.; Gottert J.; McCarley R. L.; Nikitopoulos D.; Murphy M. C.; Soper S. A. J. Am. Chem. Soc. 2008, 130, 8633–8641. [DOI] [PMC free article] [PubMed] [Google Scholar]
- Murthy S. K.; Sin A.; Tompkins R. G.; Toner M. Langmuir 2004, 20, 11649–11655. [DOI] [PubMed] [Google Scholar]
- Toner M.; Irimia D. Annu. Rev. Biomed. Eng. 2005, 7, 77–103. [DOI] [PMC free article] [PubMed] [Google Scholar]
- Chang K.-C.; Hammer D. A. Biophys. J. 1999, 76, 1280–1292. [DOI] [PMC free article] [PubMed] [Google Scholar]
- Davis K. A.; Abrams B.; Iyer S. B.; Hoffman R. A.; Bishop J. E. Cytometry 1998, 33, 197–205. [DOI] [PubMed] [Google Scholar]
- Denny T. N.; Stein D.; Mui T.; Scolpino A.; Holland B. Cytometry 1996, 26, 265–274. [DOI] [PubMed] [Google Scholar]
- Beck M.; Brockhuis S.; van der Velde N.; Breukers C.; Greve J.; Terstappen L. W. M. M. Lab Chip 2012, 12, 167–173. [DOI] [PubMed] [Google Scholar]
- Egerton M.; Scollay R.; Shortman K. Proc. Natl. Acad. Sci. U. S. A. 1990, 87, 2579–2582. [DOI] [PMC free article] [PubMed] [Google Scholar]
- Hultin L. E.; Matud J. L.; Giorgi J. V. Cytometry 1998, 33, 123–132. [DOI] [PubMed] [Google Scholar]
- Lee B.; Sharron M.; Montaner L. J.; Weissman D.; Doms R. W. Proc. Natl. Acad. Sci. U. S. A. 1999, 96, 5215–5220. [DOI] [PMC free article] [PubMed] [Google Scholar]
- Bainton D. F.; Ullyot J. L.; Farquhar M. G. J. Exp. Med. 1971, 134, 907–934. [DOI] [PMC free article] [PubMed] [Google Scholar]
- Srikrishna G. J. Innate Immun. 2012, 4, 31–40. [DOI] [PMC free article] [PubMed] [Google Scholar]
- Brennan R. M.; Petersen J.; Neller M. A.; Miles J. J.; Burrows J. M.; Smith C.; McCluskey J.; Khanna R.; Rossjohn J.; Burrows S. R. J. Immunol. 2012, 188, 2742–2748. [DOI] [PubMed] [Google Scholar]
- Marrack P.; Rubtsova K.; Scott-Browne J.; Kappler J. W. Curr. Opin. Immunol. 2008, 20, 203–207. [DOI] [PMC free article] [PubMed] [Google Scholar]
- Murphy P. M.; Tiffany H. L.; McDermott D.; Ahuja S. K. Gene 1993, 133, 285–290. [DOI] [PubMed] [Google Scholar]
- Devosse T.; Guillabert A.; D’Haene N.; Berton A.; De Nadai P.; Noel S.; Brait M.; Franssen J.-D.; Sozzani S.; Salmon I.; Parmentier M. J. Immunol. 2009, 182, 4974–4984. [DOI] [PubMed] [Google Scholar]
- Tunnacliffe A.; Kefford R.; Milstein C.; Forster A.; Rabbitts T. H. Proc. Natl. Acad. Sci. U. S. A. 1985, 82, 5068–5072. [DOI] [PMC free article] [PubMed] [Google Scholar]
- Reiter M.; Kirchner B.; Mueller H.; Holzhauer C.; Mann W.; Pfaffl M. W. Nucleic Acids Res. 2011, 39, e124. [DOI] [PMC free article] [PubMed] [Google Scholar]
- Puellmann K.; Kaminski W. E.; Vogel M.; Nebe C. T.; Schroeder J.; Wolf H.; Beham A. W. Chir. Forum Exp. Klin. Forsch. 2007, 247–249. [Google Scholar]
- Whitney A. R.; Diehn M.; Popper S. J.; Alizadeh A. A.; Boldrick J. C.; Relman D. A.; Brown P. O. Proc. Natl. Acad. Sci. U. S. A. 2003, 100, 1896–1901. [DOI] [PMC free article] [PubMed] [Google Scholar]
Associated Data
This section collects any data citations, data availability statements, or supplementary materials included in this article.