Abstract
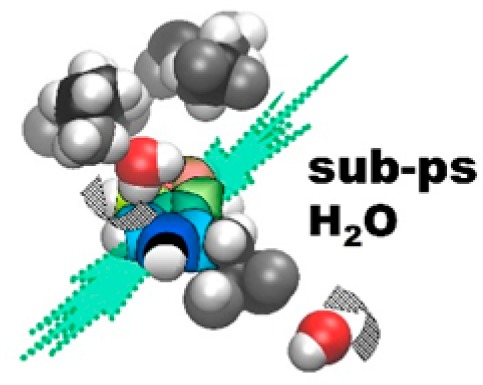
The protein–water interface is a critical determinant of protein structure and function, yet the precise nature of dynamics in this complex system remains elusive. Tryptophan fluorescence has become the probe of choice for such dynamics on the picosecond time scale (especially via fluorescence “upconversion”). In the absence of ultrafast (“quasi-static”) quenching from nearby groups, the TDFSS (time-dependent fluorescence Stokes shift) for exposed Trp directly reports on dipolar relaxation near the interface (both water and polypeptide). The small protein GB1 contains a single Trp (W43) of this type, and its structure is refractory to pH above 3. Thus, it can be used to examine the dependence of dipolar relaxation upon charge reconfiguration with titration. Somewhat surprisingly, the dipolar dynamics in the 100 fs to 100 ps range were unchanged with pH, although nanosecond yield, rates, and access all changed. These results were rationalized with the help of molecular dynamics (including QM-MM) simulations that reveal a balancing, sometimes even countervailing influence of protein and water dipoles. Interestingly, these simulations also showed the dominant influence of water molecules which are associated with the protein interface for up to 30 ps yet free to rotate at approximately “bulk” water rates.
Introduction
Water dynamics and protein dynamics are strongly intertwined, as has been shown both theoretically1 and experimentally.2,3 It is known that the water at the interface with proteins (especially the first hydration “shell”) has different properties from bulk water,1,4 including strained bonds and an overall higher density.5 These considerations suggested that water in the first hydration shell might also have different fast dynamics compared to bulk water. If so, how does this impact biological function? Is the effect local, or is it felt throughout the entire protein? The scaling of interaction with proximity and with time frames important questions regarding water coupling to protein motions.
Although there is agreement that perturbations occur at the protein–water interface and that select water dynamics are slowed down compared to bulk water, the range and the magnitude of perturbation is still a matter of debate. In the literature, various approaches are utilized to gain insight into protein hydration layer dynamics.5−8 Most recently, a confluence of 17O magnetic relaxation dispersion (MRD) along with MD simulation studies and time-dependent Stokes shift (TDFSS) on protein bound probes has fueled conversation in the field.9−15
The ultrafast dynamic Stokes shift of tryptophan (Trp) has been studied in a variety of proteins.3,8,16−19 Trp’s fluorescent oscillator is known to be strongly affected by the microenvironment surrounding the indole ring, making it sensitive to subtle electrostatic changes taking place in its vicinity.20 Bulk water alone can provide a strong TDFSS component with an exponential response below ∼2 ps. The presence of a slower TDFSS term in some proteins (in the range of tens to hundreds of picoseconds) was initially assigned to escape rates for quasi-immobilized interfacial water; that is, water slowed down by strong dipole interactions between the water molecule and the protein.3,21 This theory was challenged by MRD data where the average water dynamics in the hydration layer was measured to be only a few picoseconds.7,22 Different proposals have since branched off: From MD simulations, Halle and Nilsson describe the water as mostly slaved to the protein conformational motions, assigning the protein as the determining factor for the slow dynamics observed;15,23 others infer from MD simulations that both water and protein are responsible for slow dynamics through a protein–water coupling mechanism.24,25 Other differences center on determining the thickness of the solvation water that influences TDFSS: MD simulations carried out by Vivian and Callis26 indicate relevant water interactions may extend to 15 Å, while Golosov and Karplus25 suggest only a much thinner water layer (∼5 Å) is influential.
In the present paper, we further probe water–protein interactions comparing “upconverted” sub-picosecond fluorescence spectral information with 100 ps to a few ns time correlated single photon counting (TCSPC) data to monitor a single Trp (W43) in a model protein, the B1 domain of protein G (also known as GB1).27 This protein is extremely stable, but the ns fluorescence parameters of W43 in folding variants reported a variety of subtle pre-unfolding changes.28 As previously mentioned, water solvation dynamics are pinned to various charged sites on the protein. Whenever the topology of a charge distribution gets modified, proximate solvation should change as well. With that in mind, the rationale for this study was to monitor W43 emission in both ps and ns time domains upon changing the pH from 7.5 to 3.5. Recall that GB1 tertiary structure is “rock” stable in this range;29 thus, titration rearranges charge states without imparting major structural change. Mutagenesis can and has30 been employed to alter charges too, but a limited acidification carries out charge manipulation without risking any sequence-induced structural alteration. Figure 1 produces a schematic view of the residues in proximity to Trp43 that are likely to change their protonation state upon acidification: Glu27 and Glu42 have a pKa of about 4.5, while the C-terminus carboxylate and Glu15 (not shown) also have pKa values near 4.5, but are further away from Trp43. The other seven Glu/Asp have pKa values ranging from 4 down to 2.8.44
Figure 1.
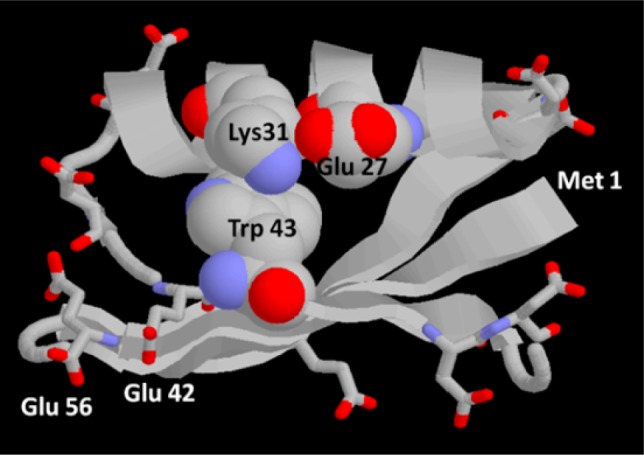
Cartoon of GB1 structure showing key side chains Trp43 and Lys31, as spacefilled and all other Glu and Asp as sticks. Trp43 is directed from the closest β sheet strand into the hydrophobic space beneath the helix, with the near edge of the pyrrole ring solvent exposed. Lys31 and Glu27 on the helix are solvent exposed, form a salt bridge much of the time, and mostly cover the Trp from above, while allowing transient access of water to the top part of the Trp. The bottom face of the Trp lies on the hydrophobic face of the β sheet, completely shielded from water. All Glu and Asp are solvent exposed, but only Glu 27 comes in contact with Trp. The carboxylate of Glu 42 is ∼6 Å from the pyrrole ring of Trp, but all other Asp and Glu are distributed about the protein, 8–20 Å distant.
Prior studies of Trp in proteins established the key importance of charge transfer to nearest neighbors for determining nanosecond decay rates; hence, one should be able to monitor a very local indicator (in ns) side by side with a multiscale dielectric relaxation seen by the same molecule (in ps).31
Results
Steady State Fluorescence
Peak-normalized magic angle emission spectra of W43 at different pH’s were registered using 295 nm as the excitation wavelength, and from each spectrum, the Raman contributions (and other background contributions) from the buffer were subtracted (Figure 2). As shown in Figure S1 (Supporting Information), the fluorescence intensity of residue W43 decreases sharply as the pH is brought to lower values. The center of gravity (λν) for each spectrum was calculated, and the quantity λν was plotted as a function of the pH value (see Figure 3). The emission spectrum clearly blue shifts at lower pH, though this shift is small compared to typical denaturation changes (further, they are usually red shifts with acidity, not blue shifts).
Figure 2.
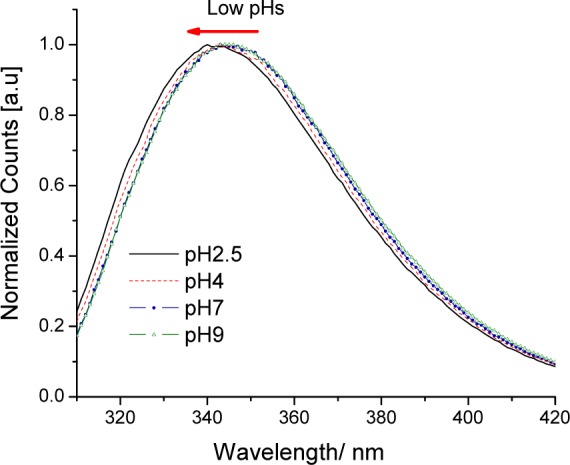
GB1 magic angle emission spectra showing the blue shift at lower pH’s.
Figure 3.
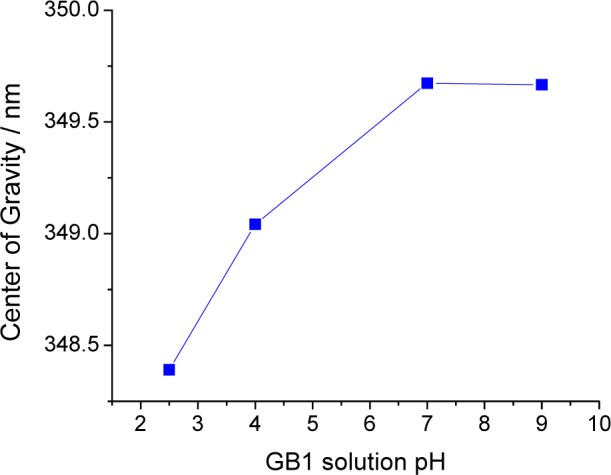
GB1 emission spectra: calculated centers of gravity vs pH.
Nanosecond DAS of GB1 at Different pH’s
Fluorescence emission for a fluorophore is a function of wavelength and time after excitation,32 and in this case another variable, pH. In a simple heterogeneous system, the decay surface is often described as a linear combination of multiple exponential terms with different lifetimes (τi):
| 1 |
The approach used to simultaneously analyze the decay curves is called global analysis: it aims to find common lifetime values that describe the fluorescence decay curves throughout the spectral and pH range, and at the same time, it optimizes the values for αi to better describe each decay curve.32,33 For each lifetime extracted, the ensemble of α values assigned for the wavelength range of interest represents the decay associated spectrum (DAS). Global analysis is applied here not only to the emission spectral range of the fluorophore but also among all pH values.
Fresh GB1 was placed in 20 mM buffers with different pH’s before taking each DAS. The DAS were then normalized to the steady state emission spectrum (Iss = Σαiτi) corresponding to the pH under analysis. The ns data are all taken using the TCSPC apparatus described in the Experimental Section.
The lifetimes reported in Figure 4 are obtained by globally fitting all partial spectra (from 330 to 375 nm) at the 6 different pH’s, to better describe a W43 transition upon acid titration. The analysis was based on simple extrema; neutral pH was identified as a virtually native state (for W43 neighbors), while the final state reached upon acidification represents a more protonated plateau. This is a very simplified approach, and we do not seek detail about the transition altering the fluorescence lifetime of W43; while it is likely that a proximate residue (or multiple residues) titrates, we neither assume nor seek to measure pKa in this analysis.
Figure 4.
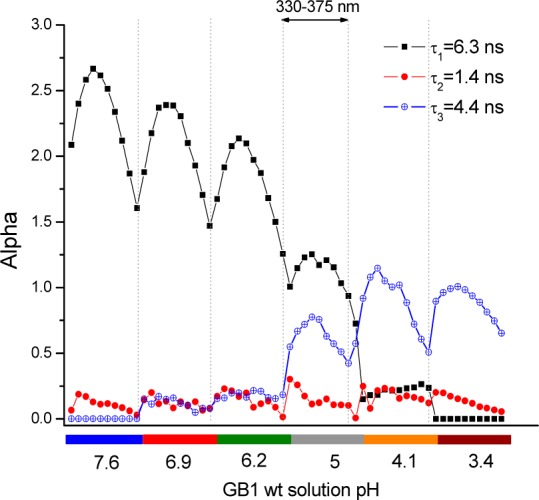
Global analysis applied to several DAS for GB1 as a function of the pH. Two-state analysis reveals that three components adequately describe the GB1 titration.
Although conceptually simple, this analysis fits the system quite well: the native state (pH 7.6) is accompanied by the long lifetime fluorescence component (τ1 = 6.3 ns), while the more protonated state (pH 3.4) is linked to a shorter lifetime (τ3 = 4.4 ns). In between, we have linear combinations of those states. A third, minor amplitude component is necessary to better describe the entire data surface (τ2 = 1.4 ns). It probably contains a mixed average of residual short lifetimes including those we found separately at the extrema, i.e., pH 7 (∼2.8 ns) and pH 3.7 (∼1.9 ns) (found when their traces are processed individually, rather than across the whole range of pH). This very minor component could be further resolved using higher resolution data, but that is beyond the scope of this investigation. Note that the preexponential is not conserved; i.e. the decrease in pH reduces quantum yield more than predicted by the lifetime reduction. This was not, however, accompanied by more sub-100 ps decay. Hence, any quasi static self quenching34,54 in this system must be below 300 fs.
Fluorescence Upconversion of GB1
Nanosecond time resolution provides general information on how quickly the fluorophore, in this case W43, relaxes back to the ground state. Picosecond time resolution instead provides information regarding details about how the ns-emitting fluorescence state is reached after excitation, especially how the surroundings (including the protein and the solvent) are dynamically reacting to the large dipole change induced upon excitation. Fresh GB1 (∼0.1 mM) at pH 7.0 in phosphate buffer was used to collect the DAS on the picosecond time scale for W43 in the range 310–390 nm. Global analysis was utilized, and three components were extracted: a multi-nanosecond (essentially flat over 100 ps) term, a 1.5 ps “bulk” water reorganization component, and a second relaxation with an exponential “lifetime” of 30 ps. The nature of this component has been a matter of debate, as explored in more detail in the discussion. The 30 ps component always presented a signatory negative amplitude that is strongest around 375 nm, as highlighted in Figure 5 where a complete ps DAS for GB1 is shown. Fluorescence upconversion traces of GB1 were then obtained from pH 8 to 2.9 (all taken at 375 nm) to monitor the 30 ps component response to charge reorganization. The curves shown in Figure 6 (offset vertically for easier comparison) were obtained by averaging four data sets for each solution prepared. The corresponding amplitudes and “lifetimes” obtained from the fitting are in Table 1. For each fit, one of the time constants (τ1) was fixed to 1.5 ps, which is the value previously found for bulk water diffusive rotational motion.35 The preexponential amplitude α1 associated with this τ1 is consistently negative, and so is the amplitude for the second time constant (τ2), reported in Table 1 as a percentage of the total amplitude. A long time constant (τ3) with positive amplitude (α3) is always found with values in the range ∼1.3–2 ns (not meant to be accurately recovered in this short window).
Figure 5.
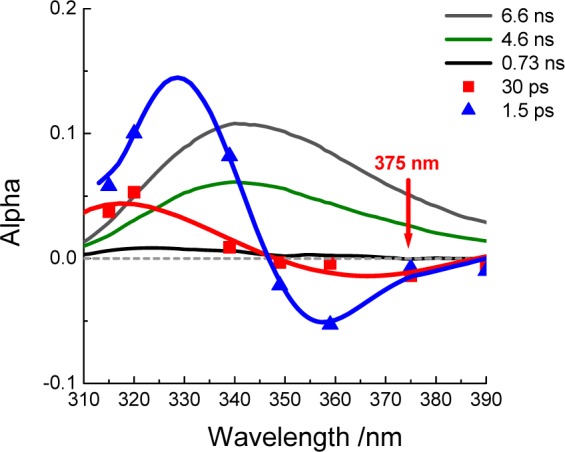
Picosecond and nanosecond DAS for W43 of GB1 at pH 7.0. The 30 ps amplitude is shown to be negative in the low energy side of the spectrum (red curve).
Figure 6.
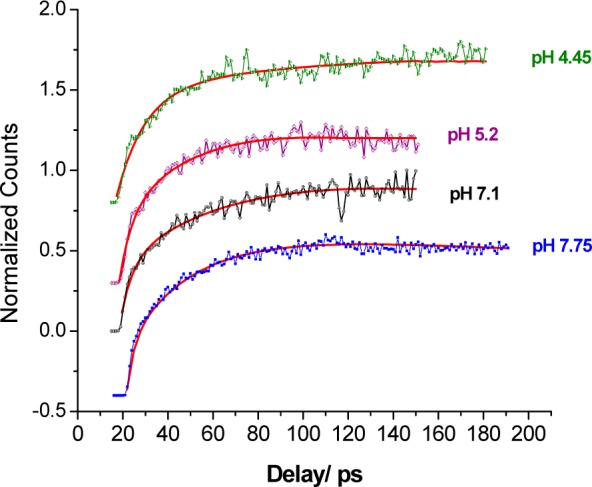
Fluorescence upconversion signals of Trp43 in GB1 at 375 nm in different buffers. The red lines represent the fitted curve. The curves are offset vertically for ease of comparison.
Table 1. Values for the Negative Amplitude Component for W43 in GB1 at Different pH’sa.
| upconversion fitting of the slow water component (30 ps) | |||
|---|---|---|---|
| GB1 solution pH | τ2 (ps) | % α2 | buffer type |
| 2.9 | 32 (28, 38) | 21 | succinate |
| 4.25 | 31.8 (24, 44) | 33 | succinate |
| 5.2 | 24 (19, 32) | 32 | succinate |
| 6.3 | 18 (15.3, 21) | 38 | phosphate |
| 7.1 | 31 (23.5, 42) | 37 | phosphate |
| 7.75 | 25 (21, 29.5) | 34 | phosphate |
The % refers to the relative value of the τ2 amplitude relative to the total amplitude for the three components used for the fitting. The range of τ2 in parentheses indicates 90% confidence.
Each curve was fit using the software DecayFit version 2.9.92. The software deconvolves (iteratively reconvolves and fits) using a 350 fs wide “lamp” function which was obtained as described in the Experimental Section.
Stern–Volmer Quenching Measurements
Three different soluble quenchers were utilized: KI, CsCl, and acrylamide. The first two are ionic quenchers, while acrylamide is a neutral polar quencher. The Stern–Volmer equation ties the drop in steady state fluorescence emission with the concentration of the quencher.36 In the case of I–, the plots show a deviation from linear behavior (as shown in Figure S2A, Supporting Information) which can be interpreted as I– having both static and dynamic quenching interactions at the W43 site. Even without analysis for the static and dynamic constants around W43, it is clear (from the large increase in the curve steepness occurring upon a drop in pH) that we have decreased the overall negative charge of the neighborhood. While W43 itself does not titrate in this pH range, nearby residues (Glu and Asp) are becoming less negatively charged due to gradual protonation occurring at lower pH.37 The use of the positive quencher CsCl and neutral acrylamide for comparison was aimed at separating out how much of the quenching change originated in changed W43 water exposure on the ns time scale. The bimolecular quenching constant Kq, defined as Kq = KSV/τ0, where KSV is the Stern–Volmer constant and τ0 is the fluorophore lifetime in the absence of quencher, was determined for W43 at three different pH values, as reported in Tables S1 and S2 (Supporting Information). Upon acidification, Kq increases for both CsCl and acrylamide, suggesting effective long-term water exposure of residue W43 does increase upon acidification. Both charge in the W43 environment and effective solvent exposure of W43 are distinctly changed.
The quadratic division of the SV plot into pure static and dynamic contributions is based on assuming a local binding site which causes 100% quenching along with an unperturbed local concentration (equal to bulk) also causing collisional quenching events in ns.
Molecular Dynamics Simulations
In order to address the nature of the Stokes shift, solvent exposure, and lifetime changes measured above, extensive MD simulations of λmax were performed on GB1 at four levels of protonation, starting with an X-ray structure. In each case, the protein was solvated with ∼8300 TIP3 explicit waters in a cubic periodic box with 64 Å edges and neutralized with Na+ or Cl–. A pH of 7 was approximated by leaving all Glu and Asp unprotonated. For pH 5, two scenarios are proposed: one where only Glu27, which is in close proximity to Trp43, was protonated and the second where only Glu42 was protonated. For pH 0, all Glu and Asp residues were protonated. In each case, a 30 ns ground state simulation using default ground state topology files was performed, from which coordinates were extracted every 100 ps. The latter were then used as starting points for 300 direct-response TDFSS curves, simulated by instantaneously switching the charges of the Trp43 residue from their default ground state values to those of the La state. Following excitation, the system was evolved in response to the changed chromophore charges for 2 ns, during which coordinate snapshots were saved at appropriate intervals. The coordinate files were used by two programs: In the first, a spectroscopically calibrated semiempirical quantum mechanical program from Zerner (INDO/S-CIS or “Zindo”) was applied to a 30-atom Trp fragment that included the two amides of the backbone, with the Hamiltonian modified to include electric fields and potentials from the non-quantum atoms producing vertical transition energies for the La state, as done previously.31,38 For each pH, the temporal profiles of the 300 trajectories were averaged to yield a picture of the temporal evolution of the FSS as a response to the solvent and protein relaxation following excitation. Figure 7 shows these decay profiles.
Figure 7.
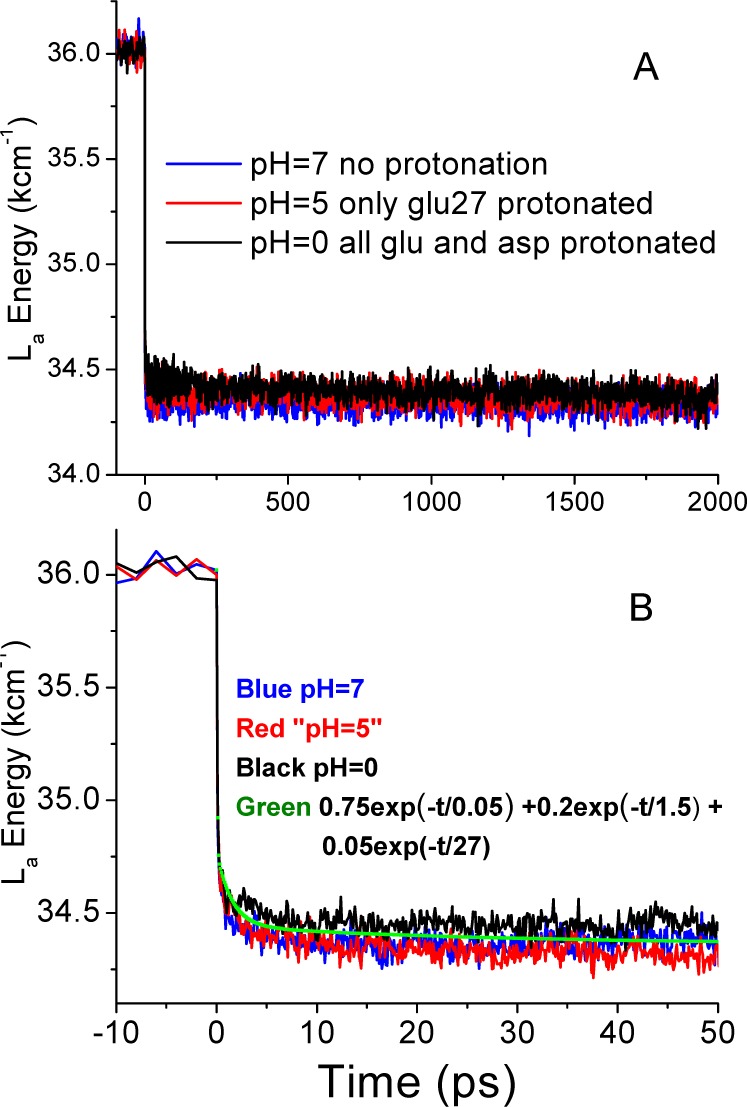
QM (Zindo) S0 → 1La vertical transition energies during simulation showing direct response to ground to excited charges at three pH’s: (A) from −100 ps to 2 ns; (B) from −10 to 50 ps. The green points represent a manual fit given by the function 0.75 exp(−t/0.05) + 0.2 exp(−t/1.5) + 0.05 exp(−t/27), with times in ps.
The TDFSS surrogates seen in Figure 7 are in harmony with the experimental finding that the pH-driven changes in the charge environment around Trp (or at least those that we have selected) do not result in altered equilibration rates on the picosecond (sub-100 ps) time scale. There are subtle changes in timing and relative amplitude, but the overall solvent relaxation of the Trp environment is remarkably stable. More subtle still are the changes in final level; there is perhaps a 1 nm blue shift in protonated vs unprotonated final states, again in agreement with the small blue shifts seen in Figures 2 and 3.
The second analysis applied to the MD simulation data is a related, but non-QM, procedure that computes the electric potential at each indole ring atom due to the remainder of protein atoms and waters, yielding the shift caused by each protein residue and water from an estimated constant average electron density change upon excitation. Figure 8 presents results that show the electrostatic contributions from water, protein, and the total of these for three of the pH environments simulated (the pH 0 case is shown as Figure S3, Supporting Information). The plots in Figure 8 show, unlike the curves of Figure 7, that the composition of the energy loss relative to vacuum does change radically with pH and sequelae. pH-dependent changes in the protein relaxation component of 3000 cm–1 and larger occur, but these changes are almost completely offset by opposite changes in the water relaxation portion (see also Figures S4 and S5, Supporting Information). It is important to realize that these large variations in composition are due primarily to the differences that protein charge has on water. The composition of TDFSS following excitation is essentially invariant with pH changes. It seems the predicted total relaxation transient is a more global property of the macromolecule–solvent system; i.e., it is refractory to local charge modifications.
Figure 8.
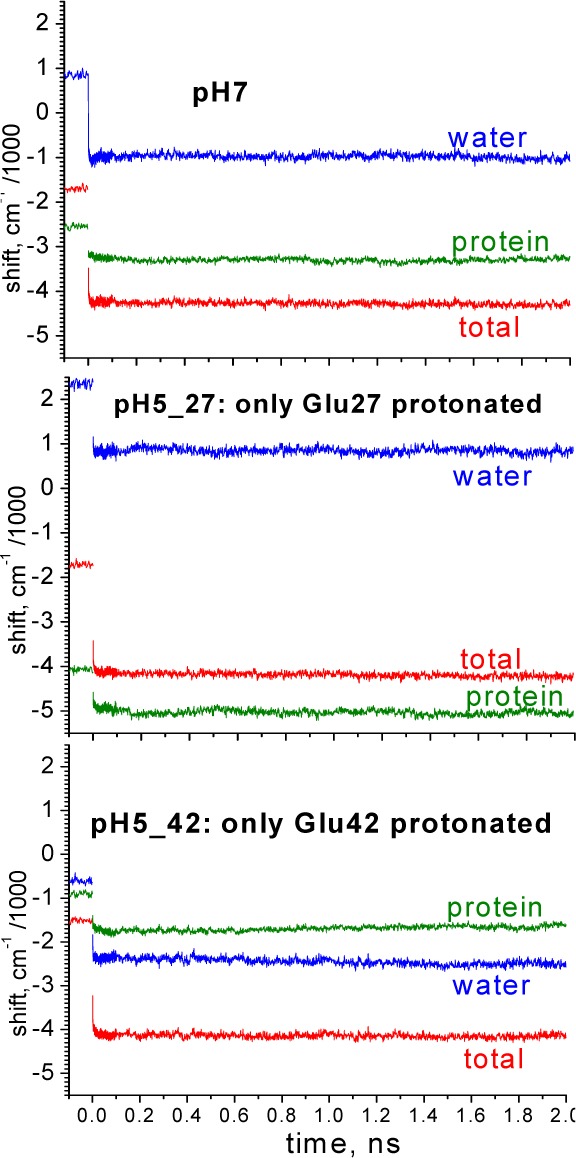
Effect of pH on contributions from water, protein, and their total to the TDFSS. Note that, although the roles of protein vs water contributions vary considerably with changing pH, the total remains virtually constant.
In addition to the large protein–water steady state anticorrelation evident in Figure 8, the MD results also have uncovered interesting complex synergistic behavior of the individual charged residue contributions that are inherently biphasic in their response to excitation, typically either with a sub-ps decay or rise followed by a ∼20 ps decay or rise (see Figure S7, Supporting Information). The amplitude of the slower component is typically 25% of the fast component, which is a much higher fraction than we find for water. Lys31, which lies over the pyrrole ring and whose positive charge is unaffected by pH in these experiments, uniformly contributes a dominant decay component to the total TDFSS from protein. At pH 7, however, this slow phase of Lys31 is nearly canceled by a composite of smaller rising slow components from several more distant charged residues (mainly Glu42 and Glu56), such that the slow phase at pH 7 comes principally from water. The opposite is found at “pH 0” where all Asp and Glu are neutral (Figure S3, Supporting Information), and the slow component is almost entirely from Lys31, with water contributing only a large sub-ps component and slow rising component.
The protonation-induced changes in steady-state quenching seen above suppose a larger accessibility to Trp; in contrast, the MD simulations show a subtle surface decrease upon acidification—on the sub-ns scale. This is true whether one uses an appropriate radius for I–, a water access measure, or even a count of water within 4 Å of Trp. Thus, Kq from the quenching experiment is not a direct surface area predictor in this case.
Discussion
Trp has been widely used as an intrinsic fluorescence probe to gain structural information on proteins.28,39−42 The indole emission spectrum is sensitive to the polarity of the local environment, and its fluorescence lifetime has also proven to be highly susceptible to its microenvironment.20,36 Femtosecond fluorescence lifetime spectroscopy is the method of choice to follow solvation dynamics of the partially exposed tryptophan residue in GB1. GB1 is a stable, single tryptophan and single domain protein comprised of one α-helix and a four-stranded β-sheet connected through two hairpins. This model protein was the system of choice, considering the wealth of prior information available and its high stability. GB1 acid unfolding was previously studied via NMR, and its secondary structure was found to be intact down to pH 3.29 Since it maintains structure upon acidification, we can do a meaningful comparison of charge-induced changes in the W43 dynamics by simply comparing different pH states.
The experimental data in conjunction with MD simulation provided the following conclusions that will be discussed throughout this section:
-
(1)
Trp dynamics on the ps and ns time scales are not correlated in GB1.
-
(2)
Relaxation dynamics of the milieu around Trp43 on the 20–50 ps time scale are insensitive to local charge rearrangement.
-
(3)
MD simulation showed that the major water contribution to TDFSS in Trp43 (1.5 ps component in Figure 5) comes from a fast reorientation of the water layer at the protein interface strongly—but flexibly—associated with the protein.
-
(4)
The overall TDFSS contribution comes principally—if not entirely—from waters closer than 8 Å from the protein interface (see Figure S6, Supporting Information).
Fluorescence steady state measurements showed a decrease in intensity accompanied by a small blue shift upon acid titration (see Figure 2). The fluorescence emission state of Trp is known to be 1La for virtually all proteins.43 Relative to the ground state, the benzene ring experiences a transfer of electron density from the pyrrole ring.26 Basic electrostatic concepts suggest that negative charges near the benzene and/or positive charges nearby the pyrrole ring will cause a blue shift of the emission wavelength. Of course, a less polar environment also favors Trp blue shifts. More clues are provided by the fluorescence lifetime profile of W43 as a function of pH; as shown in Figure 4, global analysis of W43 decay associated spectra (DAS) clearly shows a transition taking place around pH 5.0. The exact origins of this transition are unclear, though the most likely event is a protonation of aspartate and/or glutamate residues44 near W43. It is worth mentioning a change in 1H chemical shift in Lys31 upon acid titration around pH 5 is observed via NMR, whose nature has been correlated to W43 ring current.44,45
Stern–Volmer constants were also calculated for two ionic quenchers (KI and CsCl) and neutral acrylamide. The values reported in Tables S1 and S2 (Supporting Information) for the bimolecular constant Kq imply that (1) acidification provides a proximate affinity site for I–, yielding static quenching, and (2) overall quencher (proxy for solvent) exposure increases at the W43 sites upon acidification. Alteration in W43 water exposure (even if subtle) would necessitate local modification of the Trp environment. All of these measurements point to a common denominator: in the vicinity of the W43, a reduction of negative charges most likely has taken place upon acid titration.
These changes considerably alter the nanosecond yield, energy, and lifetimes. MD simulation, however, found only minimal structural changes when examining snapshots of solvent exposure. We find the discrepancy arises because the short trajectories are unable to reliably predict “uncapping” events that are rare on ps time scales but frequent enough for altering ns decay. What is clear is that there is immense heterogeneity in the positioning of Lys31 at the point of excitation, and that the large fluctuations seen in Figure 7 remaining after averaging 300 trajectories are a testimony to such heterogeneity.
The picosecond DAS for GB1 at pH 7 in Figure 5 show that, besides the omnipresent 1.5 ps “bulk water” relaxation component, a second component is present, with a lifetime of about 30 ps. It clearly has negative amplitude in the low energy portion of the emission spectrum, especially around 375 nm. This finding is in agreement with the data from our collaborators,41 and it is a signature for what has been described as coupled protein–water relaxation.24,25,46 The amplitude and lifetime of this component were measured at 375 nm across the entire pH range (down to pH 2.9) to probe correlation between protein charges and solvation at the tryptophan site. The data presented in Figure 6 and Table 1 for the fluorescence upconversion of W43 in various pH buffers find both the lifetime and the amplitude of this 30 ps component remain essentially constant, within experimental error, over a large range. The data have a twofold implication: First, the W43 ns dynamics are essentially independent of the picosecond dynamics for the conditions under scrutiny in GB1. Although a proximate change has taken place around the W43 site, the 30 ps component remains unperturbed, down to pH 2.9. The Trp neighborhood rearrangements that were apparent via nanosecond fluorescence apparently do not affect the overall protein–water conformational coupling (e.g., β sheet breathing47 and side chain movements48 tied to water). In a recent paper by Toptygin et al., the individual contributions to the Stokes shift responsible for the 30 ps amplitude components were calculated using MD trajectories,42 and it was concluded that water libration in proximity to W43 was responsible for roughly 60% of the amplitude, with the other 40% of the amplitude associated with small adjustments in the protein conformation, similar to what we have found (Figure 8). Although our results differ somewhat in detail, one similarity is in common. In both studies, there is anticorrelation of water and protein components and the sign of their respective decay constants change sign as a function of time. Second, W43 exposure to quenchers clearly changed upon acidification; we believe this is most likely explained by protonation of Glu27, which is in contact with W43. It is known that protonated Glu is a strong collisional quencher of Trp in aqueous solution.49
While consistency of the 30 ps component—despite changes taking place in the immediate vicinity of W43—might lead one to look toward more distant interactions, the simulations show that most of the TDFSS can be traced to collective motion of water hydrogen bound to Lys31 and Glu27, almost all within 8 Å of W43 (see Figures S5 and S6, Supporting Information).
The nature of the conservative protein–water balance in relaxation is interesting in two ways: the traces from upconversion and the steady state results all point to an invariance with pH. As shown in Figure 8, the steady state contributions to that nearly fixed Stokes shift change dramatically. Water decreases its redshifting influence a full 3500 cm–1 at pH 5 depending on whether Glu27 or Glu42 is protonated, yet protein contributions almost completely compensate that. Exactly the same behavior was found in QM-MM simulations,50 of the local charge-mutated SNase experiments by Qiu et al.;30 in these and several other cases,15,23−26 a delicate balance between water and protein make the steady state reaction field response to Trp excitation an invariant (Figures S4 and S5, Supporting Information, show dynamics of this compensation).
In more detail, the stability of the ∼30 ps component of the TDFSS under large charge perturbation is found to arise from similar protein–water compensations in which either water or protein is the major contributor. Lys31, which lies closely above the pyrrole ring, contributes a major slow decaying red shift (actually a loss of blue shift) component at all pH’s, apparently caused by increasing distance in time between the positive charge and the pyrrole ring. At pH 7, its effect is canceled by slow increasing blue shifts from negatively charged residues, and the slow component is nearly all from water. There is, however, essentially none of this cancelation when all Glu and Asp are neutral (Figure S3, Supporting Information), and intermediate behavior is found when only one nearby Glu is protonated, modeling the pH 5 condition.
Perhaps most important to the prior controversies about coordinated/interfacial water, we find that the dominant water contribution to TDFSS in this system comes from waters which reorient to relax within a picosecond but remain associated with the protein surface for times as long as 30 ps. It thus appears that the signal we previously labeled “bulk” (because it was fast, like bulk water) may actually be fast associated water, tied to protein dynamics as well. In the immediate neighborhood of W43, the exposure of the rings to the exterior (and thus to quenchers) seems to be heavily controlled by Lys31 and its nearly “capped” position upon the pyrrole ring of W43. While tracing solvent exposure with tools like the GROMACS g_sas indicates little equilibrium difference between accessible areas at different pH’s, we find that the Lys31 cap participates in rare “uncapping” motions (rare in 100 ps but facile for ns) that facilitate quenching. We emphasize it is the lack of local ultrafast (sub-50 ps) quenching that allows Trp43 in GB1 to report on these environmental dynamics, which were found constant in this particular system. In other protein systems we have studied, where ultrafast quenching of Trp dominates the ps regime, the electron transfer (ET) quenching masks relaxation amplitudes so strongly that Trp becomes a probe solely for local quenching dynamics, i.e., the fluctuations that bring ET quenchers into proximity (i.e., decrease the energy gap between the 1La and charge transfer states). Examples are crystallin and monellin.51,52 Zhong and co-workers have isolated the relaxation portion from the mixed picture by careful mutagenesis, removing proximate quenchers.53 The duality of Trp dynamics in the ps time scale (sensitivity to fast quenching which may mask relaxation) has also been explored using modified Trp with higher redox potential. Unlike Trp, which is subject to ultrafast quenching,34,54 these analogues resist electron transfer and do not appear to undergo ultrafast quenching.55,56,59
It will be interesting to apply them in systems previously obscured by quenching.
In summary, limited titration of GB1, seen with both nanosecond and picosecond transients from Trp, accompanied by QM-MM calculations, was used to assess the mechanisms of relaxation and decay. The constancy of the “slow” (∼30 ps) relaxation term despite significant surface charge changes points to an origin in strongly coupled water and protein dynamics in which changes in protein electrostatics are compensated by changes in water polarization. Nevertheless, the most relevant “interfacial” waters retained sub-picosecond relaxation speeds. Therefore, the previously labeled “bulk water” transient actually carries useful information about the protein–water interface, and that implies studies with finer time resolution should be performed.57
Methods
GB1 Protein Purification
The GB1 purification was a composite of previously described protocols. Briefly, GB1 (in a pET-11a vector) was expressed in BL21-gold (DE3) (Agilent Technologies, Santa Clara, CA) E. coli host cells. The cells were resuspended in 100 mM sodium phosphate, pH 7.4, disrupted by two passes through an EmulsiFlex-C3 (Avestin, Inc., Ottawa, ON), and centrifuged for 1 h at 20 000 rpm in a 70 Ti Rotor (Beckman Coulter) at 4 °C. The supernatant was then placed for 5 min in a water bath set at 80 °C followed by 10 min on ice. The precipitate was removed by centrifugation as described above, and the supernatant was loaded onto a Q-Sepharose FF column (GE Healthcare). The flow through was diluted 5-fold and reloaded onto the column. GB1 was eluted with a linear gradient of 0–1 M NaCl in 20 mM Tris–HCl, pH 7.5. The GB1 containing fractions were pooled and concentrated, and the protein was further purified on a HiLoad 26/600 Superdex 75 column (GE Healthcare) equilibrated in 20 mM Tris–HCl. The protein, which was pure as shown by Coomassie blue stained SDS-PAGE, was characterized by CD, mass spectroscopy, and fluorescence emission spectra.
MD Details
Starting with PDB code 2QMT, crystal waters were retained but all other ligands (phosphate and several alcohols) were removed. The requirement that no protein component was any closer than 12 Å from any box surface resulted in cubic periodic boundary conditions. Steepest descent minimization was applied to each of the structures, followed by equilibration at 300 K using GROMACS and the charmm27 force field for a total of 1.2 ns, with a dynamics time step of 2 fs. Electrostatic and van der Waals cutoffs were set at 12 Å.
Experimental Section
TCSPC apparatus: A frequency-doubled, mode-locked NdYVO4 laser (Vanguard 2000-HM532, Spectra-Physics) synchronously pumps a tunable Spectra-Physics model 3500 cavity dumped dye laser. The dye laser output is doubled via an Inrad autotracker with BBO crystal in the UV range. Rhodamine 6G was the laser dye used at 590 nm, and magic angle emission/vertical excitation was employed at 295 nm. This wavelength is chosen to selectively excite tryptophan residues without exciting tyrosine, with pulses having a fwhm <2 ps. The fluorescence emission was recorded from 310 to 455 nm using a JYH10 monochromator with 8 nm bandwidth and a cooled MCP photomultiplier. The instrumental response function width was about 100 ps. For the decay associated spectra (DAS), melatonin in water was used as a monoexponential standard, and the time-resolved decay surface was obtained by exciting the protein at 295 nm and collecting every 5 nm over the emission band. The instrument response function is obtained using a dilute solution of 30 nm colloidal silica. Lifetimes are obtained fitting the decay with multiexponential functions, according to the least-squares method. Adequate model functions were assessed with the inspection of the residuals and their autocorrelation and χR2 functions.
Global analysis at various pH’s was done incorporating decay curves in the 330–375 nm range for each pH value; all were satisfactorily fit to the global three-exponential model.33 The only constraints for the linked fitting were the following: the amplitude of τ1 was fixed to zero at pH 3.4, while the τ2 amplitude was fixed to zero at pH 7.6.
Steady-state absorption and fluorescence spectra were recorded with a spectrophotometer (Perkin-Elmer lambda 18) and a Fluorolog-3 spectrophotofluorometer (SPEX), respectively. The DAS were normalized using the appropriate steady state emission for each pH value. Upconversion spectrofluorometer: a Kerr Lens mode-locked Ti:sapphire laser (Tsunami, Spectra Physics) pumped by a cw DPSS laser (Millenia, Spectra Physics) was used to generate 500 mW of 120 fs pulses at ∼886 nm and 82 MHz. Selected pulses were used to seed a Ti:sapphire regenerative amplifier (Spitfire, Spectra Physics) modified for high red gain. The amplified pulses centered at 885 nm had energy of 140 μJ and an autocorrelation pulse width of 350 fs at a repetition rate of 5 kHz. The output undergoes nonlinear frequency conversion using (sequentially) a 1 mm BBO crystal and 0.5 mm BBO crystal for doubling and tripling, respectively; UV pulse trains with an average power up to 30 mW are obtained (although typical illumination is under 5 mW). The UV beam (tripled) was separated from the infrared beam (fundamental) and blue beam (doubled) by two dichroic mirrors, and the applied power was carefully attenuated before excitation of the sample to avoid photodegradation, hole burning, and other undesirable effects. The sample was held in a circular array of thin cells (T-20, NSG Precision Cells) with a path length of 1 mm in a continuously (>5 m/s) spinning delrin stacked slotted disk. The residual fundamental pulse was retroreflected from a hollow cube corner on a computer-controlled precision stage, and this variably delayed pulse was used as a gate pulse for the upconversion process. The fluorescence emission was collected in an off-axis parabolic mirror and focused into a 1 mm thick BBO mixing crystal, and the upconversion signal was produced via type I sum frequency generation with the gate pulse in the crystal. To reject strong background signals (infrared laser, remnant UV, and unconverted fluorescence) accompanying the upconverted signal, a noncollinear configuration was arranged between infrared gate and fluorescence with the two beams joining at a 30° mutual angle. Polarization of gated fluorescence was determined by the axes of nonlinear crystals, so that no extra linear polarizer was needed. The polarization of the excitation beam was chosen by a motor-controlled zero-order half-wave plate. Hence, there were no elements in the collection train apt to induce polarization bias.
The fluorescence wavelength of interest was selected by angle tuning the mixing crystal. The upconverted fluorescence, with a detection wavelength in the range 230–280 nm, always polarized in the same direction, entered a monochromator (Triax 320, Jobin Yvon Inc., with a bandwidth of 0.5 nm) and a solar blind photomultiplier tube (R2078, Hamamatsu, dark rate <1 cps). Amplified SBPMT signals were discriminated and then recorded by a gated single photon counter (994, EG&G Ortec). Photon arrival events were held to less than 5% of the repetition rate to minimize “pileup”.
The “lamp” (AKA “apparatus” or “instrument response”) function was determined by measuring the cross-correlation between UV generated spontaneous Raman scattering in water and the infrared pulse.
GB1 Solution Preparation for Upconversion
For each pH, the GB1 solution was equilibrated in an atmospheric chamber filled with nitrogen gas, to remove dissolved oxygen. We have found that by doing so the amount of oxidation at the tryptophan site is notably reduced after exposure to UV light.58 The absorption spectrum for the solution was taken before and after measurements to make sure no photodamage has occurred. GB1 had a concentration between 0.6 and 0.8 mM, and all the buffers were 20 mM.
Acknowledgments
This work was supported by the intramural program of the National Hearth Lung and Blood Institute. The authors would like to thank Dr. Marie-Paule Strub for crucial assistance with protein purification and expression. We thank Ludwig Brand and Dmitri Toptygin for stimulating discussions. We also thank Dr. John Louis and Prof. Angela Gronenborn for fueling all our prior studies with their GB1 stock and then generously providing the GB1 plasmid used herein. This work used the Extreme Science and Engineering Discovery Environment (XSEDE), which is supported by National Science Foundation Grant No. OCI-1053575 through Project No. MCB090176.
Supporting Information Available
Stern–Volmer plots and details about the MD simulation for GB1 at pH 0, along with the water contribution to the TDFSS of W43 as a function of the distance from the protein surface. This material is available free of charge via the Internet at http://pubs.acs.org.
The authors declare no competing financial interest.
Funding Statement
National Institutes of Health, United States
Supplementary Material
References
- Levitt M.; Sharon R. Proc. Natl. Acad. Sci. U.S.A. 1988, 85, 7557–7561. [DOI] [PMC free article] [PubMed] [Google Scholar]
- Otting G.; Liepinsh E. Acc. Chem. Res. 1995, 28, 171–177. [Google Scholar]
- Pal S. K.; Peon J.; Bagchi B.; Zewail A. H. J. Phys. Chem. B 2002, 106, 12376–12395. [Google Scholar]
- Merzel F.; Smith J. C. Proc. Natl. Acad. Sci. U.S.A. 2002, 99, 5378–5383. [DOI] [PMC free article] [PubMed] [Google Scholar]
- Svergun D. I.; Richard S.; Koch M. H. J.; Sayers Z.; Kuprin S.; Zaccai G. Proc. Natl. Acad. Sci. U.S.A. 1998, 95, 2267–2272. [DOI] [PMC free article] [PubMed] [Google Scholar]
- Woessner D. E. J. Magn. Reson. 1980, 39, 297–308. [Google Scholar]
- Qvist J.; Persson E.; Mattea C.; Halle B. Faraday Discuss. 2009, 141, 131–144. [DOI] [PubMed] [Google Scholar]
- Zhang L. Y.; Wang L. J.; Kao Y. T.; Qiu W. H.; Yang Y.; Okobiah O.; Zhong D. P. Proc. Natl. Acad. Sci. U.S.A. 2007, 104, 18461–18466. [DOI] [PMC free article] [PubMed] [Google Scholar]
- Negrerie M.; Gai F.; Bellefeuille S. M.; Petrich J. W. J. Phys. Chem. 1991, 95, 8663–8670. [Google Scholar]
- Adhikary R.; Barnes C. A.; Petrich J. W. J. Phys. Chem. B 2009, 113, 11999–12004. [DOI] [PubMed] [Google Scholar]
- Chung H. S.; Louis J. M.; Eaton W. A. Proc. Natl. Acad. Sci. U.S.A. 2009, 106, 11837–11844. [DOI] [PMC free article] [PubMed] [Google Scholar]
- Halder M.; Mukherjee P.; Bose S.; Hargrove M. S.; Song X. Y.; Petrich J. W. J. Chem. Phys. 2007, 127, 055101(1–6). [DOI] [PubMed] [Google Scholar]
- Jordanides X. J.; Lang M. J.; Song X. Y.; Fleming G. R. J. Phys. Chem. B 1999, 103, 7995–8005. [Google Scholar]
- Singh R. B.; Mahanta S.; Bagchi A.; Guchhait N. Photochem. Photobiol. Sci. 2009, 8, 101–110. [DOI] [PubMed] [Google Scholar]
- Halle B.; Nilsson L. J. Phys. Chem. B 2009, 113, 8210–8213. [DOI] [PubMed] [Google Scholar]
- Pal S. K.; Peon J.; Zewail A. H. Proc. Natl. Acad. Sci. U.S.A. 2002, 99, 15297–15302. [DOI] [PMC free article] [PubMed] [Google Scholar]
- Peon J.; Pal S. K.; Zewail A. H. Proc. Natl. Acad. Sci. U.S.A. 2002, 99, 10964–10969. [DOI] [PMC free article] [PubMed] [Google Scholar]
- Kamal J. K. A.; Zhao L.; Zewail A. H. Proc. Natl. Acad. Sci. U.S.A. 2004, 101, 13411–13416. [DOI] [PMC free article] [PubMed] [Google Scholar]
- Zhang L. Y.; Yang Y.; Kao Y. T.; Wang L. J.; Zhong D. P. J. Am. Chem. Soc. 2009, 131, 10677–10691. [DOI] [PubMed] [Google Scholar]
- Beechem J. M.; Brand L. Annu. Rev. Biochem. 1985, 54, 43–71. [DOI] [PubMed] [Google Scholar]
- Nandi N.; Bagchi B. J. Phys. Chem. B 1997, 101, 10954–10961. [Google Scholar]
- Modig K.; Liepinsh E.; Otting G.; Halle B. J. Am. Chem. Soc. 2004, 126, 102–114. [DOI] [PubMed] [Google Scholar]
- Nilsson L.; Halle B. Proc. Natl. Acad. Sci. U.S.A. 2005, 102, 13867–13872. [DOI] [PMC free article] [PubMed] [Google Scholar]
- Hassanali A. A.; Li T. P.; Zhong D. P.; Singer S. J. J. Phys. Chem. B 2006, 110, 10497–10508. [DOI] [PubMed] [Google Scholar]
- Golosov A. A.; Karplus M. J. Phys. Chem. B 2007, 111, 1482–1490. [DOI] [PubMed] [Google Scholar]
- Vivian J. T.; Callis P. R. Biophys. J. 2001, 80, 2093–2109. [DOI] [PMC free article] [PubMed] [Google Scholar]
- Bjorck L.; Kronvall G. J. Immunol. 1984, 133, 969–974. [PubMed] [Google Scholar]
- Tcherkasskaya O.; Knutson J. R.; Bowley S. A.; Frank M. K.; Gronenborn A. M. Biochemistry 2000, 39, 11216–11226. [DOI] [PubMed] [Google Scholar]
- Ding K. Y.; Louis J. M.; Gronenborn A. M. J. Mol. Biol. 2004, 335, 1299–1307. [DOI] [PubMed] [Google Scholar]
- Qiu W. H.; Kao Y. T.; Zhang L. Y.; Yang Y.; Wang L. J.; Stites W. E.; Zhong D. P.; Zewail A. H. Proc. Natl. Acad. Sci. U.S.A. 2006, 103, 13979–13984. [DOI] [PMC free article] [PubMed] [Google Scholar]
- Callis P. R.; Liu T. Q. J. Phys. Chem. B 2004, 108, 4248–4259. [Google Scholar]
- Knutson J. R.; Walbridge D. G.; Brand L. Biochemistry 1982, 21, 4671–4679. [DOI] [PubMed] [Google Scholar]
- Knutson J. R.; Beechem J. M.; Brand L. Chem. Phys. Lett. 1983, 102, 501–507. [Google Scholar]
- Chen R. F.; Knutson J. R.; Ziffer H.; Porter D. Biochemistry 1991, 30, 5184–5195. [DOI] [PubMed] [Google Scholar]
- Shen X. H.; Knutson J. R. J. Phys. Chem. B 2001, 105, 6260–6265. [Google Scholar]
- Lakowicz J. R.Principle of Fluorescence Spectroscopy; Kluwer Academics: New York, 1999. [Google Scholar]
- Eftink M. R.; Ghiron C. A. Anal. Biochem. 1981, 114, 199–227. [DOI] [PubMed] [Google Scholar]
- Tusell J. R.; Callis P. R. J. Phys. Chem. B 2012, 116, 2586–2594. [DOI] [PubMed] [Google Scholar]
- Park S. H.; Oneil K. T.; Roder H. Biochemistry 1997, 36, 14277–14283. [DOI] [PubMed] [Google Scholar]
- Park S. H.; Shastry M. C. R.; Roder H. Nat. Struct. Biol. 1999, 6, 943–947. [DOI] [PubMed] [Google Scholar]
- Toptygin D.; Gronenborn A. M.; Brand L. J. Phys. Chem. B 2006, 110, 26292–26302. [DOI] [PubMed] [Google Scholar]
- Toptygin D.; Woolf T. B.; Brand L. J. Phys. Chem. B 2010, 114, 11323–11337. [DOI] [PubMed] [Google Scholar]
- Broos J.; Tveen-Jensen K.; de Waal E.; Hesp B. H.; Jackson J. B.; Canters G. W.; Callis P. R. Angew. Chem., Int. Ed. 2007, 46, 5137–5139. [DOI] [PubMed] [Google Scholar]
- Tomlinson J. H.; Ullah S.; Hansen P. E.; Williamson M. P. J. Am. Chem. Soc. 2009, 131, 4674–4684. [DOI] [PubMed] [Google Scholar]
- Williamson M. P.; Asakura T. J. Magn. Reson., Ser. B 1993, 101, 63–71. [Google Scholar]
- Zhong D. P.; Pal S. K.; Zewail A. H. Chem. Phys. Lett. 2011, 503, 1–11. [Google Scholar]
- Korzhnev D. M.; Billeter M.; Arseniev A. S.; Orekhov V. Y. Prog. Nucl. Magn. Reson. Spectrosc. 2001, 38, 197–266. [Google Scholar]
- Oleinikova A.; Sasisanker P.; Weingartner H. J. Phys. Chem. B 2004, 108, 8467–8474. [Google Scholar]
- Chen Y.; Barkley M. D. Biochemistry 1998, 37, 9976–9982. [DOI] [PubMed] [Google Scholar]
- Scott J. N.; Callis P. R. J. Phys. Chem. B 2013, 117, 9598–9605. [DOI] [PubMed] [Google Scholar]
- Xu J. H.; Chen J. J.; Toptygin D.; Tcherkasskaya O.; Callis P.; King J.; Brand L.; Knutson J. R. J. Am. Chem. Soc. 2009, 131, 16751–16757. [DOI] [PMC free article] [PubMed] [Google Scholar]
- Xu J. H.; Toptygin D.; Graver K. J.; Albertini R. A.; Savtchenko R. S.; Meadow N. D.; Roseman S.; Callis P. R.; Brand L.; Knutson J. R. J. Am. Chem. Soc. 2006, 128, 1214–1221. [DOI] [PubMed] [Google Scholar]
- Qiu W. H.; Li T. P.; Zhang L. Y.; Yang Y.; Kao Y. T.; Wang L. J.; Zhong D. P. Chem. Phys. 2008, 350, 154–164. [Google Scholar]
- Xu J. H.; Knutson J. R. J. Phys. Chem. B 2009, 113, 12084–12089. [DOI] [PMC free article] [PubMed] [Google Scholar]
- Xu J.; Callis P.; Rozeboom H.; Broos J.; Knutson J. Biophys. J. 2013, 104, 681a. [Google Scholar]
- Visser N. V.; Westphal A. H.; Nabuurs S. M.; van Hoek A.; van Mierlo C. P. M.; Visser A.; Broos J.; van Amerongen H. FEBS Lett. 2009, 583, 2785–2788. [DOI] [PubMed] [Google Scholar]
- Yang J.; Zhang L. Y.; Wang L. J.; Zhong D. P. J. Am. Chem. Soc. 2012, 134, 16460–16463. [DOI] [PMC free article] [PubMed] [Google Scholar]
- Grosvenor A. J.; Morton J. D.; Dyer J. M. Amino Acids 2010, 39, 285–296. [DOI] [PubMed] [Google Scholar]
- Liu T. Q.; Callis P. R.; Hesp B. H.; de Groot M.; Buma W. J.; Broos J. J. Am. Chem. Soc. 2005, 127, 4104–4113. [DOI] [PubMed] [Google Scholar]
Associated Data
This section collects any data citations, data availability statements, or supplementary materials included in this article.


