Abstract
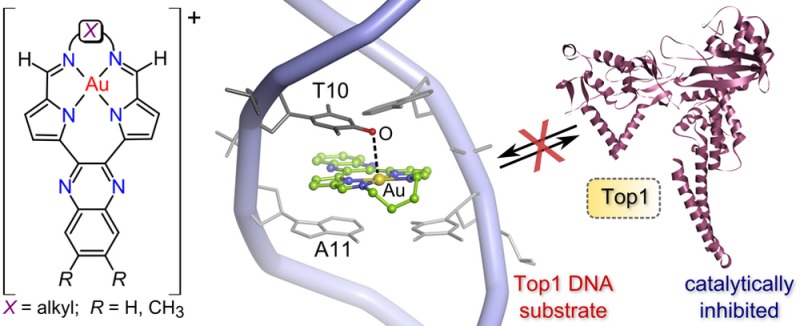
Topoisomerase IB (Top1) is a key eukaryotic nuclear enzyme that regulates the topology of DNA during replication and gene transcription. Anticancer drugs that block Top1 are either well-characterized interfacial poisons or lesser-known catalytic inhibitor compounds. Here we describe a new class of cytotoxic redox-stable cationic Au3+ macrocycles which, through hierarchical cluster analysis of cytotoxicity data for the lead compound, 3, were identified as either poisons or inhibitors of Top1. Two pivotal enzyme inhibition assays prove that the compounds are true catalytic inhibitors of Top1. Inhibition of human topoisomerase IIα (Top2α) by 3 was 2 orders of magnitude weaker than its inhibition of Top1, confirming that 3 is a type I-specific catalytic inhibitor. Importantly, Au3+ is essential for both DNA intercalation and enzyme inhibition. Macromolecular simulations show that 3 intercalates directly at the 5′-TA-3′ dinucleotide sequence targeted by Top1 via crucial electrostatic interactions, which include π–π stacking and an Au···O contact involving a thymine carbonyl group, resolving the ambiguity of conventional (drug binds protein) vs unconventional (drug binds substrate) catalytic inhibition of the enzyme. Surface plasmon resonance studies confirm the molecular mechanism of action elucidated by the simulations.
Introduction
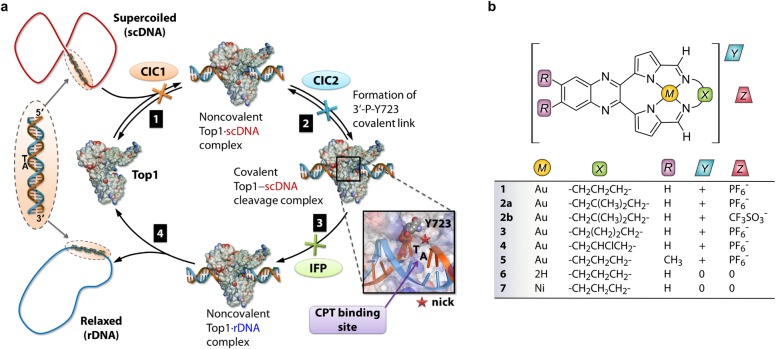
Monomeric human topoisomerase 1B (Top1) regulates DNA topology throughout key cellular events such as DNA replication and gene transcription.1−3 Eukaryotic Top1 relaxes both positively and negatively supercoiled DNA5 and is an established anticancer drug target6 (its inhibition initiates apoptosis7,8 and hence tumor regression). Recent single-molecule nanomanipulation3,9,10 and molecular dynamics11,12 studies of Top1 in the presence and absence of inhibitors and the originally proposed13 catalytic cycle of Top1 may be used to construct a current view of the enzyme’s four-step cycle (Figure 1).
Figure 1.
(a) Illustration of key events in the catalytic cycle of human Top1. Step 1: Top1 binds supercoiled DNA (scDNA; 5′-TA-3′ dinucleotide pair as target). Step 2: nucleophilic attack of the 3′-phosphate linking the TA pair (scissile strand) by Y723 (catalytic tyrosine residue) affords a covalent DNA–Top1 cleavage complex and nicked strand. Step 3: the intrinsic torque stored in scDNA drives ratchet-like rotation about the non-scissile strand until strand religation occurs with concomitant release of Y723. The turnover frequency1 is up to 6000 min–1. The relaxed DNA (rDNA) is then released4 by the enzyme in step 4. Interfacial poisons (IFPs) such as camptothecin (CPT) bind the nick site via 5′-TA-3′ intercalation and H-bonding to Top1 to form a ternary drug·scDNA–Top1 adduct, poisoning the enzyme. CICs operate differently by either blocking substrate recognition by Top1 (type 1 competitive inhibitor, CIC1) or, in principle, preventing the formation of the covalent cleavage complex by blocking the nucleophilic attack of the scissile strand by Y723 (type 2 competitive inhibitor, CIC2). (b) Structures of new cytotoxic pyrrole-based Au3+ macrocycles 1–5, free base macrocycle 6, and the Ni2+ analogue of 1, compound 7.
Drugs that block Top1 fall into two distinct classes: (1) well-characterized interfacial poisons (IFPs) and (2) less common catalytic inhibitor compounds (CICs).6 Currently, all DNA-intercalating IFPs arrest DNA strand religation by non-covalent binding at the nick site of the Top1–DNA cleavage complex,4 poisoning the enzyme midcycle. Known IFPs include camptothecin (CPT) and its analogues and synthetic14 compounds, e.g., indolocarbazoles,14,15 indenoisoquinolines,15−17 dibenzonaphthyridones,18,19 and aromathecins.2,20 Some minor-groove binders that engage Top1’s DNA substrate below the nick site, e.g., Hoechst 33258 and 33342,21 prevent strand religation and are non-interfacial Top1 poisons. The rational design22 of new IFPs and conceptual understanding of how established IFPs work4 is underpinned by X-ray data for the DNA–enzyme complex both in its unpoisoned23 and poisoned23−26 states.
CICs may operate by blocking two key steps in the enzyme’s catalytic cycle: substrate binding or covalent cleavage complex formation. Compounds inhibiting the first step (CIC1) are either conventional competitive inhibitors (binding to Top1) or unconventional competitive inhibitors (binding to DNA). Examples of the former are unknown, but unconventional competitive inhibitors exist and are either DNA intercalators27,28 or minor groove binders29−31 or both.32 Step 2 catalytic inhibitors (CIC2) are currently rather obscure; one recently described indolizinoquinoline-5,12-dione derivative, CY13I, possibly fits this descriptor.33
Of relevance to this study, DNA-binding Au3+ porphyrins34 were classified as Top1 catalytic inhibitors,35 while other Au3+ complexes were initially misassigned as Top1 IFPs35 and hence reclassified as catalytic inhibitors.36 The correct assignment of a compound’s mechanism of action (MOA) with Top1 is not straightforward. The inherent problem is that inhibition of supercoiled DNA relaxation by Top1 alone does not distinguish between the actions of CICs and IFPs nor does it distinguish between conventional and unconventional competitive inhibition.
Since CIC’s do not trap Top1-nicked DNA, DNA damage by this class of compounds is likely to be lower than that caused by IFPs.37 The paucity of Top1 CICs coupled with their anticipated reduced genotoxicity38,39 relative to IFPs creates significant opportunities for drug discovery. Here we report on a new class of cytotoxic macrocyclic Au3+ Top1 CICs (Figure 1) and precise delineation of the MOA of the lead compound, 3.
Results and Discussion
Compounds 1–5 reflect a design evolution over our recently patented class of cytotoxic bis(pyrrolide-imine) Au3+ chelates.40 Specifically, we have employed macrocycles to enhance the redox and chemical stability of the metal ion in conjunction with a quinoxaline ring to augment DNA intercalation. Macrocycles for 1–3 and 5 were synthesized by a literature method.41 Direct metalation of the macrocycle (Route A, Figure S2) was only successful for 1 and 5 (i.e., those macrocycles bridged by a propyl chain). For compounds 2–4 with slightly more elaborate alkyl groups linking the imine nitrogen atoms, a metal-templated cyclization had to be employed (Route B).40 More specifically, the diamine bridge required to effect cyclization of the macrocycle was added after Au3+-binding by the bis(pyrrole-aldehyde) precursor. (Although uncommon, Au3+ ions reportedly template aldehyde and amine condensations.42)
X-ray Structures
We were able to elucidate the structures of compounds 1, 2b, and 3 by single crystal X-ray diffraction (Table S1) despite the ordinarily challenging morphology of the crystals (fine, brick-red needles). Because of the high degree of similitude in the structures of 1–3, particularly the Au3+ ion coordination geometry and macrocycle conformation and the appreciable cytotoxicity of 3 (vide infra), the following discussion is illustrated with selected, typical ion pairs from the asymmetric unit of 3 (Figure 2). The Au3+ ions in salts 1, 2b, and 3 are nominally square planar with Au–N bond distances spanning the range 1.97–2.06 Å. The Au–Npyrrole distances average 1.98(3) Å for all nine cations and are 1.5% shorter than the Au–Nimine bonds, which average 2.01(6) Å (Table S2). This reflects the fact that the pyrrole groups are anionic σ-donors with more acute C–N–C angles than the corresponding C=N–C angles of the imine donors. The coordination group distances are comparable to those of other Au3+ complexes (Au–N: 1.928–2.216 Å).43 The average Npyrrole–Au–Npyrrole and Nimine–Au–Nimine bond angles for the propyl-bridged systems 1 and 2b are 99.6(8)° and 96.5(5)°, respectively. For the six independent cations of 3, these angles average 97.1(9)° and 99.2(6)°. The larger seven-membered chelate ring of 3 accounts for the somewhat more obtuse mean Nimine–Au–Nimine bond angle. The average Npyrrole–Au–Nimine bond angle of 82(1)° is effectively invariant for 1–3.
Figure 2.
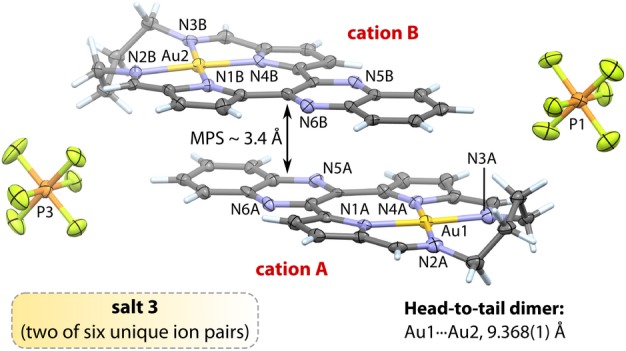
View of the X-ray structure (100 K) of two of six independent ion pairs from salt 3 (50% thermal ellipsoids for non-H atoms; H atoms are shown as capped cylinders). Solvent molecules have been omitted for clarity; selected atom labels are shown. Atom color code: gray, C; lilac, N; orange, P; green, F; gold, Au; pale blue, H. Crystallographic details for 1, 2b, and 3 are given in the Supporting Information. Selected mean bond distances (Å) and angles (°) for all six independent cations of 3: Au–Npyrrole, 1.98(1); Au–Nimine, 2.02(2); C=Nimine, 1.30(3); Npyrrole–Au–Npyrrole, 97.1(8); cis-Npyrrole–Au–Nimine, 81.9(8); trans-Npyrrole–Au–Nimine, 177(1); Nimine–Au–Nimine, 99.2(4). The mean plane separation (3.4 Å) reflects notable π-stacking for both the head-to-tail and oblique dimers of 3.
The cation conformations of 1–3 deviate mildly from planarity mainly in response to crystal packing constraints. In each structure, the cations form π-stacked dimers with head-to-tail (Figure 2) or oblique geometries (Figures S8–S14) characterized by interplanar spacings of ∼3.4 Å, as found in other π-stacked polyaromatic compounds.44,45 There are no aurophilic Au···Au contacts between cations (Au···Au distances >5 Å). The Au3+ macrocycle pairs within dimers of 1–3 exhibit overlaps ranging from 74% in 3 to 89% in 1. Importantly, the π-stacking proclivity of the cations highlights their potential as DNA intercalators.
DNA Binding and Intercalation
The affinity constants, KA, for non-covalent binding of 1–5 to calf-thymus DNA (ctDNA) were determined by fluorometric titrations involving the displacement of intercalated ethidium bromide (EB, Figure 3a). From the loss of EB fluorescence (614 nm) with increasing concentration of 1–5, KA values ranging from 2 × 10⁶ to 4 × 10⁶ M–1 bp were obtained and are similar in magnitude to that reported for a gold(III) porphyrin (3 × 10⁶ M–1 bp).34 The KA values for 1–5 showed no independent linear correlation with either the steric bulk of the macrocycle’s alkyl bridge or the lipophilicity of the cation. However, analysis of KA as a function of both variables concurrently (Figure 3b) gives a significant three-dimensional bivariate linear correlation and confirms that cations with a small alkyl bridge and high lipophilicity, e.g. 5, exhibit the highest KA values. The correlation itself suggests that 1–5 are DNA intercalators since not only are the KA values determined by competitive displacement of a known DNA intercalator (EB)46 but also the monotonic increase in KA with increasing lipophilicity of the compounds clearly reflects binding principally within the relatively non-polar intrahelical space of the duplex DNA target (i.e., between π-stacked bases).
Figure 3.
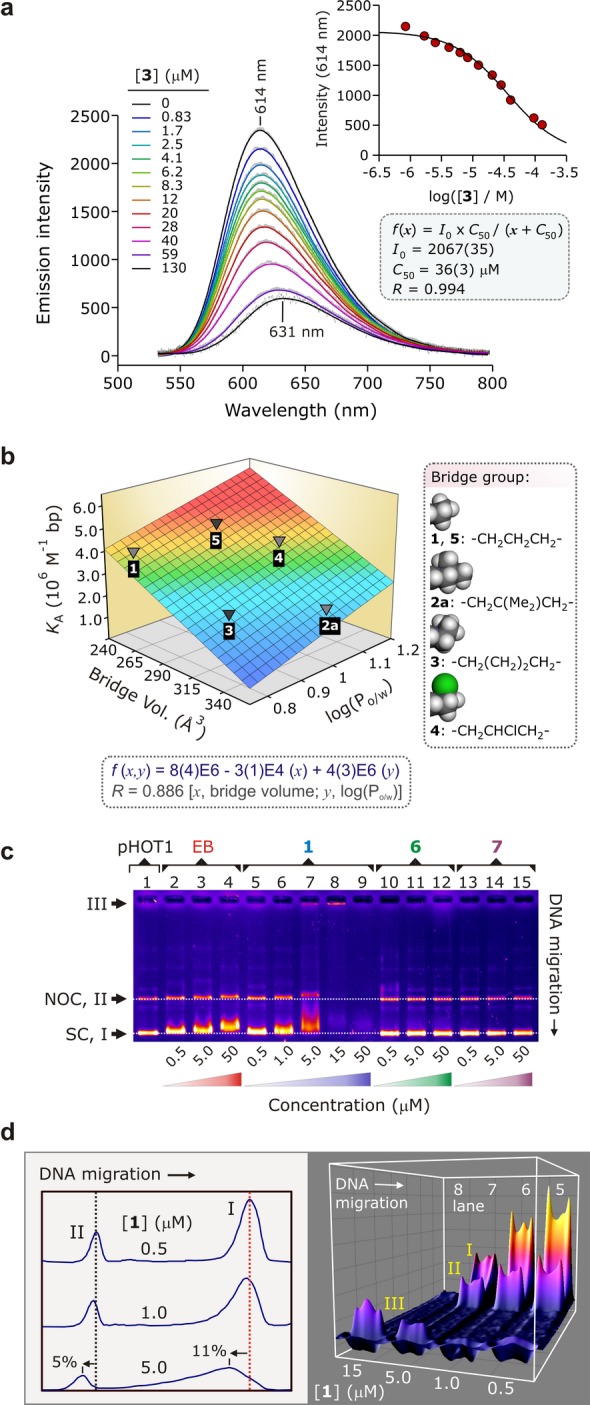
(a) Displacement of intercalated EB from ctDNA by 3 studied by emission spectroscopy (298 K, pH 7.0, 15% DMSO-TRIS/HCl buffer, 15 μM ctDNA, 15 μM EB). Inset: determination of [3] at 50% loss of EB fluorescence (C50); C50 is used to determine the ctDNA affinity constant, KA, of 3. (b) Graph of KA for 1, 2a, and 3–5 as a function of the steric bulk of the macrocycle’s alkyl bridge and the hydrophobicity of the Au3+ complex, log(Po/w) (Table S3). The surface is the best-fit bivariate linear regression function to the data. (c) EMSA of selected compounds with supercoiled (SC, form I) pHOT1 plasmid DNA (DNA, 31.3 ng/well; TBE buffer, pH 7.8); some nicked-open circular (NOC, form II) DNA is present. The lanes contain pHOT1 plasmid DNA (lane 1), increasing concentrations of EB (lanes 2–4), 1 (lanes 5–9), 6 (lanes 10–12), and 7 (lanes 13–15). The data prove that Au3+ is essential for DNA binding. (d) Two- and three-dimensional deconvolution of the DNA bands in lanes 5–8 of the EMSA gel shown in Part (c).
To confirm the intercalation data and examine possible roles for the metal ion, electrophoretic mobility shift assays (EMSAs), thermal denaturation, and DNA unwinding experiments were carried out. Regarding the first of these tests, Figure 3c shows that 1 induces a greater mobility shift for a plasmid substrate (pHOT1, lanes 5–9) than the archetypal reference compound for DNA intercalation (EB, lanes 2–4), despite the comparable ctDNA affinity constants for the two compounds (EB, KA = 5(1) × 106 M–1 bp; compound 1, KA = 4.0(4) × 106 M–1 bp). The large mobility shift induced by 1 reflects marked unwinding of the DNA duplex, consistent with intercalation. Note that supercoiled plasmid DNA is affected most upon binding of 1 (Figure 3d), as evidenced by the 11% mobility shift relative to nicked-open circular DNA (NOC DNA, 5% shift) and very marked band broadening apparent at a concentration of only 5 μM (lane 7). In the case of a negatively supercoiled plasmid with intact double strands, the linking number describing the DNA topology, Lk, must remain constant irrespective of the extent of local unwinding (i.e., change in twist, Tw) induced by the intercalator. To keep Lk constant, Wr, which reflects supercoiling of the plasmid, must adjust according to eq 1:47,48
| 1 |
For Au3+ macrocycle 1, intercalation of negatively supercoiled pHOT1 is expected to reduce the number of supercoils and thus the macromolecule’s supercoil density, thereby significantly impeding its mobility in the gel matrix (as observed).
The three-dimensional plot displayed in Figure 3d further highlights the DNA distribution with increasing [1] in lanes 5–8 and specifically emphasizes the appearance of a third, non-migratory form of DNA (form III, lanes 7 and 8). Two possible explanations for the appearance of this immobile DNA species at higher concentrations of 1 are: (i) aggregation of the DNA·1 adduct(s) occurs, trapping the DNA in the well, or (ii) full charge-neutralization of the DNA takes place. However, the latter explanation seems unlikely since each adjacent dinucleotide pair in dsDNA is bridged by two phosphate groups, each with a formal charge of −1. Intercalation of a monocationic intercalator can thus only neutralize 50% of the total charge on the DNA duplex even if every adjacent dinucleotide pair non-covalently binds to one Au3+ macrocycle, which is improbable. Finally, the apparent “disappearance” of the DNA in lane 9 ([1] = 50 μM) signals either reverse migration of all DNA·1 adducts or complete saturation of the EB binding sites by 1 so that staining of the gel for DNA visualization is ineffective. The latter explanation is the more likely given that formation of a cationic DNA·1 adduct (as would be required for reverse migration of the DNA) is physically highly improbable.
Collectively, the EMSA data for 1 reflect intercalative binding of dsDNA by the Au3+ macrocycle. This conclusion was further tested by concurrent analysis of the metal-free macrocycle (compound 6) and the Ni2+ analogue of 1 (compound 7); neither induces a DNA mobility shift nor in fact displaces EB from DNA in solution. The Au3+ ion is thus obligatory for DNA intercalation by 1–5. That association depends on the presence of Au3+ reflects electrostatic binding of the intercalator to the DNA (as neither 6 nor 7 are charged) and a pivotal ion···dipole interaction formed between the Au3+ ion and a carbonyl oxygen atom of thymine (vide infra).
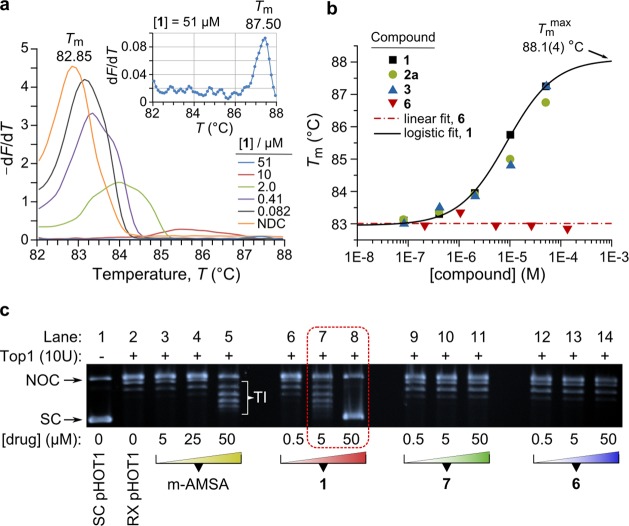
Because the mode of interaction of the Au3+ macrocycles with DNA has to be established unambiguously to determine the mechanism of action underpinning the cytotoxicity of 2a and 3 (vide infra), we performed two additional tests that unequivocally support an intercalative DNA binding mode for the compounds (Figure 4). In the first experiment, thermal denaturation (melting) of a linear 291-bp DNA duplex (an amplicon from exon 15 of the human ACTN3 gene)49−51 was studied as a function of the identity and concentration of the added compound (Table S12). From Figure 4a,b, the melting point, Tm, increased in sigmoidal fashion with increasing concentration of 1–3, consistent with the enhanced thermal stability that is expected to accompany uptake of an intercalator.52,53 Significantly, no change in Tm was observed for 6 over the full concentration range. The values of ΔTm (the change in melting point relative to the control) were +4.65, +3.90, and +4.40 °C for compounds 1–3, respectively, when measured at their highest concentrations (∼50 μM). From Figure 4b, the dose–response function for 1 gives the saturating value of the melting point increase, ΔTmmax = +5.1(4) °C. The ΔTm values determined here are in good agreement with those reported for the metallointercalators [Co(pic)2(dppz)] (+4.4 °C), where pic = picolinate and dppz = dipyrido[3,2-a:2′,3′-c]phenazine,54 and [Ru(NH3)4(dppz)]2+ (+5.2 °C)55 as well as organic protoberberine derivatives (+2.9 to +6.4 °C).56 Other dppz-based metallointercalators, however, exhibit ΔTm values as large as +14 °C.52
Figure 4.
(a) HRM curves for a linear 291-bp dsDNA fragment (pH 8.4) derived from the human ACTN3 gene as a function of the concentration of 1. The plot reflects the negative first derivative of the fluorescence intensity (−dF/dT, 510 nm) from the DNA-intercalating reporter dye (CYBR Green) used to monitor strand separation. (NDC; no drug control, DMSO.) (b) Plot of the melting temperatures, Tm, against the concentrations of three Au3+ macrocycles and the metal-free macrocycle 6. The zero-slope fit for 6 has an intercept, Tm, of 83.0(1) °C and reflects the mean value of Tm for the amplicon (since 6 does not interact with the DNA). The dose–response function for 1 is: Tm = Tm0 + (Tmmax – Tm0)/(1 + (C/EC50)p), where C is the molar concentration of 1. The fit parameters were: Tm0 = 82.95(9) °C; Tmmax = 88.1(4) °C; EC50 = 9(2) × 10–6 M; p = 0.9(1); χ2 = 0.013; R2 = 0.996. (c) DNA-unwinding assay to prove intercalative binding by 1. Lane 1, supercoiled pHOT1 plasmid DNA; lane 2, relaxed pHOT1 plasmid (effected by incubation with 10 units of Top1 for 30 min at 37 °C); lanes 3–5, increasing concentrations of the intercalator control m-AMSA added to relaxed pHOT1; lanes 6–14, increasing concentrations of compounds 1, 7, and 6 added to relaxed pHOT1 as indicated. Abbreviations: NOC, nicked-open circular DNA; SC, supercoiled DNA; RX, relaxed; TI, DNA topoisomer bands; m-AMSA, 4′-(9-acridinylamino)methanesulfon-m-anisidide.
Several factors will determine the measured value of ΔTm (beyond the identity of the primary intercalating group). These include the nature of the ancillary ligands, the base sequence of the dsDNA substrate (since this governs the density of binding sites for base pair-specific intercalators), the solution conditions (pH, buffers, salts57), and the experimental method. The method used here evidently affords reliable data over a wide concentration range, permitting measurement of ΔTmmax. However, as shown in Figure 4a, some caution in evaluating the data is required at higher compound concentrations when the signal is weak (−dF/dT < 0.1). For 1–3, the signal vanishes above doses of ∼50 μM. The loss of signal intensity in the experiment reflects two main processes: (1) The release of CYBR Green (an intercalating dye that binds AT base pairs in dsDNA via minor groove entry58) upon strand separation and, consequently, quenching of its emission by torsional motion in its non-intercalated state.57 This is the physical basis underpinning melt analysis with the high-resolution melt (HRM) method available in commercial real-time PCR machines. (2) Competition between the dye and intercalator for binding sites along the length of the dsDNA substrate. This is evident from the dose-dependent decrease in the emission signal from the dye at a fixed temperature in Figure 4a and accounts for the vanishing signal at high concentrations of 1–3. These points noted, our conclusion that 1–3 are DNA intercalators remains unambiguous. Further, from the data for 6, the irremissibility of the Au3+ ion for DNA intercalation is again evident.
In the second experiment, we used a standard DNA unwinding assay59 designed to identify intercalators from their interaction with DNA in the presence of Top1 (Figure 4c). The method was first described by Hsiang et al. in 198560 and elaborated on by Pommier et al. in 1987.48 In our experiment, pHOT1 plasmid DNA was first relaxed by incubation with 10 units of Top1 for 30 min at 37 °C (lane 2). Increasing concentrations of the test compounds were then added, and the solutions incubated for a further 30 min interval at 37 °C prior to workup and analysis. The DNA intercalator control m-AMSA gave the expected Gaussian distribution of DNA topoisomers (characterized by a linking number change, ΔLk, of ±1)48,61 at a concentration of 50 μM after workup. The same topoisomer band distribution was observed at a concentration of only 5 μM in the reaction with 1 (lane 7), consistent with 1 being a more potent DNA intercalator than m-AMSA. At a higher concentration (50 μM), 1 returns the plasmid to its fully supercoiled state (lane 8). The reactions with the Ni2+ analogue of 1 (compound 7) and the metal-free macrocycle 6 confirm that neither intercalate DNA since the signature dose-dependent Gaussian distribution of topoisomer bands is noticeably absent in lanes 9–14. Similar results were obtained running the reaction the other way48 (i.e., starting with supercoiled pHOT1; Figure S54). The observations for 1 in lane 8 merit further reflection. As discussed in the literature48,62 and Supporting Information, the method used is incapable of determining whether the scDNA product obtained at high concentrations of the intercalator is: (1) positively or negatively supercoiled or (2) the result solely of intercalator-induced torque or, alternatively, inhibition of Top1. From lane 8 in Figure 4c, it is therefore possible that 1 may be an inhibitor of Top1, but this cannot be concluded with certainty in the absence of definitive mechanistic tests (e.g., tests that can discriminate between an IFP and a catalytic inhibitor of the enzyme).
Cytotoxicity
Compounds 1–5 were prescreened by the National Cancer Institute (NCI, Bethesda, MD) against their panel of 60 human cancer cell lines; 2a and 3 were sufficiently cytotoxic to warrant full five-dose screens and 3 proceeded to in vivo hollow-fiber studies (Figures S35–S43, Table S6). Table 1 lists average cytotoxicity parameters for 3 grouped by cancer type. The mean IC50 value across all cell lines for the Au3+ macrocycle is 16(7) μM; the large standard deviation reflects considerable variation in the cytotoxicity of the compound across each group of cell lines (as highlighted by the radar plot of Figure 5). Leukemia, central nervous system (CNS), and colon cancer were the most sensitive cancer types to 3. Importantly, a total of 19 (out of 57) cancer cell lines had IC50 values for compound 3 that were <5 μM, accounting for selection of 3 by the NCI for in vivo hollow-fiber assays (Table S7, Figures S42 and S43). The five most sensitive cell lines were NCI-H522 (non-small lung cancer, IC50 = 280 nM), RXF-393 (renal cancer, IC50 = 1.3 μM), SF-268 (CNS cancer, IC50 = 1.4 μM), SW-620 (colon cancer, IC50 = 1.5 μM), and LOX-IMVI (melanoma, IC50 = 1.7 μM). In the NCI’s non-tumored animal toxicity assay with female athymic nude mice (Figure S42), compound 3 was remarkably well tolerated as reflected by a 100% survival rate after 17 days for doses ranging from 100 to 400 mg kg–1 dose–1 (intraperetoneal injection). Despite these encouraging data, 3 was insufficiently cytotoxic in the majority of the cell lines tested in the NCI’s hollow fiber cytotoxicity assay to warrant progression to the next investigational phase (tumor xenograft studies in live mice). Notwithstanding the lower than desired activity of 3 in the hollow fiber assays, we believe that 3 and its structural congeners represent an important group of compounds that have the potential to be developed into novel metallodrug lead candidates with relatively low side-effects because of the in vivo stability of the macrocyclic Au3+ complex. Going forward, absorption, distribution, metabolism, and excretion studies are clearly warranted in the case of 3 and may well delineate the factors that reduce the efficacy of the compound in live animals.
Table 1. Summary of Cytotoxicity Parameters for Compound 3 from a Five-Dose Screen against the NCI’s Panel of 60 Human Cancer Cell Linesa.
| cancer | N | GI50, μM | IC50, μM | LC50, μM |
|---|---|---|---|---|
| leukemia | 3 | 1(1) | 5(1) | >100 |
| non-small cell lung | 9 | 6(5) | 15(13) | 97(6) |
| colon | 7 | 7(5) | 10(6) | 89(16) |
| CNS | 6 | 3(2) | 10(8) | 50(32) |
| melanoma | 9 | 8(5) | 27(20) | >100 |
| ovarian | 7 | 11(8) | 19(14) | 94(11) |
| renal | 8 | 14(12) | 25(21) | 89(24) |
| prostate | 2 | 7(4) | 16(11) | >100 |
| breast | 6 | 5(4) | 17(14) | 57(38) |
| average | 57b | 7(4) | 16(7) | 86(19) |
Abbreviations: N, number of cell lines within each cancer category; GI50, compound concentration effecting 50% growth inhibition; IC50, compound concentration effecting 100% growth inhibition; LC50, compound concentration that induces 50% cell death.
Total number of cell lines used. Estimated standard deviations are given in parentheses; large values indicate variable susceptibility of a specific group of cell lines to the test compound (see Figure S41).
Figure 5.
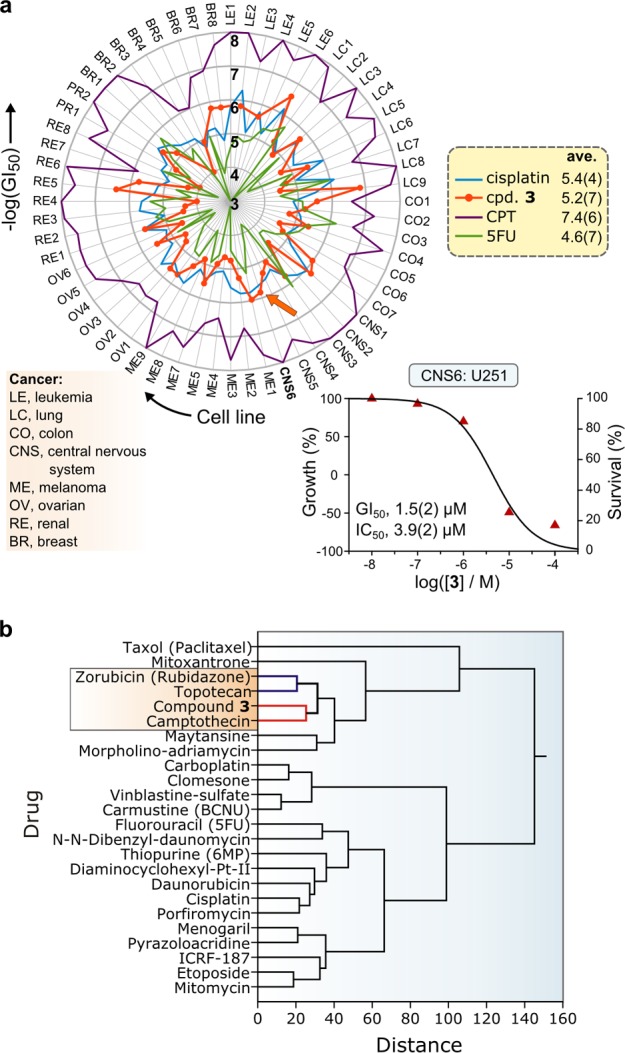
(a) Radar plot of −log(GI50) values vs cancer cell line from the NCI-60 cytotoxicity screen for 3 against their panel of 60 human cancer cell lines. Comparative data for cisplatin, camptothecin (CPT), and 5-fluorouricil (5FU) are shown to illustrate the cell-line dependent response to the drugs as well as their effective cytotoxic range [mean −log(GI50) values are given in the legend]. The graphical inset illustrates the dose–response function for 3 with the CNS cancer cell line U251 (the relevant GI50 value is indicated by the orange arrow on the radar plot). (b) Hierarchical cluster analysis (group average method, Minkowski distances) of the GI50 data for 3 with analogous data for 26 anticancer drugs with known mechanisms of action (data taken from the NCI database). Compound 3 clusters with camptothecin (a Top1 IFP).
Since release of an exogenous metal ion by a ligand system in a live animal is often the cause of acute toxicity,63 an important question to answer prior to determining the MOA of a metallodrug candidate is how stable the compound is in aqueous solution, especially in the presence of cellular reducing agents such as glutathione. We found that the Au3+ macrocycles of this study were both redox stable and essentially non-aggregating under biologically pertinent conditions (Figures S15 and S16), which might at least partly explain the fact that 3 was particularly well-tolerated in mice and essentially non-toxic even at the highest test concentration of 400 mg kg–1.
From the graph of log(GI50) values for 3 against all 60 tumor cell lines (Figure 5a), compound 3 is comparable to cisplatin and midway between the limits of highly and mildly cytotoxic compounds such as topotecan (a Top1 IFP) and 5-fluorouricil (a clinically deployed antimetabolite), respectively. In order to identify the MOA and hence the cellular target(s) of 3, the GI50 data for 3 were compared with equivalent data for 26 compounds of known MOA from the NCI’s database using hierarchical cluster analysis (Figure 5b). The cytotoxicity profile of 3 is clearly akin to that of CPT, the archetypal Top1 IFP. Although the statistical data strongly suggest that 3 targets Top1 in tumor cell cultures, they do not prove that 3 is an IFP of Top1. Unambiguous determination of the MOA is essential to definitively assign 3 as a Top1 IFP or Top1 CIC.
Enzyme Targeting
Cyril and Muller’s recent solid-phase enzyme inhibition assay64 capable of distinguishing between Top1 IFPs and CICs was used to elucidate the MOA of 3 (Figure 6a). The assay employs Top1 immobilized in Ni2+-coated wells. Added IFPs trap DNA covalently bound to Top1 during enzyme turnover, which is subsequently detected by an enhanced fluorescence signal from the DNA-sensing dye PicoGreen. CICs of Top1 do not result in covalently trapped DNA, favoring diminished emission from the reporter dye with increasing compound concentration. At concentrations of 100 μM, 1–4 all give a negative readout (PicoGreen relative fluorescence) akin to the signal obtained from the CIC control (mitoxantrone, MTX). From this assay, 1–4 are clearly catalytic inhibitors of Top1 at higher concentrations.
Figure 6.
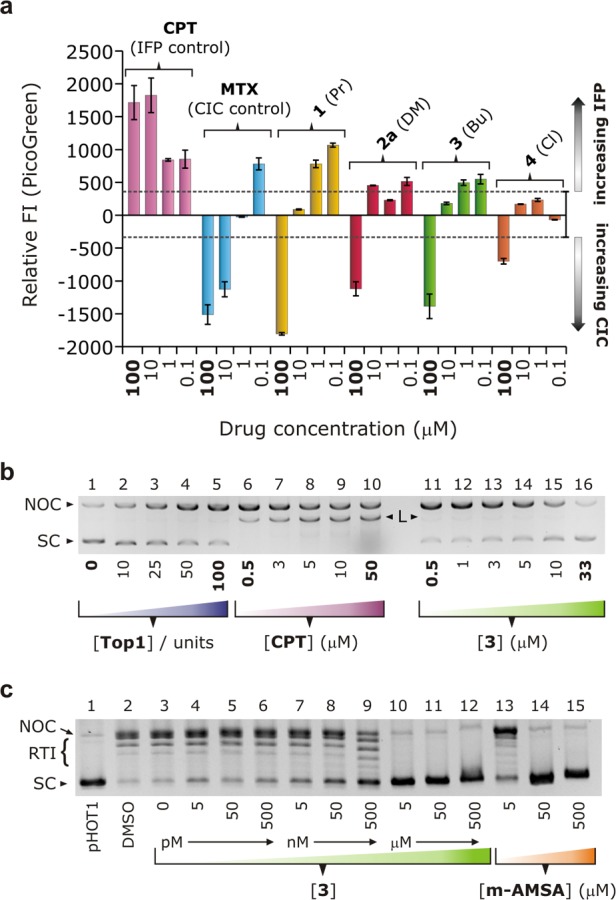
Enzyme target and mechanism assignment. (a) Relative fluorescence intensity from DNA-bound PicoGreen (525 nm) vs the concentration of two drug standards (CPT and mitoxantrone, MTX) and 1–4. The assay measures covalent Top1–DNA trapped by the test compound, distinguishing between IFPs and CICs. The data are corrected for background emission (range indicated by the dashed lines). (b) Proof of catalytic inhibition of Top1 by compound 3 using a gel-based product-trapping assay (high enzyme:DNA ratio, 0 mM NaCl, [pHOT1] = 31.3 ng/well in all reactions). Lanes 1–5: enhanced yield of nicked-open circular DNA (NOC DNA) with increasing [Top1]. Lanes 6–10: effect of increasing [CPT] from 0.5 to 50 μM (100 units of Top1). Lanes 11–16: catalytic inhibition of Top1 (100 units) with increasing [3] attenuates the yield of NOC DNA (linear DNA, L, is essentially absent above a dose of 1 μM). (c) Standard scDNA relaxation assay for 3 and the DNA-intercalator m-AMSA. Lanes 1–3: pHOT1 DNA alone, DMSO control, and Top1-mediated relaxation of the substrate (no inhibitor present), respectively. Lanes 4–12: inhibition of Top1 with increasing [3] (complete inhibition occurs at 5 μM). m-AMSA only completely inhibits Top1 at 50 μM (lanes 13–15).
This result was confirmed for 3 using a novel assay designed to trap Top1–DNA complexes using ultra-high enzyme:DNA ratios65 (Figure 6b). In lanes 1–5, increasing [Top1] at a fixed [DNA] in the absence of NaCl (ensuring a high DNA affinity for Top1) increases the yield of NOC DNA in the reaction. This is the expected result as we previously reported66 that endogenous Top1 may “cluster” at catalytic sites on genomic DNA in situ. Importantly, at high [Top1] and in the presence of an IFP like CPT, multiple single-strand cleavages afford double-strand breaks and thus linear DNA after workup. An IFP of Top1 is therefore identified by its ability to generate linear DNA in the assay. Lanes 11–16 confirm that 3 is not an IFP of Top1 (no linear DNA); rather, the dose-dependent drop in [NOC DNA] reflects catalytic inhibition of Top1 by 3.
From Figure 6a, both 1 and MTX give a similar (positive) readout to CPT at doses of 0.1 and 1 μM, suggesting that they are Top1 IFPs at low concentrations. The switch to catalytic inhibition of Top1 occurs at higher doses (∼1–10 μM). This was confirmed for 1 by integrating the dose-dependent linear DNA band intensities in a gel equivalent to that shown in Figure 6b. From Figure S56, the concentration of linear DNA increases with increasing [1] up to 500 nM, thereafter exhibiting a sigmoidal decrease consistent with catalytic inhibition of Top1 at higher doses. Dual-mode inhibition of topoisomerases is well-known for Top2α65,67,68 and is equally feasible, though rarely observed, for Top1. Compounds such as doxorubicin target the DNA nick-sites in the enzyme–DNA covalent cleavage complex at low doses, poisoning the enzyme, but intercalate the DNA substrate at higher concentrations, engendering catalytic inhibition.67 Mechanistically, a large association constant, KA1, exists for formation of the ternary drug·DNA–enzyme covalent cleavage complex, while a smaller association constant, KA2, exists for intercalation of the enzyme’s DNA substrate.65 Because the two assays used here each permit a distinction to be made between Top1 IFPs and catalytic inhibitors in a single experiment, they are ideal for detecting dual-mode inhibitors. Consequently, 1 can be firmly assigned as a dual-mode (IFP-CIC) Top1 inhibitor. Compounds 2a–4, in contrast, are simple CICs.
In the conventional Top1 DNA relaxation assays (TopoGEN, Inc.; Figure 6c), 3 showed marked inhibition of the enzyme at 500 nM and complete inhibition of the enzyme at a dose of 5 μM (lanes 9 and 10). When compared with the activity of the DNA intercalator control m-AMSA (lanes 13–15), compound 3 engenders equivalent inhibition of the enzyme at one-tenth of the concentration. Collectively, the data in Figure 6 demonstrate that the Au3+ macrocycles are Top1 CICs. Furthermore, we estimate that the method-dependent IC50 values for 3 are 49(2) nM and 9.2(5) μM from the assays in Figure 6c,b, respectively (Figures S44 and S45). Notably, these assays neither distinguish between conventional (drug binds enzyme) and unconventional (drug binds substrate) catalytic inhibition of Top1 nor between type 1 and 2 CICs of the enzyme. However, since the DNA affinity of 1–5 has been established with certainty, the compounds may be tentatively assigned as unconventional CICs of Top1. (It is important to note that concrete assignment of the above mechanism requires an independent experiment to prove that the compounds do not bind to the enzyme itself; vide infra.)
Finally, since hierarchical cluster analysis of the NCI-60 data for 3 indicated a moderately close link between the in vitro cellular target(s) of the Au3+ macrocycle and zorubicin (a Top2α poison), we evaluated the compound’s ability to inhibit Top2α. The results (Figure S55) indicate that 3 is a weak catalytic inhibitor of the enzyme, as evidenced by an inhibitory effect commencing only at a relatively high compound dose of 50 μM. Since no linear DNA was detected in the assay, compound 3 is not an IFP of the enzyme. Evidently, 3 does not target type II topoisomerases to the same extent as Top1. From this, we conclude that 3 is a type I-specific CIC.
Binding Site Determination
If Top1’s DNA substrate is targeted by 3, then where does intercalative binding of 3 occur? One cannot naively assume that because 3 is a type 1 CIC of Top1 (Figure 1), it binds to precisely the same nucleotide sequence as the enzyme. We have used a conformational search strategy with an empirical force field parametrized for macromolecular simulations to accurately locate the binding site of 3.
Because most molecular mechanics (MM) simulation programs lack parameters for metal complexes, the X-ray data for 1–3 (nine independent experimental structures) were first used to develop a force field for the Au3+ macrocycles. We augmented the SP4 force field (within AMMP)69 with parameters to model 1–5 and related Au3+ chelates. The new force field rivals density functional theory (DFT) in structural accuracy but at a fraction of the computational cost (Table S2; Figures S5 and S6). We then devised a conformational search strategy (Figures 7a and S7) to determine the energetically preferred intercalation point for 3 along the length of the 22-bp DNA duplex typically employed for X-ray structure determinations of Top1 with its DNA substrate (Figure 7d).23 (In this respect it is noteworthy that classical force fields perform surprisingly well when compared with computationally expensive high-level quantum chemical simulations for calculations of both the structure of DNA and, importantly, base-pair stacking energies.70)
Figure 7.
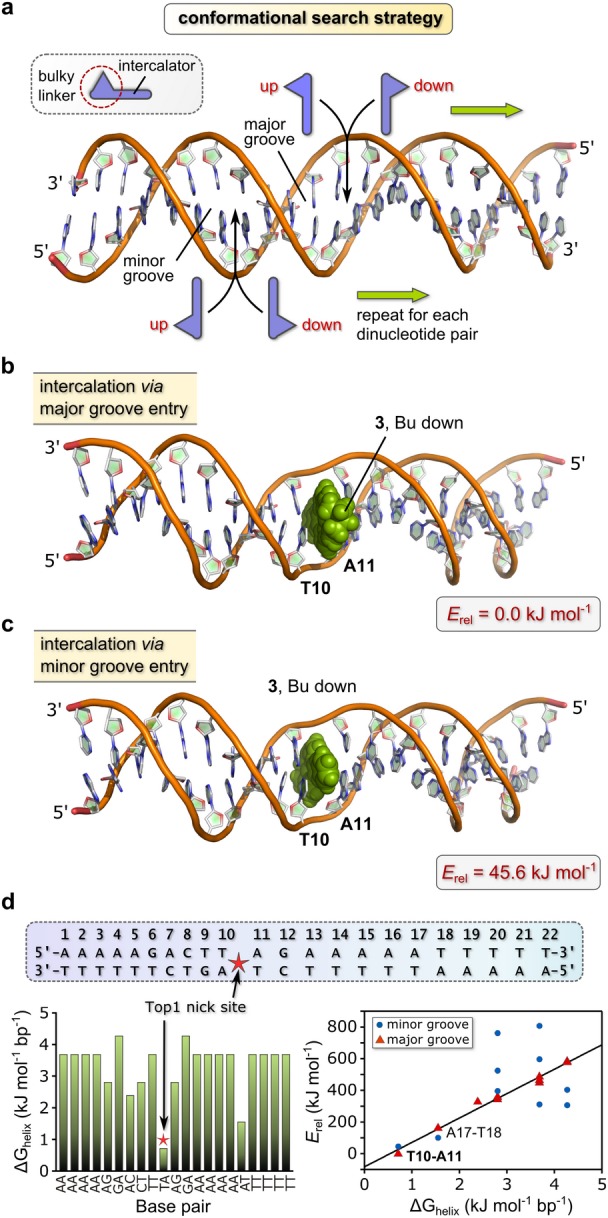
Binding site determination for 3. (a) Conformational search strategy with a 22-bp DNA duplex sequence [Part (d)] favored by Top1 and a modified SP4 force field for macromolecular simulations. A macrocycle such as 3 may intercalate between an adjacent base pair in one of four energetically distinct ways. The search proceeds in a manner akin to stepping down the rungs of a ladder. (b) Structure of the lowest-energy conformation of DNA·3. The compound intercalates at the 5′-TA-3′ site (T10-A11) via major groove entry. (c) Structure of the next-lowest energy conformation (minor groove T10-A11 intercalation adduct) of DNA·3. The higher energy of this adduct reflects, in part, the non-planar conformation for the DNA-bound Au3+ macrocycle relative to the global minimum. (d) Graph of thermodynamic stability vs base pair (left) for the 22-bp DNA duplex. ΔGhelix is the empirical free energy penalty for strand separation at the specified base pair. Right: graph of the relative energies of all simulated DNA·3 intercalation adducts vs ΔGhelix. The best-fit straight line for the major groove adducts is given by: Erel = 154(6) (ΔGhelix) – 83(20) kJ mol–1; R2 = 0.985.
The lowest-energy conformation (Figure 7b, Table S5) has 3 intercalated at a 5′-TA-3′ site (T10-A11) via the major groove. The butyl chain of the macrocycle juts out into the major groove, oriented downstream (5′ to 3′). The next lowest-energy conformation (Erel = 45.6 kJ mol–1, Figure 7c) has 3 intercalated via the minor groove (butyl chain oriented downstream) at the same dinucleotide pair (T10-A11). Minor groove intercalation yields a less stable non-covalent adduct than major groove intercalation at a TA step for several reasons, as depicted in Figure 8 (and Figures S46 and S47) and enumerated at this juncture. (1) In contrast to the major groove intercalation adduct where both pyrrole rings and parts of the quinoxaline ring of 3 are involved in π–π stacking with A and T, only the edges of the quinoxaline ring of 3 interact with these bases in the minor groove intercalation adduct. (2) The extent of insertion of the macrocycle into the intrahelical space is markedly less in the minor groove intercalation adduct. (3) The Au3+ macrocycle is forced to adopt a somewhat more distorted (non-planar) conformation in the minor groove intercalation adduct, which leads to a 5.58 kJ mol–1 increase in the torsional strain energy relative to the conformer that best-fits the binding pocket by major groove entry. (The total energy difference between the two Au3+ macrocycle conformations is 4.94 kJ mol–1, with the conformer intercalated via major groove entry lowest in energy.) (4) Electrostatic interactions between the Au3+ ion and heteroatoms (O, N) of either A or T in the minor groove adduct are absent (Figure 8b). Significantly, when embedded within the T10-A11 binding pocket the lowest-energy major groove intercalation adduct of 3 exhibits a short Au···O contact (3.13 Å) involving the nearest carbonyl oxygen of T10 and the Au3+ ion. This electrostatic interaction (primarily an ion–dipole attraction) evidently makes a vital contribution to the overall stability of the DNA·3 non-covalent complex. Perhaps most significantly, the conformational search gives the base pair specificity of 3 when the unique intercalation adducts are ordered from lowest energy (highest affinity) to highest energy (lowest affinity):
where superscripts (j) and (i) are major and minor groove insertions, respectively.
Figure 8.
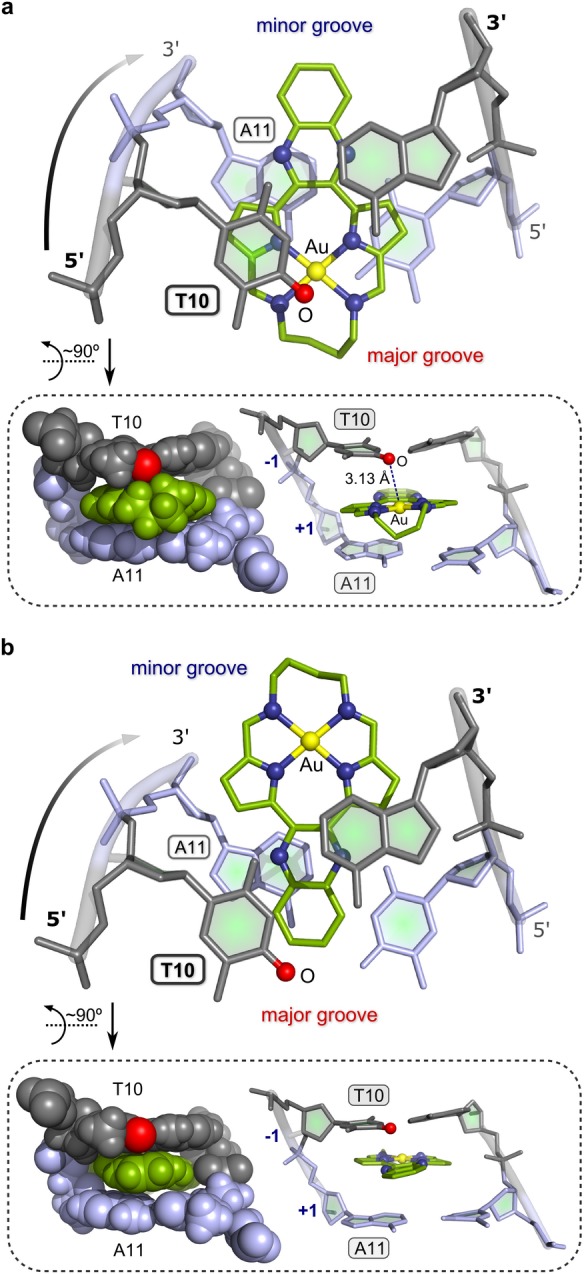
(a) View (roughly perpendicular to the AuN4 plane) of the AMMP/SP4-simulated structure of the binding pocket (T10-A11) of the lowest-energy intercalation adduct of 3 with the 22-bp DNA duplex given in Figure 7d. The π-stacking between the bases and the pyrrole and quinoxaline rings of 3 is highlighted along with the juxtaposition of a T10 carbonyl oxygen atom (red sphere) and the Au3+ ion (yellow sphere) of the intercalator. The Au···O distance is 3.13 Å. (b) Top view of the minor groove intercalation adduct highlighting partial intercalation of the Au3+ macrocycle and the practically negligible π–π overlap of the pyrrole rings with the bases of the binding pocket. This view explains why the minor groove T10-A11 intercalation adduct is 45.6 kJ mol–1 higher in energy than the lowest-energy conformation. In both structures, the DNA is rendered as a stick model in shades of gray and lilac, H atoms are omitted for clarity, and 3 is shown as a ball and stick model (C, green; N, blue; Au, gold). The two inset illustrations show edge-on projections viewed from the major to minor groove of the upper structure in both cases (left image, van der Waals radii including H atoms; right image, ball and cylinder model with H atoms omitted for clarity).
Independent verification of the above prediction that the intercalation site for 3 (T10-A11) precisely matches Top1’s target site for strand scission is mandatory. The experimental thermodynamic stabilities of the 10 possible nearest-neighbor interactions (e.g., AA/TT, AT/TA, etc.) present in a DNA duplex are known71 and underpin the empirical algorithm used to calculate the free energy penalty for helix unwinding (ΔGhelix) by the program WEB-THERMODYN.72 We used this method with a sliding window of two adjacent nucleotides to analyze the 22-bp DNA duplex of interest (Figure 7d). As shown by the bar graph, the stability of the adjacent nucleotide pairs follows the order: TA < AT < AC < AG ≅ CT < AA = TT < GA. The free energy penalty for separating the nucleotide pair 5′-TA-3′ is thus the smallest (<1 kJ mol–1). The fact that Top1 has evolved to effect single-strand scission of duplex DNA at a 5′-TA-3′ site, a thermodynamic weak point in the double helix, is noteworthy. It is also clear that a metallointercalator such as 3 similarly targets a 5′-TA-3′ site in duplex DNA and that because 3 and Top1 share the same DNA target (substrate), compound 3 will necessarily function as a type 1 unconventional catalytic inhibitor of the enzyme.
The scatter graph (Figure 7d) compares the relative energies of the DNA·3 adducts with ΔGhelix for dinucleotide pair separation. A good linear relationship exists for adducts formed by binding/entry of the intercalator via the major groove (but not the minor groove). Clearly, the stability order (base pair specificity) for the major groove DNA intercalation adducts of 3 parallels the thermodynamic stability of the dinucleotide pairs along the 22-bp sequence because the intercalator binds via the major groove and has to part the bases, thereby locally unwinding24 the helix at the intercalation point.
DNA Conformation
Both major and minor groove intercalation of 3 at the energetically favored T10-A11 step in the 22-bp duplex lead to a number of characteristic conformational perturbations of the DNA. We used the program W3DNA73,74 to quantify these effects at the level of individual steps (i.e., complementary base pairs) using the AMMP-calculated structure of the intercalator-free 22-bp DNA duplex (shown in Figure 7a) as a conformational reference. The data are available in Tables S9–S11. Figure 9 graphically depicts the most significant of the metallointercalator-induced conformational perturbations. Relative to the reference B-form 22-bp duplex, which has a mean propeller twist, π, of −11.9(2)°, the binding of 3 by either major or minor groove intercalation at the T10-A11 step shifts the propeller twist from the range −30° to −15° to between −5 and 0° immediately after the intercalation point, after which π returns to ca. −25° (Figure 9a). The reduction in propeller twist reflects the more regular, coplanar arrangement of the DNA bases which come into direct contact with the aromatic intercalator through π-stacking; the local ordering of the bases evidently extends from A11 to G12, but no further. Figure 9b highlights the marked buckling of the base pairs induced by intercalation of 3 at the T10-A11 step through either the major or the minor groove. The mean buckling parameter, κ, for the reference B-form 22-bp duplex measures 0(3)°, as expected for an unperturbed B-form DNA conformation.75 The intercalation of 3, in contrast, leads to substantial buckling of the base pairs up- and downstream of the intercalation point with κ averaging −3(8)° over the full 22-bp duplex for both intercalation adducts. The swing or reversal in κ from ca. −12° immediately upstream of the intercalation point to ca. +12° immediately downstream of the T10-A11 step is pronounced; such a conformational perturbation has been previously noted for the structure of adriamycin-intercalated DNA.76 The intercalation of 3 at the T10-A11 step is further characterized by reverse opening (σ) of the 10-TA and 11-AT base pairs (σmax = +10.1° for the 10-TA pair of the minor groove adduct) relative to the reference B-form 22-bp duplex for which σ = −10(1)° (Figure 9c). Finally, as expected the rise between adjacent bases in the stack, Δz, increases at the intercalation point because the intercalator assumes the position of a hydrogen-bonded base pair in the stack.75,77 This is depicted graphically in Figure 9c where the 11-AT pair clearly exhibits Δz values of 7.2 and 7.0 Å for the major and minor groove intercalation adducts, respectively. The calculated Δz values are consistent with the experimental values for base rise that accompany the presence of a DNA-bound intercalator (ca. 6.1–7.3 Å).46,76−78
Figure 9.
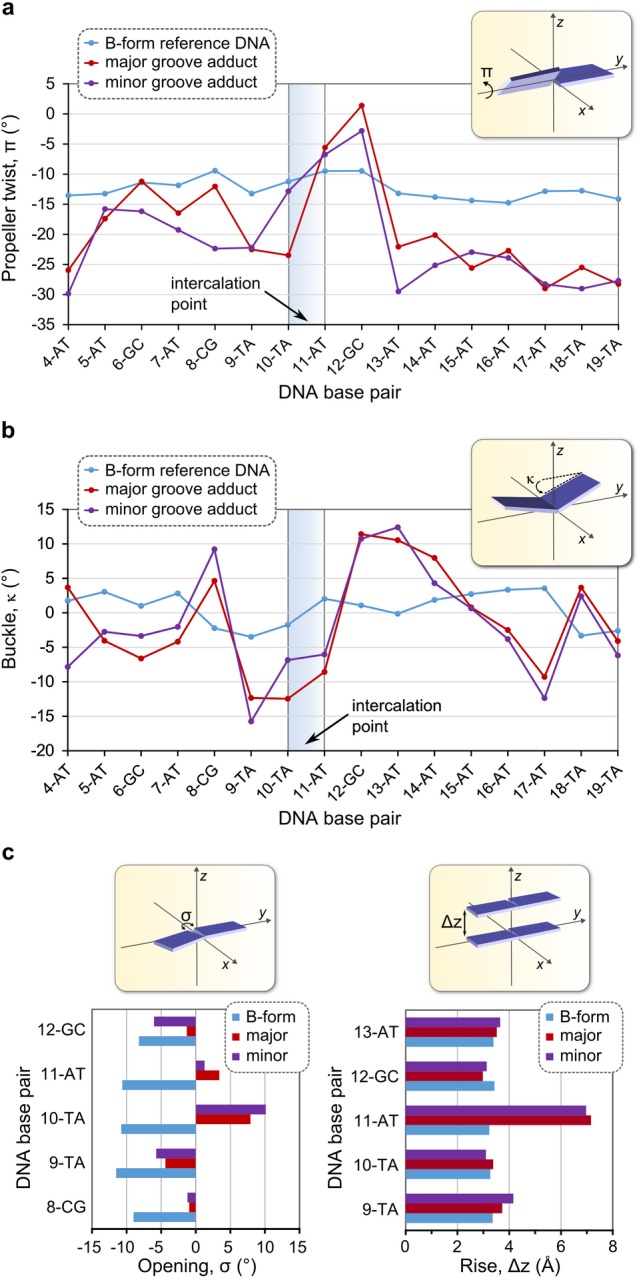
Analysis of key conformational parameters for the two lowest-energy DNA·3 adducts formed by major and minor groove intercalation of the Au3+ macrocycle at the T10-A11 step of the 22-bp duplex depicted in Figure 7. (a) Graph of propeller twist (π) as a function of base pair index for bases 4–19. (b) Graph of buckling angle (κ) as a function of base pair index for bases 4–19. (c) Bar graphs of base-pair opening (σ, left) and rise (Δz, right) for selected base pairs close to the intercalation point.
Metallointercalation at TA Sites
Do other metallointercalators bind at 5′-TA-3′ steps in duplex DNA? Although a range of base pair specificities seem to exist for metallointercalators and are probably ligand and metal ion dependent, the recently determined X-ray structure of DNA-bound Λ-[Ru(phen)2(dppz)]2+,79 where phen is 1,10-phananthroline, showed that the most symmetric (of many) intercalative binding modes for this cationic minor groove metallointercalator involved a 5′-TA-3′ site in a palindromic duplex DNA sequence that was characterized by deep intromission of the dppz ligand into the DNA intrahelical space in a manner akin to the major groove intercalation adduct calculated for 3 (Figure 8a). (Note that the quinoxaline ring of 3 is essentially two-thirds of the phenazine ring system in dppz, so the intercalative components of the two ligand systems are to a substantial extent comparable.) Interestingly, Λ-[Ru(phen)2(dppz)]2+ did not intercalate at a 5′-AT-3′ site in an analogous palindromic duplex DNA sequence.79
Despite the different trajectories preferred for DNA intercalation by 3 and Λ-[Ru(phen)2(dppz)]2+, the foregoing experimental observation of TA over AT specificity parallels the thermodynamic DNA base pair specificity determined here for 3 using macromolecular simulations. Note that the coordinatively saturated metal ion in Λ-[Ru(phen)2(dppz)]2+ does not interact with any DNA bases and that the phen ligands seemingly direct the trajectory of intercalation (minor groove to major groove) through non-covalent interactions with the minor groove nucleotides at the binding site. Interestingly, the X-ray structure of DNA-bound Δ-[Ru(bpy)2(dppz)]2+, where bpy is 2,2′-bipyridine, exhibits similar minor groove intercalation, but with a rather different dinucleotide pair specificity to the former Ru2+ complex (binding at central and terminal 5′-AT-3′ and 5′-CG-3′ steps, respectively, being favored).80 Since the two Ru2+ complexes under discussion differ only in their ancillary ligand pairs (phen vs bpy), the non-innocence of the co-ligands in directing (at least partly) the site of dppz intercalation is highlighted. The intercalation mode calculated here for 3 is therefore distinct, more closely parallels that observed for major groove TA intercalation by Δ-[Rh(bpy)2(chrysi)]+ (where chrysi = chrysene-5,6-quinone diimine),81 and evidently reflects the fact that the Au3+ ion is square planar and housed within a macrocycle with practically no steric bulk orthogonal to the mean plane of the quinoxaline and pyrrole ring systems.
Molecular Basis of Enzyme Inhibition
Figure 8a gives a detailed view of the dinucleotide binding site of the lowest-energy structure of DNA·3. As noted above, in addition to π–π stacking interactions of adenine and thymine with the pyrrole rings of 3, a significant 3.13-Å O···Au contact involving a carbonyl oxygen atom of T10 and the Au3+ ion of 3 indicates that the binding pocket interacts electrostatically with the metal ion. The simulations therefore explain why Au3+ is required for DNA intercalation by the compounds. That 3 explicitly targets a TA rather than an AT site is also apparent. Specifically, if the order of the bases in the duplex is mutated to A10-T11 in the simulation, formation of the key thymine O···Au3+ contact is obviated (Figure S48). This A10-T11 intercalation adduct is, furthermore, 82.0 kJ mol–1 higher in energy than the global minimum energy structure (T10-A11 intercalation via the major groove).
If 3 binds at Top1’s T10-A11 target site, can the enzyme still recognize its substrate and form a covalent cleavage complex? We answered these questions by simulating the structure of wtTop1 non-covalently bound to DNA·3 (T10-A11 intercalation). From Figure 10a,b, the quinoxaline ring of 3 protrudes into the minor groove and sterically blocks the enzyme’s probe residue R364 from hydrogen bonding to N3 of G12. Steric repulsion between the quinoxaline ring and D533 is also evident. Furthermore, as shown by the overlay of the simulated structure of Top1·DNA·3 with the X-ray structure23 of the Top1 Y723F mutant (mTop1) bound to the 22-bp DNA duplex (Figure 10b),23 intercalation of 3 engenders partial unwinding of the DNA helix downstream of the intercalation point. The strand shift measured by the displacement of G12 is 3.53 Å, consistent with π-stacked 3 assuming the position normally occupied by a nucleobase (A11) and the magnitude of the base rise (Δz = 7.2 Å; Figure 9c). Importantly, the scissile strand’s T10-A11 phosphodiester link shifts 1.52 Å downstream, potentially thwarting attainment of the transition state for covalent Tyr–O–P bond formation. Our macromolecular simulations clearly predict that Top1 will neither bind its DNA substrate nor form a cleavage complex in the presence of 3.
Figure 10.
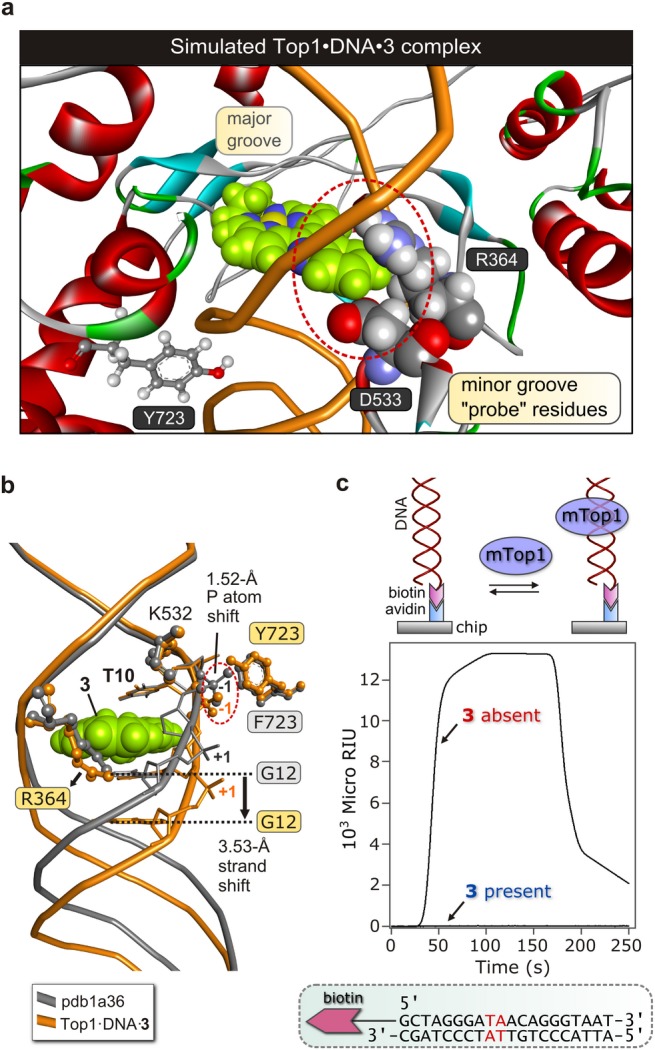
DNA intercalation by 3, the ensuing structural perturbations, and their impact on DNA binding by Top1. (a) Lowest-energy simulated structure of the wild type Top1·DNA·3 ternary complex illustrating steric displacement of Arg-364 and Asp-533 by the quinoxaline ring of 3 protruding out the minor groove. These “probe residues” of the enzyme are key to DNA substrate recognition. (b) Overlay of the simulated structure displayed in Part (a) with the X-ray structure of the Y723F Top1 mutant (mTop1) bound to DNA (pdb code: pdb1a36). Key structural perturbations of the enzyme’s substrate are highlighted. (c) DNA binding by mTop1 in the presence and absence of 3 determined by SPR (surface plasmon resonance; 37 °C, 41 μL min–1 flow rate, pH 7.4, 10% DMSO). The on-chip duplex DNA sequence is illustrated beneath the graph; the enzyme’s TA dinucleotide target is highlighted. The biotinylated 20-bp duplex was anchored to avidin bound to the sensor chip surface. A conceptual illustration of the relevant equilibrium is given above the graph of SPR response functions.
Mechanism Substantiation: SPR Studies
The foregoing predictions were experimentally verified by determining whether or not mTop1, a catalytically inactive mutant analogue of Top1, binds to an oligonucleotide target fixed to a surface plasmon resonance (SPR) chip in the presence and absence of 3 (Figure 10c). The mutant enzyme (mTop1) contains a point mutation at the active site tyrosine (Y723F) which does not appreciably alter overall protein structure or DNA binding affinity but destroys the ability of the enzyme to engage DNA in a cycle of cleavage and religation (which would complicate our analysis of DNA binding). In this experiment, the surface of the SPR chip was derivatized with a biotinylated 20-bp DNA duplex before passing a solution of mTop1 over the chip. An SPR response function commensurate with protein uptake (40–100 s) followed by saturation (100–160 s) and desorption (>160 s) was obtained. After flushing the chip with buffer, a solution of mTop1 and 3 (50 nM) was passed over the chip as before. No SPR response was detected (baseline signal in Figure 10c), consistent with fast uptake of 3 by the DNA and inhibition of enzyme binding by the immobilized DNA·3 intercalation adduct. The experiment therefore confirms the MOA elucidated by the macromolecular simulations.
Finally, we garnered experimental proof that 3 binds to the TA sites of the 20-bp oligonucleotide. Specifically, a solution of 3 passed over the DNA-embellished SPR chip afforded three stepwise association response functions prior to discrete desorption of 3 (Figure S50). The data reflect the presence of the three 5′-TA-3′ sites along the synthetic 20-bp DNA duplex and the fact that each has a unique microscopic affinity constant for 3. The macroscopic KD values for 1 and 3 (Table S4 and Figure S53) were 2.8 and 3.4 μM, respectively, broadly in accord with their ctDNA affinity constants (Figure 3a). Importantly, 3 did not bind to mTop1 (Figure S52), indicating that the enzyme is neither a primary nor a secondary target for the compound.
Based on the above SPR data, DNA binding experiments, and enzyme targeting assays, the lead compound of this study may be confidently assigned as an unconventional type 1 catalytic inhibitor of Top1. Going forward, it will be interesting to ascertain whether the in vitro mechanism of action for 3 applies in vivo (i.e., in a chromatin setting). Although such assays exist for IFPs of Top1,82 non-emissive Top1 CICs such as 1–5, which are unsuitable for confocal microscopy, currently present several unmet challenges regarding detection of endogenous Top1 inhibition within cell nuclei.
Conclusions
In summary, we have synthesized and characterized a new class of nominally planar cationic Au3+ macrocycles that incorporate two pyrrole-imine units linked to a quinoxaline moiety on one side and an alkyl chain bridge on the opposite side. From inception, the compounds were designed to be cytotoxic DNA intercalators. Physical measurements of DNA binding by the compounds indicate that they are intercalators with high affinity constants (KA > 106 M–1 bp) for ctDNA that correlate interdependently with the lipophilicity of the salt and the steric bulk of the alkyl chain bridge within the macrocycle. Hierarchical cluster analysis of NCI-60 cytotoxicity data for the most active compound (salt 3) indicated that 3 correlates most closely with the topoisomerase IB (Top1) poison camptothecin. Several topical enzyme inhibition assays were used to prove that 3 is a catalytic inhibitor (and not a poison) of Top1. Since catalytic inhibition of human topoisomerase IIα (Top2α) by 3 was 2 orders of magnitude weaker than its inhibition of Top1, compound 3 is a type I-specific agent.
New MM parameters were developed for the SP4 force field for macromolecular simulations from the nine independent X-ray structures of the Au3+ macrocycles determined herein for parametrization. A conformational search strategy was devised to locate the lowest energy intercalation site (adjacent nucleobase pair) within a 22-bp DNA duplex commonly used as a Top1 substrate. The simulations showed that 3 intercalates DNA at the enzyme’s 5′-TA-3′ dinucleotide target sequence via major groove entry (the minor groove adduct being >45 kJ mol–1 higher in energy) and that a crucial Au···O electrostatic interaction accounts for the observed base pair specificity. Macromolecular simulations of a ternary non-covalent 3·DNA·Top1 complex suggested that the molecular mechanism of action of DNA-bound 3 is to block substrate recognition by the enzyme through steric repulsion. Surface plasmon resonance studies confirmed (1) that Top1 fails to bind its DNA substrate in the presence of 3, (2) that 3 does not bind to Top1 itself, and (3) that the base specificity of 3 deduced by the macromolecular simulations (TA) is correct.
The overarching conclusion of this multifaceted study is that the most cytotoxic Au3+ macrocycle, lead compound 3, is an unconventional type 1 catalytic inhibitor of human Top1.
Acknowledgments
This work was supported by AuTEK Biomed (Advanced Materials Division of MINTEK, RSA), the National Research Foundation (RSA), the University of KwaZulu-Natal, TopoGEN Inc., Port Orange FL-32128, the NIH (indirectly through the DTP), and the University of Central Florida. The authors thank Dr. Bongyong Lee (postdoc to M.T.M., UCF) for synthesis of the 20-bp biotinylated DNA duplex used for the SPR studies. The authors are indebted to Dr. Holger Ott (Application Scientist, Chemical Crystallography, Bruker AXS GmbH, Karlsruhe, Germany) for collecting the X-ray data for 3 and for generating the initial structure model as part of a Bruker X8 Prospector X-ray diffractometer test demonstration. We thank Craig Grimmer for his help with recording NMR spectra, Caryl Janse Van Rensburg for recording mass spectra, Sandipa Bhikraj and Teshica Chatturgoon for checking the synthesis and characterization of 2b, and Dr. Greg Watson for collecting the HRM data. O.Q.M. thanks the Fulbright Foundation for a 2011/2 Visiting Professor’s Research Scholarship to the USA and UCF.
Supporting Information Available
Compound synthesis, spectroscopic characterization data, molecular biology and methods, NCI cytotoxicity screens, molecular simulation methods, tables of data, additional figures, crystallographic data (CCDC: 928389–928391, www.ccdc.cam.ac.uk/data_request/cif). This material is available free of charge via the Internet at http://pubs.acs.org.
The authors declare the following competing financial interest(s): The authors wish to acknowledge that M.T.M. is a member of the Scientific Advisory Board for TopoGEN, Inc.
Author Status
§ Visiting Fulbright Scholar to the University of Central Florida
Funding Statement
National Institutes of Health, United States
Supplementary Material
References
- Pommier Y. ACS Chem. Biol. 2013, 8, 82–95. [DOI] [PMC free article] [PubMed] [Google Scholar]
- Pommier Y. Nature Rev. Cancer 2006, 6, 789–802. [DOI] [PubMed] [Google Scholar]
- Seol Y.; Zhang H.; Pommier Y.; Neuman K. C. Proc. Natl. Acad. Sci. U.S.A. 2012, 109, 16125–16130. [DOI] [PMC free article] [PubMed] [Google Scholar]
- Pommier Y. Chem. Rev. 2009, 109, 2894–2902. [DOI] [PMC free article] [PubMed] [Google Scholar]
- Covey J. M.; Jaxel C.; Kohn K. W.; Pommier Y. Cancer Res. 1989, 49, 5016–5022. [PubMed] [Google Scholar]
- Denny W. A. Expert Opin. Invest. Drugs 1997, 6, 1845–1851. [DOI] [PubMed] [Google Scholar]
- Solary E.; Dubrez L.; Eymin B.; Bertrand R.; Pommier Y. Bull. Cancer 1996, 83, 205–212. [PubMed] [Google Scholar]
- Oizumi S.; Isobe H.; Ogura S.; Ishida T.; Yamazaki K.; Nishimura M.; Kawakami Y.; Dosaka-Akita H. Anticancer Res. 2002, 22, 4029–4037. [PubMed] [Google Scholar]
- Koster D. A.; Croquette V.; Dekker C.; Shuman S.; Dekker N. H. Nature 2005, 434, 671–674. [DOI] [PubMed] [Google Scholar]
- Koster D. A.; Palle K.; Bot E. S.; Bjornsti M. A.; Dekker N. H. Nature 2007, 448, 213–217. [DOI] [PubMed] [Google Scholar]
- Lillian T. D.; Taranova M.; Wereszczynski J.; Andricioaei I.; Perkins N. C. Biophys. J. 2011, 100, 2016–2023. [DOI] [PMC free article] [PubMed] [Google Scholar]
- Wereszczynski J.; Andricioaei I. Biophys. J. 2010, 99, 869–878. [DOI] [PMC free article] [PubMed] [Google Scholar]
- Stewart L.; Redinbo M. R.; Qiu X.; Hol W. G.; Champoux J. J. Science 1998, 279, 1534–1541. [DOI] [PubMed] [Google Scholar]
- Meng L. H.; Liao Z. Y.; Pommier Y. Curr. Top. Med. Chem. 2003, 3, 305–320. [DOI] [PubMed] [Google Scholar]
- Peterson K. E.; Cinelli M. A.; Morrell A. E.; Mehta A.; Dexheimer T. S.; Agama K.; Antony S.; Pommier Y.; Cushman M. J. Med. Chem. 2011, 54, 4937–4953. [DOI] [PMC free article] [PubMed] [Google Scholar]
- Strumberg D.; Pommier Y.; Paull K.; Jayaraman M.; Nagafuji P.; Cushman M. J. Med. Chem. 1999, 42, 446–457. [DOI] [PubMed] [Google Scholar]
- Fox B. M.; Xiao X.; Antony S.; Kohlhagen G.; Pommier Y.; Staker B. L.; Stewart L.; Cushman M. J. Med. Chem. 2003, 46, 3275–3282. [DOI] [PubMed] [Google Scholar]
- Li T. K.; Houghton P. J.; Desai S. D.; Daroui P.; Liu A. A.; Hars E. S.; Ruchelman A. L.; LaVoie E. J.; Liu L. F. Cancer Res. 2003, 63, 8400–8407. [PubMed] [Google Scholar]
- Zhu S.; Ruchelman A. L.; Zhou N.; Liu A. A.; Liu L. F.; LaVoie E. J. Bioorg. Med. Chem. 2005, 13, 6782–6794. [DOI] [PubMed] [Google Scholar]
- Cinelli M. A.; Morrell A.; Dexheimer T. S.; Scher E. S.; Pommier Y.; Cushman M. J. Med. Chem. 2008, 51, 4609–4619. [DOI] [PMC free article] [PubMed] [Google Scholar]
- Khan Q. A.; Pilch D. S. J. Mol. Biol. 2007, 365, 561–569. [DOI] [PMC free article] [PubMed] [Google Scholar]
- Laco G. S.; Collins J. R.; Luke B. T.; Kroth H.; Sayer J. M.; Jerina D. M.; Pommier Y. Biochemistry 2002, 41, 1428–1435. [DOI] [PubMed] [Google Scholar]
- Redinbo M. R.; Stewart L.; Kuhn P.; Champoux J. J.; Hol W. G. Science 1998, 279, 1504–1513. [DOI] [PubMed] [Google Scholar]
- Staker B. L.; Hjerrild K.; Feese M. D.; Behnke C. A.; Burgin A. B. Jr.; Stewart L. Proc. Natl. Acad. Sci. U.S.A. 2002, 99, 15387–15392. [DOI] [PMC free article] [PubMed] [Google Scholar]
- Staker B. L.; Feese M. D.; Cushman M.; Pommier Y.; Zembower D.; Stewart L.; Burgin A. B. J. Med. Chem. 2005, 48, 2336–2345. [DOI] [PubMed] [Google Scholar]
- Ioanoviciu A.; Antony S.; Pommier Y.; Staker B. L.; Stewart L.; Cushman M. J. Med. Chem. 2005, 48, 4803–4814. [DOI] [PubMed] [Google Scholar]
- Pommier Y.; Covey J. M.; Kerrigan D.; Markovits J.; Pham R. Nucleic Acids Res. 1987, 15, 6713–6731. [DOI] [PMC free article] [PubMed] [Google Scholar]
- Webb M. R.; Ebeler S. E. Biochem. J. 2004, 384, 527–541. [DOI] [PMC free article] [PubMed] [Google Scholar]
- Bansal S.; Tawar U.; Singh M.; Nikravesh A.; Good L.; Tandon V. Int. J. Antimicrob. Agents 2010, 35, 186–190. [DOI] [PubMed] [Google Scholar]
- McKnight R. E.; Onogul B.; Polasani S. R.; Gannon M. K. II; Detty M. R. Bioorg. Med. Chem. 2008, 16, 10221–10227. [DOI] [PubMed] [Google Scholar]
- Winkler D. Bioorg. Med. Chem. 2011, 19, 1450–1457. [DOI] [PubMed] [Google Scholar]
- Hotzel C.; Marotto A.; Pindur U. Eur. J. Med. Chem. 2003, 38, 189–197. [DOI] [PubMed] [Google Scholar]
- Wu N.; Wu X.-W.; Agama K.; Pommier Y.; Du J.; Li D.; Gu L.-Q.; Huang Z.-S.; An L.-K. Biochemistry 2010, 49, 10131–10136. [DOI] [PMC free article] [PubMed] [Google Scholar]
- Che C. M.; Sun R. W. Y.; Yu W. Y.; Ko C. B.; Zhu N. Y.; Sun H. Z. Chem. Commun. 2003, 1718–1719. [DOI] [PubMed] [Google Scholar]
- Sun R. W. Y.; Li C. K. L.; Ma D. L.; Yan J. J.; Lok C. N.; Leung C. H.; Zhu N. Y.; Che C. M. Chem.—Eur. J. 2010, 16, 3097–3113. [DOI] [PubMed] [Google Scholar]
- Castelli S.; Vassallo O.; Katkar P.; Che C.-M.; Sun R. W.-Y.; Desideri A. Arch. Biochem. Biophys. 2011, 516, 108–112. [DOI] [PubMed] [Google Scholar]
- Pourquier P.; Pommier Y. Adv. Cancer Res. 2001, 80, 189–216. [DOI] [PubMed] [Google Scholar]
- Bernstein N. K.; Karimi-Busheri F.; Rasouli-Nia A.; Mani R.; Dianov G.; Glover J. N.; Weinfeld M. Anticancer Agents Med. Chem. 2008, 8, 358–367. [DOI] [PMC free article] [PubMed] [Google Scholar]
- Ferry G.; Studeny A.; Bossard C.; Kubara P. M.; Zeyer D.; Renaud J. P.; Casara P.; de Nanteuil G.; Wierzbicki M.; Pfeiffer B.; Prudhomme M.; Leonce S.; Pierre A.; Boutin J. A.; Golsteyn R. M. Life Sci. 2011, 89, 259–268. [DOI] [PubMed] [Google Scholar]
- Munro O. Q.; Akerman K. J.; Akerman P.. Gold Complexes for Use in the Treatment of Cancer. US Patent 20,130,090,472, 2013.
- Wang L.; Zhu X. J.; Wong W. Y.; Guo J. P.; Wong W. K.; Li Z. Y. Dalton Trans. 2005, 3235–3240. [DOI] [PubMed] [Google Scholar]
- Suh M. P.; Kim I. S.; Shim B. Y.; Hong D.; Yoon T. S. Inorg. Chem. 1996, 35, 3595–3598. [Google Scholar]
- Atkins P. W.; Shriver D. F.. Inorganic chemistry; 4th ed.; W.H. Freeman: New York, 2006. [Google Scholar]
- Hunter C. A.; Sanders J. K. M. J. Am. Chem. Soc. 1990, 112, 5525–5534. [Google Scholar]
- Janiak C. J. Chem. Soc., Dalton Trans. 2000, 3885–3896. [Google Scholar]
- Tsai C.-C.; Jain S. C.; Sobell H. M. Proc. Natl. Acad. Sci. U.S.A. 1975, 72, 628–632. [DOI] [PMC free article] [PubMed] [Google Scholar]
- Keck M. V.; Lippard S. J. J. Am. Chem. Soc. 1992, 114, 3386–3390. [Google Scholar]
- Pommier Y.; Covey J. M.; Kerrigan D.; Markovits J.; Pham R. Nucleic Acids Res. 1987, 15, 6713–6731. [DOI] [PMC free article] [PubMed] [Google Scholar]
- Pereira A.; Costa A.; Leitao J.; Monteiro A.; Izquierdo M.; Silva A.; Bastos E.; Marques M. BMC Geriatrics 2013, 13, 131. [DOI] [PMC free article] [PubMed] [Google Scholar]
- Maciejewska A.; Sawczuk M.; Cieszczyk P.; Mozhayskaya I. A.; Ahmetov I. I. J. Sports Sci. 2012, 30, 101–113. [DOI] [PubMed] [Google Scholar]
- Mills M.; Yang N.; Weinberger R.; Vander Woude D. L.; Beggs A. H.; Easteal S.; North K. Hum. Mol. Genet. 2001, 10, 1335–1346. [DOI] [PubMed] [Google Scholar]
- Neyhart G. A.; Grover N.; Smith S. R.; Kalsbeck W. A.; Fairley T. A.; Cory M.; Thorp H. H. J. Am. Chem. Soc. 1993, 115, 4423–4428. [Google Scholar]
- Erkkila K. E.; Odom D. T.; Barton J. K. Chem. Rev. 1999, 99, 2777–2796. [DOI] [PubMed] [Google Scholar]
- Kawade V. A.; Kumbhar A. A.; Kumbhar A. S.; Nather C.; Erxleben A.; Sonawane U. B.; Joshi R. R. Dalton Trans. 2011, 40, 639–650. [DOI] [PubMed] [Google Scholar]
- Nair R. B.; Teng E. S.; Kirkland S. L.; Murphy C. J. Inorg. Chem. 1998, 37, 139–141. [DOI] [PubMed] [Google Scholar]
- Li T.-K.; Bathory E.; LaVoie E. J.; Srinivasan A.; Olson W. K.; Sauers R. R.; Liu L. F.; Pilch D. S. Biochemistry 2000, 39, 7107–7116. [DOI] [PubMed] [Google Scholar]
- Dragan A.; Pavlovic R.; McGivney J.; Casas-Finet J.; Bishop E.; Strouse R.; Schenerman M.; Geddes C. J. Fluoresc. 2012, 22, 1189–1199. [DOI] [PubMed] [Google Scholar]
- Zipper H.; Brunner H.; Bernhagen J.; Vitzthum F. Nucleic Acids Res. 2004, 32, e103. [DOI] [PMC free article] [PubMed] [Google Scholar]
- Palchaudhuri R.; Hergenrother P. J. Curr. Opin. Biotechnol. 2007, 18, 497–503. [DOI] [PubMed] [Google Scholar]
- Hsiang Y.-H.; Hertzberg R.; Hecht S.; Liu L. J. Biol. Chem. 1985, 260, 14873–14878. [PubMed] [Google Scholar]
- Bodley A.; Liu L. F.; Israel M.; Seshadri R.; Koseki Y.; Giuliani F. C.; Kirschenbaum S.; Silber R.; Potmesil M. Cancer Res. 1989, 49, 5969–5978. [PubMed] [Google Scholar]
- Fujii N.; Yamashita Y.; Saitoh Y.; Nakano H. J. Biol. Chem. 1993, 268, 13160–13165. [PubMed] [Google Scholar]
- Espósito B. P.; Najjar R. Coord. Chem. Rev. 2002, 232, 137–149. [Google Scholar]
- Cyril V.; Muller M. T. Anal. Biochem. 2012, 421, 607–616. [DOI] [PubMed] [Google Scholar]
- Wilson C. R.; Fagenson A. M.; Ruangpradit W.; Muller M. T.; Munro O. Q. Inorg. Chem. 2013, 52, 7889–7906. [DOI] [PubMed] [Google Scholar]
- Mao Y.; Okada S.; Chang L. S.; Muller M. T. Cancer Res. 2000, 60, 4538–4543. [PubMed] [Google Scholar]
- Tewey K. M.; Rowe T. C.; Yang L.; Halligan B. D.; Liu L. F. Science 1984, 226, 466–468. [DOI] [PubMed] [Google Scholar]
- Capranico G.; Zunino F.; Kohn K. W.; Pommier Y. Biochemistry 1990, 29, 562–569. [DOI] [PubMed] [Google Scholar]
- Harrison R. W.; Reed C. C.; Weber I. T. Proteins 1997, Suppl 1, 68–73. [DOI] [PubMed] [Google Scholar]
- Šponer J.; Jurečka P.; Marchan I.; Luque F. J.; Orozco M.; Hobza P. Chem.—Eur. J. 2006, 12, 2854–2865. [DOI] [PubMed] [Google Scholar]
- Breslauer K. J.; Frank R.; Blocker H.; Marky L. A. Proc. Natl. Acad. Sci. U.S.A. 1986, 83, 3746–3750. [DOI] [PMC free article] [PubMed] [Google Scholar]
- Huang Y.; Kowalski D. Nucleic Acids Res. 2003, 31, 3819–3821. [DOI] [PMC free article] [PubMed] [Google Scholar]
- Zheng G.; Lu X.-J.; Olson W. K. Nucleic Acids Res. 2009, 37, W240–W246. [DOI] [PMC free article] [PubMed] [Google Scholar]
- Lu X. J.; Olson W. K. Nucleic Acids Res. 2003, 31, 5108–5121. [DOI] [PMC free article] [PubMed] [Google Scholar]
- Olson W. K.; Bansal M.; Burley S. K.; Dickerson R. E.; Gerstein M.; Harvey S. C.; Heinemann U.; Lu X.-J.; Neidle S.; Shakked Z. J. Mol. Biol. 2001, 313, 229–237. [DOI] [PubMed] [Google Scholar]
- Frederick C. A.; Williams L. D.; Ughetto G.; Van der Marel G. A.; Van Boom J. H.; Rich A.; Wang A. H. Biochemistry 1990, 29, 2538–2549. [PubMed] [Google Scholar]
- Lu X.-J.; Olson W. K. J. Mol. Biol. 1999, 285, 1563–1575. [DOI] [PubMed] [Google Scholar]
- Quigley G. J.; Wang A.-H.; Ughetto G.; Van Der Marel G.; Van Boom J. H.; Rich A. Proc. Natl. Acad. Sci. U.S.A. 1980, 77, 7204–7208. [DOI] [PMC free article] [PubMed] [Google Scholar]
- Niyazi H.; Hall J. P.; O’Sullivan K.; Winter G.; Sorensen T.; Kelly J. M.; Cardin C. J. Nat. Chem. 2012, 4, 621–628. [DOI] [PubMed] [Google Scholar]
- Song H.; Kaiser J. T.; Barton J. K. Nat. Chem. 2012, 4, 615–620. [DOI] [PMC free article] [PubMed] [Google Scholar]
- Pierre V. C.; Kaiser J. T.; Barton J. K. Proc. Natl. Acad. Sci. U.S.A. 2007, 104, 429–434. [DOI] [PMC free article] [PubMed] [Google Scholar]
- Durand-Dubief M.; Persson J.; Norman U.; Hartsuiker E.; Ekwall K. EMBO J. 2010, 29, 2126–2134. [DOI] [PMC free article] [PubMed] [Google Scholar]
Associated Data
This section collects any data citations, data availability statements, or supplementary materials included in this article.


