Abstract

Predicting site selectivity in C–H bond oxidation reactions involving heteroatom transfer is challenged by the small energetic differences between disparate bond types and the subtle interplay of steric and electronic effects that influence reactivity. Herein, the factors governing selective Rh2(esp)2-catalyzed C–H amination of isoamylbenzene derivatives are investigated, where modification to both the nitrogen source, a sulfamate ester, and substrate are shown to impact isomeric product ratios. Linear regression mathematical modeling is used to define a relationship that equates both IR stretching parameters and Hammett σ+ values to the differential free energy of benzylic versus tertiary C–H amination. This model has informed the development of a novel sulfamate ester, which affords the highest benzylic-to-tertiary site selectivity (9.5:1) observed for this system.
Introduction
Discriminate control over product selectivity in carbon–hydrogen (C–H) bond functionalization reactions represents one of the great challenges in modern synthetic chemistry.1 The high energy barriers to C–H bond cleavage (on the order of 98 kcal mol–1) contrast the small energetic differences that bias enantio- and chemoselective C–H bond functionalization (ΔΔG‡ of ∼2 kcal mol–1 for >20:1 selectivity). Given the small differences in transition state free energies that modulate isomeric product ratios, it is often difficult to distinguish the steric and electronic factors that influence reaction selectivity. Identification of such factors, however, can prove invaluable for tailoring catalyst and reagent structures to afford greater control over reaction outcomes.
The Du Bois group recently reported an intermolecular Rh-catalyzed C–H amination2 protocol and demonstrated that oxidation of isoamylbenzene (a) results in benzylic-to-tertiary (B:T) product ratios that are dependent upon the choice of sulfamate ester b (Figure 1).3 The relationships between steric and electronic factors that contribute to these disparate outcomes are not obvious from the trends in selectivity. Specifically, sulfamate ester b1, R = CH2CCl3, yielded the highest degree of B:T selectivity (8:1), while substitution to R = CH2t-Bu (b2), a steric homologue, resulted in reduced benzylic selectivity (4:1). An equally intriguing result was obtained from the evaluation of sulfamate ester b3, R = CH(CF3)2, which yields equimolar amounts of the two products. Similar losses in selectivity were observed for both electron-poor (b4, R = 2,6-F2C6H3, 1.5:1) and electron-rich (b5, 4-t-BuC6H4, 1:1) aryl sulfamate esters.
Figure 1.
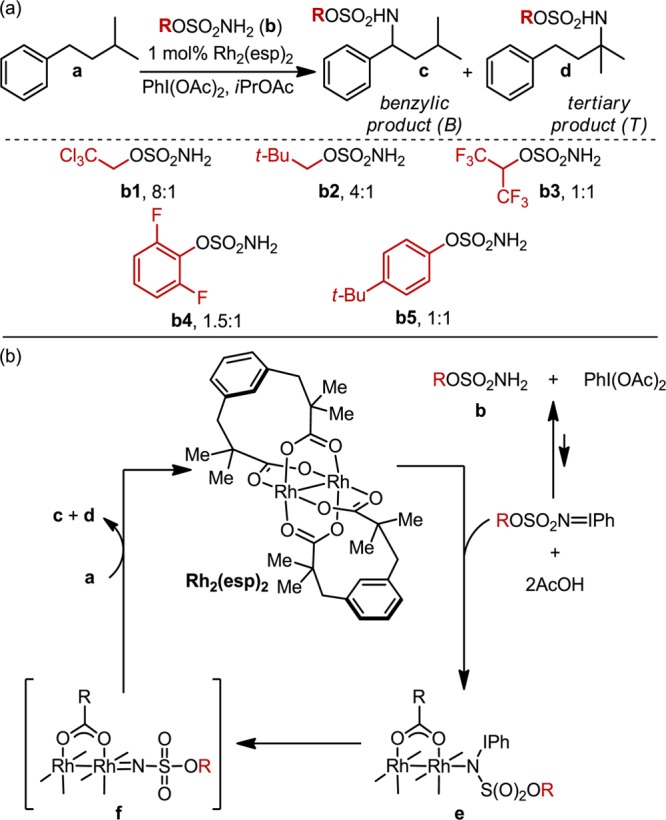
(a) Rh2(esp)2-catalyzed C–H amination of isoamylbenzene, demonstrating the sensitivity of site selection to the sulfamate ester nitrene source. (b) Proposed mechanism for the amination reaction.
An archetypical physical organic technique for identifying features that influence product selectivity as a function of substituent changes is linear free-energy relationship (LFER) analysis.4 Pioneered by Hammett for electronic analysis of meta- or para-substituted benzene rings5 and adopted by Taft6 and, later, Charton7 for steric effect analyses, these techniques have been broadly applied to interrogate reaction outcomes.8 While these classic LFER parameters have been instrumental in a variety of contexts, often illuminating mechanistic details by relating log(K) to empirically derived electronic or steric constants (where K may represent relative rate and equilibrium constants, ratios of enantiomers and constitutional isomers, etc.), LFERs also bear significant limitations;9 namely, there are a modest number of reactions that can be successfully modeled using Hammett or Taft/Charton parameters alone.9b,10
Over the last several years, the Sigman laboratory has investigated the use of discretely measured molecular parameters (vide infra) as opposed to those derived from relative-rate experiments (e.g., Hammett and Taft values) for nonclassic free-energy relationship analysis, relating these parameters to ΔΔG‡ for differential transition state interrogation.9b,11 As the data from the Rh-catalyzed C–H amination lacks obvious explanation, commonly employed free-energy relationships are not likely capable of delineating the entangled effects of the sulfamate ester on site selectivity. Therefore, we have turned to a recent discovery that specific infrared (IR) molecular vibrations represent a broadly applicable, yet uniquely descriptive, parameter set.10a IR vibrations can be computationally calculated for any molecule, the result of which is a tailored parameter set that is capable of describing the distinct nature of each reactive species.
Herein, we exploit the intrinsic ability of IR vibrations to describe the inherent molecular properties of sulfamate ester nitrene precursors in selective Rh2(esp)2-catalyzed amination of benzylic versus tertiary C–H bonds. Using IR-derived descriptors to quantitate steric and electronic selectivity determinants, we apply linear regression modeling to identify the sulfamate ester features responsible for differential benzylic-to-tertiary functionalization. Insights garnered from this free-energy model have led us to design a new sulfamate ester, which yields the highest selectivity ratio (9.5:1, B:T) reported, to date, for this C–H amination process.
Results and Discussion
Through the Du Bois group’s investigation of intermolecular oxidation reactions (a proposed mechanism of which is depicted in Figure 1b),2 an interesting relationship was noted between the steric and electronic structure of the sulfamate ester b and the B:T ratio in the oxidation of isoamylbenzene (a) (Figure 1a).3 The results of these investigations were ascribed principally to steric differences between sulfamate reagents, but the influence of electronic substituent effects could not be discounted. Accordingly, a sulfamate ester library was designed to more thoroughly probe the interplay of steric and electronic perturbations on the selectivity dependence of this system (Figure 2). Library construction was based on two features inspired by the original results: (1) the exploration of chain-length and halogenation (2a–2l) and (2) the evaluation of branching and steric bulk distal to the α-carbon of the sulfamate (2m–2t).
Figure 2.
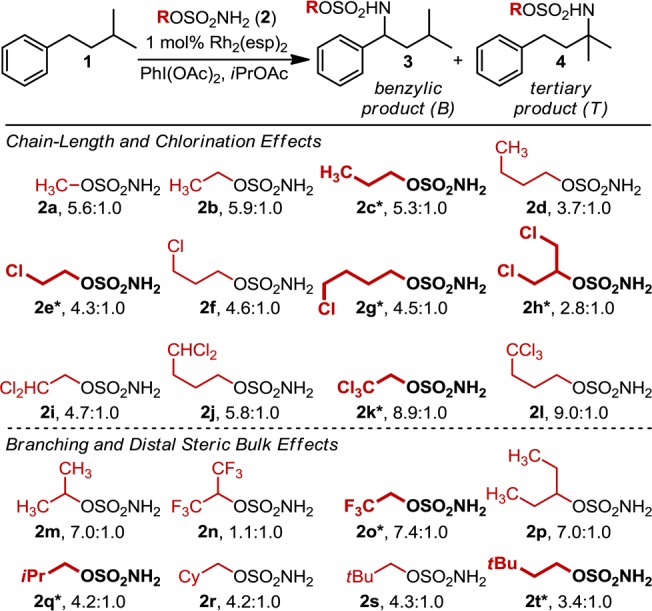
Twenty-membered sulfamate ester library used to probe the reaction’s site-selection sensitivity. Ratios, determined by GC analysis, are averaged over three experimental runs. Bolded and asterisked sulfamate ester structures represent the DoE-defined subset of nitrene sources.
Each of the sulfamate esters depicted in Figure 2 was evaluated in the Rh2(esp)2-catalyzed amination of 1. Of particular interest, chlorine substitution (2e–2l) has a pronounced effect on product selectivity with trichloromethyl sulfamate esters (2k, 2l) yielding B:T ratios of ∼9:1, regardless of the proximity of this group to the −SO2NH2 moiety. Relative to R = nBu (2d), this same trend is maintained for di- and monochloromethyl substrates, where B:T ratios average 5.3:1 (2i, 2j) and 4.5:1 (2e–2g), respectively.
The insensitivity of B:T selectivity to chain length is a general trend observed throughout the data set. The influence of steric effects on selectivity becomes apparent when the sulfamate ester bears a branched α-carbon (i.e., sulfamates prepared from secondary alcohols). Specifically, selectivity for the benzylic insertion product increases for iPrOSO2NH2 (2m, 7.0:1) relative to EtOSO2NH2 (2b, 5.9:1). A marked change in the product ratio is noted when halogen substituents are introduced in these secondary alcohol-derived sulfamate esters (2h, 2n). For example, a reaction performed with (CF3)2CHOSO2NH2 yields nearly equal amounts of the benzylic and tertiary products. However, replacing one CF3 group with H (2o, 7.4:1), to eliminate the branching pattern, rescues selectivity.
Parameter Selection
Collectively, the data portrayed in Figure 2 reflect an ill-defined role for steric and electronic modulation of the sulfamate ester on product selectivity. Steric influences manifest principally in the narrow dimension of branched versus nonbranched sulfamate groups. Additionally, while inclusion of electronegative halogen atoms clearly alters product selectivity, the effect cannot be ascribed entirely to electronic differences in nitrenoid reactivity. These general features of the amination reaction significantly complicate quantitative free-energy modeling of selectivity. Classic steric parameters, such as Taft6 and Charton7 values and Winstein–Holness (A) values12, derived from relative-rate and conformation equilibration experiments, respectively, treat substituent steric bulk as a spherical unit.9b Therefore, this treatment has the disadvantage of averaging the nuances of substituent asymmetry and width-to-length ratios into a single-value representation of steric effects.
In the development of free-energy relationships describing selectivity, it is precisely these subtleties that are responsible for the differential transition state energies leading to isomeric product ratios, as predicated by the Curtin–Hammett principle.13 Verloop innovatively approached this deficiency in the description of steric effects through the development of Sterimol parameters (Figure 3).14 This parameter set gives dimensional specificity to the description of steric bulk through three subparameters: B1, substituent minimum radius; B5, substituent maximum radius; and L, substituent length.
Figure 3.
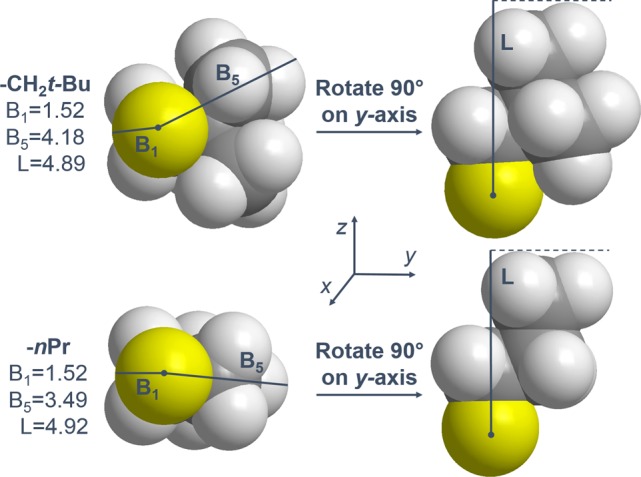
Schematics of the Sterimol parameter system, describing the subparameters B1 (minimum radius), B5 (maximum radius), and L (length). Comparisons of nPr and CH2t-Bu demonstrate a deficiency in the Sterimol parameters, where sterically distinct groups are similarly described.
While the effectiveness of Sterimol parameters in various contexts has been successfully demonstrated,9b,10a,11 this steric descriptor still lacks information about the position along L at which steric bulk resides. For example, as depicted in Figure 3, Sterimol measures of the CH2t-Bu substituent are 1.52 (B1), 4.18 (B5), and 4.89 (L).15 Comparatively, the Sterimol system describes nPr, a group with its own distinct apparent steric bulk, as nearly isosteric with CH2t-Bu, measuring 1.52 (B1), 3.49 (B5), and 4.92 (L). A similar parameter deficiency occurs for electronic description. The presence of R-group chlorine atoms, particularly trichloromethyl, generally enhances selectivity (in the absence of branching), independent of the chlorine atom distance from the −NH2 group of the sulfamate moiety. This observation cannot be explained through the use of the ubiquitous electronic descriptor, pKa, or any descriptor of induction.16 These apparent limitations warrant a more sophisticated approach to characterize the underlying selectivity trends in C–H amination. Thus, we have turned to IR molecular vibrations, which were recently demonstrated as an effective parameter for the development of free-energy type relationships.10a Derived from the unique vibrational fingerprint of every molecule and representative of the fundamental energies, bond strengths, and dipole moments contained therein, IR stretches were computationally calculated for each sulfamate ester using M06–2X/TZVP.17
While the reactive oxidant believed to be involved in the selectivity-defining step of the Rh-catalyzed amination is a Rh-nitrene (f, Figure 1b), our computed vibrational data are from the sulfamate ester and not the nitrenoid. As noted above, the differential energy between nitrenoid transition states (ΔΔG‡) is responsible for benzylic versus tertiary amination ratios. Our working hypothesis, for which we provide supporting evidence, is that modifications to the nitrene precursor (i.e., sulfamate ester) commensurately impact molecular properties of the selectivity-defining transition states (vide infra).13 This is an important qualification, which allows ground state IR frequencies and intensities to be computed for the simplest of these species, the sulfamate ester. This approach significantly reduces the computational effort, making the methodology tractable.
In order to proceed with free-energy relationship model development, we identified a group of IR vibration parameters as potential selectivity descriptors. From such a set, stepwise linear regression analysis is performed, whereby the descriptors are statistically whittled down to a subset of parameters that best mathematically relates features of the sulfamate ester to ΔΔG‡ (equating to −RT ln(tertiary/benzylic), where R is the ideal gas constant and T is temperature). As each sulfamate ester is characterized with many disparate vibrational modes, we chose those vibrations that were consistently identified in our computations (i.e., major vibrational modes) and assumed to significantly impact the Rh-nitrene selectivity profile. Given these criteria, four vibrations were chosen as potential descriptors of selectivity: O–S–N asymmetric stretch (νOSN), C–O stretch (νCO), SO2 symmetric stretch (νSO2sym), and SO2 asymmetric stretch (νSO2asym). Figure 4 depicts a simulated IR spectrum for sulfamate ester 2a (R = Me) and highlights both the calculated frequencies and intensities of these four vibrations, giving a total of eight vibration-derived descriptors that were used for regression analysis.
Figure 4.
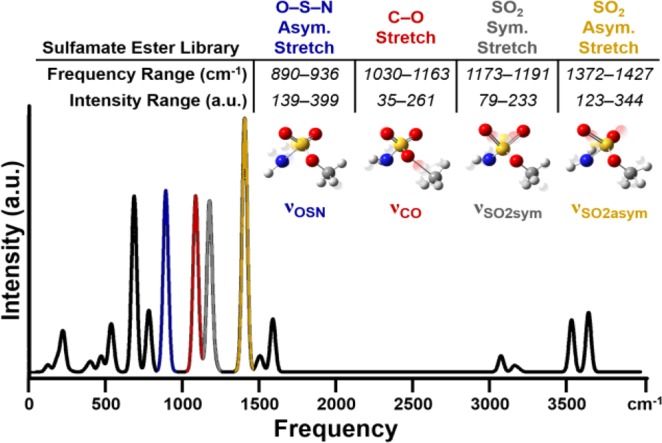
Computationally derived IR spectrum for sulfamate ester 2a, MeOSO2NH2. Vibrations used as modeling parameters are color-coded, and graphical depictions approximating vibrational motions are presented. Vibrational frequency and intensity ranges for the 20-membered sulfamate ester library are presented.
Model Development
Prior to developing a mathematical relationship between selectivity and the identified vibrational frequencies and intensities, we first applied design of experiments (DoE) principles to our initial 20-membered sulfamate ester library (Figure 2).18 DoE tenants dictate that the most robust mathematical models are developed from data sets that are systematically varied. Thus, eight sulfamate esters were selected (termed the DoE set and noted with asterisks and bolded in Figure 2) that quantitatively sample the observed range of B:T ratios and qualitatively represent a distribution of steric and electronic perturbations.
In addition to examining sulfamate substituent effects on B:T selectivity, we have also varied the electronic structure of the isoamylbenzene substrate. After preparing a traditional Hammett series (R′ = OMe (1a), t-Bu (1c), H (1), Br (1d), CF3 (1c)), this library was subjected to oxidation reactions with each of the eight DoE-set sulfamate esters. (See Figure 5 for a description of the two sets of experiments that did not yield measurable data.) The selectivity results of this analysis are presented in Figure 5 and are correlated to Hammett σ+ values. As a measure of resonance stabilization, Hammett σ+ values serve as a better descriptor of the observed selectivity trends across varying R′ than do Hammett σ values.19 The higher degree of correlation provided by σ+ values is consistent with the electrophilic nature of the putative nitrenoid and developing δ+ charge at the carbon center undergoing oxidation in the transition structure.20
Figure 5.
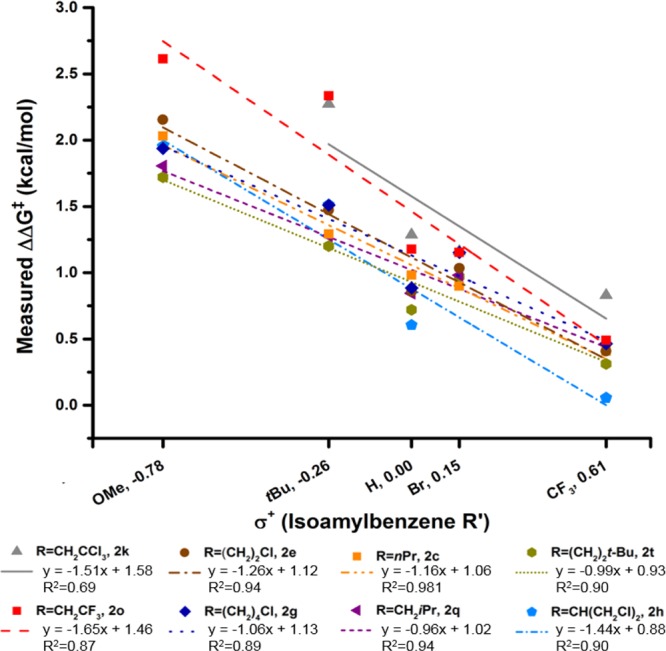
Plot of measured ΔΔG‡ versus Hammett σ+ for the DoE set of sulfamate esters evaluated in the isoamylbenzene substrate series R′ = OMe (1a), t-Bu (1c), H (1), Br (1d), CF3 (1b). ΔΔG‡ = −RT ln(tertiary/benzylic), where T is 23 °C. Omitted from this plot are data points corresponding to R = CH2CCl3, R′ = OMe (benzylic-to-tertiary ratio >100:1) and R = CH(CH2Cl)2, R′ = Br (no measurable products observed).
With data from reactions of the eight sulfamate esters (DoE set) and three isoamylbenzene-derived substrates (R′ = OMe (1a), H (1), CF3(1b)), we subjected the 23-membered training set (Table 1, see Figure 5 for an explanation of the data point omitted) to a standard stepwise linear regression algorithm (see Supporting Information for details).21 Using this algorithm, which facilitates statistical exploration of the relationship between vibrational parameters, σ+, and ΔΔG‡, the equation depicted in Figure 6a can be formulated. To evaluate the accuracy of this model, we compare predicted and measured ΔΔG‡ in Figure 6b, which demonstrates a high level of correlation between experimental values and model predictions. Leave-one-out (LOO) analysis was also performed to evaluate the robustness of the model (Figure 6c).22 The slope and R2 values, which are close to unity, are positive indicators of the model’s accuracy.
Table 1. Training Set (Entries 1–23), External Validations (Entries 24–61), and Predictions (Entries 62–64, Bold).

| entry | R | R′ | pred. ΔΔG‡ (kcal/mol) | meas. ΔΔG‡ (kcal/mol) | meas. B/T |
|---|---|---|---|---|---|
| 1 | CH2CF3 | 4-OMe | 2.32 | 2.61 | 85.0 ± 1.4 |
| 2 | nPr | 4-OMe | 2.02 | 2.03 | 31.6 ± 0.1 |
| 3 | (CH2)2CI | 4-OMe | 2.15 | 2.15 | 38.9 ± 0.9 |
| 4 | (CH2)2t-Bu | 4-OMe | 1.77 | 1.72 | 18.6 ± 0.3 |
| 5 | CH(CH2CI)2 | 4-OMe | 1.82 | 1.95 | 27.7 ± 1.3 |
| 6 | CH2iPr | 4-OMe | 1.70 | 1.81 | 21.5 ± 0.5 |
| 7 | (CH2)4CI | 4-OMe | 1.86 | 1.94 | 26.9 ± 0.5 |
| 8 | CH2CCl3 | 4-H | 1.58 | 1.29 | 8.9 ± 0.1 |
| 9 | CH2CF3 | 4-H | 1.25 | 1.18 | 7.4 ± 0.2 |
| 10 | nPr | 4-H | 1.06 | 0.98 | 5.3 ± 0.3 |
| 11 | (CH2)2CI | 4-H | 1.09 | 0.86 | 4.3 ± 0.1 |
| 12 | (CH2)2t-Bu | 4-H | 0.92 | 0.72 | 3.4 ± 0.2 |
| 13 | CH(CH2CI)2 | 4-H | 0.86 | 0.61 | 2.8 ± 0.1 |
| 14 | CH2iPr | 4-H | 0.96 | 0.84 | 4.2 ± 0.3 |
| 15 | (CH2)4CI | 4-H | 0.95 | 0.89 | 4.5 ± 0.1 |
| 16 | CH2CCI3 | 4-CF3 | 0.70 | 0.83 | 4.1 ± 0.3 |
| 17 | CH2CF3 | 4-CF3 | 0.41 | 0.49 | 2.3 ± 0.1 |
| 18 | nPr | 4-CF3 | 0.31 | 0.41 | 2.0 ± 0.2 |
| 19 | (CH2)2CI | 4-CF3 | 0.26 | 0.41 | 2.0 ± 0.1 |
| 20 | (CH2)2t-Bu | 4-CF3 | 0.27 | 0.31 | 1.7 ± 0.1 |
| 21 | CH(CH2CI)2 | 4-CF3 | 0.11 | 0.06 | 1.1 ± 0.1 |
| 22 | CH2iPr | 4-CF3 | 0.39 | 0.46 | 2.2 ± 0.1 |
| 23 | (CH2)4CI | 4-CF3 | 0.24 | 0.46 | 2.2 ± 0.2 |
| 24 | (CH2)3CCI3 | 4-H | 1.05 | 1.29 | 9.0 ± 0.3 |
| 25 | CH(Et)2 | 4-H | 1.02 | 1.15 | 7.0 ± 0.3 |
| 26 | iPr | 4-H | 1.07 | 1.15 | 7.0 ± 0.1 |
| 27 | Et | 4-H | 0.87 | 1.04 | 5.9 ± 0.1 |
| 28 | (CH2)3CHCI2 | 4-H | 1.02 | 1.03 | 5.8 ± 0.1 |
| 29 | Me | 4-H | 1.01 | 1.01 | 5.6 ± 0.3 |
| 30 | CH2CHCI2 | 4-H | 1.33 | 0.92 | 4.8 ± 0.1 |
| 31 | (CH2)3CI | 4-H | 0.99 | 0.90 | 4.6 ± 0.1 |
| 32 | CH2t-Bu | 4-H | 1.15 | 0.86 | 4.3 ± 0.3 |
| 33 | CH2Cy | 4-H | 0.89 | 0.84 | 4.2 ± 0.1 |
| 34 | nBu | 4-H | 1.05 | 0.77 | 3.7 ± 0.1 |
| 35 | CH(CF3)2 | 4-H | 1.19 | 0.06 | 1.1 ± 0.1 |
| 36 | CH2CCI3 | 4-t-Bu | 1.96 | 2.27 | 47.6 ± 0.3 |
| 37 | CH2CF3 | 4-t-Bu | 1.61 | 2.33 | 52.8 ± 0.1 |
| 38 | nPr | 4-t-Bu | 1.38 | 1.29 | 9.0 ± 0.3 |
| 39 | (CH2)2CI | 4-t-Bu | 1.44 | 1.47 | 12.2 ± 0.1 |
| 40 | (CH2)2t-Bu | 4-t-Bu | 1.21 | 1.20 | 7.7 ± 0.2 |
| 41 | CH(CH2CI)2 | 4-t-Bu | 1.18 | 1.51 | 13.1 ± 0.1 |
| 42 | CH2iPr | 4-t-Bu | 1.21 | 1.28 | 8.8 ± 0.5 |
| 43 | (CH2)4CI | 4-t-Bu | 1.25 | 1.51 | 13.0 ± 0.5 |
| 44 | CH2CCI3 | 4-Br | 1.37 | 1.16 | 7.2 ± 0.1 |
| 45 | CH2CF3 | 4-Br | 1.04 | 1.15 | 7.1 ± 0.1 |
| 46 | nPr | 4-Br | 0.88 | 0.90 | 4.6 ± 0.3 |
| 47 | (CH2)2CI | 4-Br | 0.88 | 1.03 | 5.8 ± 0.2 |
| 48 | (CH2)2t-Bu | 4-Br | 0.77 | 0.97 | 5.2 ± 0.2 |
| 49 | CH2iPr | 4-Br | 0.82 | 0.98 | 5.3 ± 0.4 |
| 50 | (CH2)4CI | 4-Br | 0.77 | 1.15 | 7.1 ± 0.3 |
| 51 | CH2CHCI2 | 4-OMe | 2.23 | 2.40 | 59.3 ± 0.4 |
| 52 | (CH2)3CI | 4-OMe | 1.88 | 2.21 | 42.7 ± 0.5 |
| 53 | nBu | 4-OMe | 2.01 | 1.74 | 19.3 ± 0.5 |
| 54 | nBu | 3-CI | 0.56 | 0.63 | 2.9 ± 0.2 |
| 55 | (CH2)2CI | 3-CI | 0.55 | 0.52 | 2.4 ± 0.1 |
| 56 | CH2iPr | 3-CI | 0.59 | 0.49 | 2.3 ± 0.1 |
| 57 | (CH2)2CI | 4-Ph | 1.33 | 1.68 | 17.3 ± 0.2 |
| 58 | nBu | 4-Ph | 1.27 | 1.39 | 10.7 ± 0.2 |
| 59 | CH2CF3 | 3-t-Bu | 1.33 | 1.41 | 10.9 ± 0.4 |
| 60 | (CH2)2CI | 3-t-Bu | 1.17 | 0.92 | 4.8 ± 0.1 |
| 61 | nBu | 3-t-Bu | 1.12 | 0.79 | 3.8 ± 0.2 |
| 62 | CH2CF2CF3 | 4-H | 1.38 | 1.32 | 9.5 ± 0.2 |
| 63 | CH2(CF2)2CF3 | 4-H | 1.43 | 1.26 | 8.5 ± 0.1 |
| 64 | CH2C(Me)2CH2CI | 4-H | 1.17 | 1.06 | 6.1 ± 0.1 |
Figure 6.
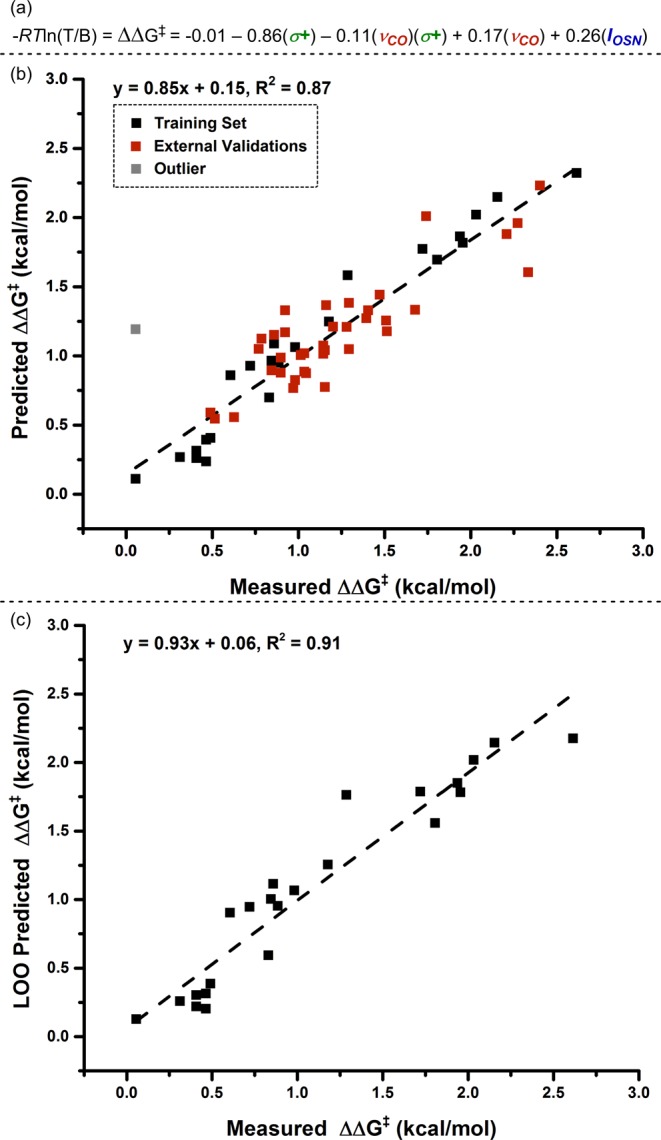
(a) Normalized mathematical relationship, derived from tabulated training set in Table 1, describing differential free energy of benzylic (B)-to-tertiary (T) amination. R: ideal gas constant, T: 23 °C. (b) Predicted versus measured ΔΔG‡ plot of training set and external validations. Grayed data point, designated as an outlier, represents R = CH(CF3)2, R′ = H. (c) Leave-one-out (LOO) analysis.
External Validation of the Model
A third measure of model strength was determined by externally validating the model with data points not part of the training set. Of the original 20-membered library, 12 sulfamate esters, which were not members of the DoE set, were evaluated with isoamylbenzene (1). The robustness of the model for describing substrate variation was evaluated with five isoamylbenzene derivatives: 1-t-Bu-4-isopentylbenzene (1c), 1-bromo-4-isopentylbenzene (1d), 1-Cl-3-isoamylbenzene (1e), 1-Ph-4-isoamylbenzene (1f), and 1-t-Bu-3-isoamylbenzene (1g). The complete external validation set is tabulated in Table 1. Graphical representation of this data (red squares, Figure 6b) demonstrates the overall good agreement between predicted ΔΔG‡ values and experimental measurements.
An obvious outlier between predicted and measured ΔΔG‡ values occurs with sulfamate ester 2n, (CF3)2CHOSO2NH2. We hypothesize that this highly electron-deficient, sterically large sulfamate ester may be forced to adopt conformations not accessible to other nitrene sources in the defining C–N bond forming event. It is also possible that 2n facilitates C–H amination through a mechanistic pathway that differs from that of other sulfamate esters. Future investigations of reactions with 2n are warranted; use of this reagent was discontinued for the remainder of this study.
Analysis of the Model
We have capitalized on the robustness of our model, which relies on both vibrational data and substrate σ+ parameters, to predict new sulfamate structures that display a higher propensity toward benzylic C–H insertion. As the relationship in Figure 6a is a normalized equation, the magnitude of the coefficients yield information about the relative influence of each parameter on selectivity. Notably, the overriding selectivity determinant, σ+, is associated with the strength of the benzylic C–H bond (vide supra). Perhaps unsurprisingly, the C–O frequency (νCO) of the sulfamate ester also plays a prominent role in this model. Included as a single term and, again, within a cross-term, νCO is the shortest conduit from the O-alkyl substituent to the sulfamate moiety. The vibrational frequency of the C–O bond will reflect changes in the substituent groups on the alkyl chain, which alter the force constant and/or reduced mass (components of vibrational modes).
It is particularly intriguing to find that the C–O stretching vibration is coupled with the Hammett descriptor, σ+, in the optimized selectivity model. This result suggests a synergistic relationship between the nitrenoid and the isoamylbenzene substrate, indicative of a defined intermolecular interaction between these two species. While the precise nature of this interaction is unclear, we considered illuminating the origin of νCO trends by assessing sulfamate esters according to increasing C–O frequency (Figure 7a). Qualitatively, we observed that the more halogenated sulfamate esters showed greater νCO values. In accordance with this trend, more polarized bonds vibrate with energetically higher frequencies. Greater differential electronegativity across a bond increases the bond force constant and, thus, its vibrational frequency.23
Figure 7.
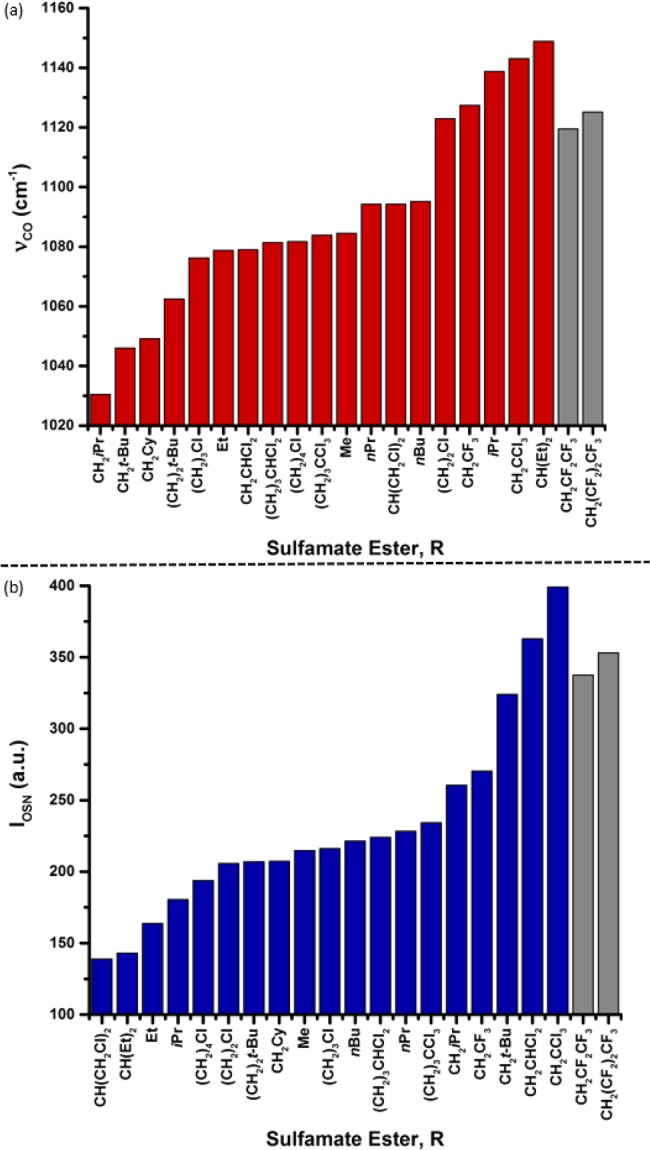
(a) Representation of increasing C–O stretch frequency (νCO) versus sulfamate ester R group. (b) Representation of increasing intensity of O–S–N asymmetric stretch (IOSN) versus sulfamate ester R group. Grayed columns highlight model-informed predictions 2u (R = CH2CF2CF3) and 2v (R = CH2(CF2)2CF3).
Patterning in a similar manner our analysis of the other vibration-related parameter, IOSN, revealed in our model, we constructed Figure 7b, which displays sulfamate ester R groups according to increasing O–S–N asymmetric stretch intensities. Organizing the data in this manner, we observe that variation in IOSN is primarily characterized by increases in distal steric bulk and by halogenation. These qualitative trends served to inform our use of the developed model as a tool for predicting new sulfamate esters that yield improved B:T ratios.
Application of the Model
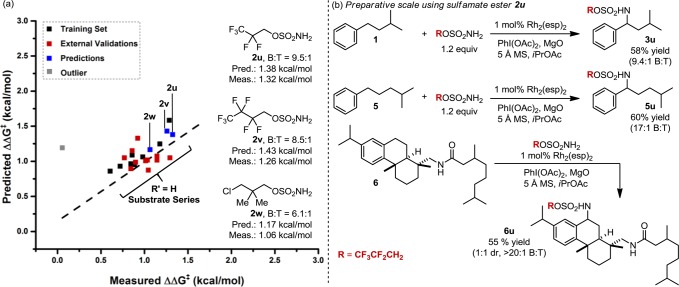
We have computationally evaluated several sulfamate derivatives that included electronegative atoms and variation in chain-length; most of these, however, were not predicted to afford improved site selection. In contrast, sulfamate esters 2u (R = CH2CF2CF3) and 2v (R = CH2(CF2)2CF3) were identified using our model, as these two reagents were expected to give enhanced levels of the benzylic oxidation product. In practice, the predicted selectivities closely matched those measured, with sulfamate ester 2u effecting the highest degree of site-selection observed for amination of isoamylbenzene (1) (Figure 8a). The enhancement of selectivity achieved by changing the sulfamate from Cl3CCH2OSO2NH3 (2k) to CF3CF2CH2OSO2NH2 (2u), albeit modest, is striking given the apparent electronic similarities and steric differences between these two reagents.
Figure 8.
(a) Plot of predicted versus measured ΔΔG‡ for amination of isoamylbenzene, 1. A mathematical model correlating differential reaction free energy (ΔΔG‡) with IR vibrational data and Hammett σ+ parameters informed the design of new sulfamate esters. Sulfamate ester 2u affords the highest B:T selectivity reported, to date, for Rh-catalyzed amination of isoamylbenzene. (b) Preparative scale (0.5 mmol) reactions using sulfamate ester 2u.
The identification of 2u and 2v by consideration of both νCO and IOSN (gray columns, Figure 7) highlights the predictive utility of our model. Of note, the calculated IR frequencies and intensities of these nitrene sources do not represent the highest observed values in the sulfamate ester library. This is rationalized by considering the interdependency of the terms derived from vibrational modes, since these are intrinsically linked. Thus, maximizing the value of νCO alone does not guarantee proportionate increases in ΔΔG‡ values. This underscores the balance that is achieved in the developed model (see equation in Figure 6a) between the selectivity-enhancing effects of the νCO and IOSN parameters (positive coefficients) and the potentially deleterious effect on site selection of the (νCO)(σ+) cross term (negative coefficient).
As a final step, we have evaluated the performance of sulfamate ester 2u on a preparative scale (0.5 mmol) with isoamylbenzene (1). The benzylic product from this reaction was obtained in 58% yield with the same level of B:T site-selectivity (9.4:1) that was noted in the original evaluation process (0.3 mmol scale). The reaction of 2u with substrate 5 shows even higher levels of site selectivity in favor of the benzylic amine product (60% yield). Finally, oxidation of a more sophisticated polycyclic substrate, 6, is demonstrated to give exclusively the product of secondary, benzylic oxidation in 55% yield.
In summary, the subtle interplay of steric and electronic effects in the Rh-catalyzed C–H amination of isoamylbenzenes has been evaluated with a wide-range of sulfamate esters. Product selectivity in these reactions can be effectively modeled using a combination of a classical Hammett parameter and computed IR vibrational data. Of particular interest is the ability to deconstruct the model and use this information to extrapolate to new sulfamate esters, one of which offers the highest performance, to date, for this intermolecular Rh-catalyzed C–H amination reaction. Current efforts are underway to apply this modeling approach to examine other selectivity challenges in C–H functionalization reactions and to use the results of these investigations to deduce relevant transition state models.
Acknowledgments
This work was supported by NSF under the CCI Center for Selective C–H Functionalization, CHE-1205646. This work was also supported in the initial stages by NSF (CHE-0749506). The support and resources from the Center for High Performance Computing at the University of Utah are gratefully acknowledged. J.L.R. was supported as a Ruth Kirschstein NIH postdoctoral fellow (5F32GM089033) and as a fellow of the Center for Molecular Analysis and Design (CMAD) at Stanford.
Supporting Information Available
Experimental procedures, characterization data for new substances, mathematical modeling details. This material is available free of charge via the Internet at http://pubs.acs.org.
Author Present Address
§ Department of Chemistry, Duke University 3236 French Science Center, 124 Science Drive, Durham, North Carolina 27708, United States.
Author Contributions
∥ E. N. Bess and R. J. DeLuca contributed equally.
The authors declare no competing financial interest.
Funding Statement
National Institutes of Health, United States
Supplementary Material
References
- Gutekunst W. R.; Baran P. S. Chem. Soc. Rev. 2011, 40, 1976–1991. [DOI] [PubMed] [Google Scholar]
- Roizen J. L.; Harvey M. E.; Du Bois J. Acc. Chem. Res. 2012, 45, 911–922. [DOI] [PMC free article] [PubMed] [Google Scholar]
- Roizen J. L.; Zalatan D. N.; Du Bois J. Angew. Chem., Int. Ed. 2013, 52, 11343–11346. [DOI] [PMC free article] [PubMed] [Google Scholar]
- a Wells P. R. Chem. Rev. 1963, 63, 171–219. [Google Scholar]; b Hansch C.; Leo A.; Taft R. W. Chem. Rev. 1991, 91, 165–195. [Google Scholar]
- a Hammett L. P. Chem. Rev. 1935, 17, 125–136. [Google Scholar]; b Hammett L. P. J. Am. Chem. Soc. 1937, 59, 96–103. [Google Scholar]
- a Taft R. W. J. Am. Chem. Soc. 1952, 74, 3120–3128. [Google Scholar]; b Taft R. W. J. Am. Chem. Soc. 1953, 75, 4538–4539. [Google Scholar]
- Charton M. J. Am. Chem. Soc. 1975, 97, 1552–1556. [Google Scholar]
- a Bess E. N.; Sigman M. S.. Linear free energy relationships (LFERs) in asymmetric catalysis. In Asymmetric Synthesis II: More Methods and Applications; Christmann M., Bräse S., Eds.; Wiley-VCH Verlag GmbH & Co. KGaA: Weinheim, 2012; pp 363–370. [Google Scholar]; b Harper K. C.; Sigman M. S. J. Org. Chem. 2013, 78, 2813–2818. [DOI] [PubMed] [Google Scholar]; c Harper K. C.; Sigman M. S. Proc. Natl. Acad. Sci. U. S. A. 2011, 108, 2179–2183. [DOI] [PMC free article] [PubMed] [Google Scholar]; d Harper K. C.; Sigman M. S. Science 2011, 333, 1875–1878. [DOI] [PubMed] [Google Scholar]; e Jensen K. H.; Sigman M. S. Angew. Chem., Int. Ed. 2007, 46, 4748–4750. [DOI] [PubMed] [Google Scholar]; f Johnson C. D. Chem. Rev. 1975, 75, 755–765. [Google Scholar]; g Shorter J. Q. Rev., Chem. Soc. 1970, 24, 433–453. [Google Scholar]
- a Gustafson J. L.; Sigman M. S.; Miller S. J. Org. Lett. 2010, 12, 2794–2797. [DOI] [PMC free article] [PubMed] [Google Scholar]; b Harper K. C.; Bess E. N.; Sigman M. S. Nat. Chem. 2012, 4, 366–374. [DOI] [PubMed] [Google Scholar]
- a Milo A.; Bess E. N.; Sigman M. S. Nature 2014, 507, 210–214. [DOI] [PubMed] [Google Scholar]; b Denmark S. E.; Gould N. D.; Wolf L. M. J. Org. Chem. 2011, 76, 4337–4357. [DOI] [PMC free article] [PubMed] [Google Scholar]; c Gormisky P. E.; White M. C. J. Am. Chem. Soc. 2013, 135, 14052–14055. [DOI] [PubMed] [Google Scholar]
- Harper K. C.; Vilardi S. C.; Sigman M. S. J. Am. Chem. Soc. 2013, 135, 2482–2485. [DOI] [PubMed] [Google Scholar]
- Winstein S.; Holness N. J. J. Am. Chem. Soc. 1955, 77, 5562–5578. [Google Scholar]
- Curtin D. Y. Rec. Chem. Prog. 1954, 15, 110–128. [Google Scholar]
- a Verloop A. In Drug Design; Ariens E. J., Ed.; Academic Press: Waltham, MA, 1976; Vol. III, p 133. [Google Scholar]; b Verloop A.; Tipker J. Pharmacochem. Libr. 1977, 2, 63–81. [Google Scholar]; c Verloop A.; Tipker J. Pharmacochem. Libr. 1987, 10, 97–102. [Google Scholar]
- Hansch C.; Leo A.; Hoekman D.. Exploring QSAR: Volume 2: Hydrophobic, Electronic, and Steric Constants; American Chemical Society: Washington, D.C., 1995. [Google Scholar]
- Lewis E. S. J. Phys. Org. Chem. 1990, 3, 1–8. [Google Scholar]
- a Frisch M. J.; Trucks G. W.; Schlegel H. B.; Scuseria G. E.; Robb M. A.; Cheeseman J. R.; Scalmani G.; Barone V.; Mennucci B.; Petersson G. A.; Nakatsuji H.; Caricato M. L. X.; Hratchian H. P.; Izmaylov A. F.; Bloino J.; Zheng G.; Sonnenberg J. L.; Hada M.; Ehara M.; Toyota K.; Fukuda R.; Hasegawa J.; Ishida M.; Nakajima T.; Honda Y.; Kitao O.; Nakai H.; Vreven T.; Montgomery J. A. Jr.; Peralta J. E.; Ogliaro F.; Bearpark M.; Heyd J. J.; Brothers E.; Kudin K. N.; Staroverov V. N.; Kobayashi R.; Normand J.; Raghavachari K.; Rendell A.; Burant J. C.; Iyengar S. S.; Tomasi J.; Cossi M.; Rega N.; Millam N. J.; Klene M.; Knox J. E.; Cross J. B.; Bakken V.; Adamo C.; Jaramillo J.; Gomperts R.; Stratmann R. E.; Yazyev O.; Austin A. J.; Cammi R.; Pomelli C.; Ochterski J. W.; Martin R. L.; Morokuma K.; Zakrzewski V. G.; Voth G. A.; Salvador P.; Dannenberg J. J.; Dapprich S.; Daniels A. D.; Farkas Ö.; Foresman J. B.; Ortiz J. V.; Cioslowski J.; Fox D. J.. Gaussian 09, Revision C.01; Gaussian, Inc.: Wallingford, CT, 2009.; b Zhao Y.; Truhlar D. Theor. Chem. Acc. 2008, 120, 215–241. [Google Scholar]; c Valero R.; Gomes J. R. B.; Truhlar D. G.; Illas F. J. Chem. Phys. 2008, 129, 124710. [DOI] [PubMed] [Google Scholar]; d Schäfer A.; Horn H.; Ahlrichs R. J. Chem. Phys. 1992, 97, 2571–2577. [Google Scholar]; e Schäfer A.; Huber C.; Ahlrichs R. J. Chem. Phys. 1994, 100, 5829–5835. [Google Scholar]
- a Deming S. N.; Morgan S. L.. Experimental Design: A Chemometric Approach; Elsevier: Amsterdam, 1993; Vol. 11. [Google Scholar]; b Carlson R.Design and Optimization in Organic Synthesis; Elsevier: Amsterdam, 1992. [Google Scholar]
- Brown H. C.; Okamoto Y. J. Am. Chem. Soc. 1958, 80, 4979–4987. [Google Scholar]
- a Fiori K. W.; Du Bois J. J. Am. Chem. Soc. 2007, 129, 562–568. [DOI] [PubMed] [Google Scholar]; b Fiori K. W.; Espino C. G.; Brodsky B. H.; Du Bois J. Tetrahedron 2009, 65, 3042–3051. [Google Scholar]
- MATLAB Student Version, 8.1.0.604 (R2013a); The MathWorks, Inc.: Natick, MA, 2013.
- Arlot S.; Celisse A. Stat. Surv. 2010, 4, 40–79. [Google Scholar]
- Coates J.Interpretation of infrared spectra, a practical approach. In Encyclopedia of Analytical Chemistry; Meyers R. A., Ed.; Wiley: Chichester, U.K., 2000; pp 10815–10837. [Google Scholar]
Associated Data
This section collects any data citations, data availability statements, or supplementary materials included in this article.


