Abstract
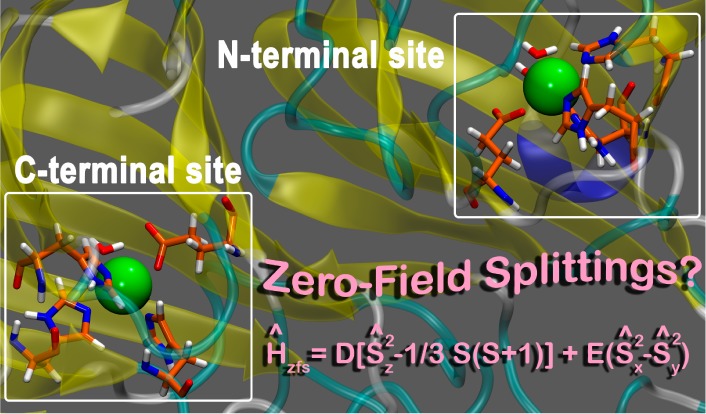
Oxalate decarboxylase (OxDC) catalyzes the Mn-dependent conversion of the oxalate monoanion into CO2 and formate. EPR-based strategies for investigating the catalytic mechanism of decarboxylation are complicated by the difficulty of assigning the signals associated with the two Mn(II) centers located in the N- and C-terminal cupin domains of the enzyme. We now report a mutational strategy that has established the assignment of EPR fine structure parameters to each of these Mn(II) centers at pH 8.5. These experimental findings are also used to assess the performance of a multistep strategy for calculating the zero-field splitting parameters of protein-bound Mn(II) ions. Despite the known sensitivity of calculated D and E values to the computational approach, we demonstrate that good estimates of these parameters can be obtained using cluster models taken from carefully optimized DFT/MM structures. Overall, our results provide new insights into the strengths and limitations of theoretical methods for understanding electronic properties of protein-bound Mn(II) ions, thereby setting the stage for future EPR studies on the electronic properties of the Mn(II) centers in OxDC and site-specific variants.
Introduction
Oxalate decarboxylase (OxDC) catalyzes the Mn-dependent conversion of oxalate monoanion into CO2 and formate.1 Although the enzyme appears to be found in many fungi and some bacteria,2 its biological function remains poorly understood. It has been shown, however, that OxDC is a constituent protein of the spore coat formed by Bacillus subtilis.3 The enzyme may also find utility in a number of biotechnological applications.4 Details of the mechanism by which OxDC mediates cleavage of the chemically unreactive C–C bond in oxalate5 remain to be clearly delineated. Heavy-atom isotope effect (IE) measurements6 and recent spin-trapping experiments7 are consistent with the hypothesis that reaction proceeds via heterolytic breakdown of a manganese-bound oxalate radical anion.8 In principle, the presence of Mn(II) in OxDC offers the opportunity to use EPR methods to explore the mechanistic role of the metal ion in catalysis.9 The situation is complicated, however, by the fact that the enzyme is composed of two cupin domains, each of which contains a Mn(II) ion in a similar coordination environment (Figure 1).10 As a result, even the high-field EPR spectra of the wild-type enzyme in buffer are complicated, and the effects of substrate binding and/or catalysis at a specific metal center are difficult to observe. It is therefore not surprising that two prior experimental studies have yielded conflicting assignments for the observed fine structure parameters of the two Mn(II) centers.12
Figure 1.
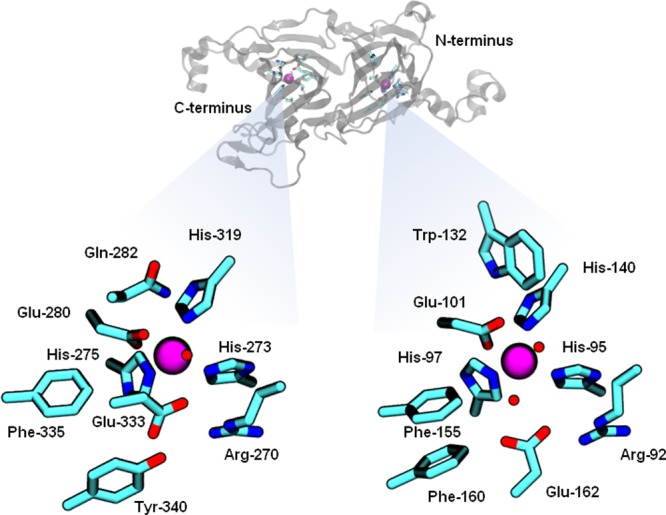
Representations of the Mn(II) binding sites in the N-terminal (right) and C-terminal (left) domains of Bacillus subtilis oxalate decarboxylase (1UW8).10a The location of the two Mn(II) centers in the monomer are indicated by the solid spheres in the ribbon drawing (top). Residue numbering is for the Bacillus subtilis enzyme. Color scheme: C, cyan; N, blue; O, red; Mn, purple. Metal-bound water molecules are shown as red spheres. The figure was rendered using VMD.11
In principle, the application of modern theoretical methods to obtain estimates of the fine structure parameters D and E associated with each of the two Mn(II) centers in OxDC represents a means of resolving the discrepancy in assignments of the previous EPR studies. In practice, however, any accurate computation of fine structure parameters from first principles represents a significant challenge for modern quantum mechanical methods. This is especially true for high-spin d5 systems where the balance between the direct electron–electron magnetic dipole spin–spin (SS) interaction involving unpaired electrons and a second order term, arising from the spin–orbit coupling (SOC) of electronically excited states into the ground state, gives rise to very small D values ranging from nearly 0 to 1.5 cm–1 (corresponding to interaction energies on the order of 0.004 kcal mol–1). Estimates of fine structure parameters obtained using theoretical methods are therefore the difference between large contributions that have the same order of magnitude and opposing signs. Thus, even minor errors in calculating either of the SS or SOC contributions can significantly affect the accuracy of the final results.13 Efforts to employ density functional theory (DFT) for the accurate prediction of fine structure parameters are also complicated by the delicate balance between exchange and correlation contributions. Be that as it may, any demonstration that theoretical calculations are capable of yielding even qualitative insights into zero-field splittings would have wide application in the study of Mn-dependent enzymes and likely facilitate the interpretation of EPR spectra for multicenter systems, such as OxDC.9 To date, however, only one study has been published in which an integrated experimental/computational strategy was used to assign the fine structure parameters associated with Mn(II) ions bound to enolase.14
We now report a mutational strategy that has allowed us to establish the assignment of EPR fine structure parameters to each of the Mn(II) centers in wild-type OxDC, at least at high solution pH. This work has also provided an opportunity to assess the performance of a combined DFT and DFT/MM computational strategy for calculating the zero-field splitting (zfs) parameters of the protein-bound Mn(II) ions in OxDC. Despite the known sensitivity of calculated D and E values to the computational approach,15 we demonstrate that good estimates of these parameters can be obtained using cluster models taken from carefully optimized DFT/MM structures. Overall, our findings not only confirm the assignments of Tabares et al.12b but also provide new insights into the strengths and limitations of theoretical methods for understanding electronic properties of protein-bound Mn(II) ions. This work also sets the stage for future EPR studies on the electronic properties of the Mn(II) centers in OxDC and site-specific variants.
Results and Discussion
High-Field (326.4 GHz) EPR Spectroscopy of Wild-Type OxDC
Mn(II) is a d5 ion with a total spin quantum number of S = 5/2. The transition between the mS = −5/2 and mS = −3/2 electron spin manifolds is emphasized at temperatures below 4 K because of a large population difference according to Boltzmann statistics.16 Spectroscopically, this transition extends over a field range of 6(D + E)/gμB, whereas that of the next higher energy transition between mS = −3/2 and mS = −1/2, typically observed at temperatures above 5 K, is only 3(D + E)/gμB.12b This is also true for the central transition between mS = −1/2 and mS = +1/2, although because these transitions are not directly affected by the fine structure to first order they are typically very sharp and intense. Importantly, frozen solution spectra observed at very low temperatures, at or below 4 K, which feature the mS = −5/2 and mS = −3/2 transitions, allow the direct determination of not only D and E values but also the sign of D.12b Hence, the largest deviation of the powder spectrum from the center happens at low field with the main turning point at −4|D|/gμB (measured from the center of the spectrum) for negative D values, whereas the highest field component appears at (2|D| + 6|E|)/gμB (Figure S1 in Supporting Information). The situation is reversed if D has a positive sign. In the event that the rhombic component, E, has an appreciable magnitude, a splitting is observed on the side with the smaller deviation from the center, featuring signals at (2|D| + 6|E|)/gμB and (2|D| – 6|E|)/gμB. The sign of E depends on how one defines the x- and the y-axis of the fine structure tensor, and it can only be determined using single-crystal EPR spectroscopy.16
In studies of OxDC and its site-specific variants, our strategy of resolving the fine structure relies on observing the transitions between higher mS states at the lowest possible temperature, which is between 2.5 and 3 K for our helium flow cryostat. These transitions are usually not very strong and require enzyme concentrations on the order of 20 mg/mL or higher to be reliably observed. We also routinely take EPR spectra at intermediate temperature (40 K) to distinguish between species exhibiting small and relatively large magnitudes of the fine structure parameters D and E. The high-field EPR (326.4 GHz) spectrum of wild-type (WT) OxDC at pH 8.5 in frozen solution (3 K) clearly showed transitions associated with higher mS states (Figure 2), enabling us to determine the fine structure values directly for at least one of the two Mn(II) species present in the enzyme. This pH was chosen because the X-ray crystal structure of WT OxDC, which was used in DFT and DFT/MM calculations, was obtained by crystallization at pH 8.5. We also note that observation of these weak transitions required the use of high enzyme concentrations (27 mg/mL), which could be achieved by modification of published purification protocols.3,5,7 The intensity of the central |+1/2⟩ ↔ |−1/2⟩ sextet centered at 11658 mT was greatly reduced due to Boltzmann population favoring the transition from the lowest level within the electron spin manifolds, |−5/2⟩ ↔ |−3/2⟩. On its low-field side, a broad peak was visible, centered at around 11450 mT, and on the high-field side, there was a negative signal at 11760 mT. A poorly resolved shoulder was observed above 11800 mT instead of the expected rhombic splitting, and because a fully axial fine structure tensor would yield a much narrower peak at high fields, this implied that the fine structure parameter, E, had a broad distribution spanning essentially the whole range from zero to the maximum possible value of |D|/3. By using a broad Gaussian distribution of E centered around 200 MHz with a half-width of 800 MHz, however, we were able to obtain a reasonable fit of the experimental spectrum (Figure 2). On the other hand, this approach was unable to recover the high-field shoulder present in the spectrum, implying that our experimental E/D ratios (Table 1) have large errors associated with them, thereby making it difficult to draw hard conclusions from these values.
Figure 2.
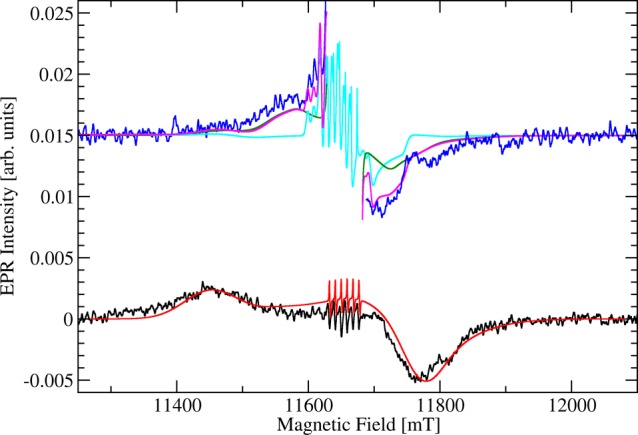
High-field (326.4 GHz) EPR spectra of WT OxDC taken at 3 K (black) and 40 K (blue) together with spectral simulations. Note that the central part of the spectrum at 40 K together with the corresponding spectral simulation of site I is removed for clarity. The enzyme (27 mg/mL) was dissolved in 50 mM Tris buffer containing 500 mM NaCl, pH 8.5. Lines from spectral simulations correspond to a single Mn(II) species (site I) with small zfs at 3 K (red) and 40 K (green) and a single Mn(II) species (site II) with very large zfs at 40 K (cyan). The sum of site I and site II simulations at 40 K is also shown (magenta). We note that site II does not contribute significantly to the spectral range visible. Unedited spectra and full sets of simulation parameters are provided elsewhere (Figures S2–S4 in Supporting Information).
Table 1. Experimental and Calculated Fine Structure Parameters, D and E, of the N-Terminal and C-Terminal Mn(II) Binding Sites in WT OxDC and the W132F OxDC Variant.
| site I |
site
II |
||||
|---|---|---|---|---|---|
| enzyme (active site) | type (pH) | D (MHz) | E/D | |D| (MHz) | E/D |
| WT OxDC | experimental (8.5) | –1350 | 0.15a | 10430 | 0.20a |
| WT OxDC (Tabares et al.)12b | Experimental (8.8) | –1110 | 0.27 | 10730 | 0.16 |
| WT OxDC (N-terminal) | DFT/MM-optimized | –1170 | 0.11 | g | |
| WT OxDC (C-terminal)b | DFT/MM-optimized | 4110h | 0.22 | ||
| WT OxDC (C-terminal)c | DFT/MM-optimized | 4560h | 0.14 | ||
| WT OxDC (C-terminal)d | DFT/MM-optimized | 7130h | 0.13 | ||
| W132F | experimental (8.5) | –1950 | 0.21a | 10430 | 0.20 |
| W132F (N-terminal)e | DFT/MM-optimized | –2100 | 0.23 | ||
| W132F (N-terminal)f | DFT/MM-optimized | –1350 | 0.10 | ||
The error for E/D values obtained in the present study is very large due to the broad distribution of E values that had to be assumed in the simulations. These values are obtained from the center of a broad Gaussian distribution of E (see text for more details).
Cluster model containing water as the fifth ligand (Figure 7b).
Cluster model containing hydroxide as the fifth ligand (Figure 7c).
Cluster model containing hydroxide as the fifth ligand with a hydrogen bond to a solvent water (Figure 7d).
Initial structure for QM/MM optimization based on the X-ray crystal structure of Co(II)-containing W132F OxDC variant.
Initial structure for QM/MM optimization from in silico modification of the X-ray crystal structure of WT OxDC (1UW8).
Not applicable.
In the text, we report either the positive or the negative D value as obtained by calculation. In this table, however, we give only absolute values for D in the case of the C-terminal site because the sign of this parameter could not be experimentally determined.
The spectrum at 40 K primarily showed the |−3/2⟩ ↔ |−1/2⟩ transitions on the low- and high-field side of a much stronger set of central |+1/2⟩ ↔ |−1/2⟩ sextet lines relative to those seen at 3 K (Figure 2). These transitions were now located closer to the spectral center, and the |−5/2⟩ ↔ |−3/2⟩ transitions were barely visible above the noise. Interestingly, there were three relatively sharp transitions visible on the low-field side of the spectrum together with a broader feature on the high-field side as one would expect from a pentacoordinate species with |D| of approximately 10 GHz. The appearance of overlapping spectra with differing zero-field splittings is consistent with the fact that OxDC contains two Mn binding sites.12 Simulations of the 40 K high-field EPR spectrum using the site I magnetic parameters extracted from the spectrum at 3 K together with a second species (site II) having very large fine structure (∼10 GHz) gave a satisfactory global fit (Figure 2) and yielded similar values for the fine structure parameters D and E (Table 1) to those reported previously.9b Site I has the smallest |D| value and carries about 68% of the spectral weight. Unfortunately, the transitions associated with the second Mn(II) (site II) were not of sufficient intensity to allow direct experimental observation. Instead, we had to rely on the second-order effect of the fine structure on the central mS = −1/2 to mS = +1/2 transitions, manifesting itself through broadenings and spectral splittings, which turn the sextet lines into a group of sharp lines at low field complemented by a broad Pake pattern on the high-field side (Figure S2 in Supporting Information).17 Given that these are second-order effects on the +1/2 ↔ −1/2 transitions, no information concerning the sign of D could be obtained from our simulation. Values for the g-factor and hyperfine coupling constant A with the 55Mn nucleus were also obtained for the two Mn(II) sites in the enzyme (Table S1 in Supporting Information). Both of these sites are similar to ones reported by Tabares and co-workers (Table 1),12b with site II most probably corresponding to a pentacoordinate Mn(II) ion observed in the C-terminal domain of the enzyme by X-ray crystallography (Figure 1).10a Hence, site I is likely associated with a hexacoordinate Mn(II) bound within the N-terminal domain of the enzyme.
Preparation and Kinetic Characterization of the W132F OxDC Variant
In order to confirm these assignments, we decided to prepare a site-specific OxDC variant in which only the zfs parameters of the N-terminal Mn(II) center would be perturbed, thereby leading to a shift in the D and E values associated with only one site. An analysis of the second sphere interactions revealed a hydrogen bonding interaction between the side chains of a conserved tryptophan (Trp-132) and the glutamate (Glu-101) coordinating Mn(II) in the N-terminal domain (Figure 3). We anticipated that removing this hydrogen bond would perturb the Mn(II)/Glu-101 interaction, thereby affecting the zfs parameters, and so the W132F OxDC variant, in which Trp-132 is replaced by phenylalanine, was expressed and purified following our standard procedures.6 Metal analysis showed that the recombinant enzyme contained 1.6 Mn/monomer. Steady-state kinetic analysis gave values of 63 s–1 and 50 mM for kcat and Km, respectively (Figure S5 in Supporting Information), and so the W132F OxDC variant exhibited a 10-fold lower catalytic efficiency (kcat/Km) than WT enzyme after normalizing for Mn(II) incorporation. However, the observations that (i) kcat was essentially unaffected by the site-specific mutation and (ii) Mn(II) incorporation was very similar in WT OxDC and the W132F OxDC variant supported the idea that the tertiary structure was not significantly affected by removal of the hydrogen bonding interaction.
Figure 3.
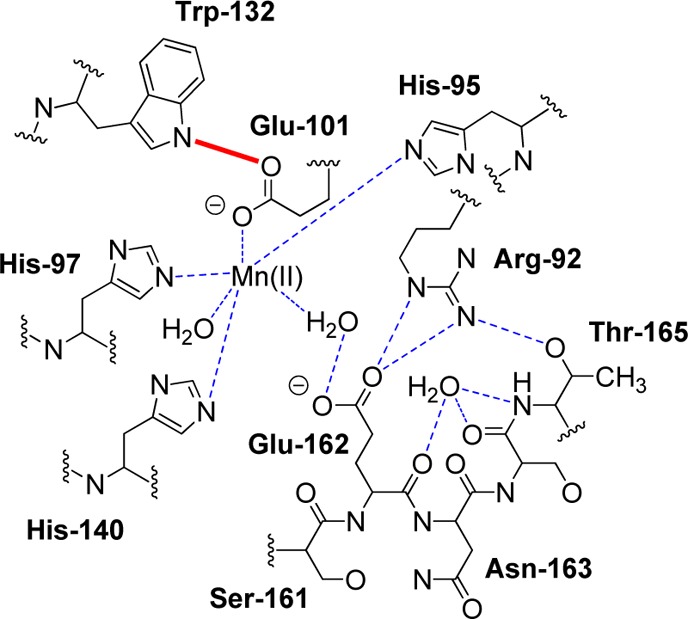
Schematic representation of hydrogen bonding interactions (dotted lines) involving residues in the Bacillus subtilis OxDC N-terminal Mn(II) binding site when the active site loop adopts a “closed” conformation.10a The Glu-101/Trp-132 hydrogen bond is shown in red. Reproduced with permission from ref (10a). Copyright 2004 American Society for Biochemistry and Molecular Biology.
X-ray Crystallography of the Co-Substituted W132F OxDC Variant
In order to ensure that there was indeed minimal impact on Mn(II) coordination and local protein structure as a result of replacing Trp-132 by phenylalanine, we sought to obtain an X-ray crystal structure of this OxDC variant. All efforts to grow diffraction quality crystals of the Mn(II)-substituted form of the W132F OxDC variant proved unsuccessful. We were able, however, to express and purify the Co(II)-containing form of the mutant enzyme using conditions that had been developed in prior investigations into OxDC metal selectivity,8a and this material gave crystals that were suitable for structure determination. The X-ray crystal structure of Co-substituted W132F OxDC was solved using phases calculated by molecular replacement and refined to a resolution of 2.1 Å. The overall protein fold of the Co-containing W132F variant did not differ significantly from WT enzyme, and the two structures superimposed with an rmsd of only 0.26 Å. More importantly, perhaps, the phenyl ring in the OxDC W132F variant was positioned in an identical orientation to the indole side chain of Trp-132 within the N-terminal Mn(II) binding site (Figure 4). Comparison of the metal–ligand bond distances in the Co-substituted form of the W132F OxDC variant and the Mn-containing WT enzyme also showed that they do not vary significantly in light of a 0.23 Å coordinate error for the W132F structure (Figure S6 in Supporting Information). This similarity of Co(II) and Mn(II) metal–ligand bond lengths in OxDC is consistent with data in the Scripps Metalloprotein Database.18 For example, the average bond lengths for protein residues to Mn(II) ranges from 1.5 to 2.9 Å with an average value of 2.20 Å. Co(II)-containing proteins have an average amino acid ligand bond length of 2.16 Å and range from 1.55 to 2.69 Å. Similarly, the bond distances for water ligands bound to Mn(II) and Co(II) range from 1.05 to 3.09 Å (2.26 Å average) and 1.36–2.99 Å (2.26 Å average), respectively. Hence, at least in terms of metal–ligand bond distances and angles, Co(II) is a good mimic of Mn(II). As importantly, and despite the fact that Co-containing WT OxDC is catalytically inactive,8a the side chain carboxylate of the functionally important residue Glu-162,19 which is located on a mobile active site loop segment Ser161-Glu162-Asn163-Ser164 (Bacillus subtilis numbering),10,20 undergoes only a small shift in position as a result of the site-specific mutation. On the other hand, we noted that the ring of His-97 had become “flipped” relative to its orientation in WT OxDC (Figure 5). Efforts to refine the structure of the variant enzyme with His-97 oriented in the same manner as observed in WT enzyme, however, merely resulted in reorientation of the ring to the original position in our initial structure for the W132F variant. The correct positioning of the His-97 side chain was also verified by a composite omit map (Figure S7 in Supporting Information). Importantly, the structure of the Co-substituted enzyme confirmed that replacement of Trp-132 by phenylalanine did not perturb the structure of the C-terminal Mn(II) binding site (Figure 4).
Figure 4.
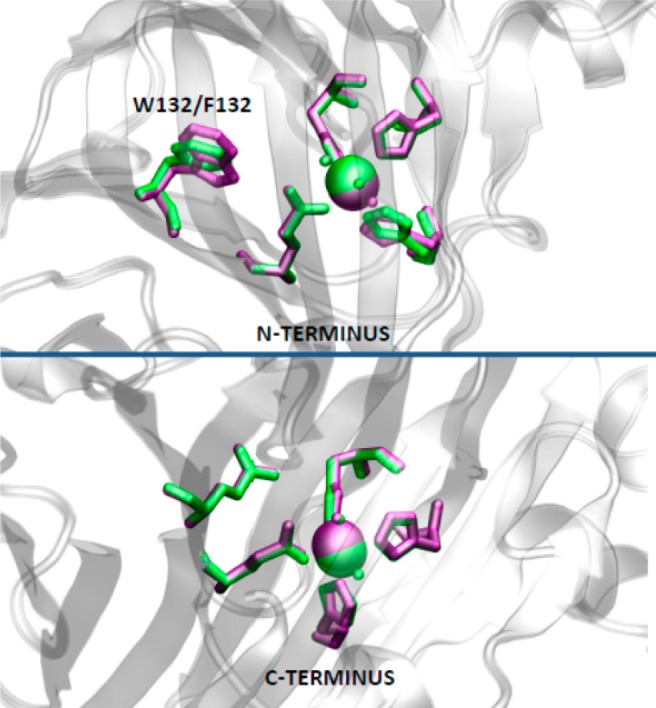
Schematic representation of the structural changes in the N-terminal (top) and C-terminal (bottom) metal centers resulting from replacement of Trp-132 by phenylalanine. The figure was generated by superimposing the X-ray crystal structures of WT OxDC (1UW8) (purple) and the Co-containing W132F OxDC variant (green). The figure was rendered using VMD.11
Figure 5.
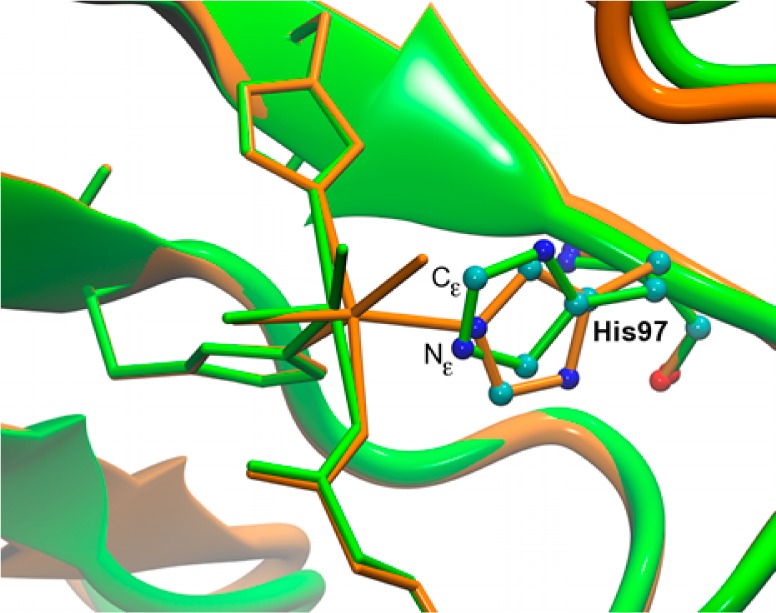
Superimposition of the Mn(II) N-terminal binding sites observed in the X-ray crystal structures of WT OxDC (orange) and the Co-containing W132F OxDC variant (green). Only the residues in the first coordination sphere around the metal are depicted as sticks. Figure rendered using VMD.11
High-Field EPR (326.4 GHz) Spectroscopy of the W132F OxDC Variant
Given the kinetic and structural evidence that removal of the hydrogen bonding interaction between Glu-101 and Trp-132 was likely only to perturb the N-terminal Mn(II) center, we measured the high-field EPR (326.4 GHz) spectrum of the W132F OxDC variant at pH 8.5 (Figure 6). The W132F OxDC variant shows a broader spectrum of its transitions between higher mS states when compared with the WT enzyme. Hence, the low-field maximum now appeared at 11386 mT, and although the negative peak appeared to be centered at 11780 mT (little shifted compared to WT enzyme), it was broader and reached out to higher fields (Figure 6). As perhaps expected from the negligible alterations to the structure of the C-terminal Mn(II) binding site in the Co-substituted W132F OxDC variant (Figure 4), the 40 K EPR spectrum showed evidence for a pentacoordinated Mn(II) species exhibiting the telltale sharp peaks at the low-field side and a Pake pattern at the near high-field side of the spectrum. As in our earlier studies of WT OxDC, we were able to simulate the observed transitions by assuming that only two Mn sites were present (Figure 6). Hence, assuming a single Mn(II) species having a negative D value of −1950 MHz and a large Gaussian distribution of E values centered around 400 MHz with a half-width of 1200 MHz gave a reasonable simulation of the low-field side of the spectrum even though the broad feature on the high-field side could only be partially reproduced. An improved simulation could be obtained using a much broader non-Gaussian spectral distribution of D and E in which D and E ranged between −1600 and −2100 MHz and between 100 MHz and the maximum value of |D|/3, respectively (Figure S10 in Supporting Information). Both simulations, however, provide clear experimental evidence for a significant increase in the magnitude of D for one of the Mn(II) sites in the W132F OxDC variant when compared to WT enzyme. This spectroscopic behavior is therefore consistent with the hypothesis that removal of the Glu-101/Trp-132 hydrogen bond would impact the electronic structure of the Mn(II) ion bound in the N-terminal domain.
Figure 6.
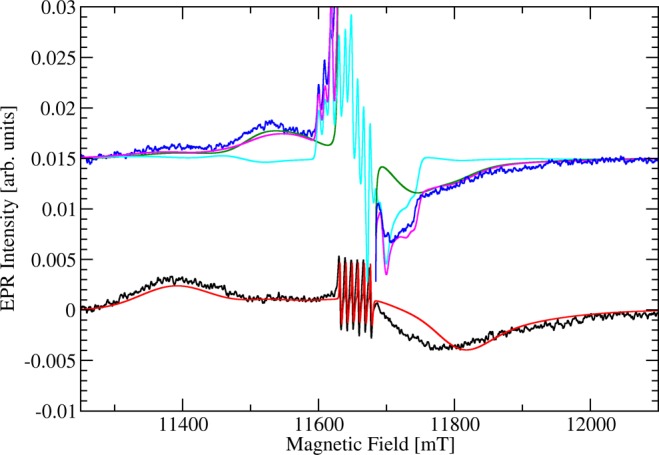
High-field (326.4 GHz) EPR spectra of the Mn-containing W132F OxDC variant taken at 3 K (black) and 40 K (blue) together with spectral simulations. Note that the central part of the spectrum at 40 K together with the corresponding spectral simulation of site I is removed for clarity. The enzyme (40 mg/mL) was dissolved in 50 mM Tris buffer containing 500 mM NaCl, pH 8.5. Lines from spectral simulations correspond to a single Mn(II) species (site I) with small zfs at 3 K (red) and 40 K (blue) and a single Mn(II) species (site II) with very large zfs at 40 K (cyan). The sum of site I and site II simulations at 40 K is also shown (magenta). We note that site II does not contribute significantly to the spectral range visible. Unedited spectra and full sets of simulation parameters are provided elsewhere (Figures S8–S10 in Supporting Information).
DFT and DFT/MM Calculations on WT OxDC
The ability of DFT and wave-function-based methodologies (widely and successfully used to model mononuclear inorganic complexes21) to compute zfs values for a series of Mn(II) transition metal complexes has been evaluated.15 Perhaps, unsurprisingly, these studies revealed that the computed zfs values are highly dependent on molecular geometry. The availability of good structural and experimental zfs data for WT OxDC offered the opportunity to examine whether QM/MM methods for obtaining optimized active site geometries might yield structures that could (at the very least) be used to compute qualitatively correct estimates of the zfs parameters for protein-bound Mn(II) ions. Thus, an initial structure for performing QM/MM geometry optimizations was generated from classical MD simulations of WT OxDC solvated in water at physiological conditions. Although two X-ray structures have been reported for the enzyme, we used the one containing a pentacoordinate Mn(II) ion in the C-terminal domain (PDB ID: 1UW8) to obtain the initial set of atomic coordinates for all subsequent calculations on WT OxDC (Figure 1). After QM/MM optimization of the metal centers in the initial enzyme, a set of cluster models were defined in which only OH/H2O molecules in the active site cavity and the side chains of all the residues in the first coordination sphere around the metal were included (Figure 7).
Figure 7.
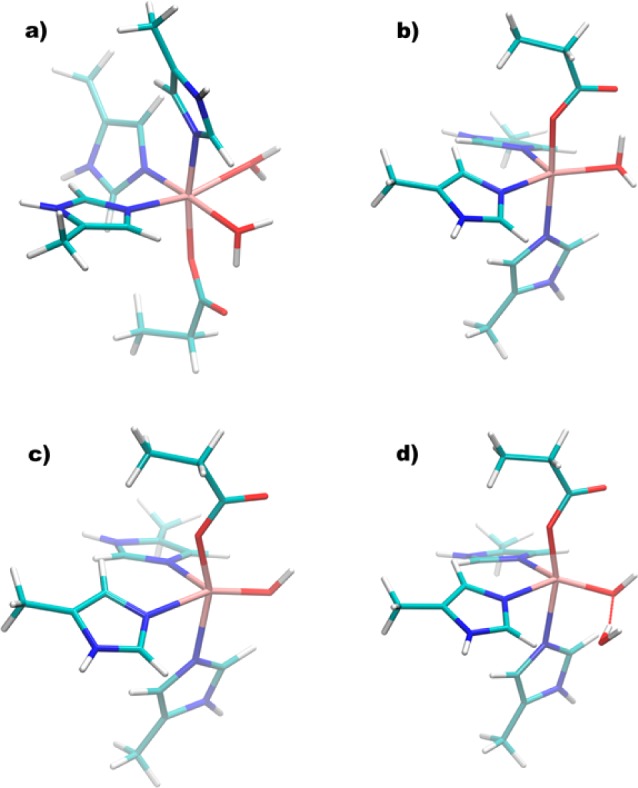
Cluster models taken from the DFT/MM-optimized structure of WT OxDC that were used to calculate the zfs values of the bound Mn(II) ions in the (a) N-terminal and (b–d) C-terminal domains (see text for details). Color scheme: C, cyan; H, white; N, blue; oxygen, red; Mn, tan.
These models were then used in calculations of the zfs parameters that employed the hybrid B3LYP22 functional in conjunction with triple-ζ (def2-TZVP) valence basis sets. Remarkably, excellent agreement was obtained in the prediction of both D and E/D values when QM/MM-optimized geometries were used to obtain the atomic coordinates for these models, showing the importance of the surrounding residues in modulating the geometric features of the OxDC active sites (Table 1 and Table S2 in Supporting Information). For example, the D value of −1170 MHz computed for the N-terminal Mn(II) cluster model (Figure 7a) was similar in both sign and absolute magnitude to that observed for site I (D = −1350 MHz, Table 1). Computing good estimates for the D value associated with the C-terminal Mn(II) center required more effort. For example, an initial calculation on a cluster in which water was used as the fifth ligand (Figure 7b) gave a D value of −4110 MHz from B3LYP/def2-TZVP calculations, which is considerably smaller than the observed |D| value of 10430 MHz (Table 1). Closer examination of the X-ray crystal structure, however, showed that the Mn–O distance in the C-terminal Mn(II) site was only 2.15 Å, whereas both Mn–O distances for the metal center in the N-terminal domain were significantly longer (2.31 and 2.33 Å). This observation thereby raised the possibility that the fifth ligand in the C-terminal site was a hydroxide ion rather than water. As a result, and especially given that the crystal structure (1UW8) had been obtained at pH 8.5, we examined the effects of modeling the fifth ligand as a hydroxide ion. We therefore reoptimized the WT OxDC following the protocol previously outlined, except that hydroxide was bound to the metal in the C-terminal binding site, and created another cluster model of this Mn(II) center (Figure 7c). B3LYP/def2-TZVP calculations using this third model gave a computed D value of 4560 MHz, which was a slight, albeit small, improvement. We noticed, however, that additional water molecules entered the C-terminal Mn(II) binding site during the initial set of classical MD simulations used in equilibrating the system. One of these waters formed a hydrogen bond to the Mn(II)-bound hydroxide ligand after DFT/MM optimization. The B3LYP/def2-TZVP calculations were therefore repeated for a new cluster model containing this water molecule (Figure 7d), with the result that a D value of −7130 MHz was obtained. This is in much better agreement with the experimentally observed value for the site II Mn(II) species. We also note that the calculated E/D ratio for site I was similar to that obtained by analyzing the high-field EPR spectra, although any comparison of theoretical and our experimental E/D values is devalued by the broad distribution of E values needed in the spectral simulations. Despite this complication, our DFT-based computational strategy again supports the zfs assignments of Tabares et al.12b
DFT and DFT/MM Calculations on the W132F OxDC Variant Built from the X-ray Crystal Structure of the Co(II)-Containing Enzyme
As an additional validation of our strategy for obtaining accurate geometries for Mn(II) binding sites in proteins that permit practically useful theoretical estimates of their corresponding zfs values, we constructed an optimized model of the Mn(II)-containing W132F OxDC variant based on the 2.1 Å resolution X-ray crystal structure of the Co(II)-substituted enzyme. After “replacing” the Co(II) ions with Mn(II), our standard DFT/MM procedure was used to optimize the resulting structure. As discussed above, the N-terminal Mn(II) coordination environment in the initial configuration exhibited some unexpected features, including (i) rotation of the His-97 imidazole ring by about 180° relative to its orientation in the X-ray crystal structure of WT OxDC, and (ii) almost identical Mn–Nε (2.45 Å) and Mn–Cε (2.47 Å) distances for the interaction of the metal with His-97 (Figure 5).
In contrast, the final computational model of the Mn(II)-containing W132F OxDC variant obtained using our standard protocol (equilibration using classical MD simulation followed by DFT/MM optimization) did not contain these unexpected structural features (Figure 8). Thus, the His-97 imidazole ring underwent a rotation of about 70° with respect to its orientation in the initial structure, and the Mn–Nε (2.24 Å) and Mn–Cε (3.21 Å) distances became appreciably different. Most importantly, however, B3LYP/def2-TZVP calculations on a cluster model of the N-terminal Mn(II) site gave a D value of −2100 MHz in very good agreement with experiment (D = −1950 MHz) (Table 1).
Figure 8.
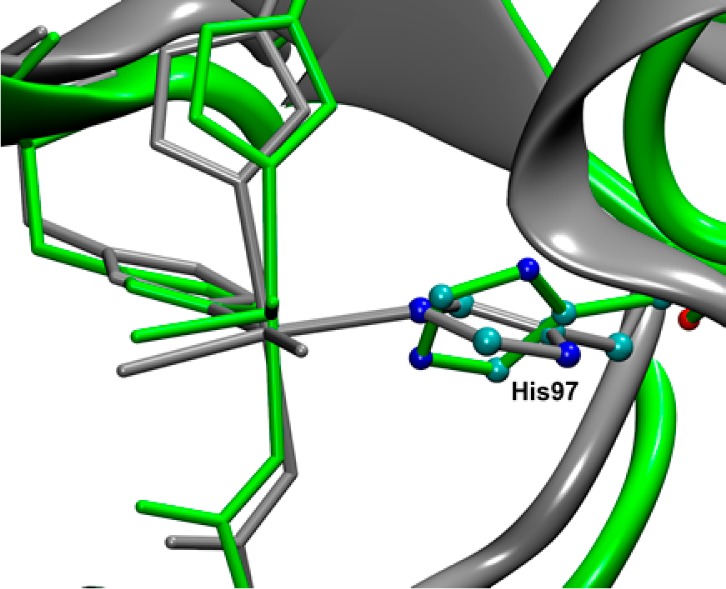
Superimposition of the N-terminal Mn(II) binding sites present in the X-ray crystal structure of the Co-containing W132F OxDC variant (green) and the DFT/MM-optimized structure of the Mn(II)-containing W132F OxDC variant (gray). Only the residues in the first coordination sphere around the metal are depicted as sticks. Figure rendered using VMD.11
DFT and DFT/MM Calculations on the W132F OxDC Variant Built from the X-ray Crystal Structure of WT OxDC
We also assessed the ability of our computational protocol to be employed in a predictive manner by calculating the Mn(II) zfs values for the N-terminal metal center in a model of the W132F OxDC variant prepared by in silico mutation. Hence, the X-ray crystal structure of WT OxDC (1UW8) was computationally modified so that Trp-132 was replaced by a phenylalanine residue. The resulting model was then equilibrated and optimized using our standard protocol to give a final structure in which the hydrogen bond between the Glu-101 side chain, and the closest Mn(II)-bound water became slightly shorter as a consequence of removing the interaction between Glu-101/Trp-132 (Table 2). Changes in other metal–ligand bond distances were also observed together with slight changes in the locations of the side chains of some nearby residues. Once again, B3LYP/def2-TZVP calculations were performed on a cluster model of the N-terminal Mn(II) site corresponding to that used for calculations on WT OxDC (Figure 7a). The computed D value of −1350 MHz (Table 1) shows that this optimized model structure captures the increased magnitude of D that is experimentally observed on removal of the Glu-101/Trp-132 hydrogen bond. On the other hand, the absolute value is smaller than that computed from a model based on the X-ray crystal structure of the Co(II)-containing W132F OxDC variant (Table 1). Given that superimposition of the two cluster models used to compute the zfs parameters for the N-terminal Mn(II) site in the W132F OxDC variant showed all metal–ligand distances to be similar in both structures, the difference in the calculated D values likely arises from altered orientations of the imidazole rings of His-97 and (to a smaller extent) His-95 (Figure 9). Taken overall, these results suggest that the computational strategy described in this paper yields reliable structural information and, as a consequence, very good estimates of zfs values for protein-bound Mn(II) centers. Importantly, our approach opens the possibility of computing fine structure parameters in biomolecular systems for which only lower-resolution crystal structures are available.
Table 2. Mn(II)–Ligand Internal Coordinates in the Cluster Models Used To Obtain the Computed Zero-Field Splitting Values.
| internal coordinatea | WT OxDCb | WT OxDCc | WT OxDCd | W132F (model 1)e | W132F (model 2)f |
|---|---|---|---|---|---|
| Mn–O(Glu101)g | 2.12 | h | 2.15 | 2.11 | |
| Mn–N(His95) | 2.29 | 2.24 | 2.27 | ||
| Mn–N(His97) | 2.31 | 2.24 | 2.31 | ||
| Mn–N(His140) | 2.36 | 2.36 | 2.35 | ||
| Mn–O(Wat1) | 2.33 | 2.39 | 2.36 | ||
| Mn–O(Wat2) | 2.21 | 2.28 | 2.19 | ||
| (Glu101)O–Mn–N(His95) | 172.6 | 168.8 | 176.3 | ||
| (Glu101)O–Mn–N(His97) | 89.3 | 87.3 | 87.2 | ||
| (Glu101)O–Mn–N(His140) | 92.2 | 86.4 | 94.1 | ||
| (Glu101)O–Mn–O(Wat1) | 100.9 | 98.5 | 99.0 | ||
| (Glu101)O–Mn–O(Wat2) | 88.5 | 90.4 | 90.5 | ||
| (His95)N–Mn–N(His97) | 95.8 | 92.8 | 95.2 | ||
| (His95)N–Mn–N(His140) | 82.4 | 86.7 | 83.1 | ||
| (His95)N–Mn–O(Wat1) | 85.0 | 92.6 | 84.0 | ||
| (His95)N–Mn–O(Wat2) | 86.7 | 92.0 | 87.2 | ||
| (His97)N–Mn–N(His140) | 90.4 | 103.2 | 90.6 | ||
| (His97)N–Mn–O(Wat1) | 85.2 | 86.1 | 84.3 | ||
| (His97)N–Mn–O(Wat2) | 175.4 | 166.4 | 175.6 | ||
| (His140)N–Mn–O(Wat1) | 166.2 | 169.7 | 165.6 | ||
| (His140)N–Mn–O(Wat2) | 93.8 | 90.0 | 93.3 | ||
| (Wat1)O–Mn–O(Wat2) | 91.2 | 81.1 | 92.4 | ||
| Mn–O(Glu280) | 2.05 | 2.07 | 2.10 | ||
| Mn–N(His273) | 2.46 | 2.27 | 2.33 | ||
| Mn–N(His275) | 2.30 | 2.25 | 2.43 | ||
| Mn–N(His319) | 2.41 | 2.25 | 2.33 | ||
| Mn–O(H) | 2.00 | 2.19i | 1.98 | ||
| (Glu280)O–Mn–N(His273) | 163.6 | 173.2 | 157.0 | ||
| (Glu280)O–Mn–N(His275) | 81.1 | 85.0 | 75.8 | ||
| (Glu280)O–Mn–N(His319) | 98.5 | 98.9 | 97.0 | ||
| (Glu280)O–Mn–O(H) | 116.0 | 90.2 | 116.8 | ||
| (His273)N–Mn–N(His275) | 83.7 | 88.5 | 81.5 | ||
| (His273)N–Mn–N(His319) | 78.2 | 85.1 | 82.6 | ||
| (His273)N–Mn–O(H) | 79.7 | 94.3 | 86.0 | ||
| (His275)N–Mn–N(His319) | 100.2 | 109.2 | 98.8 | ||
| (His275)N–Mn–O(H) | 139.7 | 148.5 | 158.5 | ||
| (His319)O–Mn–O(H) | 111.7 | 102.3 | 96.7 |
Bond lengths (Å) and angles (°).
QM/MM-optimized structure with the bound hydroxide in the C-terminal Mn(II) center forming a hydrogen bond to a water molecule. This structure was obtained from the X-ray crystal structure of WT OxDC (1UW8) (Figure 7a,d).
QM/MM-optimized structure with water bound to the C-terminal Mn(II) center based on the X-ray crystal structure (1UW8) (Figure 7b).
QM/MM-optimized structure with hydroxide bound to the C-terminal Mn(II) center based on the X-ray crystal structure (1UW8) (Figure 7c).
QM/MM-optimized structure obtained from the X-ray crystal structure of the Co(II)-containing W132F OxDC variant.
QM/MM-optimized structure obtained from in silico substitution of the X-ray crystal structure of WT OxDC (1UW8).
Bacillus subtilis residue numbering.
Not applicable.
Mn(II)-bound water.
Figure 9.
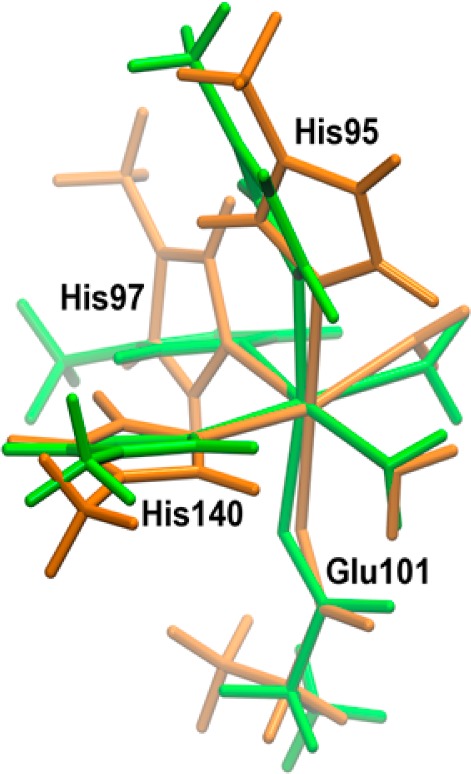
Superimposition of the cluster models used to calculate the zfs parameters of the Mn(II) N-terminal binding site in the W132F OxDC variant. Color scheme: green, initial structure based on the X-ray crystal structure of the Co(II)-containing variant; orange, initial structure derived from the X-ray crystal structure of WT enzyme (in silico substitution). Figure rendered using VMD.11
Conclusions
In addition to resolving the question of Mn(II) assignments for OxDC, this study provides further evidence for the utility of advanced quantum mechanical calculations in probing the electronic structure of protein-bound metal centers. To date, there have been few such calculations, in part because previous efforts to compute zfs parameters on a series of Mn(II)-containing complexes gave large differences between theoretically predicted and experimentally measured values. These discrepancies can be attributed to the high sensitivity of the zfs parameters to the geometrical features of the structures used for the calculations. It is also true that the requirement that zfs parameters reflect only small energy differences places considerable demands on the computational methods used to obtain them, and only a qualitative agreement giving rise to correct trends can be expected in general. On this point, we note that the overestimated D values found in efforts to compute the zfs parameters for the Mn(II) ions bound to enolase14 were attributed both to the high sensitivity of the calculated values to the molecular geometries employed and the use of DFT calculations instead of correlated ab initio methods. However, some of the limitations associated with the use of DFT methodologies might be overcome by employing the more recently developed coupled-perturbed spin–orbit coupling (CP-SOC) formalism (as used here) instead of the Pederson and Khanna (PK) approach used in the previous work on enolase-bound Mn(II) ions, provided that the direct spin–spin interaction is properly included in the treatment. In particular, systematic investigation of the ability of coupled-perturbed DFT methodologies to estimate zfs parameters in Mn(II) transition metal complexes15 also showed that reliable results could be obtained using a hybrid DFT functional (B3LYP) if accurate geometries were employed.
The theoretical results reported herein, however, demonstrate that the use of a strategy based on computation of zfs parameters at the DFT theory level for cluster models obtained from QM/MM-optimized structures has some value, especially if high-quality X-ray structures are available for the protein, or site-specific variant, of interest. Indeed, the reorientation of the His-97 side chain observed upon the application of our computational protocol was likely an essential element in obtaining good agreement between the calculated and experimentally observed zfs parameters. Our results also show that QM/MM-optimized models of variant structures can also yield qualitatively correct changes in computed zfs values, especially when the site-specific mutation does not introduce large structural changes in the metal ion environment. Presumably this reflects the ability of carefully equilibrated QM/MM structures to capture the critical metal–ligand interactions, such as metal–ligand distances and coordination geometries, needed to obtain good estimates of zfs parameters. Although additional systematic computational investigations on the problem of computing zfs values are clearly needed, our findings set the scene for theoretical studies aimed at delineating the effect of active site modifications on the electronic structure of the metal centers in OxDC and, perhaps, other Mn-dependent enzymes.
Experimental Section
Expression, Purification, and Kinetic Characterization of WT OxDC and the Mn(II)- and Co(II)-Containing W132F OxDC Variants
Unless otherwise stated, all chemicals were purchased in the highest purity from Sigma (St. Louis, MO) or Fischer Scientific (Pittsburgh, PA). Nickel-nitrilotriacetic acid agarose (Ni-NTA) was obtained from Qiagen (Germantown, MD). Protein concentrations were determined using the Bradford assay (Pierce, Rockford, IL).23 All DNA primers were obtained from Integrated DNA Technologies, Inc. (Coralville, IA), and DNA sequencing was performed by the core facility in the Interdisciplinary Center for Biotechnology Research at the University of Florida. ICP-MS determinations of metal content were performed at the University of Georgia Center for Applied Isotope Studies Chemical Analysis Laboratory (Athens, GA). The gene encoding the W132F OxDC variant was constructed by overlap extension (see Supporting Information).24 The recombinant His6-tagged Mn(II)-substituted W132F OxDC variant was expressed and purified following published procedures,8a except that expression was induced in the presence of 5 mM MnCl2 after heat shocking the bacteria for 12 min at 42 °C with constant agitation. After the addition of IPTG, the cultures were incubated at 37 °C for 4 h before being harvested by centrifugation at 2000g for 20 min (4 °C). After sonication in lysis buffer, the resulting supernatant was centrifuged at 20 000g for 20 min (4 °C) before the enzyme was purified from the cleared lysate by metal affinity chromatography on a Ni-NTA column. The eluted protein was then subjected to dialysis at 4 °C to give a solution in 50 mM Tris buffer containing 500 mM NaCl, pH 8.5. Samples used for EPR analysis were incubated with Chelex resin before being concentrated to 27 mg/mL using an Amicon Centriprep YM-30 filter unit from Millipore (Billerica, MA). The catalytic properties of the His6-tagged Mn(II)-containing W132F OxDC variant were determined by measuring formate production using an end-point assay as described elsewhere.6a Measurements were made at specific substrate and enzyme concentrations in triplicate, and the data were analyzed to obtain the values of V and V/K by standard computer-based methods.25 His6-tagged Co(II)-containing W132F OxDC was expressed as described previously with the addition of 2 mM CoCl2 after heat shocking the cells at 42 °C for 18 min. Cells were lysed using a microfluidizer, and the mixture was clarified by centrifugation at 38 000g for 30 min. The soluble protein was then purified using a Talon cobalt column. The eluate was dialyzed overnight in the storage buffer (50 mM Tris-HCl, pH 8.5, and 500 M NaCl), and the protein was then further purified on a 320 mL sephacryl S-100 gel filtration column.
X-ray Crystal Structure of the Co-Substituted W132F OxDC Variant
Purified Co(II)-containing W132F OxDC was concentrated to 5 mg/mL in 100 mM Tris-HCl, pH 8.5, containing 500 mM NaCl. Crystals were obtained by the vapor diffusion method with hanging drop geometry by mixing protein (2 μL) and well solution (2 μL). The well solution contained 100 mM Tris-HCl, pH 8.5, 2 M NaCl and 10% PEG 6000. Crystals, which were rectangular prisms (0.3 × 0.2 × 0.2 mm), appeared in approximately 2 months at 17 °C and were cryo-protected in well solution containing 25% glycerol and flash frozen in liquid nitrogen. The Co(II)-substituted W132F variant crystallized in space group R32 with unit cell dimensions a = b = 156.973 Å and c = 330.473 Å. Data were collected to 1.9 Å resolution at the National Synchrotron Light Source (NSLS), Brookhaven National Laboratory (Upton, NY), at beamline X25 equipped with a Pilatus 6M detector (Table 3). Phasing was achieved by molecular replacement26 (Phaser-MR in the Phenix software suite27) using the model of formate-containing WT OxDC (PDB 1J58)10b after removal of all ligands. The structure was refined using alternating rounds of manual rebuilding in COOT28 followed by minimization in PHENIX to give a final model that contained residues 6–382 with 4 molecules in the asymmetric unit, 1228 waters, and 8 Co(II) ions. The model was refined to 2.1 Å resolution with a Rwork and Rfree of 19.6 and 22.7%, respectively (Table 3). The Ramachandran plot shows that 97.6% of residues fall in the most favored regions with 2.3% in the allowed regions. The maximum likelihood coordinate error is 0.23 Å, consistent with accurate coordinates. Coordinates and structure factors for the Co(II)-containing W132F variant have been deposited in the PDB with accession code 4MET.
Table 3. Crystallographic Data and Refinement Statisticsa.
| data Collection | refinement | ||
|---|---|---|---|
| resolution (highest resolution shell) (Å) | 47.39–2.095 (2.17–2.095) | protein residues/water molecules per asu | 1508/1228 |
| X-ray source | X25, NSLS | other ligands per asu | 8 |
| wavelength (Å) | 0.979 | reflections (work/free) | 91562/1997 |
| space group | R32 | Rwork/Rfree (%) | 19.6/22.7 |
| cell dimension (Å) | a = b = 156.97, c = 330.47 | resolution (Å) | 49.06–2.09 |
| reflections observed (unique) | 177937 (91647) | average B-factor (Å2) | |
| completeness (%) | 99.7 (100) | protein (Å2) | 23.15 |
| Rmerge (%)b | 14.7 (29.2) | Co(II) (Å2) | 17.55 |
| I/σ (I) | 3.3 (2.56) | water (Å2) | 21.02 |
| redundancy | 19.1 (13.2) | rmsdc bond lengths (Å) | 0.008 |
| rmsd bond angles (°) | 1.113 |
Data for the highest resolution shell is in parentheses.
Rmerge = ∑hkl∑i|Ihkl,i – ⟨Ihkl⟩I|/∑hkl∑i|Ihkl,i |, where ⟨Ihkl⟩ is the mean intensity of the multiple Ihkl,i observations for symmetry-related reflections.
Root-mean-square deviation.
EPR Studies of WT OxDC and the W132F OxDC Variant
High-field EPR spectra at 324.6 GHz were recorded at the National High Magnetic Field Laboratory (NHMFL), using a homodyne transmission-mode spectrometer with a nonresonant probe and a 17 T superconducting magnet.29 WT OxDC (27 mg/mL; 1.4 Mn/monomer) or the W132F OxDC variant (40 mg/mL; 1.6 Mn/monomer) was dialyzed into 50 mM Tris, pH 8.5, containing 500 mM NaCl. Approximately 200 μL of this solution was placed into a Teflon cup with 7.2 mm i.d. and placed into the FIR beam of the spectrometer at 4 K, as measured using a built-in carbon-glass temperature sensor in the cryostat. A Cernox sensor was used to map out the temperature scale at the sample position to correct for any temperature gradient in the cryostat. Spectra were taken with a modulation amplitude of approximately 27 G at a modulation frequency of 30 kHz using a phase-sensitive lock-in detector with the time constant set to 300 ms. Field scans were taken with a sweep speed of 2 mT/s. The spectra were simulated based on the usual spin Hamiltonian (shown below) using the EasySpin toolbox for Matlab.30
MD Simulations
MD simulations of the wild-type form of OxDC were based on the 1UW8 crystal structure of the enzyme. Two different procedures were employed to build the W132F OxDC variant: (i) in silico mutation, manually substituting Trp-132 by Phe in the 1UW8 X-ray structure, and (ii) replacement of Co with Mn using the Co-substituted W132F OxDC mutant as template. In every case, the initial structure was immersed in a periodic box of approximately 77 × 118 × 87 Å3 containing about 22 500 water molecules and neutralized with Na+ counterions. The box dimensions were chosen to achieve a minimum distance of 30 Å between two periodically replicated images of the protein. The all-atom AMBER03 force field31 was used to model protein residues and ions, whereas the TIP3P model32 was employed for water molecules. All potentially charged amino acids, including the C- and N-termini, were considered to be in their default protonation states at physiological pH (i.e., charged). Electrostatic interactions were taken into account using the particle mesh Ewald algorithm33 with a real space cutoff of 10 Å. The same cutoff was employed for the treatment of the van der Waals interactions. Bonds involving hydrogen atoms were constrained using the SHAKE algorithm.34 An integration time step of 2 fs was used. Constant temperature (300 K) and pressure (1 atm) were achieved by coupling the systems to a Langevin thermostat and a Nosé–Hoover Langevin barostat, respectively.35,36 Systems were first minimized using a conjugate gradient algorithm and then heated to 300 K in 600 ps while keeping positional restraints on protein heavy atoms. For each system, an initial run of 5.4 ns in the NPT ensemble, slowly removing the restraints, was followed by a subsequent 20 ns simulation in the canonical (NVT) ensemble in order to provide starting configurations for the subsequent QM/MM optimizations. All the classical MD simulations were carried out using the NAMD package.37
QM/MM Geometry Optimizations
QM/MM geometry optimizations were performed starting from equilibrated configurations taken from the aforementioned classical runs. The quantum mechanical/molecular mechanical (QM/MM) implementation employed combines the use of the QM program QUICKSTEP38 and the MM driver FIST, both part of the CP2K package (freely available at http://cp2k.berlios.de, released under GPL license). In this code, the general QM/MM scheme is based on a real-space multigrid technique to compute the electrostatic coupling between both QM and MM regions.39,40 In all the optimizations, a quantum region consisting of the Mn center together with the residues at a distance shorter than 6 Å from it (including only the side chains up to the Cβ atom) was treated at the density functional theory level, whereas the remaining part of the system, including water molecules and counterions, was modeled at the classical level using the AMBER force field to take explicitly into account the steric and electrostatic effects of the surroundings. The valence of the terminal QM atoms was saturated by the addition of capping hydrogen atoms. A dual basis set, Gaussian and plane-wave formalism, was employed to compute the interaction energy within the QM subsystem. A molecularly optimized double-ζ valence basis set augmented with polarization functions (m-DZVP) was used41 to describe the wave function, while an auxiliary plane-wave basis set expanded up to a density cutoff of 360 Ry was utilized to converge the electron density in conjunction with Goedecker–Teter–Hutter pseudopotentials42,43 to describe the core electrons. Exchange and correlation energies were computed within the generalized gradient approximation by using the BLYP functional.44,45
Zero-Field Splitting Calculations
The calculation of the SOC and SS parts of the zfs parameters was performed with the ORCA electronic structure package.46 We performed these calculations on cluster models, in which only the OH/H2O molecules in the active site cavity and the side chains of all the residues in the first coordination sphere around the metal were included. DFT-based zfs parameters were computed for these models using the hybrid B3LYP25 functional in conjunction with triple-ζ (def2-TZVP) valence basis sets,47 taking advantage of the RIJCOSX approximation48 to speed up the calculations. In all cases, tight SCF convergence criteria were employed. The coupled-perturbed SOC approach was used to evaluate the DSOC contribution, whereas the DSS contribution was obtained on the basis of the spin-unrestricted natural orbital determinant.49 Scalar relativistic effects were taken into account by means of the van Wüllen’s model potential approximation to the ZORA equations.50
Acknowledgments
We thank Dr. Stephen Bornemann (John Innes Center, Norwich, UK) for generously providing a plasmid containing the gene encoding C-terminally His6-tagged Bacillus subtilis OxDC, and for permission to use Figure 3. We acknowledge the invaluable help of Dr. Elizabeth Brunk in the preparation of the TOC graphic. These studies were funded by the National Science Foundation (CHE1213440 to A.A.), the Swiss National Science Foundation (U.R.), and the National Institutes of Health (DK061666 to N.G.J.R.). Beamline X25 is funded by NIH’s National Center for Research Resources and DOE’s Office of Biological and Environmental Research. The high–field EPR spectra were recorded at the NHMFL, which is funded by the NSF through the Cooperative Agreement No. DMR-1157490, the State of Florida and the DOE.
Supporting Information Available
Tables S1 and S2, Figures S1–S10, EPR simulation parameters, experimental details for the preparation and purification of the W132F OxDC variant, and Cartesian coordinates for all cluster models. This material is available free of charge via the Internet at http://pubs.acs.org.
The authors declare no competing financial interest.
Funding Statement
National Institutes of Health, United States
Supplementary Material
References
- a Svedruzic D.; Jonsson S.; Toyota C. G.; Reinhardt L. A.; Ricagno S.; Lindqvist Y.; Richards N. G. J. Arch. Biochem. Biophys. 2005, 413, 176–192. [DOI] [PubMed] [Google Scholar]; b Tanner A.; Bornemann S. J. Bacteriol. 2000, 182, 5271–5273. [DOI] [PMC free article] [PubMed] [Google Scholar]; c Mehta A.; Datta A. J. Biol. Chem. 1991, 266, 23548–23553. [PubMed] [Google Scholar]; d Lillehoj E. B.; Smith F. G. Arch. Biochem. Biophys. 1965, 109, 216–220. [Google Scholar]; e Emiliani E.; Bekes P. Arch. Biochem. Biophys. 1964, 105, 488–493. [DOI] [PubMed] [Google Scholar]; f Shimazono H.; Haiyashi O. J. Biol. Chem. 1957, 227, 151–159. [PubMed] [Google Scholar]
- a Martin G.; Guggiari M.; Bravo D.; Zopfi J.; Cailleau G.; Aragno M.; Job D.; Verrecchia E.; Junier P. Environ. Microbiol. 2012, 14, 2960–2970. [DOI] [PubMed] [Google Scholar]; b Dunwell J. M.; Khuri S.; Gane P. J. Microbiol. Mol. Biol. Rev. 2000, 64, 153–179. [DOI] [PMC free article] [PubMed] [Google Scholar]
- a Costa T.; Steil L.; Martins L. O.; Volker U.; Henriques A. O. J. Bacteriol. 2004, 186, 1462–1474. [DOI] [PMC free article] [PubMed] [Google Scholar]; b Walz A.; Zingen-Sell I.; Theisen S.; Kortekamp A. Eur. J. Plant Pathol. 2008, 120, 317–330. [Google Scholar]
- a Makela M. R.; Hilden K.; Lundell T. K. Appl. Microbiol. Biotechnol. 2010, 87, 801–814. [DOI] [PubMed] [Google Scholar]; b Cassland P.; Sjode A.; Windestrand S. Appl. Biochem. Biotechnol. 2010, 161, 2655–263. [DOI] [PubMed] [Google Scholar]
- Wolfenden R.; Lewis C. A. Jr.; Yuan Y. J. Am. Chem. Soc. 2011, 133, 5683–5685. [DOI] [PMC free article] [PubMed] [Google Scholar]
- a Reinhardt L. A.; Svedruzic D.; Chang C. H.; Cleland W. W.; Richards N. G. J. J. Am. Chem. Soc. 2003, 125, 1244–1252. [DOI] [PubMed] [Google Scholar]; b Svedruzic D.; Liu Y.; Reinhardt L. A.; Wroclawska E.; Cleland W. W.; Richards N. G. J. Arch. Biochem. Biophys. 2007, 464, 36–47. [DOI] [PMC free article] [PubMed] [Google Scholar]
- Imaram W.; Saylor B. T.; Centonze C.; Richards N. G. J.; Angerhofer A. Free Radical Biol. Med. 2011, 50, 1009–1015. [DOI] [PMC free article] [PubMed] [Google Scholar]
- a Moomaw E. W.; Angerhofer A.; Moussatche P.; Ozarowski A.; Garcia-Rubio I.; Richards N. G. J. Biochemistry 2009, 48, 6116–6125. [DOI] [PMC free article] [PubMed] [Google Scholar]; b Tanner A.; Bowater L.; Fairhurst S. A.; Bornemann S. J. Biol. Chem. 2001, 276, 14627–14634. [DOI] [PubMed] [Google Scholar]
- a Cox N.; Ogata H.; Stolle P.; Reijerse E.; Auling G.; Lubitz W. J. Am. Chem. Soc. 2010, 132, 11197–11213. [DOI] [PubMed] [Google Scholar]; b Boussac A.; Sugiura M.; Rutherford A. W.; Dorlet P. J. Am. Chem. Soc. 2009, 131, 5050–5051. [DOI] [PubMed] [Google Scholar]; c Krebs C.; Matthews M. L.; Jiang W.; Bollinger J. M. Biochemistry 2007, 46, 10413–10418. [DOI] [PubMed] [Google Scholar]
- a Just V. J.; Stevenson C. E.; Bowater L.; Tanner A.; Lawson D. M.; Bornemann S. J. Biol. Chem. 2004, 279, 19867–19874. [DOI] [PubMed] [Google Scholar]; b Anand R.; Dorrestein P. C.; Kinsland C.; Begley T. P.; Ealick S. E. Biochemistry 2002, 41, 7659–7669. [DOI] [PubMed] [Google Scholar]; c Just V. J.; Burrell M. R.; Bowater L.; McRobbie I.; Stevenson C. E. M.; Lawson D. M.; Bornemann S. Biochem. J. 2007, 407, 397–408. [DOI] [PMC free article] [PubMed] [Google Scholar]
- Humphrey W.; Dalke A.; Schulten K. J. Mol. Graph. 1996, 14, 33–38. [DOI] [PubMed] [Google Scholar]
- a Angerhofer A.; Moomaw E. W.; Garcia-Rubio I.; Ozarowski A.; Krzystek J.; Weber R. T.; Richards N. G. J. J. Phys. Chem. B 2007, 111, 5043–5046. [DOI] [PubMed] [Google Scholar]; b Tabares L. C.; Gätjens J.; Hureau C.; Burrell M. R.; Bowater L.; Pecoraro V. L.; Bornemann S.; Un S. J. Phys. Chem. B 2009, 113, 9016–9025. [DOI] [PMC free article] [PubMed] [Google Scholar]
- a Duboc C.; Phoeung T.; Zein S.; Pecaut J.; Collomb M. N.; Neese F. Inorg. Chem. 2007, 46, 4905–4916. [DOI] [PubMed] [Google Scholar]; b Duboc C.; Collomb M. N.; Neese F. Appl. Magn. Reson. 2010, 37, 229–245. [Google Scholar]; c Rich J.; Castillo C. E.; Romero I.; Rodriguez M.; Duboc C.; Collomb M. N. Eur. J. Inorg. Chem. 2007, 3658–3665. [Google Scholar]
- Carmieli R.; Larsen T. M.; Reed G. H.; Zein S.; Neese F.; Goldfarb D. J. Am. Chem. Soc. 2007, 129, 4240–4252. [DOI] [PMC free article] [PubMed] [Google Scholar]
- Zein S.; Neese F. J. Phys. Chem. A 2008, 112, 7976–7983. [DOI] [PubMed] [Google Scholar]
- Weil J. A.; Bolton J. R.; Wertz J. E.. Electron Paramagnetic Resonance–Elementary Theory and Practical Applications; John Wiley & Sons: New York, 1994. [Google Scholar]
- Un S.; Tabares L. C.; Cortez N.; Hiraoka B. Y.; Yamakura F. J. Am. Chem. Soc. 2004, 126, 2720–2726. [DOI] [PubMed] [Google Scholar]
- Castagnetto J. M.; Hennessy S. W.; Roberts V. A.; Getzoff E. D.; Tainer J. A.; Pique M. E. Nucleic Acids Res. 2002, 30, 379–82. [DOI] [PMC free article] [PubMed] [Google Scholar]
- Saylor B. T.; Reinhardt L. A.; Lu Z.; Shukla M. S.; Nguyen L.; Cleland W. W.; Angerhofer A.; Allen K. N.; Richards N. G. J. Biochemistry 2012, 51, 2911–2920. [DOI] [PMC free article] [PubMed] [Google Scholar]
- Burrell M. R.; Just V. J.; Bowater L.; Fairhurst S. A.; Requena L.; Lawson D. M.; Bornemann S. Biochemistry 2007, 46, 12327–12336. [DOI] [PubMed] [Google Scholar]
- a Duboc C.; Ganyushin D.; Sivalingam K.; Collomb M. N.; Neese F. J. Phys. Chem. A 2010, 114, 10750–10758. [DOI] [PubMed] [Google Scholar]; b Neese F. J. Am. Chem. Soc. 2006, 128, 10213–10222. [DOI] [PubMed] [Google Scholar]; c Sinnecker S.; Neese F. J. Phys. Chem. A 2006, 110, 12267–12275. [DOI] [PubMed] [Google Scholar]
- Becke A. D. J. Chem. Phys. 1993, 98, 1372–1377. [Google Scholar]
- Bradford M. M. Analyt. Biochem. 1976, 72, 248–254. [DOI] [PubMed] [Google Scholar]
- Ho S. N.; Hunt H. D.; Horton R. M.; Pullen J. K.; Pease L R. Gene 1989, 77, 51–59. [DOI] [PubMed] [Google Scholar]
- Cleland W. W. Methods Enzymol. 1979, 62, 151–160. [Google Scholar]
- Vagin A.; Teplakov A. Acta Crystallogr., Sect. D 2010, 66, 22–25. [DOI] [PubMed] [Google Scholar]
- Adams P. D.; Afonine P. V.; Bunkoczj G.; Chen V. B.; Davis I. W.; Echols N.; Headd J. J.; Hung L. W.; Kapral G. J.; Grosse-Kunstleve R. W.; McCoy A. J.; Moriarty N. W.; Oeffner R.; Read R. J.; Richardson D. C.; Richardson J. S.; Terwilliger T. C.; Zwart P. H. Acta Crystallogr., Sect. D 2010, 66, 213–221. [DOI] [PMC free article] [PubMed] [Google Scholar]
- Emsley P.; Cowtan K. Acta Crystallogr., Sect. D 2004, 60, 2126–2132. [DOI] [PubMed] [Google Scholar]
- Hassan A. K.; Pardi L. A.; Krzystek J.; Sienkiewicz A.; Goy P.; Rohrer M.; Brunel L.-C. J. Magn. Reson. 2000, 142, 300–312. [DOI] [PubMed] [Google Scholar]
- Stoll S.; Schweiger A. J. Magn. Reson. 2006, 178, 42–55. [DOI] [PubMed] [Google Scholar]
- Duan Y.; Wu C.; Chowdhury S.; Lee M. C.; Xiong G.; Zhang W.; Yang R.; Cieplak P.; Luo R.; Lee T. J. Comput. Chem. 2003, 24, 1999–2012. [DOI] [PubMed] [Google Scholar]
- Jorgensen W. L.; Chandrasekhar J.; Madura J. D.; Impey R. W.; Klein M. L. J. Comput. Phys. 1983, 79, 926–935. [Google Scholar]
- Essmann U.; Perera L.; Berkowitz M. L.; Darden T.; Lee H.; Pedersen L. G. J. Chem. Phys. 1995, 103, 8577–8593. [Google Scholar]
- Ryckaert J. P.; Ciccotti G.; Berendsen H. J. C. J. Comput. Phys. 1977, 23, 327–341. [Google Scholar]
- Feller S. E.; Zhang Y.; Pastor R. W.; Brooks B. R. J. Chem. Phys. 1995, 103, 4613–4621. [Google Scholar]
- Martyna G.; Tobias D.; Klein M. J. Chem. Phys. 1994, 101, 4177–4189. [Google Scholar]
- Kalé L.; Skeel R.; Bhandarkar M.; Brunner R.; Gursoy A.; Krawetz N.; Phillips J.; Shinozaki A.; Varadarajan K.; Schulten K. J. Comput. Phys. 1999, 151, 283–312. [Google Scholar]
- VandeVondele J.; Krack M.; Mohamed F.; Parrinello M.; Chassaing T.; Hutter J. Comput. Phys. Commun. 2005, 167, 103–128. [Google Scholar]
- Laino T.; Mohamed A.; Laio A.; Parrinello M. J. Chem. Theory Comput. 2005, 1, 1176–1184. [DOI] [PubMed] [Google Scholar]
- Laio A.; VandeVondele J.; Rothlisberger U. J. Chem. Phys. 2002, 116, 6941–6948. [Google Scholar]
- VandeVondele J.; Hutter J. J. Chem. Phys. 2007, 127, 114105–114113. [DOI] [PubMed] [Google Scholar]
- Goedecker S.; Teter M.; Hutter J. Phys. Rev. B 1996, 54, 1703–1710. [DOI] [PubMed] [Google Scholar]
- Hartwigsen C.; Goedecker S.; Hutter J. Phys. Rev. B 1998, 58, 3641–3662. [Google Scholar]
- Becke A. D. Phys. Rev. A 1988, 38, 3098–3100. [DOI] [PubMed] [Google Scholar]
- Lee C.; Yang W.; Parr R. G. Phys. Rev. B 1988, 37, 785–789. [DOI] [PubMed] [Google Scholar]
- Neese F.ORCA: An Ab Initio, Density Functional and Semiempirical Program Package, version 2.8 (Rev: 2360); University of Bonn: Bonn, Germany, 2011. [Google Scholar]
- Weigend F.; Ahlrichs R. Phys. Chem. Chem. Phys. 2005, 7, 3297–3305. [DOI] [PubMed] [Google Scholar]
- Neese F.; Wennmohs F.; Hansen A.; Becker U. J. Chem. Phys. 2009, 356, 98–109. [Google Scholar]
- Neese F. J. Chem. Phys. 2007, 127, 164112. [DOI] [PubMed] [Google Scholar]
- a van Wüllen C. J. Chem. Phys. 1998, 109, 392–399. [Google Scholar]; b van Lenthe E.; Snijders J. G.; Baerends E. J. J. Chem. Phys. 1996, 105, 6505–6516. [Google Scholar]; c van Lenthe E.; Baerends E. J.; Snijders J. G. J. Chem. Phys. 1993, 99, 4597–4610. [Google Scholar]
Associated Data
This section collects any data citations, data availability statements, or supplementary materials included in this article.


