Abstract
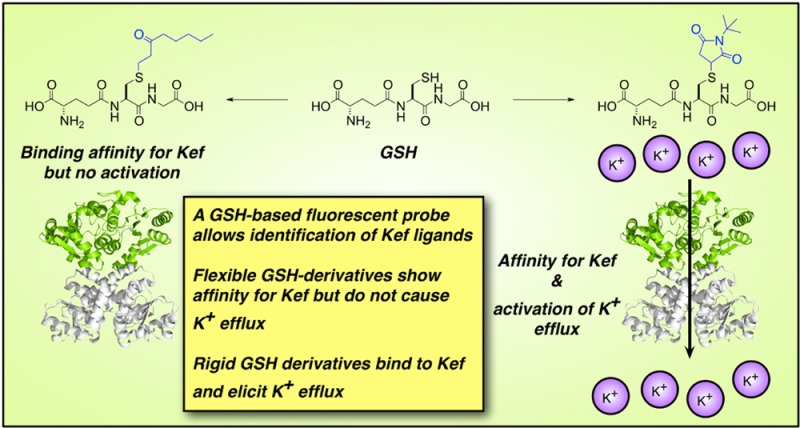
The potassium efflux system, Kef, protects bacteria against the detrimental effects of electrophilic compounds via acidification of the cytoplasm. Kef is inhibited by glutathione (GSH) but activated by glutathione-S-conjugates (GS-X) formed in the presence of electrophiles. GSH and GS-X bind to overlapping sites on Kef, which are located in a cytosolic regulatory domain. The central paradox of this activation mechanism is that GSH is abundant in cells (at concentrations of ∼10–20 mM), and thus, activating ligands must possess a high differential over GSH in their affinity for Kef. To investigate the structural requirements for binding of a ligand to Kef, a novel fluorescent reporter ligand, S-{[5-(dimethylamino)naphthalen-1-yl]sulfonylaminopropyl} glutathione (DNGSH), was synthesized. By competition assays using DNGSH, complemented by direct binding assays and thermal shift measurements, we show that the well-characterized Kef activator, N-ethylsuccinimido-S-glutathione, has a 10–20-fold higher affinity for Kef than GSH. In contrast, another native ligand that is a poor activator, S-lactoylglutathione, exhibits a similar Kef affinity to GSH. Synthetic ligands were synthesized to contain either rigid or flexible structures and investigated as ligands for Kef. Compounds with rigid structures and high affinity activated Kef. In contrast, flexible ligands with similar binding affinities did not activate Kef. These data provide insight into the structural requirements for Kef gating, paving the way for the development of a screen for potential therapeutic lead compounds targeting the Kef system.
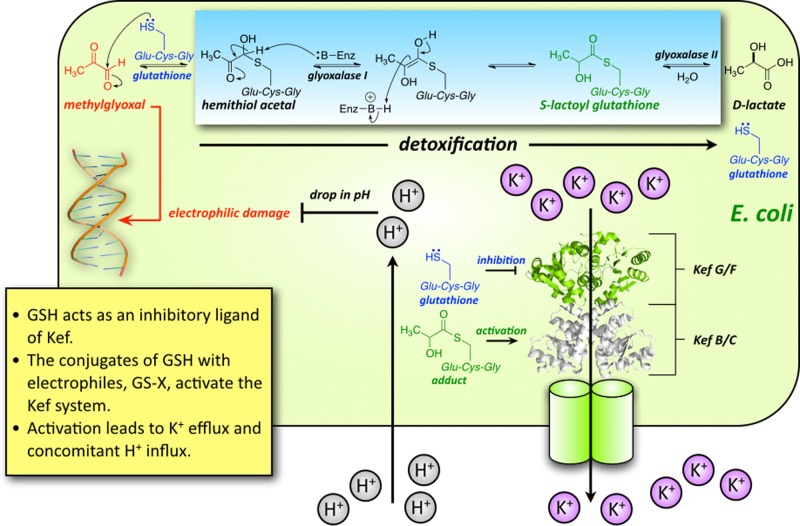
Potassium ion (K+) transport is a major determinant of bacterial growth and survival through its role in regulating cytoplasmic pH and cell turgor. The Kef system, which comprises both KefFC and KefGB (in Escherichia coli), is a ligand-gated K+ efflux system critical for the bacterial response to electrophilic insult.1,2 The thiol-containing tripeptide glutathione (GSH) acts as an inhibitory ligand of Kef, holding the channel closed. However, in the presence of electrophiles, GSH chemically reacts with these species forming GS-X, which activates the Kef system resulting in K+ efflux and concomitant H+ influx. Consequently, activation of Kef results in a decrease in cellular pH, protonating nucleophiles in DNA and proteins and minimizing their reactivity with electrophilic species.1,2 The GS-X conjugates subsequently undergo metabolism to less toxic species in enzyme-mediated detoxification reactions that also regenerate cytoplasmic GSH.3,4 Hence, Kef is part of a synergistic bacterial protection system, in which the electrophiles are detoxified and, in parallel, their effect is neutralized by modulation of the cellular pH (Figure 1). Previous work has established that the rate and extent of activation of Kef are critical determinants in the survival of bacteria after their exposure to toxic electrophiles.5,6 Therefore, perturbation of Kef activity is potentially a novel target for antibiotic drugs, but such compounds can be developed only with a thorough understanding of Kef activation at the molecular level.
Figure 1.
Cartoon of the synergistic actions of the Kef system in E. coli. The Kef system, which comprises both KefFC and KefGB (in E. coli), is a ligand-gated K+ efflux system critical for the bacterial response to electrophilic insult. Glutathione (GSH) acts as an inhibitory ligand of Kef, holding the channel closed. However, in the presence of electrophiles, GSH scavenges these species forming GS-X, which activates the Kef system resulting in K+ efflux and concomitant H+ influx. Consequently, activation of Kef results in a decrease in cellular pH, protonating nucleophiles and minimizing their reactivity with electrophilic species. The GS-X conjugates subsequently undergo metabolism to less toxic species in enzyme-mediated detoxification reactions that also regenerate cytoplasmic GSH. Hence, Kef is part of a synergistic bacterial protection system, in which the electrophiles are detoxified and, in parallel, their effect is neutralized by modulation of the cellular pH.
A combination of crystallographic studies and classical bacterial genetics has provided a mechanistic model by which GSH and GS-X bind to Kef and modulate its activity. Kef proteins are homodimeric and possess a carboxy-terminal K+ transport and nucleotide binding (KTN) domain, which contains a Rossmann fold that binds a nucleotide molecule.7,8 The GSH/GS-X binding site resides at the interface of the two KTN domains. A number of key residues bind the peptide component of both GSH and GS-X and anchor the molecule to the Kef protein (Figure 2). Three critical residues were identified by classical bacterial genetics, R416, R516, and N551 (E. coli KefC numbering).8,9 Mutations at these positions caused a phenotype equivalent to that seen after the loss of GSH from the cell and were thus implicated in defining the GSH binding site.8,9 Crystallography in which apo and ligand (GS-X)-bound structures were described identified these three residues as defining three critical points of contact with the peptide backbone of GS-X.7,8 A structural transition that was proposed to be associated with gating identified a critical role for F441 (in E. coli), which caps the pocket in which GSH is bound. This pocket is proposed to be unable to accommodate the steric bulk of electrophiles that are conjugated to GSH such that F441 is displaced, and this is believed to be the trigger for activation of K+ efflux.7 Although the crystal structures provide only a static snapshot of the protein,7 genetic data supported this model for the role of F441 in both E. coli and Shewanella Kef KTN domains.7
Figure 2.
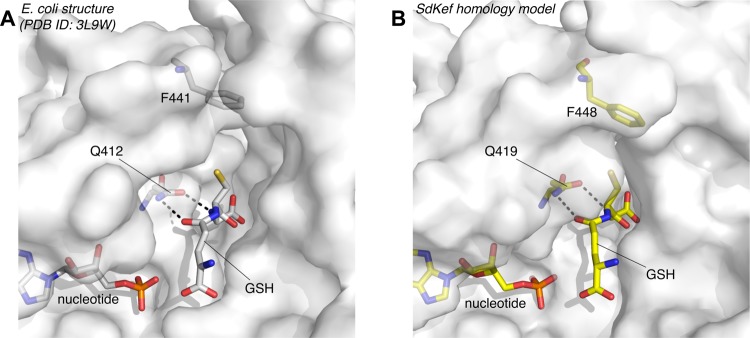
Comparison of the GSH and nucleotide binding sites from EcKefC (A) and SdKef (B). (A) Mutagenesis studies have identified Q412 from EcKefFC as a key residue for GSH binding, and mutation to a larger residue (Q412K) results in loss of GSH binding.7 This observation is supported by crystallographic data. (B) Q419 in SdKef is predicted to form interactions with GSH similar to those of Q412 in E. coli, and the Q419K mutation also causes a loss of GSH binding, indicating that it plays a similar role in Kef from both species. A homology model of SdKefC, generated on the basis of the GSH-bound EcKefC structure (Protein Data Bank entry 3L9W), supports these data. The figure was created using PyMOL.
Initial studies indicated that inappropriate gating of Kef might provide a mechanism for bacterial growth inhibition9,10 and thus provide an opportunity for the development of antibacterial drugs with a novel target. A challenge that must be met is the fact that Gram-negative bacteria possess very large pools of GSH that could impede the binding of any potential drug. In vivo studies led to the observation that the formation of relatively low concentrations of ESG in the cytoplasm provided strong activation of KefFC despite the presence of excess GSH.4 However, to date, no direct quantitative analysis of the binding of GS-X ligands to isolated Kef KTN domains has been undertaken. Determination of the structural parameters influencing the binding of GS(X) adducts to Kef is an important step in understanding the gating mechanism and for the development of assay systems for identifying novel synthetic modulators of Kef activity. To address these aims, we have developed a novel biophysical assay, which relies on steady state fluorescence spectroscopy, facilitated by a fluorescently labeled GSH-based probe containing the dansyl chromophore, that allows both qualitative and quantitative detection of binding to Kef. The probe exhibits solvatochromic properties, in that both the wavelength and intensity of emission are dictated by the nature of the probe’s environment. This probe also exhibits attractive photophysical properties for use in biological assays; excitation is achieved by irradiation at 340 nm, and an emission λmax of 573 nm is observed in free solution. With the transition from a hydrophilic to a hydrophobic environment, a dramatic shift in the λmax is observed (530 nm). This system has been employed to evaluate the affinity for the Kef ligand binding domain displayed by a range of natural and synthetic GS-X analogues. The results correlate with data obtained using isothermal titration calorimetry (ITC) and differential scanning fluorimetry (DSF). Consequently, we have demonstrated that the fluorescence-based assay is a useful tool for the development of lead antibacterial compounds that target the Kef system.
Experimental Procedures
Strains and Plasmids
The strains and plasmids used in this study are described in Table S1 of the Supporting Information. Expression construct pTrcSdKefH6 of the Kef gene from Shewanella denitrificans OS217 (accession number NC007954.1) encodes 608 amino acids with an additional C-terminal LEH6 tag. The synthetic clone was codon optimized and cloned via an NcoI site at the 5′ end and a XhoI site on the 3′ end into a pTrc99A backbone by DNA 2.0 Ltd. Site-directed mutants were produced using the Stratagene QuickChange protocol. A soluble construct of the regulatory domain was obtained by introduction of a second NcoI site into pTrcSdKefH6 by site-directed mutagenesis at the 3′ end of the membrane domain-encoding region followed by digestion with NcoI and ligation. The construct, designated SdKefQCTD, included the Q-linker starting at K391 and fused at the 5′ end a further sequence encoding 10 amino acids (GHELEVDIEP),9,10 corresponding to a putative regulatory loop from the membrane domain. All constructs were confirmed by sequencing on both strands.
Potassium Efflux Measurements
Potassium efflux experiments were performed as described previously.7 Potassium efflux was measured, using an ion selective potassium electrode (ELIT 8031, Nico2000) and a lithium acetate reference electrode (ELIT 003n) with a four-channel ion analyzer (ELIT4), in 2 s intervals. Freshly transformed cells [either E. coli MJF335 cells lacking KefB, KefC, and GshA or MJF645 cells (lacking KefF and KefG in addition to KefB, KefC, and GshA)] were cultured in K115 minimal medium, containing 1 mM GSH, at 37 °C to an OD650 of ∼0.8–1.11 The cells were filtered and washed with K10 buffer before being suspended in 5 mL of potassium-free K0 buffer. The cells were added to 30 mL of K0 medium in a stirred vessel held at 37 °C with equilibrated electrodes inserted. After 5 min, the electrophile was added to a final concentration of 0.5 mM [except for methylglyoxal (MG), which was added at a concentration of 0.8 mM6]. Rate constants were obtained by fitting exponentials to the change in potassium concentration after addition of the electrophile using Origin version 8.0 (Originlab).7
Protein Expression and Purification
pTrcSdKefQCTD was transformed for expression into E. coli strain MJF373, which lacks the gene for the catabolite activator protein (CAP). CAP is a common contaminant in immobilized metal ion affinity chromatography12 that could not be removed by size exclusion when the Kef constructs were expressed in other strains. The culture was grown at 37 °C in LB (500 mL, containing 0.1% glucose) until an OD650 of 0.8 was reached. After the sample had cooled to 30 °C, expression was induced with IPTG (0.8 mM) for 4 h. Cells were harvested by centrifugation and resuspended in 20 mL of phosphate-buffered saline at pH 7.4 (8 g/L NaCl, 0.2 g/L KCl, 1.15 g/L Na2HPO4·7H2O, and 0.2 g/L KH2PO4) containing an EDTA-free protease cocktail (Sigma) and stored at −80 °C until use. Cells were lysed with a French press (SLM Aminco) at a pressure of 18000 lb/in.,2 and cell debris was removed by centrifugation. The supernatant was incubated with 10 μg/mL DNase (Sigma) at 4 °C for 30 min, filtered (0.45 μm syringe filters), and loaded onto a prewashed 1 mL column of Ni2+-nitrilotriacetic acid agarose (Sigma). The column was washed with 40 mL of buffer A containing 50 mM phosphate buffer (pH 7.5), 150 mM NaCl, 10% glycerol, and 20 mM imidazole. Bound protein was eluted with buffer B (equivalent to buffer A but containing 300 mM imidazole). The peak fractions as determined by UV–vis spectroscopy were subjected to buffer exchange using a PD-10 column (GE Healthcare) and buffer C containing 50 mM phosphate buffer (pH 7.5) and 150 mM NaCl. The concentration of the resulting protein was calculated using UV–vis spectroscopy and analyzed for purity using Novex NuPAGE 4 to 12% Bis-Tris SDS–PAGE gels (Invitrogen) with NuPAGE LDS sample buffer (Invitrogen). Kef was further purified by size exclusion chromatography using a 10/300 Superdex200 column (GE Healthcare) in buffer C for fluorescence and ITC experiments.
Fluorescence Measurements
Measurements were performed in buffer C, using a 100 μL cuvette with 3 mm excitation and emission path lengths (Hellma GmbH & Co.) at 20 °C and an Edinburgh Instruments FLS920 spectrometer. Samples containing SdKefQCTD and DNGSH were excited at 340 nm, and emission spectra were measured from 395 to 670 nm. The steady state fluorescence anisotropy was measured with excitation at 340 nm and emission between 540 and 560 nm. Competition experiments were performed using samples pretreated with excess DNGSH, at a 2× protein concentration, and titrated with the ligand under study.
For qualitative competition measurements, a Perkin-Elmer luminescence spectrometer was used with excitation at 340 nm and emission spectra were recorded from 400 to 600 nm. Samples containing 6 μM SdKefQCTD and 5 μM DNGSH were prepared. A decrease in fluorescence intensity after the addition of the desired competing ligand, at a final concentration of 1 mM, was interpreted as an indication of binding. The data are represented as ratios of the fluorescence intensities before and after the addition of the tested compound at 525 nm.
Analysis of Ligand Binding by Fluorescence Spectroscopy
The data were fit using a standard saturation isotherm (see the Supporting Information for further information). For DNGSH fluorescence, λL was measured directly and found to be 572.5 nm. Inverse titrations with high SdKefQCTD concentrations allowed a good estimation of the emission maximum for the bound form (λML) as 530 nm with a quantum yield (Q) of 4. These three parameters were kept fixed during the fitting while Kd and n were optimized. A mutated protein bearing a Q419K mutation that abrogates activation of Kef by GSH adducts7 was used to measure background binding. The level of nonspecific binding was observed to be very low, and thus, no routine corrections were performed. For competition experiments, depletion of DNGSH (L) as well as of the competing nonfluorescent ligand B was taken into consideration during the analysis (see the Supporting Information). Data were analyzed according to Thrall et al.,13 using a Kd of 6 μM for DNGSH (derived in this study). The dissociation constant for the competing ligand B, KB, and n were optimized using Matlab2012a (Mathworks) taking dilution of ligands and protein during the titration into account. Equations are shown in the Supporting Information.
Differential Scanning Fluorimetry (DSF)
Stock solutions (100 and 10 mM) of the ligands under examination were prepared in H2O. A protein master mix was prepared containing SdKefQCTD (40 μM) and Sypro Orange (1:1000 dilution, Invitrogen) in buffer C. Ninety-six-well plates (Axygen) were prepared using the protein master mix (22.5 μL, 12 μM protein) and ligand (2.5 μL, 1 mM ligand) (total volume of 25 μL). Assays were performed using a Stratagene Mx3005P qPCR machine with the integrated FAM/SYBR Green I filter (excitation at 492 nm, emission at 516 nm). The initial temperature was set to 25 °C, increasing in increments of 1 °C. The Tm was identified by fitting to the Boltzmann equation (Prism 5). The change in unfolding temperature (ΔTm) was calculated as the change in Tm relative to the Tm of the protein and dye in the absence of ligand. A Student’s t test was performed to determine whether the changes were statistically significant.
Isothermal Titration Calorimetry (ITC)
SdKefQCTD samples were dialyzed overnight (molecular mass cutoff of 14 kDa) against buffer C. Ligand stock solutions were prepared using the same buffer. All solutions were degassed with a ThermoVac instrument (MicroCal) before use, and measurements were taken at 25 °C with a MicroCal iTC200 instrument (GE Healthcare). The ligand solution was placed in the syringe and the protein in the sample cell. The ligand was titrated into the protein solution (20 injections, 1 × 0.4 and 19 × 2.0 μL). The interval between injections was typically 180 s. In some cases, the syringe was refilled and the experiment was continued until saturation was reached to allow assessment of the baseline offset. Control experiments were performed by titrating the ligand solution into buffer. Data were analyzed using Origin 7.0 (OriginLab Corp.) with a one-site model. All binding experiments were repeated at least three times (see Table 1).
Table 1. Affinity of Ligands for SdKefQCTDa.
| electrophile | GSH-S-conjugate | Kd (μM) | no. of sites (n) | method | no. of repeats |
|---|---|---|---|---|---|
| – | DNGSH | 6 ± 2 | 0.6 ± 0.2 | emission peak | 8 |
| 8 ± 2 | 1.1 ± 0.8 | anisotropy | 3 | ||
| 19 ± 6 | 0.7 ± 0.2 | ITC | 4 | ||
| – | GSH | 900 ± 200 | 0.83 ± 0.04 | emission peak | 4 |
| N-ethylmaleimide (NEM, 14) | ESG | 12 ± 3 | 0.7 ± 0.2 | emission peak | 3 |
| 23 ± 4 | 0.38 ± 0.05 | ITC | 3 | ||
| methylglyoxal (MG) | SLG | 900 ± 200 | 0.71 ± 0.04 | emission peak | 4 |
| N-tert-butylmaleimide (15) | 5 | 0.4 ± 0.2 | 0.7 ± 0.2 | emission peak | 3 |
| 6.7 ± 0.27 | 0.41 ± 0.04 | ITC | 3 | ||
| 1-octen-3-one (22) | 12 | 4.4 ± 0.5 | 0.81 ± 0.05 | emission peak | 3 |
Values of the dissociation constant, Kd, and the determined number of sites per subunit, n, are shown for binding experiments with GSH and GSX on a soluble fragment of Kef from S. denitrificans measured by fluorescence emission spectra, fluorescence anisotropy, or ITC. In addition, the names of the corresponding electrophiles are listed.
Chemical Synthesis
All reagents were purchased from Sigma-Aldrich or Alfa Aesar and were used without further purification. The UV light was provided by a Philips HB175 Facial Solarium (UVA, 365 nm, P = 4 × 15 W). Reverse phase column chromatography was conducted on a Fluka Ltd. silica gel 100 C18 reversed phase column. Analytical TLC analysis was performed using Merck 60 RP-18 F254S aluminum-supported thin layer chromatography sheets and visualized using an ethanolic solution of ninhydrin. 1H and 13C nuclear magnetic resonance (NMR) spectra were recorded on a Bruker Avance 400 (400 and 100 MHz) or Bruker Avance III (500 and 125 MHz) spectrometer. Optical rotations were recorded at 20 °C at the sodium D line (589 nm).
DNGSH was synthesized from GSH and N-allyl-5-(dimethylamino)naphthalene-1-sulfonamide via the photochemical thiol-ene. Glutathione-S-conjugates were synthesized from GSH and a range of electrophiles in H2O or a H2O/methanol mixture and sodium hydroxide, via 1,4-addition. Further details of synthesis and compound characterization are provided in the Supporting Information.
Results and Discussion
To gain insight into the binding of GS-X to the Kef carboxy-terminal domain, we required a protein that was more biochemically tractable than the KefFC system that we had previously characterized from E. coli,7,8 which consists of two proteins with only weak affinity for each other. KefF is not required for the activation or inhibition of KefC by ESG or GSH, respectively, but poises the system to have higher activity.14 The instability of the KefFC dimer of dimers in extracts was previously found to interfere with biochemical analysis.8 Thus, we sought to identify homologues that do not require a KefF protein. After screening the NCBI organism database, we identified several species that possessed a KefC-like protein (Table S2 of the Supporting Information) but no KefF (S. Ekkerman, C. Pliotas, S. Kinghorn, S. Miller, and T. Rasmussen, unpublished observations). Heterologous expression of the Shewanella Kef homologue (hereafter termed SdKef) in an E. coli strain lacking both KefFC and KefGB resulted in a high rate constant for K+ efflux after addition of the electrophile N-ethylmaleimide (NEM) (Figure 3). Mutational analysis confirmed that key residues identified from genetic analysis of E. coli KefC (Figure 2) were also critical to the activity of SdKef (Figure S1 of the Supporting Information). To facilitate ligand binding studies on the SdKef protein, a soluble construct of the cytosolic regulatory domain was produced. To improve stability, the construct was extended to include the Q-linker and the regulatory loop from the membrane domain (residues H266–P274), which has been shown previously to improve stability.8 We have previously shown by static multiangle light scattering analysis that purified SdKefQCTD exists in solution as 52.0 ± 2.5 kDa particles corresponding to complexes of 2.0 ± 0.1 subunits (26.4 kDa per monomer) (S. Ekkerman, C. Pliotas, S. Kinghorn, S. Miller, and T. Rasmussen, unpublished observations), which is consistent with the crystal structure for KTN domains.15−17
Figure 3.
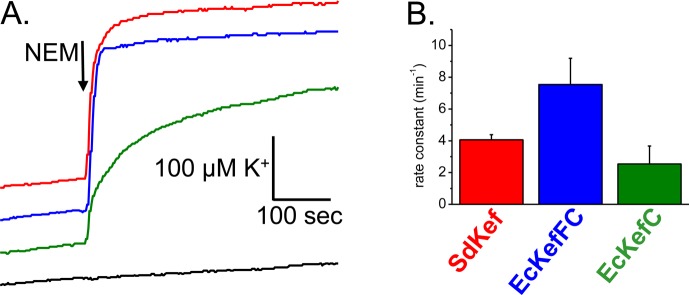
Potassium efflux via Kef systems. (A) K+ efflux profile for different Kef systems. (B) Rate constants derived from the exponential fitting of the raw data. Efflux of potassium from E. coli strain MJF645, which lacks both the chromosomal Kef systems and glutathione biosynthesis, transformed with plasmids expressing different Kef systems. The efflux was triggered by NEM (arrow). Note that the electrode measures the amount of K+ released from the cells (i.e., an increasing level of K+ in the medium indicates Kef activity). Efflux mediated by SdKef (red), EcKefFC (blue), or EcKefC (green). The black line is the K+ release profile observed with MJF645 cells alone treated with NEM (arrow). All cells were grown in the presence of 1 mM GSH.
Design and Synthesis of the Fluorescent Probe DNGSH (3)
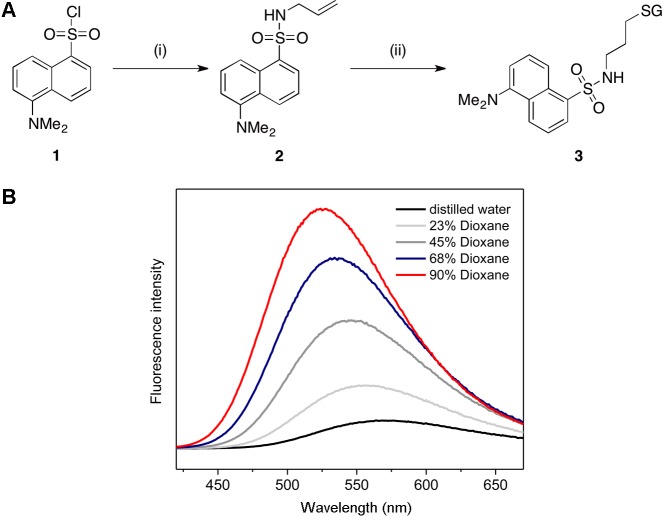
A robust biophysical method was required to measure the binding of ligands to Kef. The development of a solvatochromic fluorescent probe allowed the use of fluorescence for both qualitative and quantitative detection of binding of ligands to Kef. On the basis of our knowledge of activators and inhibitors of Kef, a fluorescent probe (3) with a GSH core and the dansyl chromophore was designed (Figure 4A). The dansyl chromophore was chosen, as it is known to be sensitive to the nature of its environment, and the biophysical properties of dansyl-labeled amino acids have been extensively studied.18,19 In addition, it is a relatively small fluorophore and is therefore less likely to completely disrupt ligand binding.
Figure 4.
Synthesis of DNGSH (3) and effect of the polarity of the solvent on the fluorescence of DNGSH. (A) Reagents and conditions: (i) allyl amine, DIPEA, CH2Cl2, 100%; (ii) GSH, DPAP, TCEP·HCl, THF/H2O, 40%. (B) Emission spectra of 45 μM DNGSH in different mixtures of distilled water with dioxane.
Because of the potential for S- to N-acyl transfer,20 synthesis of an S-dansylated derivative of GSH required the installation of a stable linker moiety. This aim was achieved via the reaction of dansyl chloride (1) first with allyl amine. The allylic double bond then provided a synthetic handle for reaction with GSH via the photochemical thiol-ene reaction. Optimization of the reaction conditions, most significantly through the addition of a reducing agent, afforded the desired probe DNGSH (3) in 40% yield (Figure 4A).
When the fluorescence spectrum of DNGSH (3) was measured in a range of solutions with varying dioxane:water ratios, the fluorescence intensity increased with the proportion of dioxane. In addition, as the amount of dioxane in the solution increased, the λmax underwent a hypsochromic shift of up to 45 nm. These observations indicate that changes in the fluorescence properties of DNGSH reflect changes in the hydrophobicity of the environment experienced by the probe (Figure 4B).
Binding of DNGSH to SdKefQCTD Detected by Fluorescence Spectroscopy
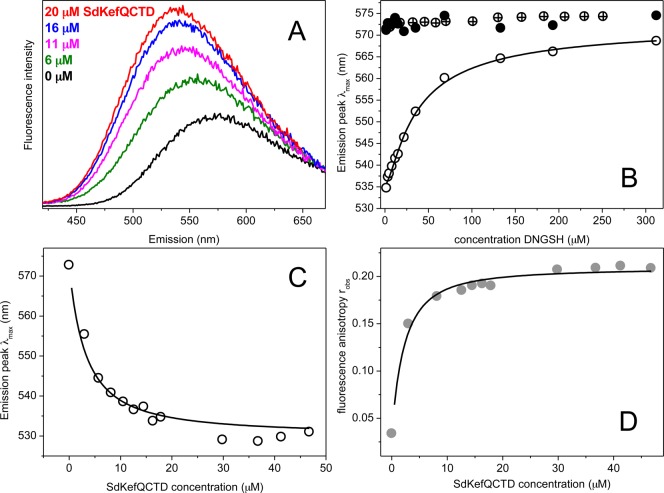
Titration experiments, in which DNGSH was incubated with increasing concentrations of SdKefQCTD, were performed to confirm the ability of DNGSH to act as a solvatochromic fluorescent probe for the Kef system. When DNGSH bound to the protein, the fluorescence quantum yield increased and a substantial shift in the λmax of the emission spectrum was observed (Figure 5A). The λmax of the unbound probe (λL) was found, under our experimental conditions, to be 572.5 ± 1.2 nm, and that of the bound probe (λML) could be approximated at high SdKefQCTD concentrations to be 530 nm. Under similar conditions, the relative increase in the quantum yield upon binding of DNGSH could also be estimated as Q = 4. This set of experiments indicated that DNGSH was indeed binding to Kef and that the probe was highly sensitive to the changes in the nature of its environment in both the observed λmax and the intensity of emission. Titration of DNGSH to SdKefQCTD (Figure 5B) or the inverse (Figure 5C) provided binding isotherms. In addition, the steady state fluorescence anisotropy was measured, which also changed upon binding because of the decreased mobility of the ligand bound to the protein (Figure 5D). Binding experiments with the SdKefQCTD Q419K mutant (Figure 5B), which has previously been shown to be insensitive to activation by GS-X,7 indicated that this mutant is unable to bind the GSH moiety of DNGSH. These data are consistent with the crystal structure of the KefF–KefC–CTD complex.7
Figure 5.
Changes in fluorescence when DNGSH binds to SdKefQCTD. (A) The emission spectrum of DNGSH is modified by the co-incubation with SdKefQCTD, consistent with a hydrophobic environment for the dansyl group. (B) The emission peak position was measured upon titration of DNGSH to 21 μM SdKefQCTD (○) or to buffer as a control (●). In addition, a titration of DNGSH to 7 μM of the SdKefQCTD Q419K mutant is shown (⊕). (C) Change of the emission peak position or (D) fluorescence anisotropy upon titration of SdKefQCTD to 5 μM DNGSH. Fitted curves are shown as lines.
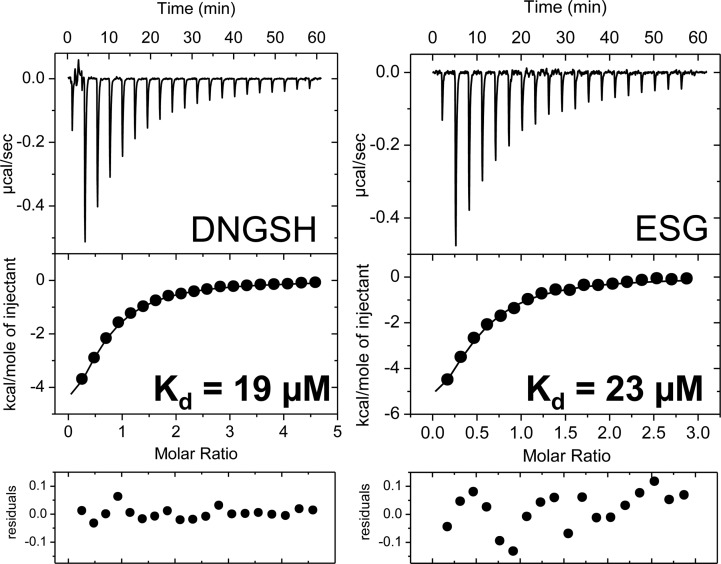
Data were fit to a single-site binding model, which accounted for the change in quantum yield and depletion of free ligand (see the Supporting Information for details). Good fits were obtained with this simple model, and no indications of cooperative binding were seen. This is also reflected in the Scatchard plot (Figure S2 of the Supporting Information) and a Hill coefficient (nH) of 1. The number of active binding sites, n, in relation to the total protein concentration, [M]0, was lower than estimated from the total protein concentration of SdKefQCTD, which was optimized in the fits along with the dissociation constant, Kd. For titration of DNGSH to SdKefQCTD a dissociation constant (Kd) of 6 ± 2 μM and a number of active binding sites (n) of 0.6 ± 0.2 were obtained on the basis of changes in λmax (see also Table 1). Anisotropy experiments confirmed these results with a Kd of 8 ± 2 μM and an n of 1.1 ± 0.8. Binding of DNGSH by ITC (using ∼55 μM protein; four repeats) resulted in a slightly higher dissociation constant of 19 ± 6 μM (Figure 6). No significant deviations from a single-site model were seen in ITC experiments (Figure 6). However, as observed in the fluorescence experiments, the number of active sites was fewer than one per monomer (n = 0.7 ± 0.1). The apparent reduction in stoichiometry may be due to partial unfolding of the protein.
Figure 6.
ITC ligand binding experiments with SdKefQCTD. Titrations with DNGSH (left) and ESG (right) are shown with SdKefQCTD concentrations of 55 and 60 μM, respectively. Residuals are shown for a single-site binding model. Representative curves from a single experiment are shown.
Competition Experiments Using DNGSH as a Probe for Ligand Binding
With confirmation that DNGSH binds to Kef, competition experiments were performed with the most extensively studied Kef inhibitor (GSH), the strong activator (ESG), and with the weak activator (SLG). The protein was preincubated with a slight excess of DNGSH and titrated with increasing concentrations of the competing ligand. On displacement of DNGSH from the binding site, a decrease in the fluorescence intensity and a shift of the λmax back toward the free probe in solution were observed (Figure 7A). Titration curves showed that ESG had a higher affinity for Kef than either GSH or SLG (Figure 7B). Analysis of the data resulted in the following values: Kd(ESG) = 12 ± 3 μM (n = 0.7 ± 0.2), Kd(GSH) = 900 ± 200 μM (n = 0.83 ± 0.04), and Kd(SLG) = 900 ± 200 μM (n = 0.71 ± 0.04). The Kd values for GSH and SLG could not be accurately determined as only a low degree of saturation could be reached in the experiments. ITC experiments (Figure 6) confirmed the fluorescence results for ESG. A slightly higher dissociation constant [Kd(ESG)] of 23 ± 4 μM (n = 0.38 ± 0.05) was found in comparison to the fluorescence results. Only small signals were seen in the ITC for titration with GSH and SLG, which could not be analyzed as expected for a very low affinity ligand (data not shown). Regulatory ligands GSH, SLG, and ESG have been investigated in detail physiologically.2,21,22 These new binding data can readily be integrated into the physiological analysis, namely that GSH is present at a concentration between 10 and 20 mM in the cytoplasm, and thus, a low affinity of Kef for this ligand can be accommodated mechanistically. However, to achieve rapid gating, one would predict a much higher affinity for GS-X than for GSH. MG is a poor activator and must accumulate to high millimolar levels to activate KefGB,6 and the low affinity, comparable to that for GSH, fits with the known facts regarding MG activation, namely that strong activation by MG requires both depletion of GSH and formation of a large pool of SLG.6
Figure 7.
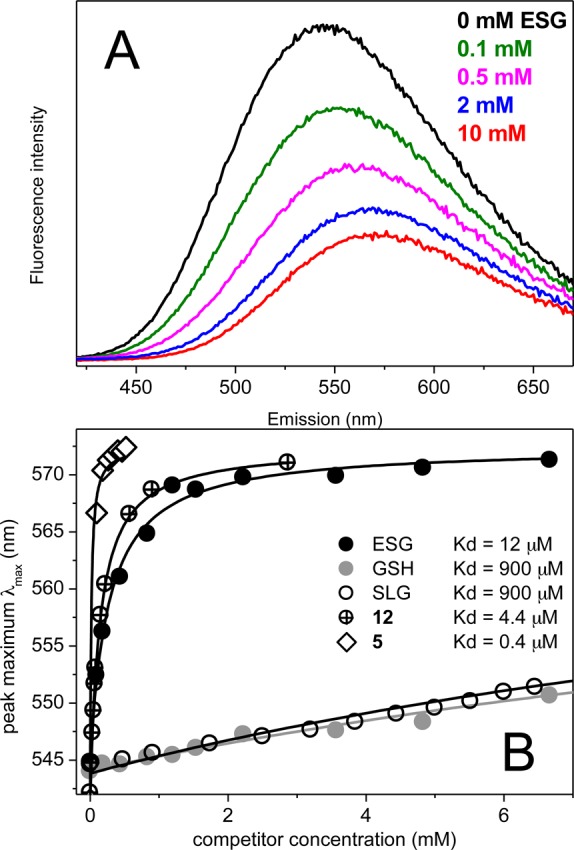
Competition experiments. (A) Changes of emission spectra with increasing concentrations of ESG at concentrations of 47 μM SdKefQCTD and 112 μM DNGSH. (B) Changes in the emission peak position with increasing concentrations of ESG (●), GSH (gray circles), SLG (○), compound 5 (◇), and compound 12 (⊕). Fittings are shown as lines.
Requirements for Binding and Gating
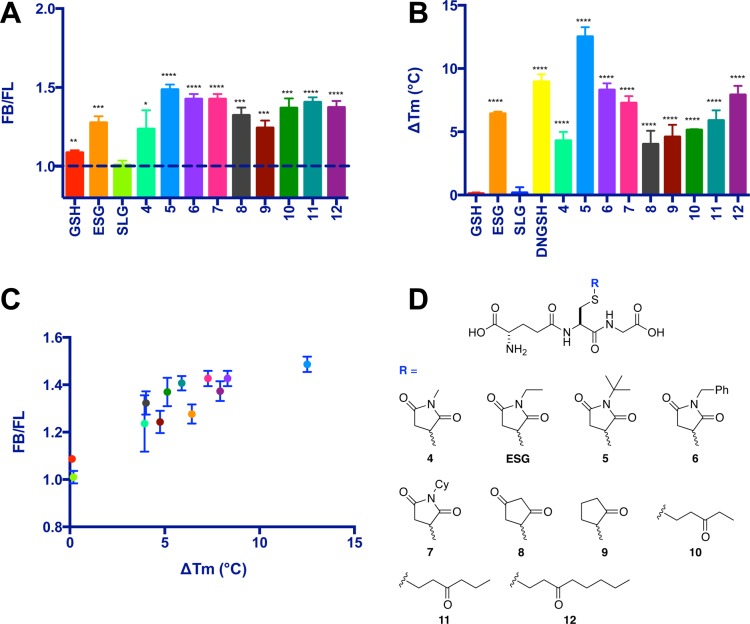
To explore the effect of ligand structure on Kef binding and gating, a series of ESG analogues were synthesized (Scheme 1; see the Supporting Information for further details). The binding of these ligands (4–12) was compared to that of GSH and ESG using a qualitative version of the fluorescence competition assay (Figure 8A) and was independently validated using differential scanning fluorimetry (DSF) (Figure 8B).
Scheme 1. Synthesis of ESG Analogues 4–12.
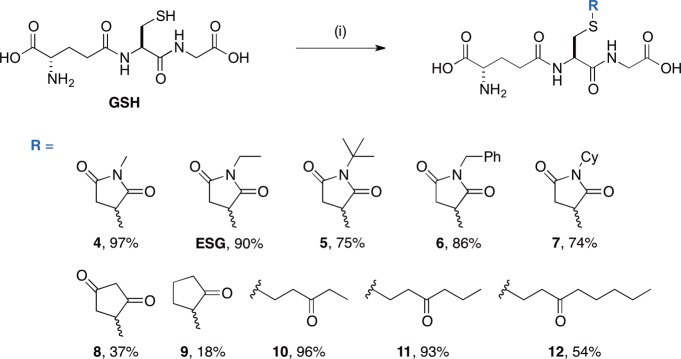
Reagents and conditions: (i) enone, NaOH, H2O/MeOH, room temperature, 18–97%.
Figure 8.
Investigation of ESG and analogue Kef binding. (A) DNGSHbound:DNGSHligand ratios of fluorescence (FB:FL), from a competition experiment performed with 1 mM competing ligand (n = 3). (B) Changes in melting temperature in the presence of 1 mM ligand relative to that of protein alone. (C) Investigation of the relationship of fluorescence and thermal shift data. A plot of FB/FL vs ΔTm indicates a correlation between the Kef ligand binding observed using each technique separately. (D) Structures of ESG and its analogues 4–12. Error bars represent the standard deviation (n = 3). Significance of changes evaluated by a Student’s t test (where ****p ≤ 0.0001, ***p ≤ 0.001, **p ≤ 0.01, *p ≤ 0.05).
The qualitative version of the fluorescence assay employed DNGSH in competition experiments, in which binding of a ligand results in displacement of DNGSH and a consequent decrease in fluorescence intensity. The binding of the ligand is represented as a DNGSHbound:DNGSHligand ratio [FB:FL (Figure 8A)], with a higher ratio indicating a greater affinity for Kef. In this assay, GSH and SLG have low FB:FL ratios, consistent with weak binding to Kef, as expected from the data described above. ESG and all of the ESG analogues show high FB:FL ratios, consistent with an affinity for Kef greater than those of GSH and SLG, with N-tert-butylsuccinimido-S-glutathione (5) showing the greatest Kef affinity (Figure 8A).
Similar trends in Kef binding were observed using DSF. The low affinity of GSH and SLG for Kef results in a negligible change in protein melting temperature between free and ligand-bound states [ΔTm (Figure 8B)]. Compound 5 was observed to show the greatest ΔTm, indicating tight binding to Kef. A plot of ΔTm versus FB:FL (Figure 8C) reveals a good correlation between the binding affinity for Kef predicted by the DNGSH-based fluorescence competition assay and ΔTm observed using DSF. Dissociation constants for compounds 5 and 12 were determined using the fluorescence competition assay. The GSH adduct of tert-butylmaleimide (5) has a Kd of 0.4 ± 0.2 μM (n = 0.7 ± 0.2) [Kd = 6.7 ± 0.3 μM by ITC (see Figure S3 of the Supporting Information)] and of 1-octen-3-one (12) a Kd of 4.4 ± 0.5 μM (n = 0.81 ± 0.05). These compounds have binding affinities for Kef that are significantly higher than that of GSH, suggesting that additional affinity for Kef results from the electrophile component of GS-X. This affinity might be as a result of hydrophobic interactions between the conjugate and Kef. Alternatively, the increase in affinity might reflect an enthalpic increase in affinity resulting from a conformational change in the Kef protein and/or entropic gains in affinity resulting from the release of structured water molecules that are lodged in the Kef protein prior to GS-X binding.
Analysis of the structure binding relationships of the series of ESG analogues (4–12) reveals that GSH adducts formed with either rigid (4–9) or flexible electrophiles result in compounds that bind with similar affinity to Kef (for example, compounds 6 and 12). However, these assays do not provide any information about whether the adducts activate or inhibit Kef activity. To determine whether ESG analogues 4–12 activated Kef, an analysis of the electrophiles [13–22 (Figure 9B)] corresponding to GS-X conjugates 4–7 and 10–12 was conducted in a whole cell K+ efflux assay (see Experimental Procedures). This analysis revealed that compounds containing bulky and rigid ring substituents (5–7) showed similar activation of efflux of K+ to ESG. Compound 8 possesses two ketone groups, similar to the succinimide of compounds 4–7 but lacks the substituted nitrogen atom. Compound 9 possesses only one ketone group and no substituted nitrogen atom. Both of these compounds showed reduced binding affinity for Kef and little or no activation of K+ efflux, respectively. These results suggest that rigid ligands that lack sufficient steric bulk are not able to activate the Kef system. More flexible compounds 10–12 display affinities for Kef similar to those of the more rigid compounds (e.g., compounds 6 and 12) in both the fluorescence and DSF assays (Figure 8A,B). However, the electrophiles corresponding to these compounds displayed markedly different abilities to evoke K+ efflux. Compound 16 caused significant K+ release, whereas compound 22 was less effective at causing K+ release (Figure 9). The physical parameter log P (P = octanol/water partition coefficient) (Figure S4 of the Supporting Information) gives an indication of the lipophilicity of the compounds and thus the likelihood of penetration into the cytoplasm, which is the site of the GSH binding domain on SdKef. Compounds that are very lipophilic may have very much lower concentrations in the cytosol because of their partitioning into the lipid phase of the membrane. Most of the electrophiles (15–22) exhibit calculated log P (cLogP) values much higher than that of NEM (14), which causes rapid loss of K+ via Kef after its reaction with GSH20 and acts as a reference point for permeation into the cytoplasm for the other electrophiles. The data indicate that all of the electrophiles (13–22) should make ready access to the GSH pool and react to form GS-X. As all of the electrophiles react rapidly with GSH to form GS-X,23 this step is also unlikely to be rate-limiting for the overall observed K+ efflux. Thus, failure of the electrophile to elicit K+ efflux represents a lack of Kef activation rather than a lack of GS-X formation. It is interesting to note that N-cyclohexylmaleimide (17) and 1-octen-3-one (22) have very similar cLogP values (see the Supporting Information). However, N-cyclohexylmaleimide (17) causes rapid K+ efflux, whereas octenone (22) causes little K+ efflux. Therefore, these data suggest that tight Kef binding alone is insufficient for activation of the Kef system, resulting in K+ efflux. Rather, the structural nature of the electrophile also plays an important role in determining whether the Kef system is activated, with a degree of steric bulk and structural rigidity being mutual requirements for efficient Kef activation.
Figure 9.
Dependence of SdKef activation on the structure of the GSX adduct formed with different electrophiles. (A) Rate constants for K+ efflux as a function of electrophile structure. Potassium efflux experiments were performed with E. coli strain MJF335 transformed with wild-type SdKef and grown in the presence of GSH. All electrophiles were added to a final concentration of 0.5 mM. (B) Structures of the electrophiles (13–22) employed in the K+ efflux assay.
Conclusion
We have developed a simple, fluorescence-based, system for evaluating the binding of ligands to Kef. Using this system, in association with other biophysical techniques, we have provided the first quantitative determination of the affinity of GSH and ESG for Kef (from S. denitrificans). These data explain the ability of ESG to displace GSH and activate Kef, despite the presence of a vast excess of GSH in a cellular context. We synthesized a collection of GSH derivatives and evaluated their binding to Kef using the fluorescence-based assay. We determined tert-butylmaleimide (5) has a Kd of 0.4 ± 0.2 μM, as the highest-affinity Kef ligand reported to date. Analysis of the structure–activity data for these ligands revealed a mutual requirement of steric bulk and structural rigidity to give effective activation of Kef. This information will be valuable in the design of nonpeptide ligands for the Kef system that will aid the validation of Kef as a potential therapeutic target.
Glossary
Abbreviations
- Kef
potassium efflux system
- GSH
glutathione
- GS-X
glutathione-S-conjugates
- Q-linker
linker between the membrane and soluble domain residues 391–408 (SdKef numbering)
- SdKef
Kef from S. denitrificans OS217
- SdKefQCTD
C-terminal domain, including the Q-linker of SdKef
- SdKefCTD
C-terminal domain, excluding the Q-linker of SdKef
- EcKefFC
KefC from E. coli
- DNGSH
S-{[5-(dimethylamino)naphthalen-1-yl]sulfonylaminopropyl} glutathione
- ESG
N-ethylsuccinimido-S-glutathione
- SLG
S-lactoylglutathione
- KTN
K+ transport and nucleotide binding
- MG
methylglyoxal
- NEM
N-ethylmaleimide
- MALS
multiangle light scattering
- ITC
isothermal titration calorimetry
- DSF
differential scanning fluorimetry.
Supporting Information Available
Details of bacterial strains and plasmids used in the study, homology of SdKef to Kef systems from E. coli, analysis of ligand binding by fluorescence spectroscopy, analysis of fluorescence competition experiments, details of chemical synthesis, supplemental Figures S1–S4, and 1H and 13C NMR spectra of reported compounds. This material is available free of charge via the Internet at http://pubs.acs.org.
Author Present Address
∥ J.H.: Department of Pharmaceutical and Biological Chemistry, School of Pharmacy, University College London, 29–39 Brunswick Square, London WC1N 1AX, United Kingdom.
Author Contributions
J.H. and S.E. contributed equally to the work.
The authors declare no competing financial interest.
This work was supported by The Wellcome Trust (WT092552MA), The Leverhulme Trust (EM-2012-60\2), BBSRC SysMO (BB/F003455/1), a European Union Marie Curie ITN Award (NICHE; 289384), a Leverhulme Emeritus Fellowship (I.R.B.), an EPSRC studentship (S.C.G.), and funds from the University of Aberdeen and St Hugh’s College, University of Oxford.
Supplementary Material
References
- Ferguson G. P.; McLaggan D.; Booth I. R. (1995) Potassium channel activation by glutathione-S-conjugates in Escherichia coli: Protection against methylglyoxal is mediated by cytoplasmic acidification. Mol. Microbiol. 17, 1025–1033. [DOI] [PubMed] [Google Scholar]
- Ferguson G. P.; Nikolaev Y.; McLaggan D.; Maclean M.; Booth I. R. (1997) Survival during exposure to the electrophilic reagent N-ethylmaleimide in Escherichia coli: Role of KefB and KefC potassium channels. J. Bacteriol. 179, 1007–1012. [DOI] [PMC free article] [PubMed] [Google Scholar]
- Ferguson G. P.; Tötemeyer S.; MacLean M. J.; Booth I. R. (1998) Methylglyoxal production in bacteria: Suicide or survival?. Arch. Microbiol. 170, 209–218. [DOI] [PubMed] [Google Scholar]
- McLaggan D.; Rufino H.; Jaspars M.; Booth I. R. (2000) Glutathione-dependent conversion of N-ethylmaleimide to the maleamic acid by Escherichia coli: An intracellular detoxification process. Appl. Environ. Microbiol. 66, 1393–1399. [DOI] [PMC free article] [PubMed] [Google Scholar]
- Ferguson G. P.; Munro A. W.; Douglas R. M.; McLaggan D.; Booth I. R. (1993) Activation of potassium channels during metabolite detoxification in Escherichia coli. Mol. Microbiol. 9, 1297–1303. [DOI] [PubMed] [Google Scholar]
- Ozyamak E.; Black S. S.; Walker C. A.; Maclean M. J.; Bartlett W.; Miller S.; Booth I. R. (2010) The critical role of S-lactoylglutathione formation during methylglyoxal detoxification in Escherichia coli. Mol. Microbiol. 78, 1577–1590. [DOI] [PMC free article] [PubMed] [Google Scholar]
- Roosild T. P.; Castronovo S.; Healy J.; Miller S.; Pliotas C.; Rasmussen T.; Bartlett W.; Conway S. J.; Booth I. R. (2010) Mechanism of ligand-gated potassium efflux in bacterial pathogens. Proc. Natl. Acad. Sci. U.S.A. 107, 19784–19789. [DOI] [PMC free article] [PubMed] [Google Scholar]
- Roosild T. P.; Castronovo S.; Miller S.; Li C.; Rasmussen T.; Bartlett W.; Gunasekera B.; Choe S.; Booth I. R. (2009) KTN (RCK) Domains Regulate K+ Channels and Transporters by Controlling the Dimer-Hinge Conformation. Structure 17, 893–903. [DOI] [PMC free article] [PubMed] [Google Scholar]
- Miller S.; Douglas R. M.; Carter P.; Booth I. R. (1997) Mutations in the glutathione-gated KefC K+ efflux system of Escherichia coli that cause constitutive activation. J. Biol. Chem. 272, 24942–24947. [DOI] [PubMed] [Google Scholar]
- Ness L. S.; Booth I. R. (1999) Different foci for the regulation of the activity of the KefB and KefC glutathione-gated K+ efflux systems. J. Biol. Chem. 274, 9524–9530. [DOI] [PubMed] [Google Scholar]
- Epstein W.; Kim B. S. (1971) Potassium transport loci in Escherichia coli K-12. J. Bacteriol. 108, 639–644. [DOI] [PMC free article] [PubMed] [Google Scholar]
- Bartlow P.; Uechi G. T.; Cardamone J. J.; Sultana T.; Fruchtl M.; Beitle R. R.; Ataai M. M. (2011) Identification of native Escherichia coli BL21 (DE3) proteins that bind to immobilized metal affinity chromatography under high imidazole conditions and use of 2D-DIGE to evaluate contamination pools with respect to recombinant protein expression level. Protein Expression Purif. 78, 216–224. [DOI] [PubMed] [Google Scholar]
- Thrall S. H.; Reinstein J.; Wöhrl B. M.; Goody R. S. (1996) Evaluation of human immunodeficiency virus type 1 reverse transcriptase primer tRNA binding by fluorescence spectroscopy: Specificity and comparison to primer/template binding. Biochemistry 35, 4609–4618. [DOI] [PubMed] [Google Scholar]
- Miller S.; Ness L. S.; Wood C. M.; Fox B. C.; Booth I. R. (2000) Identification of an ancillary protein, YabF, required for activity of the KefC glutathione-gated potassium efflux system in Escherichia coli. J. Bacteriol. 182, 6536–6540. [DOI] [PMC free article] [PubMed] [Google Scholar]
- Jiang Y.; Lee A.; Chen J.; Cadene M.; Chait B.; MacKinnon R. (2002) Crystal structure and mechanism of a calcium-gated potassium channel. Nature 417, 515–522. [DOI] [PubMed] [Google Scholar]
- Albright R.; Vazquez Ibar J.; Un Kim C.; Gruner S.; Morais-Cabral J. (2006) The RCK Domain of the KtrAB K+ Transporter: Multiple Conformations of an Octameric Ring. Cell 126, 1147–1159. [DOI] [PubMed] [Google Scholar]
- Roosild T. P.; Miller S.; Booth I. R.; Choe S. (2002) A mechanism of regulating transmembrane potassium flux through a ligand-mediated conformational switch. Cell 109, 781–791. [DOI] [PubMed] [Google Scholar]
- Chen R. F. (1967) Fluorescence of dansyl amino acids in organic solvents and protein solutions. Arch. Biochem. Biophys. 120, 609–620. [Google Scholar]
- Gros C.; Labouesse B. (1969) Study of the dansylation reaction of amino acids, peptides and proteins. FEBS J. 7, 463–470. [DOI] [PubMed] [Google Scholar]
- Friedman M. (1973) The Chemistry and Biochemistry of the Sulfhydryl Group in Amino Acids. In Peptides and Proteins (Friedman M., Ed.) pp 311–363. Pergamon Press, Oxford, U.K. [Google Scholar]
- Elmore M. J.; Lamb A. J.; Ritchie G. Y.; Douglas R. M.; Munro A.; Gajewska A.; Booth I. R. (1990) Activation of potassium efflux from Escherichia coli by glutathione metabolites. Mol. Microbiol. 4, 405–412. [DOI] [PubMed] [Google Scholar]
- Meury J.; Lebail S.; Kepes A. (1980) Opening of potassium channels in Escherichia coli membranes by thiol reagents and recovery of potassium tightness. FEBS J. 113, 33–38. [DOI] [PubMed] [Google Scholar]
- Böhme A.; Thaens D.; Paschke A.; Schüürmann G. (2009) Kinetic glutathione chemoassay to quantify thiol reactivity of organic electrophiles: Application to α,β-unsaturated ketones, acrylates, and propiolates. Chem. Res. Toxicol. 22, 742–750. [DOI] [PubMed] [Google Scholar]
Associated Data
This section collects any data citations, data availability statements, or supplementary materials included in this article.


