

Abstract
Laser-induced microbubbles were used to porate the cell membranes of localized single NIH/3T3 fibroblasts. Microsecond laser pulses were focused on an optically absorbent substrate, creating a vapour microbubble that oscillated in size at the laser focal point in a fluidic chamber. The shear stress accompanying the bubble size oscillation was able to porate nearby cells. Cell poration was demonstrated with the delivery of FITC-Dextran dye with various molecular weights. Under optimal poration conditions, the cell poration efficiency was up to 95.2 ± 4.8 %, while maintaining 97.6 ± 2.4 % cell viability. The poration system is able to target a single cell without disturbing surrounding cells.
Introduction
The delivery of exogenous molecules into mammalian cells is the basis for gene transfection and some types of therapeutic treatments.1 Furthermore, the ability to target specific single cells for molecular delivery is helpful in many cases, such as stem cell research,2, 3 single cell analysis,4 and other situations where single-cell modification needs to be induced in situ.
Some widely used molecular delivery methods include viral- or chemical-based transfection,5, 6 and electroporation using pulsed electric fields.7 These techniques create pores in the cell membranes, and are suitable for transferring molecules into a large group of cells.5–7 Sonoporation also porates large number of cells at the same time using acoustic energy facilitated by cavitation microbubbles.8–11 The function of the ultrasound-activated microbubbles was studied at the single-cell level.11, 12 Localized shear stress generated by rapid bubble expansion, contraction, and collapse may create transient pores in the membrane of nearby cells.11 Another novel approach to molecular delivery was to porate cells as they pass through a constriction.13
Serial molecular delivery to individual cells can be accomplished by skilled operators using microinjectors.14, 15 Similarly, single-cell electroporation can use microelectrodes, micropipets, or other microscale devices to achieve the serial poration of individual cells.16 Electroporation by light-induced virtual electrodes via a photosensitive surface can result in parallel single cell poration, although this uses low-conductivity media, which can limit cell compatibility.17
Optoporation is another method for localized cell poration, and is induced by nanosecond or femtosecond laser pulses.18–20 Nanosecond laser pulses focused above the cell monolayer can induce cavitation bubble formation, expansion, and collapse, which causes poration of nearby cells.18 If cells were too close to the bubble, they may be detached or lysed.18 Currently, the effective zone of nanosecond laser poration is at least 100 μm, which means that dozens of cells are targeted at once.18 Due to the relatively longer pulse duration of nanosecond laser and the corresponding vigorous bubble activity, reliable single-cell target poration has not been demonstrated.21, 22 Thus continued research is ongoing for more precise poration of individual cells in situ with higher efficiency and cell viability.22–24
Femtosecond lasers have also been used to porate cells.3, 20, 22, 25–27 The transfection efficiency using femtosecond-laser poration can reach 80% for stem cell lines and 90% for Chinese hamster ovary (CHO) cells.3 High spatial precision in the poration can also be achieved, with a resolution less than the size of a single cell.20, 22, 27 The femtosecond laser needs to be precisely focused onto the upper cell membrane surface; a deviation of 3 μm in the focal plane, which could be due to varying heights of the cells, can cause a decrease in poration efficiency of more than 50%.22 Serially adjusting the laser focus for each cell limits throughput, although the use of non-diffracting Bessel beams have been demonstrated to address this issue.22, 26 In addition, the cost of femtosecond laser systems is also a barrier for certain applications.
This paper reports a new optoporation method, laser-induced microbubble poration (LMP). In this process, microsecond laser pulses are used to control the generation and size of vapour microbubbles in biocompatible solutions via the heating of an optically absorbent substrate.28–33 To achieve cell poration, the pulsed laser is focused onto the optically absorbent substrate, generating a microbubble near the edge of a cell. The on and off cycles of the laser pulses induce an oscillation in the size of induced microbubbles, creating shear stresses on the nearby cell membrane, achieving poration. The LMP method inherits all the advantages of other optoporation methods. No microfluidic structures are needed, enabling the poration of any cell within a fluidic chamber, with the potential for parallel and automated operation. The setup is compatible with less-expensive continuous-wave diode lasers, making it suitable for wide adoption. Experimental results show that the LMP system can achieve high cell poration efficiencies, while maintaining high cell viability.
Setup and mechanism
Setup of the LMP system
The system for LMP consists of a fluidic chamber for bubble-cell interaction with a laser focused on the chamber floor from below (Fig. 1). The bottom and top of the fluidic chamber are formed by clamping together an optically absorbent substrate and a glass slide, separated by spacers (Fig. 1, inset). The bottom optically absorbent substrate consists of a 1-mm-thick glass slide coated with a 200-nm-thick layer of indium tin oxide (ITO), topped by a 1-μm-thick layer of amorphous silicon (α-silicon). The majority of the incident light (70%) from the laser was absorbed in the ITO and α-silicon layers of the absorbent substrate34 and converted into heat, creating vapour microbubbles on the substrate. The surface of the glass slide is covered with a cell monolayer, which faces towards the interior of the chamber. The chamber height is defined by uniform-sized polystyrene beads (Polysciences, Inc.) that act as spacers, placed on two opposite sides of the chamber. The other two sides of the chamber are left open to allow for the fluid exchange.
Fig. 1.

The laser-induced microbubble poration (LMP) system. The microbubble is induced and controlled by a focused 980-nm diode laser in a microfluidic chamber. The bottom of the chamber is an optically absorbent substrate coated with indium tin oxide (ITO) and amorphous silicon (α-silicon) layers. The ceiling of the chamber is a glass slide with pre-cultured cell monolayer.
A 980-nm diode laser with a maximum power of 800 mW (Laserlands, 980MD-0.8W-BL) was mounted on an X-Y stage beneath the fluidic chamber. The laser was focused by a 10X objective lens to an 8.8 μm-diameter spot on the absorbent substrate, at a measured intensity of 127 kW/cm2. The laser was modulated on and off by a TTL pulse signal from a function generator (Agilent 33220A), allowing the modulation of the bubble size and frequency of its oscillation in size.
The peak shear stress created by the rapid oscillation in size of the microbubble rapidly reduces as the distance from the microbubble increases.18 If the microbubble is too close to the cell, the shear stress may be strong enough to cause cell lysis; on the contrary, if the bubble is further away, the shear stress may be too weak to provide sufficient poration for efficient molecular delivery.18 Thus, there is an optimum shear stress range for cell poration. Control of the laser parameters and position allows the LMP system to achieve the optimum shear stress for poration. The modulation of the laser pulse width enables the controllable and reproducible production of size-oscillating microbubbles, and the laser X-Y position can locate the microbubbles at the proper distance from the targeted cells. Since the cells interact with the microbubbles, and not directly with the laser, the potential of optical damage to the cells is minimized.
The LMP mechanism
Fig. 2 shows a diagram of the LMP mechanism. A microscale bubble is produced near the target cell by the optical heating of the substrate (Fig. 2a). The bubble expands rapidly,35 inducing microstreaming around the bubble, and a corresponding shear stress. The shear stress may also be augmented by the thermocapillary force created by the temperature gradient on the surface of the microbubble.36 The shear stress on the cell can produce nanoscale pores in the membrane (Fig. 2b), enhancing membrane permeability, with minimal adverse effects.37, 38 Direct contact of the bubble to the cells should not be a major factor for poration, based on theoretical models (Fig. S7 in ESI). The shear stress induced by one bubble expansion cycle is not enough to porate the cell membrane; however, if the bubble oscillates in size over many cycles, the cell membrane becomes permeable to molecules (Fig. 2c).37 The bubble expands and collapses when the laser is on and off, respectively, so the laser pulse train controls the shear stress on the nearby cell membrane. Deactivating the laser stops the poration, and the cell membrane reseals quickly (Fig. 2d). Without the laser excitation, the induced microbubble dissolves into the solution in approximately 20 milliseconds. The oscillation in bubble size is similar to the bubble behavior in sonoporation.12 However, the LMP system avoids vigorous bubble collapse, thus limiting the maximum shear force that occurs.39 This helps to reduce harm to the porated cells.
Fig. 2.

Schematic of the LMP mechanism. (a) An oscillating microbubble is produced by laser pulse near cell membrane in the working medium. (b) The microbubble expands and collapses due to the laser pulses. The induced microstreaming around bubble causes pores to open in the cell membrane. (c) Molecules in the working medium can travel into cell interior via pores in cell membrane. (d) The cell membrane reseals quickly after the laser pulses cease.
The bubble formation and bubble size oscillation can be affected by changing the laser pulse width. With the 10X focusing lens, microbubbles with a minimum size of approximately 8 μm in diameter start forming once the laser pulse width exceeds 70 μs (Fig. 3). A longer laser pulse width of 90 to 110 μs can ensure controllable and repeatable bubble size oscillation. If the pulse width is higher than 350 μs, the bubble size increases to larger than 10 μm, and the bubble ceases oscillating in size, thus losing its poration capability.
Fig. 3.

Microbubble formation and size oscillation under varying laser pulse widths. The dark spot in the microscopic images shows the bubble profile. When the pulse width is lower than the 70 μs, there is no visible bubble formation. When the laser pulse width is around 90 to 110 μs, the bubble oscillates in size. If the laser pulse is longer, such as 350 μs, the bubble size is stable, without oscillation.
The microstreaming flow surrounding the oscillating microbubble can be visualized with 0.5-μm-diameter polystyrene tracer beads. The submicron tracer particles move in toroidal flow profile that extends 10 to 15 μm from the center of the bubble (Fig. 4). This image is a composite of 115 images recorded over 333 milliseconds, and was processed using ImageJ. The bubble area is marked by the dashed circle.
Fig. 4.
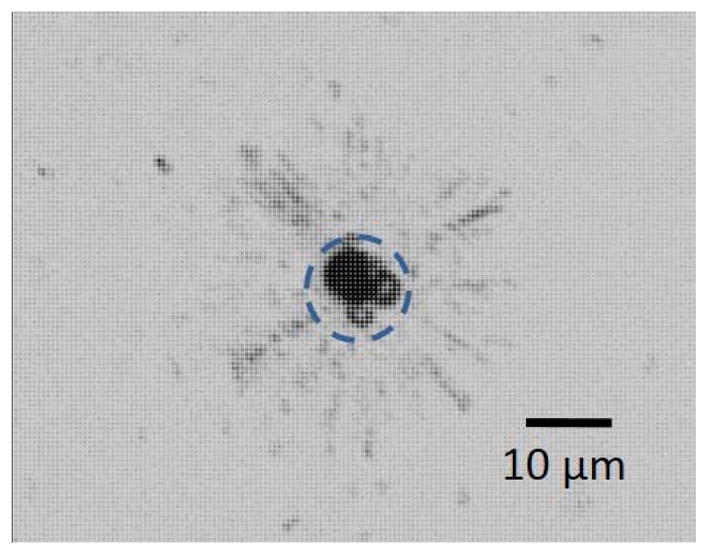
Microstreaming around an oscillating bubble visualized with tracer particles (0.5-μm-diameter polystyrene beads). This is a composite of 115 images taken over 333 ms.
Negative control tests were conducted to exclude other possible poration mechanisms, and are described in detail in the electronic supplementary information (ESI) accompanying this article. Briefly, an uncoated glass substrate was used instead of the optically absorbent substrate, while keeping all other experimental conditions the same. With the glass substrate, no microbubbles were formed, so no fluid flow or cell poration was observed (Fig. S1 in ESI). This indicates the poration is induced by the microbubble and the corresponding shear stress, but not directly from the laser energy. In addition, a longer laser pulse width was used to produce bubbles which did not oscillate in size. Under these conditions, the nearby cells were not porated (Fig. S2). This indicates the oscillation in bubble size, the corresponding microstreaming, and the induced shear stress is crucial for cell poration.
Experimental methods
Cell culture
NIH/3T3 fibroblasts (ATCC) were grown at 37 °C in 5% CO2. One day prior to use in the LMP system, the cells were cultured on sterile glass slides in Dulbecco’s Modified Eagle’s Medium (DMEM, ATCC), 10% bovine serum (Gibco, Invitrogen), penicillin (100 U/ml), and streptomycin (100 μg/ml). The cells were 50 to 70% confluent when used for the LMP experiments.
Cell poration
Fluorescein-isothiocyanate-(FITC) conjugated Dextran (Sigma-Aldrich, MW = 3 kDa, 70 kDa, 150 kDa, and 500 kDa) was used as a demonstration molecule for delivery. A solution of 15mg/ml FITC-Dextran in 1X phosphate buffered saline (PBS) was added to the cell chamber. One day before the test, cells were pre-cultured on a piece of clean glass slide (25 mm × 10 mm), which was flame sterilized with ethanol immediately before the cell culture. The glass slide with the pre-cultured 3T3 cells was taken out from the culture medium and washed with PBS to remove the cell debris. Then the fluidic chamber is formed with it, which was later filled with FITC-Dextran solution. The interaction of the microbubbles and the target cells resulted in poration of specific cells. After the poration, the excess FITC-Dextran was rinsed thoroughly with cell culture medium. Poration was verified by observing green fluorescence from FITC under an epi-fluorescent microscope. The camera exposure time and gain were kept constant over the various experiments. The recorded images were analysed using ImageJ. Cells were recorded as successfully porated if the green colour intensity values were higher than 50, on a scale of 0 to 255.
Cell viability assay
Cell viability was assessed using Ethidium homodimer-1 (EthD-1, Invitrogen), a membrane-impermeable fluorescent dye. EthD-1 enters cells with damaged membranes and binds to nucleic acids to emit a red fluorescence, indicating dead cells. After LMP cell poration, 20 μM EthD-1 in cell culture medium was loaded into the fluidic chamber and incubated for 20 min to test the cell viability.
Optimization of the LMP parameters
The parameters that affect the production and positioning of the microbubbles were studied to maximize poration efficiency and subsequent cell viability, using molecules of 3-kDa FITC-Dextran. The parameters that were varied include: laser focal point size and intensity, microbubble size, laser pulse width, height of the microfluidic chamber, and the poration duration for each cell. More than 30 cells were tested for each parameter in the following experiments. The laser pulse width characterization has been shown in Fig. 3. More detailed results and discussions are in the ESI.
Another important parameter is the lateral distance between the bubble edge and the cell membrane (Fig. 5). When the lateral distance between bubble edge and cell membrane is zero, the poration efficiency and cell viability reach their highest levels. Since there is a vertical separation between the cell and the bubble, defined by the fluidic chamber height, a short lateral distance helps to increase the poration efficiency. When the lateral distance is increased, the shear stress decreases rapidly, and the poration efficiency drops dramatically with distance. When the lateral distance was 5 μm, the poration efficiency was only 30.0 ± 5.0 %; for a lateral distance of 10 μm, this decreased further to 7.67 ± 3.93%. As expected, the cell viability was maintained as the lateral distance increased. It should be noted that even with a lateral distance of 0 μm, there is no direct contact of the laser beam on the cell, so the potential of laser-induced cell damage is minimized.
Fig. 5.

Cell poration efficiency and cell viability as a function of the lateral distance between cell membrane and bubble edge. Error bars show the standard error of the measurements. More than 30 cells were tested in each of 3 experiments for each lateral distance.
The empirically determined optimized parameters are as follows (Table 1): a 10X laser-focusing lens with a fluidic chamber height of 20 μm; a laser pulse width of 90 μs at a frequency of 50 Hz, which creates bubble with diameters from 7 to 9 μm; the lateral distance between bubble edge and the cell membrane is 0 μm; the cell is subjected to poration for a duration of 15 s. Under these optimized cell poration conditions, the average poration efficiency of 3-kDa FITC-Dextran can reach to 95.2 ± 4.8 %, while the average cell viability is as high as 97.6 ± 2.4 %. All of the following experiments used these optimized LMP parameters.
Table 1.
Optimized parameters
| Characterization items | Optimized parameters |
|---|---|
| Laser-focusing objective lens | 10X |
| Laser pulse width | 90 μs |
| Bubble diameter | 7 to 9 μm |
| Lateral distance between bubble edge and cell membrane | 0 μm |
| Fluidic chamber height (vertical distance) | 20 μm |
| Poration duration | 15 s |
Results and discussion
Poration of targeted cells
An example of successful molecular delivery is shown in Fig. 6. Four healthy NIH/3T3 cells were subjected to poration using the same microbubble, and subsequently emitted green fluorescence due to the successful delivery of 3-kDa FITC-Dextran dye under optimized conditions. No red fluorescence from the EthD-1 dye was observed in these porated cells, indicating the cells were viable after poration. The cell in the lower-left corner of the field-of-view was used as a negative control. This cell was not porated, and as expected, displayed no green or red fluorescence.
Fig. 6.
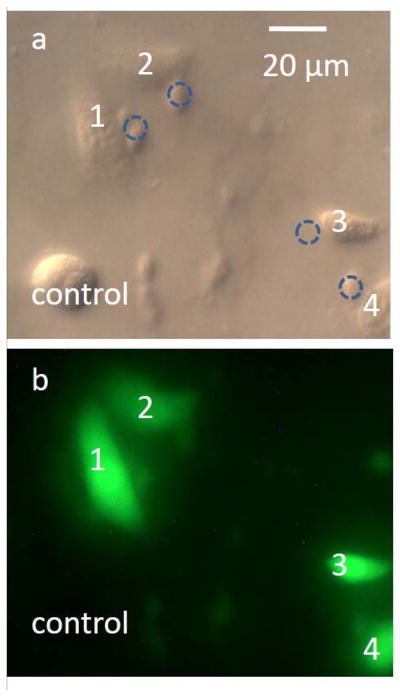
Molecular delivery to NIH/3T3 fibroblasts. (a) DIC image of the porated cells, which are numerically labeled. The dashed circles indicate the locations of the microbubble when it was porating the nearby cells. (b) Fluorescent image of the porated cells. All target cells were successfully porated with 3-kDa FITC-Dextran dye, indicated by the green fluorescence. The cells did not display red fluorescence due to EthD-1, indicating that the cells were viable after poration. The cell in the lower-left corner was a negative control, and was not porated.
Delivery of dyes with various molecular weights
FITC-Dextran can be engineered to have different physical dimensions by varying the molecular weight (MW) of the conjugated Dextran. In addition to the 3-kDa FITC-Dextran molecules used in the optimization process, 70 kDa, 150 kDa, and 500 kDa molecules were also used to determine the size range of molecules that are compatible with the LMP. The 3 kDa, 70 kDa, 150 kDa and 500 kDa molecules have approximate Stoke’s diameters of 2.8 nm, 12 nm, 17 nm, and 29.4 nm, respectively. The measured poration efficiency for the four different molecules is shown in Fig. 7. The poration efficiency of the 3-kDa FITC-Dextran, corresponding to the optimized conditions, is 95.2 ± 4.8 %. For 70-kDa FITC-Dextran, the efficiency decreases to 76.7 ± 8.8 %. The efficiency is significantly reduced for the 150-kDa molecules (17.0 ± 7.5 %) and the 500-kDa molecules (5.0 ± 5.0 %). The cell viability for all these experiments remained at or close to 100%, as expected.
Fig. 7.

Cell poration efficiency and resulting cell viability for FITC-Dextran molecules of various sizes (3 kDa, 70 kDa, 150 kDa, and 500 kDa). More than 30 cells were tested in each of 3 experiments for each molecular size.
The pore size induced by LMP under the optimized conditions tested here is expected to be around 30 nm, as suggested by the poor poration efficiency of the 500-kDa molecules. These results show that the pore size is similar to sonoporation using similarly sized bubbles.11 The relatively small pore size means that this poration method is relatively mild, which helps to maintain high cell viability, facilitating the delivery of many small molecules, such as chemicals, RNA, small proteins, and DNA plasmids. It is also possible that more aggressive poration conditions could be used to enhance the poration efficiency for larger molecules by producing larger pores in cell membrane. Harsher conditions may decrease cell viability, but as the current cell viability is nearly 100%, it may be possible to find a reasonable compromise.
Pore transience
The duration of the pores created by LMP was estimated by porating cells under optimal conditions, but in a solution without FITC-Dextran; immediately afterwards, FITC-Dextran solution was added at one side of the fluidic chamber, while a piece of filter paper was placed at the opposite side of the chamber. This replaced the non-FITC working solution with FITC-Dextran solution by capillary action. The medium replacement lasts approximately 20 seconds. After the FITC-Dextran solution replacement, none of the cells porated by LMP displayed green fluorescence, which indicates that the pores reseal in less than 20 s, before the FITC-Dextran dye molecules reach the cells. This result is consistent with the range of cell-friendly pore-opening dynamics reported by other bubble facilitated sonoporation and optoporation studies.27, 40 Thus, the cell membrane reseals rapidly using LMP, which also facilitates the high cell viability.
Poration of single cells
Specific single-cell poration can be achieved by the LMP. When the lateral distance between the edge of the LMP bubble and non-targeted cells is larger than 10 μm, the non-targeted cells are unlikely to be porated. This is due to the effective range of the poration from the microbubble: as mentioned in the optimization of LMP systems, there was little cell poration when the bubble is at a lateral distance of 10 μm or more from the cell membrane (Fig. 5). This is also consistent with the 10 to 15 μm radial range of the effective toroidal flow surrounding the oscillating bubble, as visualized by the submicron tracer particles (Fig. 4). In addition, the confluence of the cell monolayer does not exceed 70%. Under these conditions, there was usually a distance of more than 20 μm between neighboring cells, allowing the microbubbles to target single cells. It will not affect the LMP if the cell confluence is lower. Thus, as the bubble position can be precisely controlled, the LMP can achieve localized single-cell poration without affecting neighbouring cells. As shown in Fig. 8, a target cell adjacent to non-target cells was treated by LMP, resulting in the delivery of 3-kDa FITC-Dextran dye. There was no green or red fluorescent detected in the neighbouring cells, indicating the membrane activities and viabilities of these cells were not disturbed. It shows that LMP can porate single cells with high resolution; even the cell that was immediately adjacent to the target cell was not affected.
Fig. 8.
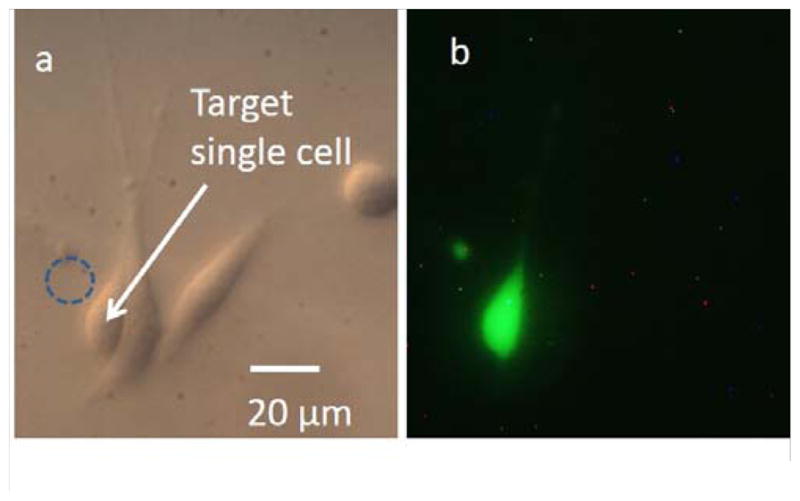
Single-cell poration result. (a) DIC image of cells after the targeted single-cell poration. The dashed circle indicates the location of the microbubble. (b) The fluorescent image shows the successfully porated target cell, with no poration of the neighbouring cells.
Conclusion
Localized single-cell poration by laser-pulse-induced microbubbles was demonstrated and characterized. The LMP system provides a simple and economical method for targeted single-cell, which adds value to the lab-on-a-chip miniaturization trend.
This LMP achieved a high poration efficiency (95.2 ± 4.8 %) and high cell viability (97.6 ± 2.4 %) for 3-kDa FITC-Dextran molecular delivery. Molecules with sizes varying from 2.8 nm to 29.4 nm were used for LMP, suggesting that the average induced pore size is approximately 30 nm. Potentially, the delivery of larger molecules may also be achieved by using more vigorous LMP parameters, although this may possibly reduce the cell viability. A pore transience study was also conducted, showing that the cell membrane reseals within 20 s. The LMP can selectively porate single cells in specific spatial locations.
In the future, the parallel control of microbubbles will be developed, enabling the poration of multiple target cells at the same time. This will increase the throughput of the LMP system, which is currently 15 s per cell. One implementation of this could be a laser scanning system that can project a single laser onto multiple areas of the substrate within one period, as the laser pulse width of 90 μs is far smaller than the 20-ms pulse period that was used. There is also the potential to achieve higher poration efficiency, especially for larger molecules, by adjusting the poration parameters.
Supplementary Material
Acknowledgments
This project was supported in part by Grant Number 1R01EB016458-01 from the National Institute of Biomedical Imaging and Bioengineering of the National Institutes of Health (NIH) as part of the NSF/NASA/NIH/USDA National Robotics Initiative.
Footnotes
Electronic Supplementary Information (ESI) available: [details of any supplementary information available should be included here]. See DOI: 10.1039/b000000x/
These contents are solely the responsibility of the authors and do not necessarily represent the official views of the NIH.
Contributor Information
Qihui Fan, Email: fanqihui@hawaii.edu.
Wenqi Hu, Email: wenqihu@hawaii.edu.
Aaron T. Ohta, Email: aohta@hawaii.edu.
References
- 1.Lakshmanan S, Gupta GK, Avci P, Chandran R, Sadasivam M, Jorge AE, Hamblin MR. Adv Drug Deliv Rev. 2013 doi: 10.1016/j.addr.2013.05.010. [DOI] [PMC free article] [PubMed] [Google Scholar]
- 2.Valero A, Post JN, van Nieuwkasteele JW, ter Braak PM, Kruijer W, van den Berg A. Lab Chip. 2008;8:62–67. doi: 10.1039/b713420g. [DOI] [PubMed] [Google Scholar]
- 3.Uchugonova A, Konig K, Bueckle R, Isemann A, Tempea G. Opt Express. 2008;16:9357–9364. doi: 10.1364/oe.16.009357. [DOI] [PubMed] [Google Scholar]
- 4.Yin H, Marshall D. Curr Opin Biotechnol. 2012;23:110–119. doi: 10.1016/j.copbio.2011.11.002. [DOI] [PubMed] [Google Scholar]
- 5.Wang J, Faust SM, Rabinowitz JE. Journal of Molecular and Cellular Cardiology. 2011;50:793–802. doi: 10.1016/j.yjmcc.2010.10.017. [DOI] [PubMed] [Google Scholar]
- 6.Midoux P, Pichon C, Yaouanc JJ, Jaffrès PA. British Journal of Pharmacology. 2009;157:166–178. doi: 10.1111/j.1476-5381.2009.00288.x. [DOI] [PMC free article] [PubMed] [Google Scholar]
- 7.Bodles-Brakhop AM, Heller R, Draghia-Akli R. Molecular Therapy. 2009;17:585–592. doi: 10.1038/mt.2009.5. [DOI] [PMC free article] [PubMed] [Google Scholar]
- 8.Mitragotri S. Nature Reviews Drug Discovery. 2005;4:6. doi: 10.1038/nrd1662. [DOI] [PubMed] [Google Scholar]
- 9.Qiu Y, Zhang C, Tu J, Zhang D. Journal of Biomechanics. 2012;45:1339–1345. doi: 10.1016/j.jbiomech.2012.03.011. [DOI] [PubMed] [Google Scholar]
- 10.Wu J, Pepe J, Rincon M. Ultrasonics. 2006;44:E21–E25. doi: 10.1016/j.ultras.2006.06.033. [DOI] [PubMed] [Google Scholar]
- 11.Fan Z, Liu H, Mayer M, Deng CX. Proc Natl Acad Sci U S A. 2012;109:16486–16491. doi: 10.1073/pnas.1208198109. [DOI] [PMC free article] [PubMed] [Google Scholar]
- 12.van Wamel A, Kooiman K, Harteveld M, Emmer M, ten Cate FJ, Versluis M, de Jong N. J Control Release. 2006;112:149–155. doi: 10.1016/j.jconrel.2006.02.007. [DOI] [PubMed] [Google Scholar]
- 13.Sharei A, Zoldan J, Adamo A, Sim WY, Cho N, Jackson E, Mao S, Schneider S, Han MJ, Lytton-Jean A, Basto PA, Jhunjhunwala S, Lee J, Heller DA, Kang JW, Hartoularos GC, Kim KS, Anderson DG, Langer R, Jensen KF. Proceedings of the National Academy of Sciences. 2013;110:2082–2087. doi: 10.1073/pnas.1218705110. [DOI] [PMC free article] [PubMed] [Google Scholar]
- 14.Zhang Y. Nat Protoc. 2007 doi: 10.1038/nprot.2007.1487. [DOI] [Google Scholar]
- 15.Han SW, Nakamura C, Kotobuki N, Obataya I, Ohgushi H, Nagamune T, Miyake J. Nanomedicine: Nanotechnology, Biology and Medicine. 2008;4:215–225. doi: 10.1016/j.nano.2008.03.005. [DOI] [PubMed] [Google Scholar]
- 16.Wang MY, Orwar O, Olofsson J, Weber SG. Anal Bioanal Chem. 2010;397:3235–3248. doi: 10.1007/s00216-010-3744-2. [DOI] [PubMed] [Google Scholar]
- 17.Valley JK, Neale S, Hsu HY, Ohta AT, Jamshidi A, Wu MC. Lab Chip. 2009;9:1714–1720. doi: 10.1039/b821678a. [DOI] [PMC free article] [PubMed] [Google Scholar]
- 18.Hellman AN, Rau KR, Yoon HH, Venugopalan V. J Biophotonics. 2008;1:24–35. doi: 10.1002/jbio.200710010. [DOI] [PMC free article] [PubMed] [Google Scholar]
- 19.Wu TH, Teslaa T, Kalim S, French CT, Moghadam S, Wall R, Miller JF, Witte ON, Teitell MA, Chiou PY. Analytical Chemistry. 2011;83:1321–1327. doi: 10.1021/ac102532w. [DOI] [PMC free article] [PubMed] [Google Scholar]
- 20.Tirlapur UK, Konig K. Nature. 2002;418:290–291. doi: 10.1038/418290a. [DOI] [PubMed] [Google Scholar]
- 21.Dijkink R, Le Gac S, Nijhuis E, van den Berg A, Vermes I, Poot A, Ohl CD. Phys Med Biol. 2008;53:375–390. doi: 10.1088/0031-9155/53/2/006. [DOI] [PubMed] [Google Scholar]
- 22.Stevenson DJ, Gunn-Moore FJ, Campbell P, Dholakia K. Journal of the Royal Society, Interface/the Royal Society. 2010;7:863–871. doi: 10.1098/rsif.2009.0463. [DOI] [PMC free article] [PubMed] [Google Scholar]
- 23.Le Gac S, Zwaan E, van den Berg A, Ohl CD. Lab Chip. 2007;7:1666–1672. doi: 10.1039/b712897p. [DOI] [PubMed] [Google Scholar]
- 24.Li ZG, Liu AQ, Klaseboer E, Zhang JB, Ohl CD. Lab Chip. 2013 [Google Scholar]
- 25.Stevenson D, Agate B, Tsampoula X, Fischer P, Brown CT, Sibbett W, Riches A, Gunn-Moore F, Dholakia K. Opt Express. 2006;14:7125–7133. doi: 10.1364/oe.14.007125. [DOI] [PubMed] [Google Scholar]
- 26.Tsampoula X, Garces-Chavez V, Comrie M, Stevenson DJ, Agate B, Brown CTA, Gunn-Moore F, Dholakia K. Appl Phys Lett. 2007;91:053902-053902–053903. [Google Scholar]
- 27.Waleed M, Hwang SU, Kim JD, Shabbir I, Shin SM, Lee YG. Biomed Opt Express. 2013;4:1533–1547. doi: 10.1364/BOE.4.001533. [DOI] [PMC free article] [PubMed] [Google Scholar]
- 28.Hu W, Ishii KS, Fan Q, Ohta AT. Lab Chip. 2012;12:3821–3826. doi: 10.1039/c2lc40483d. [DOI] [PubMed] [Google Scholar]
- 29.Zhao C, Xie Y, Mao Z, Zhao Y, Rufo J, Yang S, Guo F, Mai JD, Huang TJ. Lab Chip. 2014;14:384–391. doi: 10.1039/c3lc50748c. [DOI] [PMC free article] [PubMed] [Google Scholar]
- 30.Zheng Y, Liu H, Wang Y, Zhu C, Wang S, Cao J, Zhu S. Lab Chip. 2011;11:3816–3820. doi: 10.1039/c1lc20478e. [DOI] [PubMed] [Google Scholar]
- 31.Xie Y, Zhao C, Zhao Y, Li S, Rufo J, Yang S, Guo F, Huang TJ. Lab Chip. 2013;13:1772–1779. doi: 10.1039/c3lc00043e. [DOI] [PMC free article] [PubMed] [Google Scholar]
- 32.Zhang K, Jian A, Zhang X, Wang Y, Li Z, Tam H-y. Lab Chip. 2011;11:1389–1395. doi: 10.1039/c0lc00520g. [DOI] [PubMed] [Google Scholar]
- 33.Fujii S, Kanaizuka K, Toyabe S, Kobayashi K, Muneyuki E, Haga M-a. Langmuir. 2011;27:8605–8610. doi: 10.1021/la201616s. [DOI] [PubMed] [Google Scholar]
- 34.Hu W, Ishii K, Ohta A. IEEE International Conference on Robotics and Automation (ICRA); 2012; 2012. pp. 733–738. [Google Scholar]
- 35.Rau KR, Quinto-Su PA, Hellman AN, Venugopalan V. Biophysical Journal. 2006;91:317–329. doi: 10.1529/biophysj.105.079921. [DOI] [PMC free article] [PubMed] [Google Scholar]
- 36.Hu W, Fan Q, Ohta AT. Lab Chip. 2013;13:2285–2291. doi: 10.1039/c3lc50389e. [DOI] [PMC free article] [PubMed] [Google Scholar]
- 37.Wu J, Nyborg WL. Adv Drug Deliver Rev. 2008;60:1103–1116. doi: 10.1016/j.addr.2008.03.009. [DOI] [PubMed] [Google Scholar]
- 38.Wu JR. Prog Biophys Mol Bio. 2007;93:363–373. doi: 10.1016/j.pbiomolbio.2006.07.016. [DOI] [PubMed] [Google Scholar]
- 39.Ward M, Wu JR, Chiu JF. J Acoust Soc Am. 1999;105:2951–2957. doi: 10.1121/1.426908. [DOI] [PubMed] [Google Scholar]
- 40.Zhou Y, Yang K, Cui J, Ye JY, Deng CX. J Control Release. 2012;157:103–111. doi: 10.1016/j.jconrel.2011.09.068. [DOI] [PMC free article] [PubMed] [Google Scholar]
Associated Data
This section collects any data citations, data availability statements, or supplementary materials included in this article.