

mTORC2 has been shown to be involved in cytoskeletal regulation, but the mechanisms by which this takes place are poorly understood. This study shows that PKCβII is specifically required for mTORC2-dependent activation of adenylyl cyclase 9 and back retraction during neutrophil chemotaxis to chemoattractants.
Abstract
Chemotaxis is a process by which cells polarize and move up a chemical gradient through the spatiotemporal regulation of actin assembly and actomyosin contractility, which ultimately control front protrusions and back retractions. We previously demonstrated that in neutrophils, mammalian target of rapamycin complex 2 (mTORC2) is required for chemoattractant-mediated activation of adenylyl cyclase 9 (AC9), which converts ATP into cAMP and regulates back contraction through MyoII phosphorylation. Here we study the mechanism by which mTORC2 regulates neutrophil chemotaxis and AC9 activity. We show that inhibition of protein kinase CβII (PKCβII) by CPG53353 or short hairpin RNA knockdown severely inhibits chemoattractant-induced cAMP synthesis and chemotaxis in neutrophils. Remarkably, PKCβII-inhibited cells exhibit specific and severe tail retraction defects. In response to chemoattractant stimulation, phosphorylated PKCβII, but not PKCα, is transiently translocated to the plasma membrane, where it phosphorylates and activates AC9. mTORC2-mediated PKCβII phosphorylation on its turn motif, but not its hydrophobic motif, is required for membrane translocation of PKCβII. Inhibition of mTORC2 activity by Rictor knockdown not only dramatically decreases PKCβII activity, but it also strongly inhibits membrane translocation of PKCβII. Together our findings show that PKCβII is specifically required for mTORC2-dependent AC9 activation and back retraction during neutrophil chemotaxis.
INTRODUCTION
A wide array of eukaryotic cells have the ability to sense external chemical gradients and migrate upward to the attractant source, a process referred to as chemotaxis (Van Haastert and Devreotes, 2004). Chemotaxis is essential for various biological processes, including embryogenesis, immune responses, wound healing, and angiogenesis. It is also implicated in many pathological conditions, such as arthritis, asthma, and tumor metastasis (Wang, 2009). Most eukaryotic cells use G protein–coupled receptors (GPCRs) to detect external chemoattractants, and the binding of chemoattractants to their specific receptors leads to the dissociation of the heterotrimeric G protein into Gα and βγ subunits. Gβγ represents the main transducer of chemotactic signals through the activation of several downstream effectors, including Ras, phosphatidylinositol 3-kinase (PI3K), RhoA, adenylyl cyclase (AC), phospholipase C (PLC), and the target of rapamycin (TOR) (Jin et al., 2008; Liu and Parent, 2011). Together these effectors ultimately regulate actin polymerization and myosin II (MyoII) assembly in a spatiotemporal manner in which protruding pseudopods composed of actively polymerizing F-actin are primarily localized at the front and contracting actomyosin complexes at the sides and rear of the polarized cells (Bagorda et al., 2006).
The Ser/Thr protein kinase mammalian TOR (mTOR) is the catalytic subunit of two distinct complexes called TOR complex 1 (TORC1) and TORC2. Each complex is composed of specific core components and associated proteins: mTORC1 contains mTOR, mLST8, DEPTOR, Raptor, and PRAS40, and mTORC2 contains mTOR, mLST8, DEPTOR, Rictor, mSin1, and protor1/2 (Cybulski and Hall, 2009; Sengupta et al., 2010; Zoncu et al., 2011). Active mTORC1/2 control multiple cellular processes such as cell metabolism, growth, proliferation, differentiation, and survival (Oh and Jacinto, 2011; Zoncu et al., 2011). Moreover, both mTORC1 and mTORC2 regulate cell migration and tumor metastasis (Liu and Parent, 2011). Although the mechanisms by which mTORC1/2 control cell migration remain to be determined, protein kinase Cs (PKCs)—prototypical AGC kinases and effectors of mTORC2—have been reported to regulate cytoskeletal organization in a variety of cell types (Jacinto et al., 2004; Sarbassov et al., 2004; Hernandez-Negrete et al., 2007; Liu et al., 2010). According to their domain structure and biochemical requirement for activation, mammalian PKCs are grouped into conventional (cPKCα, βI, βII, and γ), novel (nPKCδ, ε, η, and θ), and atypical (aPKCζ and λ/ι) PKCs (Rosse et al., 2010). To achieve catalytic competence, cPKCs need to be phosphorylated at three key phosphorylation sites on their C-terminus (Gould and Newton, 2008; Pearce et al., 2010; Freeley et al., 2011). These sites are known as the activation-loop (A-loop), turn motif (TM), and hydrophobic motif (HM) (Freeley et al., 2011). Phosphoinositide-dependent protein kinase 1 (PDK1) is responsible for phosphorylation of A-loop sites, and mTORC2 controls phosphorylation of TM and HM sites (Sarbassov et al., 2004; Facchinetti et al., 2008). Phosphorylated cPKCs remain in an inactive state through the interaction of their N-terminal pseudosubstrate sequence with their C-terminal catalytic kinase domain (Le Good et al., 1998; Newton, 2003; Facchinetti et al., 2008; Ikenoue et al., 2008; Steinberg, 2008). Relieving this autoinhibition requires binding of cPKC to calcium and diacylglycerol (DAG), which also target the enzyme to the plasma membrane (Oancea and Meyer, 1998; Nalefski and Newton, 2001). Once membrane-associated, the binding of DAG to the C1 domain of cPKC is believed to induce conformational changes that lead to release of the N-terminal pseudosubstrate and confer optimal catalytic activity of enzyme.
We previously reported that mTORC2 independently regulates F-actin polarization and MyoII phosphorylation during neutrophil chemotaxis (Liu et al., 2010). The inhibition of mTORC2, by either Rictor knockdown (KD) or prolonged rapamycin treatment, not only strongly inhibits neutrophil polarity and chemotaxis toward chemoattractants, but it also abolishes chemoattractant-induced adenylyl cyclase 9 (AC9) activation and cAMP production. In chemotaxing neutrophils, cAMP is spatially restricted to the cell body and to the back of cells, where it is poised to specifically regulate tail retraction and contraction in a RhoA/ROCK/MyoII-dependent manner. However, the mechanism by which mTORC2 activates AC9 is unclear. We now show that the mTORC2-mediated AC9 activation and tail retraction is mediated through the activation of PKCβII. In neutrophils, PKCβII is specifically required for chemoattractant-induced cAMP accumulation and chemotaxis. On chemoattractant stimulation, PKCβII is rapidly phosphorylated and activated in an mTORC2-dependent manner. Active PKCβII transiently translocates to the plasma membrane, where it is prone to phosphorylate and activate AC9 and regulate tail retraction through a PKA/RhoA/MyoII signaling pathway.
RESULTS
PKCβII is required for N-formyl-methionyl-leucyl-phenylalanine–induced cAMP accumulation and chemotaxis
mTORC2 regulates actin dynamics and cell migration through AGC kinases, including Akt, SGK1, and PKC (Jacinto and Lorberg, 2008). We established that Akt inhibition has no significant effect on chemoattractant-induced cAMP production (Liu et al., 2010). In contrast, the pretreatment of neutrophils with GO6976, a pan-cPKC inhibitor, completely abrogates cAMP production and gives rise to long, extended tails during chemotaxis (Liu et al., 2010). We therefore proposed that mTORC2 regulates AC9 activity and tail retraction through cPKC. Primary neutrophils express the cPKC isoforms PKCα and PKCβI/II (Majumdar et al., 1991; Smallwood and Malawista, 1992; Balasubramanian et al., 2002). Using GO6976 and CGP53353, a permeable ATP-competitive PKCβII/EGFR inhibitor (Traxler et al., 1997), we found that both drugs dramatically inhibit N-formyl-methionyl-leucyl-phenylalanine (fMLP)– and leukotriene B4 (LTB4)–mediated cAMP production (Figure 1A and unpublished data) and give rise to neutrophils with abnormally elongated tails during chemotaxis (Figure 1B and Supplemental Movie S1). These data suggest that PKCβII regulates chemoattractant-induced AC9 activation and tail retraction in neutrophils.
FIGURE 1:

PKCβII is required for fMLP-induced cAMP accumulation and chemotaxis. (A) PKCβII regulates fMLP-induced cAMP production. Human blood neutrophils were treated with 10 μM cPKC inhibitor GO6976 or 5 μM CGP53353 for 30 min. Intracellular cAMP levels were measured before and after chemoattractant addition. Results represent the mean ± SD of three independent experiments. *p < 0.01 compared with the fMLP-stimulated vehicle group. (B) EZ-TAXIScan chemotaxis toward fMLP of cPKC-inhibited human blood neutrophils. Neutrophils were treated with or without 10 μM GO6976 or 5 μM CGP53353 for 30 min. Results show still images from the final frame of the time-lapse recordings. Data are representative of five independent experiments. Bar, 20 μm. Also see Supplemental Movie S1. (C) PKCβII KD inhibits fMLP-induced cAMP production. Differentiated cells were stimulated with 1 μM fMLP, and intracellular cAMP levels were measured at the indicated time points. SEM values are presented from six independent experiments. *p < 0.01 and #p < 0.05 compared with the fMLP-stimulated WT group. (D) EZ-TAXIScan chemotaxis toward fMLP of PKCβII KD cells. Paths of individual cells migrating in a gradient of fMLP as circles (from red to blue with increasing time) overlaid onto the final frame. For clarity, only cells that moved in 10 consecutive frames are shown. Bar, 20 μm. Inset, higher-magnification image of the cells. Data are representative of six independent experiments. Also see Supplemental Movie S2. (E) PKCβII shRNA cells show defects in RhoA-GTP activation. Differentiated cells were plated on fibronectin-coated plates for 10 min and uniformly stimulated with 1 μM fMLP. At specific time points, RhoA-GTP was pulled down and detected using RhoA antibody. Quantification of three experiments is presented as the amount of RhoA-GTP relative to that of NS shRNA–unstimulated cells (mean ± SD). The amount of RhoA-GTP at each point was standardized by dividing its value by the value of total RhoA of the same time point. Also see Supplemental Figure S1E. *p < 0.01 and #p < 0.05 compared with NS shRNA cells. (F) PKCβII shRNA and Rictor shRNA cells show higher P-MLC levels. Differentiated cells were treated as in E. Quantification of three experiments is presented as the amount of P-MLC relative to that of unstimulated WT cells (mean ± SD). The amount of P-MLC at each point was standardized by dividing its value with the value of GAPDH of the same time point. Also see Supplemental Figure S1, F and G. *p < 0.01 and #p < 0.05 compared with NS shRNA cells.
To substantiate these findings, we generated KD cells using short hairpin RNAs (shRNAs). For these experiments, we used a pluripotent hematopoietic cell line, the PLB-985 cells, which can be differentiated into neutrophil-like cells (Tucker et al., 1987). We found that both PKCα and PKCβII are expressed in these cells and that their expression levels are increased upon differentiation into neutrophil-like cells (Supplemental Figure S1A). We screened potential active shRNAs that specifically target the human PKCα and PKCβII mRNA and identified two PKCα shRNAs and four PKCβII shRNAs that specifically decrease PKCα and PKCβII expression (Supplemental Figure S1B). Although neither PKCα nor PKCβII KD alters the ability of PLB-985 cells to be differentiated into neutrophil-like cells (unpublished data), cells expressing PKCβII shRNAs, but not PKCα shRNAs, show reduced cAMP production after fMLP stimulation (Figure 1C and Supplemental Figure S1C). To assess the role of PKCα and PKCβII during neutrophil chemotaxis, we compared the chemotactic ability of NS shRNA, PKCα shRNA, and PKCβII shRNA cells. We found that PKCβII KD cells are specifically defective in their ability to migrate in the gradient of fMLP. Both EZ-TAXIScan (Figure 1D and Supplemental Movie S2) and needle chemotaxis (Supplemental Figure S1D and Supplemental Movies S3–S5) analyses revealed that, like NS shRNA and PKCα shRNA cells, PKCβII shRNA cells are able to sense the chemoattractant gradient, as PKCβII shRNA cells properly orient and polarize. However, in contrast to NS shRNA and PKCα shRNA cells, the back of PKCβII shRNA cells remains strongly attached to the coverslip and cannot effectively retract during migration. Together these findings suggest that PKCβII is specifically required for signals to be transduced from chemoattractants to AC9 and to regulate back retraction.
Because in neutrophils cAMP regulates tail retraction and contraction through a PKA/RhoA/ROCK/MyoII signaling pathway, we measured RhoA activation and myosin regulatory light chain (MLC) phosphorylation after fMLP addition in the KD PLB-985 cells. We found that for NS shRNA and PKCα shRNA cells lines, fMLP exposure leads to a drop in RhoA activity after 1 min, followed by an increase in activity at 5 min. In contrast, PKCβII shRNA cells show a sustained RhoA activity as early as 1 min after stimulation (Figure 1E and Supplemental Figure S1E). Furthermore, we observed that NS shRNA and PKCα shRNA cells display comparable fMLP-induced MLC phosphorylation levels, whereas, similar to Rictor shRNA cells, PKCβII shRNA cells show a consistent increase in the levels of P-MLC (Figure 1F and Supplemental Figure S1, F and G; Liu et al., 2010). Of interest, the chemotaxis defect we observe becomes more evident ∼5 min after the start of migration when the RhoA-GTP and P-MLC levels are similar in wild-type (WT) and mutant neutrophils. We envision that this is due to the way the chemotaxis and biochemical experiments are performed. For the chemotaxis experiments, cells are exposed to a linear gradient of chemoattractants and experience increasing subsaturating receptor activation in a spatiotemporal manner that lead to polarity and migration. On the other hand, the biochemical experiments are performed after a uniform saturating chemoattractant stimulus, for which all of the receptors and downstream signals reach their maximum level and no spatial information is acquired. Nevertheless, defects in both RhoA-GTP and P-MLC levels are already apparent at very early time points, and we believe that these early defects after uniform stimulation translate into the tail retraction defects. In addition, the low-magnification images recorded with the EZ-TAXIScan do not allow precise morphological analyses in the early event of polarization and migration. Taken together, these data show that back retraction defects of PKCβII shRNA cells result from defects in signals that lead to RhoA activation and Myo II phosphorylation. These findings also suggest that mTORC2-mediated AC9 activation and tail retraction is mediated through activation of PKCβII in neutrophils.
fMLP specifically activates PKCβII in mTORC2-dependent manner
In neutrophils, fMLP increases PKC activity with an onset at ∼5 s and a maximum at ∼20 s (Gay and Stitt, 1990). The cPKCs are believed to be the major isoforms contributing to the fMLP-mediated increase in PKC activity, as calcium is necessary for this process. However, it is unclear whether PKCα and PKCβI/II contribute equally to this response. We found that, similar to WT PLB-985 cells, exposure of NS shRNA and PKCα shRNA cells to fMLP results in a rapid increase in PKC activity (Figure 2A). In contrast, PKC activity is significantly inhibited in PKCβII shRNA cells (Figure 2A). We also found that the extent of the fMLP-mediated PKC activation is decreased to similarly low levels in Rictor shRNA cells (Figure 2A), even if, compared with NS shRNA cells, Rictor shRNA cells express similar levels of PKCβII protein (Supplemental Figure S2A). Indeed, in contrast to what was observed in fibroblasts (Facchinetti et al., 2008; Ikenoue et al., 2008), the stability of PKCβII and PKCα does not appear to depend on Rictor in neutrophils, as the level of expression of either PKC isoform did not change in response to chemoattractant addition in the presence of cycloheximide (Supplemental Figure S2A). These data suggest that the chemoattractant-mediated PKC activation is primarily dependent on PKCβII in neutrophils and requires mTORC2.
FIGURE 2:
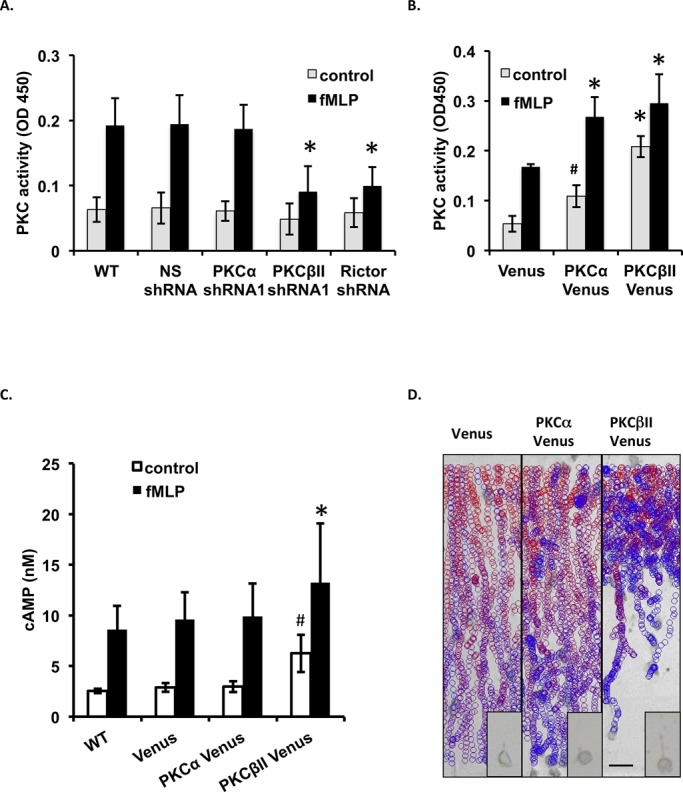
fMLP specifically activates PKCβII in an mTORC2-dependent manner. (A) PKCβII KD and Rictor KD inhibit fMLP-induced PKC activation. Differentiated cells were stimulated with 1 μM fMLP for 20 s, and PKC activity was measured before and after chemoattractant addition. Mean ± SD values are presented from four independent experiments. *p < 0.01 compared with the fMLP-stimulated WT group. (B) Overexpression of PKCβII results in higher basal PKC activity and inhibits chemoattractant-induced PKC activation. Differentiated cells were stimulated with 1 μM fMLP for 20 s, and PKC activity was measured before and after chemoattractant addition. Mean ± SD values are presented from four independent experiments. Also see Supplemental Figure S2B. *p < 0.01 compared with the fMLP-stimulated Venus group. (C) Overexpression of PKCβII results in higher basal cAMP levels and inhibits chemoattractant-induced cAMP production. Differentiated cells were stimulated with 1 μM fMLP for 30 s, and intracellular cAMP was measured before and after chemoattractant addition. Mean ± SD values are presented from four independent experiments. Also see Supplemental Figure S2C. *p < 0.01 and #p < 0.05 compared with the fMLP-stimulated WT group. (D) EZ-TAXIScan chemotaxis toward fMLP of PKCβII Venus cells. Data are representative of six independent experiments. See Figure 1D legend for details. Also see Supplemental Movie S6.
To gain more insight into this, we generated PLB-985 cells exogenously expressing PKCβII-Venus. As negative and positive controls, we constructed PLB-985 cells exogenously expressing Venus or PKCα-Venus. As expected, compared with Venus cells, higher basal PKC activity is observed in both PKCα-Venus– and PKCβII-Venus–expressing cells, suggesting that both enzymes are overexpressed and functional (Figure 2B). Of interest, after fMLP stimulation, the fold PKC activation is much less in PKCβII-Venus cells (Figure 2B and Supplemental Figure S2B), which is consistent with the lower fold increase in cAMP levels measured in PKCβII-Venus cells (Figure 2C and Supplemental Figure S2C). We reason that in PKCβII-Venus cells, the upstream regulator mTORC2 and the downstream effector AC9 are limited and cannot fully sustain the overexpressed PKCβII-Venus levels present in the PKCβII-Venus cells.
Next we examined the chemotactic ability of two cell lines. Using the EZ-TAXIScan assay, we found that, similar to Venus cells, PKCα-Venus cells are able to sense the chemoattractant gradient and migrate efficiently toward fMLP or LTB4. In contrast, the PKCβII-Venus cells show significant defects (Figure 2D, unpublished data, and Supplemental Movie S6). During the first 5 min, similar to Venus and PKCα-Venus cells, PKCβII-Venus cells quickly adhere, polarize, and migrate toward the chemoattractant. After this initial time, cells in the front line consistently extend their pseudopods, but they do not efficiently retract their tail, and simply wiggle around. Quantification by cell tracking reveals that the three cell lines exhibit similar velocity and directionality during the first 5 min of chemotaxis. However, compared with Venus and PKCα-Venus cells, the speed and directionality of PKCβII-Venus cells are significantly decreased during the following 15 min of directed migration (Supplemental Figure S2, D and E). Taken together, these findings show that PKCβII activity must be finely tuned to properly transduce chemoattractant signals to effectors during neutrophil chemotaxis.
PKCβII rapidly and transiently translocates to the plasma membrane in response to fMLP stimulation
To further investigate the distinct role of PKCα and PKCβII during neutrophil chemotaxis, we studied the subcellular distribution of PKCα-Venus and PKCβII-Venus. Before chemoattractant addition, we found that both PKCα-Venus and PKCβII-Venus are primarily distributed in the cytoplasm. However, upon uniform stimulation with 1 μM fMLP, PKCβII-Venus rapidly and transiently translocates to the plasma membrane, peaking ∼10 s after agonist addition and returning to the cytoplasm after ∼30 s (Figure 3A and Supplemental Movie S8). This transient translocation is also observed in membranes collected from lysed cells, in which, after fMLP stimulation, a significant fraction of PKCβII-Venus becomes associated with membrane fractions, with kinetics similar to the ones observed using fluorescence microscopy (Figure 3B). In contrast, under identical conditions, we found that PKCα-Venus remains in the cytoplasm (Figure 3, A and B, and Supplemental Movie S7).
FIGURE 3:

PKCβII rapidly and transiently translocates to the plasma membrane in response to fMLP stimulation. (A) Cellular localization of PKCα and PKCβII after uniform fMLP stimulation. Fluorescence images from time-lapse recordings of differentiated PKCα Venus and PKCβII Venus cells before and after the addition of 1 μM fMLP. Bar, 10 μm. Also see Supplemental Movies S7 and S8. (B) Cellular localization of PKCβII after uniform fMLP addition. Differentiated Venus, PKCα Venus, and PKCβII Venus cells were uniformly stimulated with 1 μM fMLP. At specific time points, membrane and cytosol fractions were isolated and subjected to Western blot analysis using an antibody against GFP. Top, Representative blot of three independent experiments. Bottom, quantification of three experiments presented as the amount of GFP relative to that of unstimulated cells (mean ± SD). *p < 0.01 and #p < 0.05 compared with the fMLP-stimulated group. (C) Structure comparison between PKCα and PKCβII. The domain composition of PKCα and PKCβII showing the LCR specifically localized at the N-terminal of PKCβII. Also shown are the three priming phosphorylation sites in the kinase domain and C-terminal. (D) Cellular localization of PKCβIIΔLCR mutant after uniform fMLP addition. Fluorescence images from time-lapse recordings of PKCβIIΔLCP Venus cells before and after addition of 1 μM fMLP. Bar, 10 μm. (E) LCR does not determine the subcellular distribution of PKCβII. Differentiated PKCβII Venus and PKCβIIΔLCP Venus cells were uniformly stimulated with 1 μM fMLP. At specific time points, membrane and cytosol fractions were isolated and subjected to Western blot analysis using an antibody against GFP. Top, representative blot of three independent experiments. Bottom, quantification of three experiments presented as the amount of PKCβII Venus after fMLP stimulation relative to that of unstimulated cells (mean ± SD).
The overall domain architecture of cPKC is highly conserved, harboring a N-terminal regulatory domain that contains a pseudosubstrate motif, tandem C1 and C2 domains, and a C-terminal catalytic domain that contains regulatory phosphorylation sites (A-loop, HM, and TM; Newton, 2003, 2010). However, using Simple Modular Architecture Research Tool analysis, we identified a low-complexity region (LCR) that is specifically present at the N-terminal of PKCβII (Figure 3C). LCRs are short amino acid sequences that are believed to mediate protein–protein interactions (Coletta et al., 2010). Nevertheless, deletion of LCR from PKCβII did not affect the fMLP-induced membrane association of PKCβII (Figure 3, D and E). Together these findings show that PKCβII specifically undergoes a dynamic and reversible redistribution between the cytosol and the plasma membrane upon chemoattractant stimulation.
fMLP-dependent translocation of PKCβII depends on mTORC2 and is required for cAMP production
We next assessed the behavior of endogenous PKCα and PKCβII in primary human blood neutrophils. Consistent with our observations in overexpressing cell lines, we measured robust translocation of PKCβII to membranes collected from lysed primary neutrophils treated with fMLP (Figure 4A). As expected, under identical conditions, endogenous PKCα did not associate with the membrane fraction (Supplemental Figure S3A). Intriguingly, we also determined that the transient cytosol-to-membrane translocation of PKCβII depends on its catalytic activity, as treatment with CGP53353 or GO6976 completely inhibits PKCβII's redistribution (Figure 4A and Supplemental Figure S3A). There have been reports that cPKCs autophosphorylate through an intramolecular reaction at the HM (Behn-Krappa and Newton, 1999), and some have suggested a requirement for autophosphorylation events to regulate the membrane trafficking of cPKCs (Feng et al., 2000). Perhaps this autophosphorylation is important for the chemoattractant-mediated translocation of PKCβII. Although an intact actin cytoskeleton has been shown to be important for membrane translocation of PKCβII in astrocytes (Pascale et al., 2004), we found that robust translocation of PKCβII to neutrophil membranes is unaffected when actin polymerization is blocked by latrunculin A treatment (Supplemental Figure S3B). Thus translocation of PKCβII to the plasma membrane does not require reorganization of the actin cytoskeleton in neutrophils.
FIGURE 4:

The fMLP-dependent translocation of PKCβII depends on mTORC2 and is required for cAMP production. (A) PKCβII activity is required for its cytosol-to-membrane translocation. Human blood primary neutrophils were treated with or without 5 μM CGP53353 for 30 min. Cells were uniformly stimulated with 1 μM fMLP. At specific time points, membrane and cytosol fractions were isolated and subjected to Western blot analysis using PKCβII and GAPDH antibodies. Top, representative blot of three independent experiments. Bottom, quantification of three experiments presented as the amount of membrane-associated PKCβII after fMLP stimulation relative to that of unstimulated cells (mean ± SD). *p < 0.01 compared with dimethyl sulfoxide–treated cells. (B) Cytosol-to-membrane translocation of PKCβII depends on mTORC2. Differentiated NS shRNA and Rictor shRNA cells were uniformly stimulated with 1 μM fMLP. At specific time points, membrane and cytosol fractions were isolated and subjected to Western blot analysis using PKCβII and GAPDH antibodies. Top, representative blot of three independent experiments. Bottom, quantification of three experiments presented as the amount of membrane-associated PKCβII after fMLP stimulation relative to that of unstimulated cells (mean ± SD). *p < 0.01 compared with NS shRNA cells. (C) Phosphorylation at the TM site is required for the dynamic translocation of PKCβII. Top, fluorescence images from time-lapse recordings of differentiated PKCβII HM mutant Venus, PKCβII TM mutant Venus, and PKCβII HM+TM mutant Venus cells before and 10 s after addition of 1 μM fMLP. Bar, 10 μm. Bottom, differentiated PKCβII Venus, PKCβII HM mutant Venus, PKCβII TM mutant Venus, and PKCβII HM+TM mutant Venus cells were uniformly stimulated with 1 μM fMLP. At specific time points, membrane and cytosol fractions were isolated and subjected to Western blot analysis using PKCβII and GAPDH antibodies. A representative blot of three independent experiments is shown. (D) Quantification of three independent experiments of C. The amount of membrane-associated PKCβII after fMLP stimulation relative to that of unstimulated cells (mean ± SD). *p < 0.01 compared with PKCβII Venus cells. (E) Cytosol–membrane trafficking of PKCβII is required for chemoattractant-induced cAMP production. Differentiated cells were stimulated with 1 μM fMLP, and intracellular cAMP levels were measured at indicated time points. Average ± SD values are presented from four independent experiments. *p < 0.01 compared with the fMLP-stimulated Venus group.
As expected, we found that inhibition of DAG and inositol 1,4,5-trisphosphate production by U73122 or chelation of intracellular calcium by ethylene glycol tetraacetic acid (EGTA) strongly inhibits fMLP-induced PKCβII membrane translocation (Supplemental Figure S3C). However, inhibition of PI3K activity by LY294002 did not affect the cytosol-to-membrane translocation of PKCβII (Supplemental Figure S3D), suggesting that PI3K is not involved in the redistribution of PKCβII in neutrophils. Because mTORC2 is required for fMLP-induced PKCβII activation (Figure 2A), we next asked whether mTORC2 is involved in the translocation of PKCβII. We found that KD of Rictor leads to dramatic inhibition of PKCβII translocation to membrane fractions after fMLP stimulation (Figure 4B). Thus the cytosol-to-membrane translocation of PKCβII depends on mTORC2.
mTORC2 is required for phosphorylation of cPKCs on both HM and TM sites, and these two phosphorylation sites are closely linked to the activity and maturation of the enzymes in fibroblasts (Facchinetti et al., 2008; Ikenoue et al., 2008). To assess the role of mTORC2-dependent PKCβII phosphorylation in the membrane translocation of PKCβII, we constructed three PKCβII-Venus mutants—HM, TM, and HM+TM mutants—and expressed them in PLB-985 cells. The HM-site mutation was engineered by substituting the S660 residue to an alanine residue. Because the adjacent S/T sites can compensate for the absence of phosphorylation at the TM (T641) site, for the TM mutant we constructed a triple mutant T634A/T641A/S654A. The TM+HM mutant harbored the four mutations (T634A/T641A/S654A/T660A). All three mutants were expressed at levels comparable to that of WT PKCβII-Venus (Supplemental Figure S3E). On fMLP stimulation, we found that the HM mutant is rapidly redistributed from the cytosol to the membrane fraction, whereas the TM and HM+TM mutants remain in the cytosolic fraction (Figure 4, C and D). These results indicate that phosphorylation at the TM site is specifically required for dynamic fMLP-dependent redistribution of PKCβII to the plasma membrane, although we noticed some membrane association in both TM and HM+TM mutants under basal conditions. We next examined whether redistribution of PKCβII to the plasma membrane is required for AC9 activation. We found that none of the mutant cell lines exhibits higher basal intracellular cAMP levels than WT PKCβII-expressing cells (Figure 4E). Furthermore, after fMLP stimulation, only a slight increase in cAMP levels is detected in the HM mutant, and fMLP-induced cAMP production is absent in the TM and HM+TM mutants (Figure 4E). Thus, whereas PKCβII phosphorylation on the TM site is specifically required for plasma membrane redistribution, phosphorylation on both HM and TM sites is essential for transient activation of AC9 by chemoattractants.
fMLP stimulation induces phosphorylation of PKCβII on its TM and HM sites in mTORC2-dependent manner
Using phosphospecific antibodies that specifically recognize phosphorylated S660 on the HM site of PKCβII or the phosphorylated S657 on the HM site of PKCα, we show that addition of fMLP specifically induces a rapid and transient phosphorylation of the HM site of PKCβII in primary neutrophils (Figure 5A and Supplemental Figure S4A). In addition, whereas the level of HM phosphorylation of PKCα is not significantly changed in Rictor KD cells, we found that the increase in PKCβII HM phosphorylation is absent in fMLP-stimulated Rictor shRNA cells (Figure 5B and Supplemental Figure S4B). Because the phosphospecific antibody to the TM site recognizes both PKCα (T638) and PKCβII (T641), we used PKCα shRNA cells to specifically study the effect of fMLP addition on the TM site of PKCβII. Similar to the HM site, we found that fMLP-induced rapid TM phosphorylation on PKCβII (Supplemental Figure S4C). In addition, we discovered that upon fMLP stimulation, membrane-associated PKCβII is phosphorylated on its HM and TM sites (Figure 5C).
FIGURE 5:

fMLP stimulation induces phosphorylation of PKCβII on its TM and HM sites in an mTORC2-dependent manner. (A) Chemoattractant-induced HM phosphorylation of PKCβII. Human blood primary neutrophils were uniformly stimulated with 1 μM fMLP. At specific time points, cells lysates were subjected to Western blot analysis using P-PKCα (S657), PKCα, P-PKCβII(S660), and PKCβII antibodies. Representative blot of three independent experiments. (B) HM phosphorylation of PKCβII depends on mTORC2. Differentiated NS shRNA and Rictor shRNA cells were stimulated with 1 μM fMLP. At specific time points, cells were lysed and subjected to Western blot analysis using P-PKCα (S657), PKC-α, P-PKCβII (S660), and PKCβII antibodies. Representative blot of three independent experiments. (C) Membrane-associated PKCβII is phosphorylated at both TM and HM sites. Human blood primary neutrophils were uniformly stimulated with 1 μM fMLP. At specific time points, membrane and cytosol fractions were isolated and subjected to Western blot analysis using P-PKCα/βII (S638/634), P-PKCβII (S660), and GAPDH antibodies. Representative blot of three independent experiments. (D) Chemoattractant addition induces rapid PKC substrate phosphorylation. Human blood primary neutrophils were uniformly stimulated with 1 μM fMLP. At specific time points, cell were lysed and subjected to Western blot using an antibody against P-PKC substrate. Representative blot of three independent experiments. (E) Chemoattractant-induced PKC substrate phosphorylation depends on PKCβII and mTORC2. Differentiated NS shRNA, PKCα shRNA, PKCβII shRNA, and Rictor shRNA cells were uniformly stimulated with 1 μM fMLP. At specific time points, cell were lysed and subjected to Western blot analysis using an antibody against P-PKC substrate. Representative blot of three independent experiments. (F) AC9 interacts with PKCβII. Differentiated Venus and AC9 Venus cells were stimulated with 1 μM fMLP for 20 s. Cell lysates were immunoprecipitated with PKCβII antibody, and coimmunoprecipitated AC9 was determined by immunoblotting using a GFP antibody. Representative blot of three independent experiments. (G) AC9 is a PKC downstream substrate. Differentiated AC9 Venus cells were stimulated with 1 μM fMLP. At specific time points, cells were lysed. AC9 was immunoprecipitated using GFP antibody and immunoblotted using P-PKC substrate antibody. Representative blot of five independent experiments.
We next tested whether the rapid and transient fMLP-mediated phosphorylation and activation of PKCβII can lead to the phosphorylation of PKC substrates. Using an antibody that recognizes phosphorylated PKC substrates, we found that fMLP treatment causes a rapid and transient increase in phosphorylation of PKC substrates in primary neutrophils (Figure 5D), with kinetics that match fMLP-mediated PKCβII translocation and HM/TM phosphorylation. As expected, fMLP addition also induced a rapid and transient phosphorylation of PKC substrates in NS shRNA cells, as well as in PKCα shRNA cells (Figure 5E). However, the response was significantly decreased in PKCβII shRNA, as well as in Rictor shRNA cells and PKCβII phosphorylation mutants (Figure 5E). Together these findings show that fMLP-induced rapid phosphorylation of PKC substrates depends on mTORC2-mediated phosphorylation of HM and TM sites on PKCβII in neutrophils.
We showed that chemoattractant-induced PKCβII HM+TM phosphorylation and translocation to the plasma membrane is required for activation of AC9. These findings suggest possible interaction between PKCβII and the transmembrane protein AC9. To test this, we stimulated AC9-Venus cells (Liu et al., 2010) with fMLP and pulled down PKCβII-interacting proteins by coimmunoprecipitation. We observed that AC9-Venus is coimmunoprecipitated with PKCβII, whereas Venus is not, suggesting that PKCβII can interact with AC9 (Figure 5F). We next examined whether AC9 is a substrate of PKCβII. We treated AC9-Venus cells with fMLP and, at specific time points, immunoprecipitated AC9-Venus and probed with a phospho-PKC substrate antibody. We found that AC9-Venus is recognized by the phospho-PKC substrate antibody, with kinetics that matches PKCβII activity and translocation after fMLP stimulation (Figure 5G). These results suggest that, after redistribution to the plasma membrane, active PKCβII can rapidly interact and phosphorylate AC9. On the basis of these results, we suggest that mTORC2-dependent, PKCβII-mediated phosphorylation of AC9 is required for chemotactic signal transduction and neutrophil chemotaxis.
DISCUSSION
The mechanisms cells use to regulate front protrusions/back retractions during migration dramatically vary depending on the cell type (i.e., epithelial, mesenchymal, and amoeboid) and the nature of the input stimulus (i.e., receptor tyrosine kinase or GPCRs) (Liu and Parent, 2011). Although phosphorylation of PKCα (Sarbassov et al., 2004), focal adhesion localization of paxillin (Jacinto et al., 2004; Sarbassov et al., 2004; Guertin et al., 2006), and activation of RhoA and Rac1 (Hernandez-Negrete et al., 2007) have been implicated as downstream targets of mTORC2, the precise mechanisms by which mTORC2 regulates cell migration remain unclear. In cancer cells, activation of tyrosine kinase receptors such as insulin-like growth factor 1 receptor and epidermal growth factor leads to selective activation of Akt by mTORC2, which further regulates cell migration, invasion, and tumor metastasis (Gulati et al., 2009; Kim et al., 2011). In response to GPCR activation, mTORC2 appears to preferentially activate PKCs to control cell migration and chemotaxis (Liu et al., 2010; Gan et al., 2012). In chemotaxing neutrophils, we found that the activation of mTORC2 by Gαi-coupled receptors selectively enhances PKCβII activity, and a significant attenuation of chemotaxis is observed in PKCβII-deficient neutrophils but not Akt-inhibited cells (Liu et al., 2010). Consistently, in fibroblasts, GαQL-stimulated mTORC2 controls cell migration through PKCδ, although the events downstream of PKCδ remain to be determined (Gan et al., 2012). Thus mTORC2 possibly signals to distinct effectors in response to different upstream signals to regulate cell migration. In neutrophils, we show that mTORC2 is required for the cytoplasm-to-membrane translocation and activation of PKCβII. Active and membrane-associated PKCβII can further regulate neutrophil chemotaxis through the activation of AC9, which contributes to tail retraction through a PKA/RhoA/ROCK/MyoII pathway. Of interest, in the social ameba Dictyostelium discoideum, in which chemotaxis is mediated by GPCRs and no PKC homologue is expressed, TORC2-mediated chemotaxis has been shown to depend on Akt activation (Lee et al., 1999, 2005; Kamimura et al., 2008; Cai et al., 2010; Charest et al., 2010).
In mammalian cells, PKCα and PKCβII share similar structures, and phosphorylation of HM and TM sites on both enzymes is dependent on mTORC2 (Facchinetti et al., 2008; Ikenoue et al., 2008). Neutrophils express both PKC isoforms. Yet chemoattractants specifically activate PKCβII in an mTORC2-dependent manner, and only cells lacking PKCβII exhibit chemotaxis defects. How can these two similar enzymes differentially respond to the same chemotactic stimulus? Perhaps the cellular distribution of PKCα and PKCβII determines how each enzyme is regulated through mTORC2. Although both PKCα and PKCβII are predominantly distributed in the cytoplasm in unstimulated neutrophils, only PKCβII shows a rapid and transient translocation to the plasma membrane and phosphorylation on both its TM and HM sites after fMLP stimulation. Indeed, we measured only low, basal constitutive phosphorylation of the HM site on PKCα, which is most probably secondary to low residual levels of Rictor in our shRNA cells. The differential regulation of PKCα and PKCβII has also been reported in HL60 cells in response to proliferative signals (Hocevar and Fields, 1991; Murray et al., 1994), as well as in rat basophilic leukemia cells (Spudich et al., 1992) and in rat hepatocytes (Rogue et al., 1990), in which, under the same stimulation, PKCα and PKCβII exhibit distinct activation profiles, substrate specificities, and sites of activation (Newton, 2010; Rosse et al., 2010). The molecular mechanism underlying the selective translocation, phosphorylation, and activation of PKCβII in neutrophils is unknown. We do know that the differential distribution of PKCα and PKCβII does not result from structural differences between the proteins, as PKCα and PKCβII harbor similar regulatory and catalytic domains (Newton, 2010; Rosse et al., 2010). Moreover, we show that the deletion of the LCR domain from PKCβII does not alter its cellular distribution. The full activation of PKCβII requires inputs from mTORC2, calcium, and DAG. We show that in response to chemoattractants, translocation of PKCβII to the plasma membrane requires mTORC2-dependent TM phosphorylation as well as calcium and DAG signals. In addition, we show that phosphorylation of both TM and HM sites on PKCβII is essential to mediate the transient activation of AC9 by chemoattractants. We propose that the binding of chemoattractants to their cognate receptor rapidly activates mTORC2, which specifically phosphorylates the TM and HM sites of PKCβII. This is followed by PLC activation and release of calcium and DAG, which lead to full activation of PKCβII and downstream regulation of AC9. We envision that in neutrophils, chemotactic signaling is restricted to PKCβII, thereby providing a level of specificity for downstream effectors.
Of interest, we also found that in neutrophils, the level of expression of both PKCα and PKCβII is not altered in cells with reduced levels of mTORC2 signaling, which is in contrast to what is observed in fibroblasts (Facchinetti et al., 2008; Ikenoue et al., 2008). We reason that either the remaining low level of expression of Rictor in our shRNA cells is enough to maintain the expression of the PKC isoforms or the regulation of PKC stability is different in fast-moving neutrophils, in which the availability of effectors needs to be maintained. It was reported that the molecular chaperone HSP70 binds dephosphorylated TM to promote rephosphorylation of PKCβII and sustain the lifetime of the enzyme (Gao and Newton, 2002). It is possible that this mechanism is up-regulated in neutrophils to favor the maintenance of signaling-competent enzymes.
Adenylyl cyclases reside on the plasma membrane and are composed of two sets of six transmembrane domains separated by cytosolic catalytic loops (Tesmer and Sprang, 1998; Hurley, 1999). The chemoattractant-mediated cytosol-to-membrane redistribution of PKCβII therefore provides interaction possibilities for PKCβII and AC9. After receptor stimulation, chemoattractant-mediated activation of AC9 peaks after ∼30 s, which is just slightly later than the peak PKCβII membrane translocation. Hence, rapid membrane recruitment of PKCβII represents the most efficient way to mediate activation of AC9. Moreover, since there is almost no lag between the peak PKCβII translocation event and maximal AC9 activation, we speculate that there should be no additional steps between these two events. Indeed, we found that PKCβII and AC9 form a complex upon chemoattractant stimulation. In addition to free metal ions (magnesium, calcium, and manganese) and G-protein subunits (Gsα, Giα, and Gβγ) (Hurley, 1999), the activity of mammalian adenylyl cyclases is regulated by protein kinases. Phosphorylation of AC1, AC3, and AC6 by CaM kinase or PKA inhibits the activation of these enzymes (Wei et al., 1996; Chen et al., 1997). Conversely, the activation of ACs by PKC-mediated phosphorylation has been reported for various ACs subtypes (Choi et al., 1993; Jacobowitz et al., 1993; Jacobowitz and Iyengar, 1994; Yoshimura and Cooper, 1993; Bol et al., 1997a, b; Shen et al., 2012). We now show that fMLP stimulation increases AC9 phosphorylation on putative PKC phosphorylation sites. Of interest, although chemoattractant addition leads to the interaction of PKCβII with AC9 on the plasma membrane, we previously showed that cAMP is excluded from extending pseudopods and enriched at the back of chemotaxing neutrophils. To maintain localized cAMP signals, we propose that a spatially activated pool of phosphodiesterase is present in pseudopods (Liu et al., 2010).
Chemotaxis is a complex process that involves various interrelated and coordinated signal pathways. In neutrophils, mTORC2 acts as a central processor that integrates extracellular inputs and transduces them to different downstream effectors. However, how signals from activated chemoattractant receptors are transmitted to mTORC2 and how mTORC2 processes particular signals to certain effector elements are unclear. The present study establishes that PKCβII acts as a key mTORC2 effector downstream of chemoattractant receptors to regulate cAMP production, MyoII phosphorylation, tail retraction, and chemotaxis in neutrophils. This is an important finding, as it sheds light on the mechanism by which mTORC2 signaling to PKCs mediates cytoskeletal reorganization in an actin-independent manner. Indeed, we previously established that Rictor KD independently regulates pseudopod extension/actin assembly and back retraction/MyoII phosphorylation during neutrophil chemotaxis (Liu et al., 2010). In Dictyostelium, phosphatidylinositol (3,4,5)-triphosphate (PIP3)–independent Ras signaling has been suggested to control the spatiotemporal activation of TORC2 (Kamimura et al., 2008; Cai et al., 2010; Charest et al., 2010). In mammalian cells, insulin-PI3K–stimulated PIP3 increase and ribosome interaction have been reported to be involved in the activation of mTORC2 (Gan et al., 2011; Zinzalla et al., 2011). Future studies that decipher the function of these distinct signals in mTORC2 activation and neutrophil chemotaxis will provide further insight into how chemotactic signals are transduced during cell migration.
MATERIALS AND METHODS
Reagents
fMLP and GO6976 were purchased from Sigma-Aldrich (St. Louis, MO). CGP 53353 was purchased from Tocris Bioscience (Minneapolis, MN). Antibodies were purchased as follows: α-GFP antibody, Covance (Berkeley, CA); α-PKCα, α-PKCβII, and α-RhoA antibodies, Santa Cruz Biotechnology (Dallas, TX); α-P(Ser) PKC substrate, α-P-PKCβII(S660), α-P-PKCα/PKCβII(T638/641), and α-P-myosin light chain 2 antibodies, Cell Signaling Technology (Danvers, MA); α-P-PKCα(S657) antibody, Millipore (Billerica, MA); α–glyceraldehyde-3-phosphate dehydrogenase (GAPDH) antibody, Sigma-Aldrich; and α-CD11b APC antibody, BD Biosciences (San Jose, CA).
Cell lines
HEK293T cells (American Type Culture Collection, Manassas, VA) and Phoenix cells (Orbigen, San Diego, CA) were maintained on 100-mm plates in DMEM containing 10% fetal bovine serum (FBS), 25 mM 4-(2-hydroxyethyl)-1-piperazineethanesulfonic acid (HEPES), 100 U/ml penicillin, and 100 mg/ml streptomycin at 37°C and 5% CO2. For virus packaging, 80% confluent cells were used for transient transfection with Lipofectamine methods. PLB-985 cells were maintained in an undifferentiated state in RPMI 1640 medium containing 10% FBS, 25 mM HEPES, 100 U/ml penicillin, and 100 mg/ml streptomycin at 37°C and 5% CO2. Cells were differentiated at a density of 4.5 × 10⁵ cells/ml for 6 d in culture medium containing 1.3% dimethyl sulfoxide, and the status of differentiation was monitored by CD11b staining.
Isolation of neutrophils from human blood
Human neutrophil polymorphonuclear leukocytes were isolated from the venous blood of healthy adults using standard dextran sedimentation and gradient separation on Histopaque 1077 (Sigma-Aldrich) as previously described (Liu et al., 2010, 2012).
Plasmid constructs and transfection of PLB-985 cells
As previously described (Liu et al., 2012), a retroviral approach was used to create stable populations of PLB-985 cells expressing Venus, PKCαVenus, PKCβIIVenus, and AC9Venus. The complete coding sequences of PKCα and PKCβII gene were amplified from human primary blood neutrophils and then subcloned into pMSCVneo retroviral vectors. The S660A, T643A/T641A/S654A, T634A/T641A/S654A/S660A, and LCR deletion mutants of PKCβII were made by PCR using WT PKCβII as a template. The primers used for the mutants are as follows:
PKCβII S660A (forward, GAATTCGAAGGATTTGCCTTTGTTAACTCTGA;
reverse, TCAGAGTTAACAAAGGCAAATCCTTCGAATTC)
PKCβII T634A/T641A/S654A (forward, CTAGCACCTCCCGACCAGGAAGTCATCAGGAATATTGACCAAGCAGAATTCGAAGGA;
reverse, CTGGTCGGGAGGTGCTAGGACTGGTGGATGGCGGGCGAAAAATCG)
PKCβII LCR del (forward, CATGGCTGACACCGTGCGCTTCGCCCGCAAAGGCGCCCTCCGGC;
reverse, AAGCGCACGGTGTCAGCCATGGTGGCCTCGCTCGAGGTTAACGAATTCCGGCGC)
The DNA sequences of the constructs were confirmed by DNA sequencing. The retroviral plasmids were transfected into packaging Phoenix cell lines using Lipofectamine. Transiently produced viruses were harvested after 48 or 72 h. PLB-985 cells were infected with the virus in fresh RPMI 1640 culture medium containing 15 µg/ml Polybrene and incubated for an additional 48 h. Cells stably expressing the genes were selected in medium containing 0.6 mg/ml G-418. Stable clonal populations were generated after 14–21 d and maintained in the selection medium.
Stable PKCα KD and PKCβII KD cell lines were generated using RNA interference technique. Undifferentiated PLB-985 cells were infected with pGIPZ lentiviruses (Open Biosystems, Huntsville, AL) carrying PKCα or PKCβII hairpin sequence and selected in media containing 0.6 μg/ml puromycin for 14–21 d. The hairpin sequences are as follows:
PKCα hairpin sequence 1, TGCTGTTGACAGTGAGCGACCACATCCAGGCAAGAACTAATAGTGAAGCCACAGATGTATTAGTTCTTGCCTGGATGTGGGTGCCTACTGCCTCGGA
PKCα hairpin sequence 2, TGCTGTTGACAGTGAGCGCCCGACGACTGTCTGTAGAAATTAGTGAAGCCACAGATGTAATTTCTACAGACAGTCGTCGGTTGCCTACTGCCTCGGA
PKCα hairpin sequence 3,
TGCTGTTGACAGTGAGCGCCGGATTGTTCTTTCTTCATAATAGTGAAGCCACAGATGTATTATGAAGAAAGAACAATCCGATGCCTACTGCCTCGGA
PKCβII hairpin sequence 1, TGCTGTTGACAGTGAGCGCGGTCATGCTTTCAGAACGAAATAGTGAAGCCACAGATGTATTTCGTTCTGAAAGCATGACCTTGCCTACTGCCTCGGA
PKCβII hairpin sequence 2, TGCTGTTGACAGTGAGCGACTGCATGATGAATGTGCACAATAGTGAAGCCACAGATGTATTGTGCACATTCATCATGCAGGTGCCTACTGCCTCGGA
PKCβII hairpin sequence 3,
TGCTGTTGACAGTGAGCGACTGAGTGGAATGAGACATTTATAGTGAAGCCACAGATGTATAAATGTCTCATTCCACTCAGGTGCCTACTGCCTCGGA
PKCβII hairpin sequence 4,
TGCTGTTGACAGTGAGCGACCGCAGCAAACACAAGTTTAATAGTGAAGCCACAGATGTATTAAACTTGTGTTTGCTGCGGGTGCCTACTGCCTCGGA
PKCβII hairpin sequence 5,
TGCTGTTGACAGTGAGCGACCTGTCAGATCCCTACGTAAATAGTGAAGCCACAGATGTATTTACGTAGGGATCTGACAGGCTGCCTACTGCCTCGGA
Chemotaxis assay
Micropipette chemotaxis assay.
Differentiated cells were plated on chambered cover slides coated with 0.2% gelatin, and a chemotactic gradient was generated using an Eppendorf microinjector with Fentotips (Eppendorf, Germany) loaded with 1 μM fMLP.
EZ-TAXIScan chemotaxis assay.
The EZ-Taxiscan chamber (Effector Cell Institute, Tokyo, Japan) was assembled as described by the manufacturer. Cell migration was recorded every 15 s for 30 min at 37°C in a humidified environmental chamber. Coverslips and chips used in the chamber were coated with 1 μg/ml fibronectin or 1% bovine serum albumin at room temperature for 1 h. All glass coverslips were ultrasonicated and washed before use. Cell migration analysis was conducted using MATLAB software as previously described (Liu et al., 2010).
RhoA-GTP pull-down assay
Activation of RhoA was determined as previous described (Liu et al., 2012). Differentiated PLB-985 cells were washed twice with modified Hank's balanced salt solution (mHBSS), added to a 12-well chamber, and allowed to adhere for 10 min at 37°C. After stimulation with or without fMLP (1 µM) for the indicated times, cells were immediately lysed in ice-cold lysis buffer and maintained on ice for 20 min. After centrifugation at 14,000 rpm for 10 min, the supernatant fractions were incubated with 0.1 ml of Rhotekin RBD-agarose beads (which bind RhoA-GTP) for 1 h at 4°C, followed by three washes with Tris buffer (50 mM) containing 1% Triton X-100, 150 mM NaCl, 10 mM MgCl2, 1 mM diisopropyl fluorophosphate, 0.1 mM phenylmethylsulfonyl fluoride, and Protease Inhibitor cocktail. Proteins bound to the beads were eluted in 2× Laemmli sample buffer and subjected to Western blot analysis by using a mouse monoclonal antibody specific for RhoA.
cAMP measurement
Cells were differentiated for 5 d, starved for 24 h in reduced serum (0.2% FBS) differentiation medium, and washed three times in ice-cold mHBSS. A total of 1 × 10⁶ cells were lysed before and after chemoattractant stimulation. cAMP concentration was measured using the Cell Biolabs (San Diego, CA) chemiluminescent enzyme-linked immunosorbent assay kit.
Isolation of cell membrane fraction
The membrane fraction of cell was isolated as previously described (Liu et al., 2012). Briefly, differentiated PLB-985 cells or human blood primary neutrophils were uniformly stimulated with 1 μM fMLP. Aliquots of cells were taken and rapidly lysed through a 5-μm membrane at the indicated time points. The membrane fraction was isolated by centrifugation at 13,000 rpm for 20 s. The supernatant was transferred into a new tube, and the pellet was resuspended in Laemmli sample buffer. The elution was subjected to SDS–PAGE and Western blot analysis with specific antibodies.
PKC activity assay
The PKC activity was measured using the CycLexPKC Super Family Kinase Assay Kit (MBL International, Woburn, MA) according to the manufacturer's protocol. Briefly, 1 × 10⁶ differentiated cells were lysed in ice-cold extraction buffer before and after chemoattractant stimulation. After sonication for 1 min on ice, the lysates were centrifuged at 100,000 × g for 1 h at 4°C and then 10 μl of clear cell lysates was mixed with 90 μl of kinase reaction buffer and incubated at 30°C for 20 min with gentle shaking. The reaction was stopped by the addition of 150 μl of 0.1 M EDTA. After subsequent incubations of phosphospecific substrate antibody, horseradish peroxidase–conjugated anti-mouse immunoglobulin G, and substrate reagent, the reaction was stopped by adding stop solution, and the absorbance at 450 nm was measured with the microplate reader.
Statistical analysis
Data were tested and analyzed by one-way analysis of variance and Student's t test. Statistical evaluations were performed using Prism programs (GraphPad Software La Jolla, CA). Differences with p < 0.05 were considered statistically significant.
Supplementary Material
Acknowledgments
We thank Amy Melpolder and the National Institutes of Health Blood Bank for providing human blood from healthy volunteers. We also thank the Parent laboratory members for excellent discussions and suggestions. This research was supported by the Intramural Research Program of the Center for Cancer Research, National Cancer Institute, National Institutes of Health.
Abbreviations used:
- AC9
adenylyl cyclase 9
- GPCR
G protein–coupled receptor
- HM
hydrophobic motif
- mTORC2
mammalian target of rapamycin complex 2
- PKCα
protein kinase Cα
- PKCβII
protein kinase CβII
- TM
turn motif
Footnotes
This article was published online ahead of print in MBoC in Press (http://www.molbiolcell.org/cgi/doi/10.1091/mbc.E14-01-0037) on March 5, 2014.
REFERENCES
- Bagorda A, Mihaylov VA, Parent CA. Chemotaxis: moving forward and holding on to the past. Thromb Haemost. 2006;95:12–21. [PubMed] [Google Scholar]
- Balasubramanian N, Advani SH, Zingde SM. Protein kinase C isoforms in normal and leukemic neutrophils: altered levels in leukemic neutrophils and changes during myeloid maturation in chronic myeloid leukemia. Leuk Res. 2002;26:67–81. doi: 10.1016/s0145-2126(01)00098-4. [DOI] [PubMed] [Google Scholar]
- Behn-Krappa A, Newton AC. The hydrophobic phosphorylation motif of conventional protein kinase C is regulated by autophosphorylation. Curr Biol. 1999;9:728–737. doi: 10.1016/s0960-9822(99)80332-7. [DOI] [PubMed] [Google Scholar]
- Bol GF, Gros C, Hulster A, Bosel A, Pfeuffer T. Phorbol ester-induced sensitisation of adenylyl cyclase type II is related to phosphorylation of threonine 1057. Biochem Biophys Res Commun. 1997a;237:251–256. doi: 10.1006/bbrc.1997.7123. [DOI] [PubMed] [Google Scholar]
- Bol GF, Hulster A, Pfeuffer T. Adenylyl cyclase type II is stimulated by PKC via C-terminal phosphorylation. Biochim Biophys Acta. 1997b;1358:307–313. doi: 10.1016/s0167-4889(97)00073-6. [DOI] [PubMed] [Google Scholar]
- Cai H, Das S, Kamimura Y, Long Y, Parent CA, Devreotes PN. Ras-mediated activation of the TORC2-PKB pathway is critical for chemotaxis. J Cell Biol. 2010;190:233–245. doi: 10.1083/jcb.201001129. [DOI] [PMC free article] [PubMed] [Google Scholar]
- Charest PG, Shen Z, Lakoduk A, Sasaki AT, Briggs SP, Firtel RA. A Ras signaling complex controls the RasC-TORC2 pathway and directed cell migration. Dev Cell. 2010;18:737–749. doi: 10.1016/j.devcel.2010.03.017. [DOI] [PMC free article] [PubMed] [Google Scholar]
- Chen Y, Harry A, Li J, Smit MJ, Bai X, Magnusson R, Pieroni JP, Weng G, Iyengar R. Adenylyl cyclase 6 is selectively regulated by protein kinase A phosphorylation in a region involved in Gas stimulation. Proc Natl Acad Sci USA. 1997;94:14100–14104. doi: 10.1073/pnas.94.25.14100. [DOI] [PMC free article] [PubMed] [Google Scholar]
- Choi EJ, Wong ST, Dittman AH, Storm DR. Phorbol ester stimulation of the type I and type III adenylyl cyclases in whole cells. Biochemistry. 1993;32:1891–1894. doi: 10.1021/bi00059a001. [DOI] [PubMed] [Google Scholar]
- Coletta A, Pinney JW, Solis DY, Marsh J, Pettifer SR, Attwood TK. Low-complexity regions within protein sequences have position-dependent roles. BMC Syst Biol. 2010;4:43. doi: 10.1186/1752-0509-4-43. [DOI] [PMC free article] [PubMed] [Google Scholar]
- Cybulski N, Hall MN. TOR complex 2: a signaling pathway of its own. Trends Biochem Sci. 2009;34:620–627. doi: 10.1016/j.tibs.2009.09.004. [DOI] [PubMed] [Google Scholar]
- Facchinetti V, et al. The mammalian target of rapamycin complex 2 controls folding and stability of Akt and protein kinase C. EMBO J. 2008;27:1932–1943. doi: 10.1038/emboj.2008.120. [DOI] [PMC free article] [PubMed] [Google Scholar]
- Feng X, Becker KP, Stribling SD, Peters KG, Hannun YA. Regulation of receptor-mediated protein kinase C membrane trafficking by autophosphorylation. J Biol Chem. 2000;275:17024–17034. doi: 10.1074/jbc.275.22.17024. [DOI] [PubMed] [Google Scholar]
- Freeley M, Kelleher D, Long A. Regulation of protein kinase C function by phosphorylation on conserved and non-conserved sites. Cell Signal. 2011;23:753–762. doi: 10.1016/j.cellsig.2010.10.013. [DOI] [PubMed] [Google Scholar]
- Gan X, Wang J, Su B, Wu D. Evidence for direct activation of mTORC2 kinase activity by phosphatidylinositol 3,4,5-trisphosphate. J Biol Chem. 2011;286:10998–11002. doi: 10.1074/jbc.M110.195016. [DOI] [PMC free article] [PubMed] [Google Scholar]
- Gan X, Wang J, Wang C, Sommer E, Kozasa T, Srinivasula S, Alessi D, Offermanns S, Simon MI, Wu D. PRR5L degradation promotes mTORC2-mediated PKC-d phosphorylation and cell migration downstream of Ga12. Nat Cell Biol. 2012;14:686–696. doi: 10.1038/ncb2507. [DOI] [PMC free article] [PubMed] [Google Scholar]
- Gao T, Newton AC. The turn motif is a phosphorylation switch that regulates the binding of Hsp70 to protein kinase C. J Biol Chem. 2002;277:31585–31592. doi: 10.1074/jbc.M204335200. [DOI] [PubMed] [Google Scholar]
- Gay JC, Stitt ES. Chemotactic peptide enhancement of phorbol ester-induced protein kinase C activity in human neutrophils. J Leukoc Biol. 1990;47:49–59. doi: 10.1002/jlb.47.1.49. [DOI] [PubMed] [Google Scholar]
- Gould CM, Newton AC. The life and death of protein kinase C. Curr Drug Targets. 2008;9:614–625. doi: 10.2174/138945008785132411. [DOI] [PMC free article] [PubMed] [Google Scholar]
- Guertin DA, Stevens DM, Thoreen CC, Burds AA, Kalaany NY, Moffat J, Brown M, Fitzgerald KJ, Sabatini DM. Ablation in mice of the mTORC components raptor, rictor, or mLST8 reveals that mTORC2 is required for signaling to Akt-FOXO and PKCalpha, but not S6K1. Dev Cell. 2006;11:859–871. doi: 10.1016/j.devcel.2006.10.007. [DOI] [PubMed] [Google Scholar]
- Gulati N, Karsy M, Albert L, Murali R, Jhanwar-Uniyal M. Involvement of mTORC1 and mTORC2 in regulation of glioblastoma multiforme growth and motility. Int J Oncol. 2009;35:731–740. doi: 10.3892/ijo_00000386. [DOI] [PubMed] [Google Scholar]
- Hernandez-Negrete I, Carretero-Ortega J, Rosenfeldt H, Hernandez-Garcia R, Calderon-Salinas JV, Reyes-Cruz G, Gutkind JS, Vazquez-Prado J. P-Rex1 links mammalian target of rapamycin signaling to Rac activation and cell migration. J Biol Chem. 2007;282:23708–23715. doi: 10.1074/jbc.M703771200. [DOI] [PubMed] [Google Scholar]
- Hocevar BA, Fields AP. Selective translocation of beta II-protein kinase C to the nucleus of human promyelocytic (HL60) leukemia cells. J Biol Chem. 1991;266:28–33. [PubMed] [Google Scholar]
- Hurley JH. Structure, mechanism, and regulation of mammalian adenylyl cyclase. J Biol Chem. 1999;274:7599–7602. doi: 10.1074/jbc.274.12.7599. [DOI] [PubMed] [Google Scholar]
- Ikenoue T, Inoki K, Yang Q, Zhou X, Guan KL. Essential function of TORC2 in PKC and Akt turn motif phosphorylation, maturation and signalling. EMBO J. 2008;27:1919–1931. doi: 10.1038/emboj.2008.119. [DOI] [PMC free article] [PubMed] [Google Scholar]
- Jacinto E, Loewith R, Schmidt A, Lin S, Ruegg MA, Hall A, Hall MN. Mammalian TOR complex 2 controls the actin cytoskeleton and is rapamycin insensitive. Nat Cell Biol. 2004;6:1122–1128. doi: 10.1038/ncb1183. [DOI] [PubMed] [Google Scholar]
- Jacinto E, Lorberg A. TOR regulation of AGC kinases in yeast and mammals. Biochem J. 2008;410:19–37. doi: 10.1042/BJ20071518. [DOI] [PubMed] [Google Scholar]
- Jacobowitz O, Chen J, Premont RT, Iyengar R. Stimulation of specific types of Gs-stimulated adenylyl cyclases by phorbol ester treatment. J Biol Chem. 1993;268:3829–3832. [PubMed] [Google Scholar]
- Jacobowitz O, Iyengar R. Phorbol ester-induced stimulation and phosphorylation of adenylyl cyclase 2. Proc Natl Acad Sci USA. 1994;91:10630–10634. doi: 10.1073/pnas.91.22.10630. [DOI] [PMC free article] [PubMed] [Google Scholar]
- Jin T, Xu X, Hereld D. Chemotaxis, chemokine receptors and human disease. Cytokine. 2008;44:1–8. doi: 10.1016/j.cyto.2008.06.017. [DOI] [PMC free article] [PubMed] [Google Scholar]
- Kamimura Y, Xiong Y, Iglesias PA, Hoeller O, Bolourani P, Devreotes PN. PIP3-independent activation of TORC2 and PKB at the cell's leading edge mediates chemotaxis. Curr Biol. 2008;18:1034–1043. doi: 10.1016/j.cub.2008.06.068. [DOI] [PMC free article] [PubMed] [Google Scholar]
- Kim EK, et al. Selective activation of Akt1 by mammalian target of rapamycin complex 2 regulates cancer cell migration, invasion, and metastasis. Oncogene. 2011;30:2954–2963. doi: 10.1038/onc.2011.22. [DOI] [PubMed] [Google Scholar]
- Lee S, Comer FI, Sasaki A, McLeod IX, Duong Y, Okumura K, Yates JR 3rd, Parent CA, Firtel RA. TOR complex 2 integrates cell movement during chemotaxis and signal relay in Dictyostelium. Mol Biol Cell. 2005;16:4572–4583. doi: 10.1091/mbc.E05-04-0342. [DOI] [PMC free article] [PubMed] [Google Scholar]
- Lee S, Parent CA, Insall R, Firtel RA. A novel Ras-interacting protein required for chemotaxis and cyclic adenosine monophosphate signal relay in Dictyostelium. Mol Biol Cell. 1999;10:2829–2845. doi: 10.1091/mbc.10.9.2829. [DOI] [PMC free article] [PubMed] [Google Scholar]
- Le Good JA, Ziegler WH, Parekh DB, Alessi DR, Cohen P, Parker PJ. Protein kinase C isotypes controlled by phosphoinositide 3-kinase through the protein kinase PDK1. Science. 1998;281:2042–2045. doi: 10.1126/science.281.5385.2042. [DOI] [PubMed] [Google Scholar]
- Liu L, Aerbajinai W, Ahmed SM, Rodgers GP, Angers S, Parent CA. Radil controls neutrophil adhesion and motility through b2-integrin activation. Mol Biol Cell. 2012;23:4751–4765. doi: 10.1091/mbc.E12-05-0408. [DOI] [PMC free article] [PubMed] [Google Scholar]
- Liu L, Das S, Losert W, Parent CA. mTORC2 regulates neutrophil chemotaxis in a cAMP- and RhoA-dependent fashion. Dev Cell. 2010;19:845–857. doi: 10.1016/j.devcel.2010.11.004. [DOI] [PMC free article] [PubMed] [Google Scholar]
- Liu L, Parent CA. TOR kinase complexes and cell migration. J Cell Biol. 2011;194:815–824. doi: 10.1083/jcb.201102090. [DOI] [PMC free article] [PubMed] [Google Scholar]
- Majumdar S, Rossi MW, Fujiki T, Phillips WA, Disa S, Queen CF, Johnston RB, Jr, Rosen OM, Corkey BE, Korchak HM. Protein kinase C isotypes and signaling in neutrophils. Differential substrate specificities of a translocatable calcium- and phospholipid-dependent b-protein kinase C and a phospholipid-dependent protein kinase which is inhibited by long chain fatty acyl coenzyme A. J Biol Chem. 1991;266:9285–9294. [PubMed] [Google Scholar]
- Murray NR, Burns DJ, Fields AP. Presence of a bII protein kinase C-selective nuclear membrane activation factor in human leukemia cells. J Biol Chem. 1994;269:21385–21390. [PubMed] [Google Scholar]
- Nalefski EA, Newton AC. Membrane binding kinetics of protein kinase C betaII mediated by the C2 domain. Biochemistry. 2001;40:13216–13229. doi: 10.1021/bi010761u. [DOI] [PubMed] [Google Scholar]
- Newton AC. Regulation of the ABC kinases by phosphorylation: protein kinase C as a paradigm. Biochem J. 2003;370:361–371. doi: 10.1042/BJ20021626. [DOI] [PMC free article] [PubMed] [Google Scholar]
- Newton AC. Protein kinase C: poised to signal. Am J Physiol Endocrinol Metab. 2010;298:E395–E402. doi: 10.1152/ajpendo.00477.2009. [DOI] [PMC free article] [PubMed] [Google Scholar]
- Oancea E, Meyer T. Protein kinase C as a molecular machine for decoding calcium and diacylglycerol signals. Cell. 1998;95:307–318. doi: 10.1016/s0092-8674(00)81763-8. [DOI] [PubMed] [Google Scholar]
- Oh WJ, Jacinto E. mTOR complex 2 signaling and functions. Cell Cycle. 2011;10:2305–2316. doi: 10.4161/cc.10.14.16586. [DOI] [PMC free article] [PubMed] [Google Scholar]
- Pascale A, Alkon DL, Grimaldi M. Translocation of protein kinase C-betaII in astrocytes requires organized actin cytoskeleton and is not accompanied by synchronous RACK1 relocation. Glia. 2004;46:169–182. doi: 10.1002/glia.10354. [DOI] [PubMed] [Google Scholar]
- Pearce LR, Komander D, Alessi DR. The nuts and bolts of AGC protein kinases. Nat Rev Mol Cell Biol. 2010;11:9–22. doi: 10.1038/nrm2822. [DOI] [PubMed] [Google Scholar]
- Rogue P, Labourdette G, Masmoudi A, Yoshida Y, Huang FL, Huang KP, Zwiller J, Vincendon G, Malviya AN. Rat liver nuclei protein kinase C is the isozyme type II. J Biol Chem. 1990;265:4161–4165. [PubMed] [Google Scholar]
- Rosse C, Linch M, Kermorgant S, Cameron AJ, Boeckeler K, Parker PJ. PKC and the control of localized signal dynamics. Nat Rev Mol Cell Biol. 2010;11:103–112. doi: 10.1038/nrm2847. [DOI] [PubMed] [Google Scholar]
- Sarbassov DD, Ali SM, Kim DH, Guertin DA, Latek RR, Erdjument-Bromage H, Tempst P, Sabatini DM. Rictor, a novel binding partner of mTOR, defines a rapamycin-insensitive and raptor-independent pathway that regulates the cytoskeleton. Curr Biol. 2004;14:1296–1302. doi: 10.1016/j.cub.2004.06.054. [DOI] [PubMed] [Google Scholar]
- Sengupta S, Peterson TR, Sabatini DM. Regulation of the mTOR complex 1 pathway by nutrients, growth factors, and stress. Mol Cell. 2010;40:310–322. doi: 10.1016/j.molcel.2010.09.026. [DOI] [PMC free article] [PubMed] [Google Scholar]
- Shen JX, Wachten S, Halls ML, Everett KL, Cooper DM. Muscarinic receptors stimulate AC2 by novel phosphorylation sites, whereas Gbg subunits exert opposing effects depending on the G-protein source. Biochem J. 2012;447:393–405. doi: 10.1042/BJ20120279. [DOI] [PMC free article] [PubMed] [Google Scholar]
- Smallwood JI, Malawista SE. Protein kinase C isoforms in human neutrophil cytoplasts. J Leukoc Biol. 1992;51:84–92. doi: 10.1002/jlb.51.1.84. [DOI] [PubMed] [Google Scholar]
- Spudich A, Meyer T, Stryer L. Association of the beta isoform of protein kinase C with vimentin filaments. Cell Motil Cytoskeleton. 1992;22:250–256. doi: 10.1002/cm.970220405. [DOI] [PubMed] [Google Scholar]
- Steinberg SF. Structural basis of protein kinase C isoform function. Physiol Rev. 2008;88:1341–1378. doi: 10.1152/physrev.00034.2007. [DOI] [PMC free article] [PubMed] [Google Scholar]
- Tesmer JJ, Sprang SR. The structure, catalytic mechanism and regulation of adenylyl cyclase. Curr Opin Struct Biol. 1998;8:713–719. doi: 10.1016/s0959-440x(98)80090-0. [DOI] [PubMed] [Google Scholar]
- Traxler P, Furet P, Mett H, Buchdunger E, Meyer T, Lydon N. Design and synthesis of novel tyrosine kinase inhibitors using a pharmacophore model of the ATP-binding site of the EGF-R. J Pharm Belg. 1997;52:88–96. [PubMed] [Google Scholar]
- Tucker KA, Lilly MB, Heck L, Jr, Rado TA. Characterization of a new human diploid myeloid leukemia cell line (PLB-985) with granulocytic and monocytic differentiating capacity. Blood. 1987;70:372–378. [PubMed] [Google Scholar]
- Van Haastert PJ, Devreotes PN. Chemotaxis: signalling the way forward. Nat Rev Mol Cell Biol. 2004;5:626–634. doi: 10.1038/nrm1435. [DOI] [PubMed] [Google Scholar]
- Wang F. The signaling mechanisms underlying cell polarity and chemotaxis. Cold Spring Harb Perspect Biol. 2009;1:a002980. doi: 10.1101/cshperspect.a002980. [DOI] [PMC free article] [PubMed] [Google Scholar]
- Wei J, Wayman G, Storm DR. Phosphorylation and inhibition of type III adenylyl cyclase by calmodulin-dependent protein kinase II in vivo. J Biol Chem. 1996;271:24231–24235. doi: 10.1074/jbc.271.39.24231. [DOI] [PubMed] [Google Scholar]
- Yoshimura M, Cooper DM. Type-specific stimulation of adenylylcyclase by protein kinase C. J Biol Chem. 1993;268:4604–4607. [PubMed] [Google Scholar]
- Zinzalla V, Stracka D, Oppliger W, Hall MN. Activation of mTORC2 by association with the ribosome. Cell. 2011;144:757–768. doi: 10.1016/j.cell.2011.02.014. [DOI] [PubMed] [Google Scholar]
- Zoncu R, Efeyan A, Sabatini DM. mTOR: from growth signal integration to cancer, diabetes and ageing. Nat Rev Mol Cell Biol. 2011;12:21–35. doi: 10.1038/nrm3025. [DOI] [PMC free article] [PubMed] [Google Scholar]
Associated Data
This section collects any data citations, data availability statements, or supplementary materials included in this article.