Abstract
Interleukin-17 (IL-17) has been associated with the pathogenesis of numerous autoimmune diseases. CD4+ T cells secreting IL-17 are termed Th17 cells. CD8+ T cells, designated Tc17 cells, are also capable of secreting IL-17. Here we describe a population of Tc17 cells characterized by the expression of surface CD146, an endothelial adhesion molecule. These cells display signatures of a human Tc17 genotype and phenotype. Circulating CD8+CD146+ T cells are present in low levels in healthy adults. Elevations in CD8+CD146+ T cells are found in as Behcet’s disease and birdshot retinochoroidopathy, which have been reported to have HLA class I associations. Sarcoidosis does not have a class I association and displays an increase in CD4+ CD146+ T cells but not in CD8+CD146+ T cells. CD146 on these cells may facilitate their ability to bind to, and migrate through, endothelium, as has been reported for CD4+CD146+ T cells.
Keywords: CD146/MCAM, Tc17, inflammation, class I antigen
1. Introduction
The interleukin-17 (IL-17) family of pro-inflammatory cytokines plays an important role in the pathogenesis of autoimmune, inflammatory, and allergic diseases, as well as in host defenses against microbial infections. Studies in both human and mouse models have shown that rheumatoid arthritis, inflammatory bowel disease, psoriasis, multiple sclerosis, Behcet’s disease, and sarcoidosis, are among the autoimmune diseases in which IL-17 has a putative role (1).
The IL-17 family is comprised of 5 members (IL-17A-F), with IL-17A and IL-17F being the most commonly studied. Production of IL-17 is most often associated with a subset of CD4+ T cells termed Th17 cells (2), although a number of other cells can also secrete IL-17, including CD8+ T cells (Tc17), invariant natural killer T cells (iNKT), natural killer cells (NK), lymphoid tissue inducer cells (LTi), γδ T cells, and macrophages (3). Tc17 cells have been described in animal studies and healthy individuals, but are only beginning to be studied in the context of autoimmune diseases (4-9). There is good consensus that differentiation of naïve T cells to the Th17 and Tc17 phenotypes is driven by interleukin-1β (IL-1β), interleukin-6 (IL-6), and interleukin-23 (IL-23) (10-11). At sites of inflammation, IL-17 functions by inducing the expression of IL-1β, IL-6, and tumor necrosis factor-α (TNF-α) from both endothelial as well as epithelial cells in addition to a myriad of other cell types including synoviocytes, keratinocytes, and fibroblasts. IL-17 also induces the recruitment of neutrophils by promoting the release of chemokines such as CXCL1, CXCL5, CXCL8 (IL-8), CCL2, and CCL7.
Human Th17 cells have also been reported to express CCR4, CCR6, IL-23R, and CD161 (12-15). Previous work by us and others (16-18) has demonstrated that CD146, the melanoma cell adhesion molecule (MCAM) is also expressed on human Th17 cells. This is of particular note, as CD146 is a homophilic endothelial adhesion molecule, and its presence on lymphocytes has been demonstrated to enhance their binding to endothelial monolayers and thereby mediates adhesion and migration across blood–brain barrier endothelial cells (17,19-21). Thus CD146 not only serves as a convenient marker of IL-17 secreting CD4+ T cells, but also directly influences the ability of these cells to exit the peripheral circulation and home to sites of inflammation.
Tc17 cells are only beginning to be described, although their presence in several autoimmune diseases has been documented (7,8). Among the many unanswered questions about Tc17 cells is whether they extravasate and migrate to sites of inflammation in a manner similar to Th17 cells. In the current study, we examined the expression of CD146 on CD8+ T cells and whether these cells were capable of IL-17 secretion, similar to our observation in CD4+ T cells (16). We also examined peripheral blood from patients suffering from any one of three autoimmune diseases (sarcoidosis, Behcet’s disease, or birdshot retinochoroidopathy) to determine if these contained elevated levels of CD146-expressing T cells compared to healthy donors. Sarcoidosis and Behçet's disease are multisystem autoimmune disorders that can cause sight threatening intraocular inflammation (uveitis), whereas birdshot retinochoridopathy is an isolated ocular inflammatory syndrome that is characterized by chorioretinal retinal inflammatory lesions. Behcet's disease and birdshot retinochoroidopathy are associated with Class I HLA antigens whereas sarcoidosis has been linked to various Class II antigens.
2. Methods
2.1 Patients
Peripheral blood was collected using sodium heparin vacutainers (Becton Dickinson (BD), San Jose, CA) from healthy donors (n=71) (protocol-07-H-0113) and from Behcet’s disease (n=22), sarcoidosis (n=56) or birdshot retinochoroidopathy (n=11) patients attending NEI clinics (NEI IRB-approved protocol-08-ei-0169). Patient demographics are shown in supplemental Table 1.
2.2 Flow cytometric immunophenotyping
All samples were processed within 24 hrs of draw. Red blood cells were lysed using ACK Lysing buffer (Quality Biologicals, Gaithersburg, MD), and then leukocytes were washed and counted. Cells were then stained with various combinations of the following fluorochrome-conjugated antibodies: CD3, CD4, CD8, CD19, CCR6, CD33, CD14, CD45, CD45RO, CD161, CCR5, and CD146 (Clone P1H12) (all from BD) in staining buffer (1× PBS, 0.5% bovine serum albumin, 0.025 mM EDTA). After 30 minutes of incubation with the antibodies, cells were washed three times with PBS and acquired on a LSRII™ flow cytometer equipped with 405, 488, 532 and 638nm laser lines using DIVA™ 6.1.2 software (BD). Intracellular cytokine staining for IL-17A (Biolegend, San Diego, CA), interferon-γ (IFN-γ) (BD), perforin and granzyme b (eBioscience, San Diego, CA) was performed after staining of the cells for surface antigens using Cytofix/Cytoperm buffer (BD) to permeabilize the cells. All data were analyzed with FlowJo™ software version 9.4.6 (Treestar, San Carlos, CA). Viability staining was accomplished through the use of Live/Dead Fixable Aqua (Life Technologies, Grand Island, NY)
2.3 Cell sorting
Cell sorting was performed on samples of peripheral blood after lysis of erythrocytes using ACK Lysing solution. The cells were subsequently incubated for 30 min at room temperature with fluorochrome-conjugated antibodies as described above. The stained T-cells were sorted into CD8+CD146+ and CD8+CD146− subpopulations. Positive staining for CD146 was established through the use of fluorescence minus-one (FMO) controls (supplemental figure 1). A FACSAria SORP ™ sorter equipped with 405, 488, 532 and 638nm laser lines and DIVA™ 6.1.2 software (BD) was used for sorting.
2.4 In vitro stimulation
Equal numbers of sorted CD8+CD146+ and CD8+CD146− cells (50,000 to 100,000, depending on how many cells were available from any one patient) were cultured in 100μl of culture medium in 96 well U bottom culture plates with plate bound anti-human CD3 (1 μg/ml clone OKT-3) and anti-human CD28 (2.5 μg/ml clone CD28.2) in Iscove’s Modified Dulbecco’s Media (IMDM) supplemented with 10%FCS and 1X antimycotic and antibiotic solution. Where possible, a control consisting of an equal number of cells from each sorted subset was kept in identical conditions, but without stimulation. Cytokine production was studied after CD8+CD146+ and CD8+CD146− T-cells were stimulated for 5 days as described. To be able to use the same cells to assess cytokines both in the culture supernatants as well as intracellularly, the culture supernatant was collected first (after 12 hr or 5 days of culture) for Luminex analysis and then cultured cells were re-supplemented for the last 4 hours of incubation with IMDM +10% FCS and PMA/Ionomycin in presence of brefeldin-A (Leukocyte Activation Cocktail [BD]). The stimulated cells were then stained for both surface and intracellular antigens and analyzed and the culture supernatants kept at −800 until analysis of soluble cytokines by multiplex bead array.
2.5 Gene expression
RNA from freshly sorted unstimulated CD8+CD146+ and CD8+CD146− T-cells, as described above, was extracted using RNAqueous micro kit (Ambion, Austin, TX) according to the manufacturer’s instructions. The Superscript cDNA synthesis kit (Invitrogen, Carlsbad, CA) was used to synthesize first strand cDNA as per the manufacturer’s guidelines. cDNA was used as the template for amplification of the genes of interest and the control housekeeping genes (β-Actin # Hs99999903). Real time PCR (QRTPCR) was performed using a 7900-sequence detector (PE-Applied Biosystems, Norwalk, CT). Samples were analyzed in duplicate and, after normalizing the Ct values to housekeeping genes, fold changes in expression were calculated using ΔΔCt (cycle threshold) method (22). The primers obtained from Applied Biosystems were as follows: IL-17A #Hs99999082_m1, IL-17F# Hs00369400_m1, ROR-C #Hs01076112_m1, MCAM/CD146 #Hs00174838_m1.
2.6 Measurement of cytokines in culture supernatants
Measurement of cytokines present in the supernatants of sorted CD8+CD146+ T-cells and CD8+CD146− T-cells stimulated with plate bound CD3/CD28 for 5 days. This was performed by multiplex bead arrays using kits for Luminex assays (HCYTOMAG-60K-11 Human Cytokine Magnetic Millipore kit, Bellerica, MA) according to the manufacturer’s instructions. Acquisition and analysis was performed on a Luminex-100 instrument using Bio-plex 6.1 software (Bio-rad, Hercules, CA).
2.7 Statistical analyses
Data obtained with cells from one donor were considered as one experiment (n). Statistical analyses were performed using Graphpad Prism 6.0 software (La Jolla, CA), including the calculation of mean, standard errors of the mean (SEM), and p values.. Within one experiment, data were analyzed using a paired, two tailed, nonparametric Wilcoxon matched pairs test in every instance where we sought to compare CD146+ and CD146− populations isolated from the same donors (Figures 5, 6, and 8). Mann Whitney (Wilcoxon rank sum) tests were used for Figures 1 and 7, as these concerned comparisons of populations rather than paired samples. The significance level was set as p ≤ 0.05, and the p values are given for each series of experiments.
Figure 5.
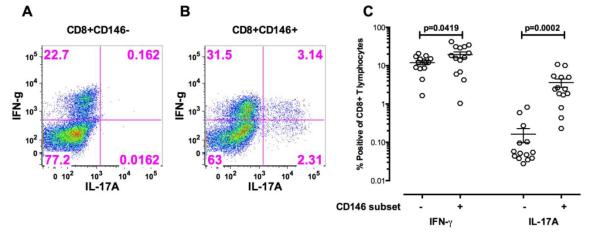
A. Stimulation of sorted CD8+CD146+ T cells and CD8+CD146− T cells from healthy donors for 5 days in vitro with CD3/CD28 without the addition of any exogenous polarizing cytokines. PMA, ionomycin, and brefeldin A was added for the last 4 hours of this stimulation. Intracellular IFN-γ and IL-17A in CD8+CD146− T cells from a representative donor.
B. Intracellular IFN-γ and IL-17A in CD8+CD146+ T cells from a representative donor.
C. Composite results of these experiments from 14 healthy individuals. Significance was determined using the Wilcoxon matched pairs test and the bars indicate the mean SEM with 95% confidence intervals.
Figure 6.
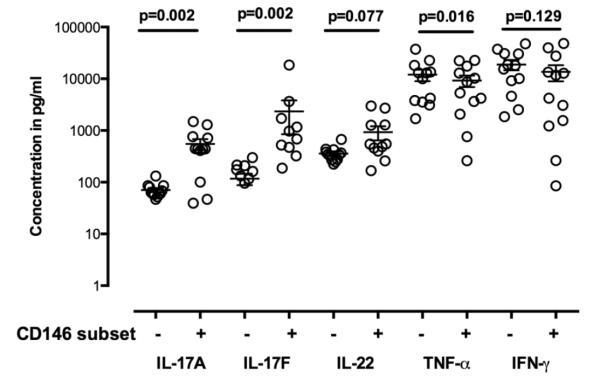
Supernatants from cultures of CD8+CD146− and CD146+ T cells from healthy individuals stimulated for 5 days with CD3/CD28 (as described in the text) analyzed by multiplex bead arrays for cytokine secretion in culture supernatant. CD8+ CD146+ compared to CD8+CD146–T cells demonstrated more Tc17-related cytokines after stimulation in vitro with only CD3/CD28. Significance was determined using the Wilcoxon matched pairs test and the bars indicate the mean SEM with 95% confidence intervals. Significantly more IL-17A and IL-17F were found in culture of CD8+CD146+ cells than in their CD146− counterparts, and significantly less TNF-α. Production of IL-22 trends higher in CD8+CD146+ cultures but did not reach significance at a level of 0.05.
Figure 8.
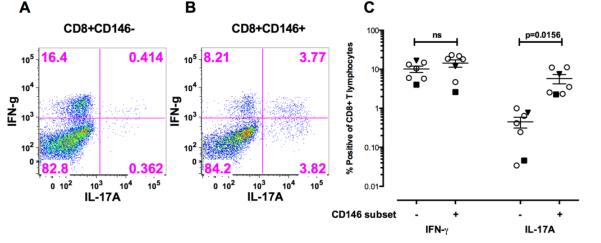
Stimulation of sorted CD8+CD146+ T cells and CD8+CD146− T cells from patients with Behcet’s or birdshot uveitis for 5 days in vitro with CD3/CD28 without the addition of any exogenous polarizing cytokines.
A. Intracellular IFN-γ and IL-17A in CD8+CD146− T cells from a representative patient with Behcet’s disease.
B. Intracellular IFN-γ and IL-17A in CD8+CD146+ T cells from a representative patient with Behcet’s disease.
C. Composite results of these experiments examining intracellular IFN-γ and IL-17A from 7 patients (5 Sarcoidosis, 1 Behcet’s and 1birdshot). Sarcoidosis is indicated as hollow circle Behcet’s is indicated by the inverted dark triangle and the birdshot by the dark square. Significance was determined using the Wilcoxon matched pairs test and the bars indicate the mean SEM with 95% confidence intervals.
D. Sorted CD8+CD146− and CD8+CD146− cells stimulated for 5 days with CD3/CD28 both demonstrated an increase in CD146 expression, but IL17 production was primarily associated with CD146 expression in only the CD8+CD146+ sorted cells. Shown here are representative data from one healthy donor as well as one sarcoid patient and one Behcet’s disease patient.
Figure 1.

A. An example of CD146 staining on CD8+ T cells from a representative healthy donor. Gating was performed by first forward versus side light scatter to identify lymphocytes, then CD8+ T cells were gated using a dot plot showing CD3 versus CD8.
B. The percentage of CD8+ T cells expressing CD146 in the peripheral blood of healthy donors as a function of age. There were no significant changes in the percentage of CD146+CD8+ T cells in either males or females with increasing age.
C. The percentage of CD8+ T cells expressing CD146 in the peripheral blood of healthy donors by gender. Bars indicate medians and interquartile ranges. Using the Mann Whitney test, no significant association with gender was observed.
Figure 7.
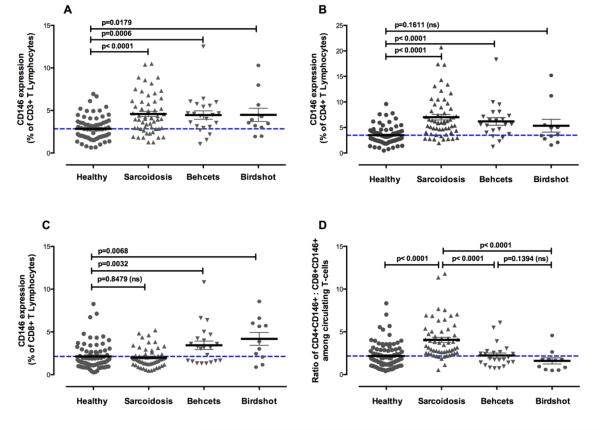
The study of CD146 expression on total CD3+ T cells, CD4+ T cells, and CD8+ T cells in patients with autoimmune diseases. Significance was determined using the Mann Whitney test. Brackets are the mean and SEM.
A. Percentage of CD3+ T cells expressing CD146 in peripheral blood of healthy donors and patients with sarcoidosis, Behcet’s disease, or birdshot uveitis. Statistical significance between healthy and disease groups is indicated by the bars.
B. Percentage of CD3+ CD4+T cells expressing CD146 in peripheral blood of healthy donors and patients with sarcoidosis, Behcet’s disease, or birdshot uveitis. Statistical significance between healthy and disease groups is indicated by the bars.
C. Percentage of CD3+ CD8+T cells expressing CD146 in peripheral blood of healthy donors and patients with sarcoidosis, Behcet’s disease, or birdshot uveitis. Statistical significance between healthy and disease groups is indicated by the bars.
D. Ratio of circulating CD4+CD146+ to CD8+CD146+ cells in healthy and various autoimmune diseases. Statistical significance between sarcoidosis and other disease groups and healthy controls is indicated by the bars.
3. Results
3.1 Expression of CD146 on T cell subsets
Among 71 healthy donors, the percentage of peripheral blood CD3+ T cell expressing CD146 was 2.84 ± 1.40% (mean ±SEM), the percentage of CD8+ T cells expressing CD146 was 2.16 ± 1.49% of all T cells. By comparison, 3.47 ± 1.77% of the CD4+ T cells expressed CD146 in healthy donors. Figure 1a illustrates the staining of CD146 on CD8+ T cells. There was no statistically significant association between the percentages of the CD8+ CD146+ T cells and either the age or sex of the donor (Figures 1B and 1C).
3.2 Characterization of CD8+CD146+ T cells in healthy donors
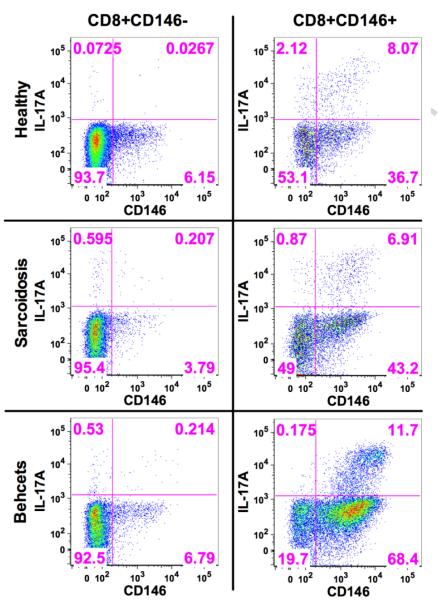
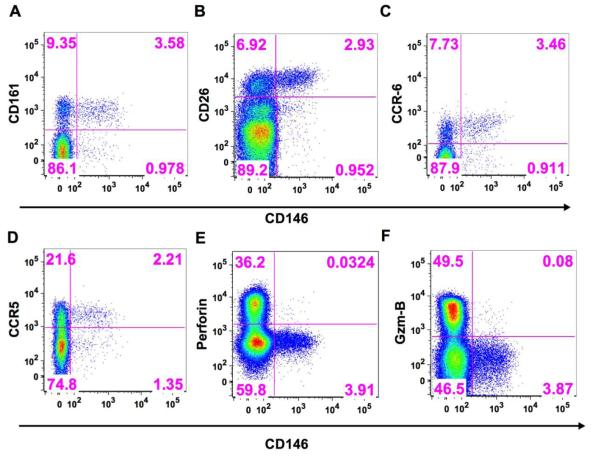
A number of cell surface markers have been associated with Th17 cells such as CD161, CD26, CCR6, and CCR5 (12-15). Using fresh peripheral blood from healthy donors, we examined the CD8+CD146+ T cells for expression of these markers and observed that all of these markers were highly co-expressed on the CD8+CD146+ T cell population (Figures 2A-D), but the CD146+ cells represented only a small subpopulation of each of these markers on the total CD8+ T cell population. As a percentage of CD8+CD146+ cell, CD161 was expressed on an average (±sem) of 65.5% (8.1, n=5) of the cells, CD26 on 67.6% (11.1, n=4), CCR6 on 68.3% (7.3, n=5), and CCR5 on 66% (2.2, n=3). Intracellular staining of CD8+ CD146+ T cells from healthy donors also displayed a lack of co-expression of perforin, and granzyme B with CD146 (Figure 2E-F). Fresh peripheral blood from healthy donors stimulated for 6 hours with phorbol myristate acetate (PMA),ionomycin, and brefeldin A was stained for CD3, CD4, CD8, CD146, a viability stain (Live\Dead Fixable Aqua), and for intracellular IL-17A and IFN-γ. These experiments demonstrated that both of these cytokines were expressed in a portion, but not all, of the 6 hour stimulated CD8+CD146+ T cells and that the percentage of CD8+CD146+ cells that produced IL17 was greater than the percentage of CD8+CD146− cells that produced IL17. Referring to Figure 3, right panel: 8.43% of the CD8+CD146+ cells express IL-17A (upper right quadrant divided by the upper right plus lower right quadrants [0.35 divided by the total of 4.15]) whereas only 0.27% of the CD8+CD146− cells express IL-17A (upper left quadrant divided by the upper left plus lower left quadrants [0.26 divided by the total of 95.86]). This shows a 30-fold enhancement of IL-17 production in CD8+CD146+ cells compared to the CD146− counterparts if an equivalent number of cells were present. However, the latter are more numerous in the circulation, and IL-17 production is not limited to the CD146+ cells. Data from replicate experiments (Supplemental figure 2, n=4) showed IL17 secretion was associated with CD146 expression of CD8+ cells if one looked at secretion as a percentage of the parent population defined by the presence or absence of CD146.
Figure 2.
Coexpression of various Tc17-associated markers with CD146 on CD8+ T cells in fresh peripheral blood from a representative healthy donor. The x axis on each plot is CD146.
A. CD161
B. CD26
C. CCR6
D. CCR5
Lack of coexpression of cytotoxic markers with CD146 on CD8+ T cells in fresh peripheral blood from a representative healthy donor:
E. Perforin
F. Granzyme B
Figure 3.
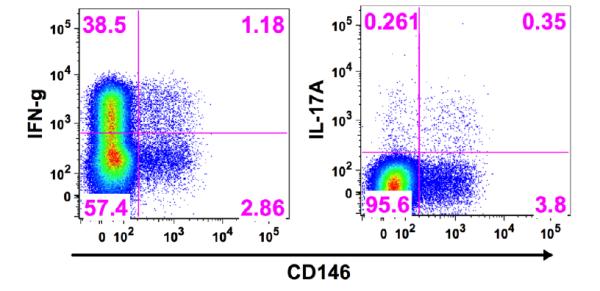
Production of intracellular IFN-γ and IL-17A in CD8+ T cells in relationship to expression of CD146 in a representative sample of fresh peripheral blood from a healthy donor stimulated for 6 hours with PMA, ionomycin, and brefeldin A.
3.3 QRTPCR studies of the expression of Tc17-related genes
To confirm the observations made by immunophenotyping, QRTPCR was performed on freshly sorted unstimulated cells. QRTPCR of the RNA isolated from freshly stained and sorted CD8+CD146+ T cells demonstrated increased expression of IL-17A, IL-17F, and ROR-c (Figure 4) compared to CD146-negative CD8+ T cell controls. In all PCR experiments, expression of MCAM (CD146) was analyzed as a positive control to ensure that cells had been properly sorted, and any sample not displaying CD146 gene expression concordant with the sorting was eliminated from analysis. These data support that CD146 expression in CD8+ T cells identifies a Tc17 population.
Figure 4.
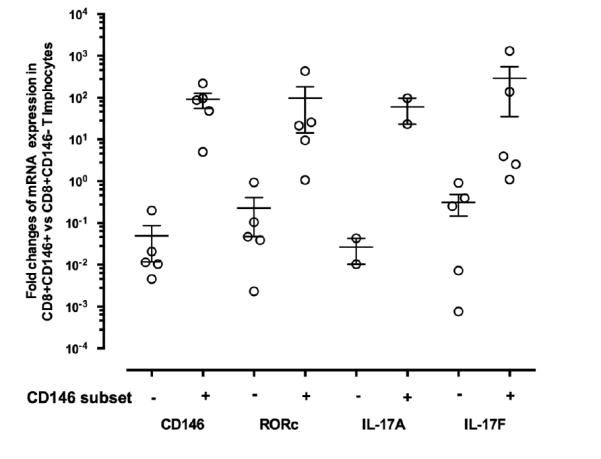
QRTPCR of mRNA isolated from sorted CD8+CD146+ T cells obtained from fresh peripheral blood of healthy donors (n=5). Fold changes are normalized mRNA levels for CD8+CD146+ T cells compared to CD8+CD146− T cells. For IL-17A, insufficient signal for detection was present in 3 of the samples.
3.4 In vitro cytokine production of CD8+CD146+ T cells
CD8+CD146+ and CD8+CD146− T cells from peripheral blood of healthy donors was sorted by flow cytometry and stimulated for 5 days in vitro with CD3/CD28 without the addition of any exogenous polarizing cytokines. PMA ionomycin was added for the last 4 hours of this stimulation. After stimulation, the cells were stained and analyzed by flow cytometry to examine intracellular cytokine expression. These experiments showed that the CD8+CD146 positive T cells expressed significantly more IL-17A than did the CD8+CD146-negative T cells (Figures 5A-C). These cells demonstrated expression of IFN-γ in both the CD146 positive and negative fractions
3.5 Multiplex bead array (Luminex) analysis of cytokines secreted in vitro
Culture supernatants were saved from the in vitro experiments in which sorted cells were stimulated with CD3/CD28 for 5 days, in order to assess the levels of cytokines secreted into the medium by CD8+CD146+ T cells and CD8+CD146− T cells. Multiplex bead arrays for the analysis of cytokines in the supernatants from stimulated CD8+CD146+ T cells revealed increased secreted IL-17A, IL-17F, and IL-22 compared to the culture supernatants from the CD8+CD146− T cells (Figure 6), consistent with both the immunophenotyping and QRTPCR data.
3.6 Studies in autoimmune diseases
In peripheral blood samples from patients with sarcoidosis, Behcet’s disease or birdshot retinochoroidopathy, the percentages of total CD3+ T cells expressing CD146 were significantly elevated compared to healthy controls (sarcoidosis: 4.58±2.3%; Behcet’s: 4.5±2.3%; birdshot: 4.5±2.6%) (Figure 7A). This elevation was not observed in both CD4 and CD8 subsets for all diseases, but rather was compartmentalized according to disease. CD4+ T cells expressing CD146 were significantly elevated in sarcoidosis (7.02±4.08%, p<0.0001) and Behcet’s disease (6.2±3.5%, p<0.0001), and were elevated, but not significantly in birdshot retinochoroidopathy (5.3±4.2%, p=0.1611, ns) (Figure 7B). By contrast, CD8+ CD146+ T cells were only increased in Behcet’s disease (3.4±2.3%, p=0.0032) and birdshot retinochoroidopathy (4.2±2.5%, p=0.0068), but not in sarcoidosis (1.99±1.12%, p=0.8469, ns) (Figure 7C). The ratio of circulating CD4+CD146+ to CD8+CD146+ cells could distinguish sarcoidosis from healthy donors as well as from Behcet’s disease and birdshot uveitis (Fig 7D). No statistically significant differences in the levels of CD146 positive cells were observed among patients in any of the diseases based on whether ocular involvement was present or not (data not shown).
To confirm the Tc17 nature of the CD8+CD146+ T cells in disease, peripheral blood from seven patients with uveitis (sarcoidosis (n=5), Behcet’s (n=1) and birdshot (n=1)) was used to sort CD8+CD146+ and CD146− T cells and repeat the studies of 5 day in vitro stimulation with CD3 and CD28. These experiments confirmed the Tc17 phenotype of the CD8+ CD146+ T cells in disease (Figures 8 A-C). Interestingly, 5 day in vitro stimulation with CD3/CD28 could increase the CD146 expression in the CD8+CD146− cells as well as in the CD8+CD146+ cells, but IL-17 production only increased marginally in the former whereas the latter showed a high degree of IL17 production on the CD146+ cells (Figure 8D).
4. Discussion
CD4+ T cells secreting IL-17 have been studied far more extensively than CD8+ T cells producing IL-17. Th17 cells have repeatedly been implicated in playing a role in the pathogenesis of numerous autoimmune diseases including multiple sclerosis, psoriasis, inflammatory bowel disease, sarcoidosis, as well as many others. By contrast, fewer studies have been conducted on Tc17 cells, and, while these are found in elevated numbers in some autoimmune diseases, including psoriasis, systemic lupus erythematosus, and immune thrombocytopenia, the precise role of these cells remains to be delineated. Our previous work, later confirmed by others, demonstrated that CD146 identified a population of Th17 cells with enhanced ability to bind to, and cross through, vascular endothelium (16-18). The current data demonstrate a Tc17 phenotype for CD8+ T cells expressing CD146 (MCAM) by surface marker expression, gene expression, and cytokine secretion. The CD8+CD146+ cells are phenotypically similar in both healthy and autoimmune diseases, although the numbers of these cells increase in specific autoimmune diseases. Given the previously demonstrated ability of CD146 to enhance binding of a number of cells types, including CD4+ T cells and Th17 cells, to endothelium (20, 21), it is likely that these Tc17 cells would also use CD146 in a similar manner. CD146 expression by CD8+ T cells not only identifies committed (needing no polarization) Tc17 cells, but also suggests a mechanism by which these cells can extravasate to sites of inflammation.
CD146+ Th17 cells were elevated in all three of the diseases studied in comparison to healthy controls, but only reached statistical significance in sarcoidosis and Behcet’s disease. It is unclear if the elevation of CD146+ Th17 cells found in birdshot retinochoroidopathy would reach significance if more samples were analyzed or if this represents disease heterogeneity among these patients. These findings, together with the observation that CD146+ Tc17 cells are increased in only Behcet’s disease and birdshot retinochoroidopathy are intriguing. Behcet’s disease has been closely associated with HLA class I antigens HLA-B*51 and HLA-Cw*1602 (23,24). Birdshot retinochoroidopathy also has also been closely associated with an HLA class I antigen, specifically HLA-A29 (25,26). By contrast, sarcoidosis is most often associated with class II antigens such as BTLN2 and HLA-DQB1*0201 (27,28). It is thus interesting to speculate that increases in CD146+ Tc17 cells in the peripheral circulation are associated with diseases linked to HLA class I rather than class II. Supporting this concept is the finding in a previous study that Tc17 cells are overrepresented in skin lesions of psoriasis patients, a disease in which another class I antigen, HLA-Cw6, is the strongest susceptibility candidate gene (29,30).
By looking at the ratio of CD146+Th17 to CD146+Tc17 cells, we could segregate cases of sarcoidosis from both Behcet’s disease and birdshot retinochoroidopathy in a statistically significant manner and with minimal overlapping cases. Classically these diseases have quite distinct clinical appearances and should be simple to distinguish. Clinicians are well aware of the sometimes dramatic overlap of clinical presentation in many disorders. This is often the case with sarcoidosis which can have protean clinical manifestations and can masquerade as several other ocular inflammatory disorders. In addition, previous therapy, in our experience, may mask the granulomatous appearance to many disorders, including sarcoidosis. Moreover, lung lesions in sarcoidosis may disappear during the course of the disease or because of the initiation of therapy, leaving only the ocular disease. Thus additional diagnostic methods that can be applied to the clinical question may be very helpful.
In summary, we have identified a novel population of human Tc17 cells identified by the endothelial adhesion molecule CD146. By using human autoimmune diseases as model, we show that this subset appears to be associated with autoimmune diseases linked to HLA class I but not HLA class II genes. This population of CD146 Tc17 cells might prove useful in distinguishing HLA class I-associated autoimmune diseases from class II diseases, and ultimately may provide a therapeutic target for the former.
Supplementary Material
Supplemental Table 1. Patient age, gender, and disease activity, by healthy or disease group
Supplemental Figure 1. The fluorescence minus one (FMO) control (top row) and CD146 staining (bottom row) showing the gating strategy for sorting CD146+ cells.
Supplemental Figure 2. The percentage of fresh CD8+ CD146+ or CD146− T cells that express IL17 expressed as a percentage of the parent population (n=4).
Highlights.
CD8+ T cells expressing CD146 secrete IL-17 and have a Tc17 genotype and phenotype.
CD146+ Tc17 cells are present in low levels in healthy adults.
• Levels of CD146+ Tc17 cells are elevated in Behcet’s disease and birdshot uveitis, diseases with a HLA class I associations.
Acknowledgments
This study was funded by the National Institutes of Health, National Heart, Lung, and Blood Institute, Division of Intramural Research
Footnotes
Publisher's Disclaimer: This is a PDF file of an unedited manuscript that has been accepted for publication. As a service to our customers we are providing this early version of the manuscript. The manuscript will undergo copyediting, typesetting, and review of the resulting proof before it is published in its final citable form. Please note that during the production process errors may be discovered which could affect the content, and all legal disclaimers that apply to the journal pertain.
5. References
- 1.Hu Y, Shen F, Crellin NK, Ouyang W. The IL-17 pathway as a major therapeutic target in autoimmune diseases. Ann N Y Acad Sci. 2011;1217:60–76. doi: 10.1111/j.1749-6632.2010.05825.x. [DOI] [PubMed] [Google Scholar]
- 2.Maddur MS, Miossec P, Kaveri SV, Bayry J. Th17 cells: biology, pathogenesis of autoimmune and inflammatory diseases, and therapeutic strategies. Am J Pathol. 2012;181:8–18. doi: 10.1016/j.ajpath.2012.03.044. [DOI] [PubMed] [Google Scholar]
- 3.Cua DJ, Tato CM. Innate IL-17-producing cells: the sentinels of the immune system. Nat Rev Immunol. 10:479–489. doi: 10.1038/nri2800. [DOI] [PubMed] [Google Scholar]
- 4.Huber M, Heink S, Grothe H, Guralnik A, Reinhard K, Elflein K, Hünig T, Mittrücker HW, Brüstle A, Kamradt T, Lohoff M. A Th17-like developmental process leads to CD8(+) Tc17 cells with reduced cytotoxic activity. Eur J Immunol. 2009;39:1716–25. doi: 10.1002/eji.200939412. [DOI] [PubMed] [Google Scholar]
- 5.Yen HR, Harris TJ, Wada S, Grosso JF, Getnet D, Goldberg MV, Liang KL, Bruno TC, Pyle KJ, Chan SL, Anders RA, Trimble CL, Adler AJ, Lin TY, Pardoll DM, Huang CT, Drake CG. Tc17 CD8 T cells: functional plasticity and subset diversity. J Immunol. 2009;183:7161–8. doi: 10.4049/jimmunol.0900368. [DOI] [PMC free article] [PubMed] [Google Scholar]
- 6.Kondo T, Takata H, Matsuki F, Takiguchi M. Cutting edge: Phenotypic characterization and differentiation of human CD8+ T cells producing IL-17. J Immunol. 2009;182:1794–8. doi: 10.4049/jimmunol.0801347. [DOI] [PubMed] [Google Scholar]
- 7.He D, Wu L, Kim HK, Li H, Elmets CA, Xu H. CD8+ IL-17-producing T cells are important in effector functions for the elicitation of contact hypersensitivity responses. J Immunol. 2006;177:6852–8. doi: 10.4049/jimmunol.177.10.6852. [DOI] [PMC free article] [PubMed] [Google Scholar]
- 8.Res PCM, Piskin G, de Boer OJ, van der Loos CM, Teeling P, et al. Overrepresentation of IL-17A and IL-22 Producing CD8 T Cells in Lesional Skin Suggests Their Involvement in the Pathogenesis of Psoriasis. PLoS ONE. 2010;5:e14108. doi: 10.1371/journal.pone.0014108. [DOI] [PMC free article] [PubMed] [Google Scholar]
- 9.Annibali V, Ristori G, Angelini DF, Serafini B, Mechelli R, Cannoni S, Romano S, Paolillo A, Abderrahim H, Diamantini A, Borsellino G, Aloisi F, Battistini L, Salvetti M. CD161(high)CD8+T cells bear pathogenetic potential in multiple sclerosis. Brain. 2011;134:542–54. doi: 10.1093/brain/awq354. [DOI] [PubMed] [Google Scholar]
- 10.Stockinger B, Veldhoen M. Differentiation and function of Th17 T cells. Curr Opin Immunol. 2007;19:281–6. doi: 10.1016/j.coi.2007.04.005. [DOI] [PubMed] [Google Scholar]
- 11.Chen Z, O'Shea JJ. Regulation of IL-17 production in human lymphocytes. Cytokine. 2008;41:71–8. doi: 10.1016/j.cyto.2007.09.009. [DOI] [PMC free article] [PubMed] [Google Scholar]
- 12.Maggi L, Santarlasci V, Capone M, Peired A, Frosali F, Crome SQ, Querci V, Fambrini M, Liotta F, Levings MK, Maggi E, Cosmi L, Romagnani S, Annunziato F. CD161 is a marker of all human IL-17-producing T-cell subsets and is induced by RORC. Eur. J. Immunol. 2010;40:2174–2181. doi: 10.1002/eji.200940257. [DOI] [PubMed] [Google Scholar]
- 13.Li L, Yang X, Chen BPW, Struss PE, Perna A, Wei BY, Jiang N, Kraft B, Lay G. Immunophenotypic Characterization of Th17 Cells in Human Peripheral Blood. J. Immunol. 2009;182:137. [Google Scholar]
- 14.Singh SP, Zhang HH, Foley JF, Hedrick MN, Farber JM. Human T cells that are able to produce IL-17 express the chemokine receptor CCR6. J Immunol. 2008;180:214–21. doi: 10.4049/jimmunol.180.1.214. [DOI] [PubMed] [Google Scholar]
- 15.Bengsch B, Seigel B, Flecken T, Wolanski J, Blum HE, Thimme R. Human Th17 cells express high levels of enzymatically active dipeptidylpeptidase IV (CD26) Immunol. 2012;188:5438–47. doi: 10.4049/jimmunol.1103801. [DOI] [PubMed] [Google Scholar]
- 16.Dagur PK, Biancotto A, Wei L, Sen HN, Yao M, Strober W, Nussenblatt RB, McCoy JP. MCAM-expressing CD4(+) T cells in peripheral blood secrete IL-17A and are significantly elevated in inflammatory autoimmune diseases. J Autoimmun. 2011;37:319–27. doi: 10.1016/j.jaut.2011.09.003. [DOI] [PMC free article] [PubMed] [Google Scholar]
- 17.Larochelle C, Cayrol R, Kebir H, Alvarez JI, Lécuyer MA, Ifergan I, Viel É , Bourbonnière L, Beauseigle D, Terouz S, Hachehouche L, Gendron S, Poirier J, Jobin C, Duquette P, Flanagan K, Yednock T, Arbour N, Prat A. Melanoma cell adhesion molecule identifies encephalitogenic T lymphocytes and promotes their recruitment to the central nervous system. Brain. 2012;135:2906–24. doi: 10.1093/brain/aws212. [DOI] [PubMed] [Google Scholar]
- 18.Kamiyama T, Watanabe H, Iijima M, Miyazaki A, Iwamoto S. Coexpression of CCR6 and CD146 (MCAM) is a marker of effector memory T-helper 17 cells. J Dermatol. 2012;39:838–42. doi: 10.1111/j.1346-8138.2012.01544.x. [DOI] [PubMed] [Google Scholar]
- 19.Bardin N, Anfosso F, Masse JM, Cramer E, Sabatier F, Le Bivic A, Sampol J, Dignat-George F. Identification of CD146 as a component of the endothelial junction involved in the control of cell-cell cohesion. Blood. 2001;98:3677–3684. doi: 10.1182/blood.v98.13.3677. [DOI] [PubMed] [Google Scholar]
- 20.Elshal MF, Khan SS, Raghavachari N, Takahashi Y, Barb J, Bailey JJ, Munson PJ, Solomon MA, Danner RL, McCoy JP. A unique population of effector memory lymphocytes identified by CD146 having a distinct immunophenotypic and genomic profile. BMC Immunol. 2007;13:29. doi: 10.1186/1471-2172-8-29. [DOI] [PMC free article] [PubMed] [Google Scholar]
- 21.Guezguez B, Vigneron P, Lamerant N, Kieda C, Jaffredo T, Dunon D. Dual role of melanoma cell adhesion molecule (MCAM)/CD146 in lymphocyte endothelium interaction: MCAM/CD146 promotes rolling via microvilli induction in lymphocyte and is an endothelial adhesion receptor. J Immunol. 2007;179:6673–85. doi: 10.4049/jimmunol.179.10.6673. [DOI] [PubMed] [Google Scholar]
- 22.Livak KJ, Schmittgen TD. Analysis of relative gene expression data using real-time quantitative PCR and the 2(-Delta Delta C(T)) Method. Methods. 2001;25:402–8. doi: 10.1006/meth.2001.1262. [DOI] [PubMed] [Google Scholar]
- 23.Piga M, Mathieu A. Genetic susceptibility to Behcet's disease: role of genes belonging to the MHC region. Rheumatology (Oxford) 2011;50:299–310. doi: 10.1093/rheumatology/keq331. [DOI] [PubMed] [Google Scholar]
- 24.Hughes T, Coit P, Adler A, Yilmaz V, Aksu K, Düzgün N, Keser G, Cefle A, Yazici A, Ergen A, Alpsoy E, Salvarani C, Casali B, Kötter I, Gutierrez-Achury J, Wijmenga C, Direskeneli H, Saruhan-Direskeneli G, Sawalha AH. Identification of multiple independent susceptibility loci in the HLA region in Behçet's disease. Nat Genet. 2013;45:319–24. doi: 10.1038/ng.2551. [DOI] [PubMed] [Google Scholar]
- 25.Brézin AP, Monnet D, Cohen JH, Levinson RD. HLA-A29 and birdshot chorioretinopathy. Ocul Immunol Inflamm. 2011;19:397–400. doi: 10.3109/09273948.2011.619295. [DOI] [PubMed] [Google Scholar]
- 26.de Waal LP, Lardy NM, van der Horst AR, Baarsma GS, Kijlstra A, Noens L, Priem HA. HLA-A29 subtypes and birdshot chorioretinopathy. Immunogenetics. 1992;35:51–3. doi: 10.1007/BF00216627. [DOI] [PubMed] [Google Scholar]
- 27.Morgenthau AS, Iannuzzi MC. Recent advances in sarcoidosis. Chest. 2011;139:174–82. doi: 10.1378/chest.10-0188. [DOI] [PubMed] [Google Scholar]
- 28.Sato H, Grutters JC, Pantelidis P, Mizzon AN, Ahmad T, Van Houte AJ, Lammers JW, Van Den Bosch JM, Welsh KI, Du Bois RM. HLA-DQB1*0201: a marker for good prognosis in British and Dutch patients with sarcoidosis. Am J Respir Cell Mol Biol. 2002;27:406–12. doi: 10.1165/rcmb.4782. [DOI] [PubMed] [Google Scholar]
- 29.Vasilopoulos Y, Sagoo GS, Cork MJ, Walters K, Tazi-Ahnini R. HLA-C, CSTA and DS12346 susceptibility alleles confer over 100-fold increased risk of developing psoriasis: evidence of gene interaction. J Hum Genet. 56(2011):423–7. doi: 10.1038/jhg.2011.33. [DOI] [PubMed] [Google Scholar]
- 30.Shaiq PA, Stuart PE, Latif A, Schmotzer C, Kazmi AH, Khan MS, Azam M, Tejasvi T, Voorhees JJ, Raja GK, Elder JT, Qamar R, Nair RP. Genetic Associations of Psoriasis in a Pakistani Population. Br J Dermatol. 2013;169:406–411. doi: 10.1111/bjd.12313. [DOI] [PMC free article] [PubMed] [Google Scholar]
Associated Data
This section collects any data citations, data availability statements, or supplementary materials included in this article.
Supplementary Materials
Supplemental Table 1. Patient age, gender, and disease activity, by healthy or disease group
Supplemental Figure 1. The fluorescence minus one (FMO) control (top row) and CD146 staining (bottom row) showing the gating strategy for sorting CD146+ cells.
Supplemental Figure 2. The percentage of fresh CD8+ CD146+ or CD146− T cells that express IL17 expressed as a percentage of the parent population (n=4).


