Abstract
Insulin deficiency drives the progression of both type 1 and type 2 diabetes. Pancreatic β-cell insulin expression and secretion are tightly regulated by nutrients and hormones; however, intracellular signaling proteins that mediate nutrient and hormonal regulation of insulin synthesis and secretion are not fully understood. SH2B1 is an SH2 domain-containing adaptor protein. It enhances the activation of the Janus tyrosine kinase 2 (JAK2)/signal transducer and activator of transcription and the phosphatidylinositol 3-kinase pathways in response to a verity of hormones, growth factors, and cytokines. Here we identify SH2B1 as a new regulator of insulin expression. In rat INS-1 832/13 β-cells, SH2B1 knockdown decreased, whereas SH2B1 overexpression increased, both insulin expression and glucose-stimulated insulin secretion. SH2B1-deficent islets also had reduced insulin expression, insulin content, and glucose-stimulated insulin secretion. Heterozygous deletion of SH2B1 decreased pancreatic insulin content and plasma insulin levels in leptin-deficient ob/ob mice, thus exacerbating hyperglycemia and glucose intolerance. In addition, overexpression of JAK2 increased insulin promoter activity, and SH2B1 enhanced the ability of JAK2 to activate the insulin promoter. Overexpression of SH2B1 also increased the expression of Pdx1 and the recruitment of Pdx1 to the insulin promoter in INS-1 832/13 cells, whereas silencing of SH2B1 had the opposite effects. Consistently, Pdx1 expression was lower in SH2B1-deficient islets. These data suggest that the SH2B1 in β-cells promotes insulin synthesis and secretion at least in part by enhancing activation of JAK2 and/or Pdx1 pathways in response to hormonal and nutritional signals.
Insulin is expressed in pancreatic β-cells and secreted into the bloodstream in response to secretagogues (ie, glucose, free fatty acids, amino acids, and incretins). Insulin controls glucose homeostasis by stimulating glucose uptake into skeletal muscle and adipose tissue and by suppressing hepatic glucose production. In type 1 diabetes, autoimmune destruction of pancreatic β-cells causes insulin deficiency, resulting in hyperglycemia and glucose intolerance. In contrast, type 2 diabetes progression is driven by insulin resistance. Insulin resistance is believed to promote compensatory insulin secretion (hyperinsulinemia), which counteracts insulin resistance. However, the capacity of compensatory insulin secretion is restrained by both genetic and environmental factors. Once compensatory hyperinsulinemia is inadequate to overcome insulin resistance (termed relative insulin deficiency), hyperglycemia, and glucose intolerance ensue, leading to frank type 2 diabetes. Therefore, impaired insulin biosynthesis and/or secretion plays a critical role in the pathogenesis of both type 1 and type 2 diabetes (1, 2).
We originally identified SH2B1 (also called SH2-B or PSM), a PH- and SH2 domain-containing adapter protein, as a Janus tyrosine kinase (JAK) 2-binding protein (3). JAK2 is a cytoplasmic tyrosine kinase that mediates cell signaling in response to a variety of hormones and cytokines, including leptin, GH, prolactin, and IL-6. The SH2B1 family contains 3 members: SH2B1, SH2B2 (also called APS), and SH2B3 (also called Lnk). The SH2B1 gene generates 4 isoforms (SH2B1α, -β, -γ, and -δ) via mRNA alternative spicing (4). SH2B1 binds to JAK2 via its SH2 domain and increases JAK2 catalytic activity, thereby enhancing activation of JAK2 signaling pathways (5–7). SH2B1 also binds to insulin and IGF-I receptors and enhances their signaling (8, 9). Furthermore, SH2B1 binds to insulin receptor substrates IRS1 and IRS2, two upstream activators of the phosphatidylinositol (PI) 3-kinase pathway, and promotes activation of the PI 3-kinase pathway (10, 11). We previously reported that disruption of the SH2B1 gene results in severe obesity and type 2 diabetes in mice (12–14). Neuronal SH2B1 enhances leptin sensitivity in the hypothalamus, and transgenic expression of recombinant SH2B1 specifically in the brain reverses leptin resistance and obesity phenotypes in SH2B1 knockout (KO) mice (15). In humans, SH2B1 single nucleotide polymorphisms, chromosomal deletion, and missense mutations have been reported to be linked to obesity and diabetes (16–28). Therefore, SH2B1 is a critical metabolic regulator in both rodents and humans, and SH2B1 deficiency and/or malfunction are risk factors for both obesity and type 2 diabetes.
SH2B1 is expressed in both central and peripheral tissues (3, 11). Unlike SH2B1 KO mice, which are obese, mice with SH2B1 deficiency specifically in peripheral tissues have normal leptin sensitivity and body weight (15), but they are still predisposed to high-fat diet–induced insulin resistance and glucose intolerance (11). These observations suggest that peripheral SH2B1 also plays an important role in regulating nutrient metabolism independently of central SH2B1 regulation of body weight. In agreement, hepatocyte-specific deletion of SH2B1 attenuates high-fat diet–induced hepatic steatosis and very-low-density lipoprotein secretion (29). We recently showed that SH2B1 is highly expressed in pancreatic β-cells and directly promotes islet expansion in the insulin-resistant state (30). In the current study, we report that SH2B1 cell-autonomously increases insulin promoter activity and insulin expression in β-cells, presumably by enhancing the activation of JAK2 and/or Pdx1 signaling pathways. Heterozygous deletion of SH2B1 markedly decreased insulin expression and secretion and exacerbated hyperglycemia and glucose intolerance in leptin-deficient ob/ob mice. Our data suggest that SH2B1 is an important intrinsic factor involved in mediating the compensatory β-cell adaptation to insulin resistance and/or cellular stress.
Materials and Methods
Animal models
SH2B1 KO and SH2B1 transgenic and knockout (TgKO) mice were generated and verified previously (14, 15). SH2B1 KO mice lack all 4 isoforms of SH2B1 (SH2B1α, -β, -γ, and -δ). TgKO mice lack endogenous SH2B1 but express SH2B1β transgenes specifically in neurons. SH2B1+/− mice were crossed with ob/+ mice (The Jackson Laboratory) to generate SH2B1 haploinsufficient, leptin-null compound mutant mice (SH2B1+/−;ob/ob, herein referred to as double knockout [DKO] mice).
All mice were maintained on a congenic C57BL/6 background and housed on a 12-hour light/12-hour dark cycle in the Unit for Laboratory Animal Medicine at the University of Michigan. Mice were fed a standard rodent chow diet (9% fat; Lab Diet) ad libitum with free access to water. Animal experiments were conducted following the animal protocols approved by the University Committee on Use and Care of Animals at the University of Michigan.
Body composition and O2 consumption
Fat content was measured by dual energy x-ray absorptiometry (Norland Medical Systems). Oxygen consumption was measured using the Comprehensive Laboratory Monitoring System (CLAMS; Columbus Instruments). In brief, mice were individually housed in metabolic chambers with free access to food and water. After 24 hours of acclimation, measurements were made continuously for 48 hours. O2 levels in each chamber were sampled for 5 seconds at 10-minute intervals. Oxygen consumption was normalized to lean body mass.
Glucose (GTTs) and insulin tolerance tests (ITTs)
For GTTs, mice were fasted overnight (∼16 hours) and intraperitoneally injected with d-glucose (ob/ob and DKO mice: 0.6 g/kg body weight). For ITTs, mice were fasted for 6 hours and injected with insulin (ob/ob and DKO mice: 4 U/kg body weight). Blood glucose levels were monitored after glucose or insulin injection.
Plasma insulin levels, insulin secretion, and total pancreatic insulin content
Tail blood samples were collected at the indicated times, and plasma insulin concentrations were measured using rat insulin ELISA kits (Crystal Chem Inc). Pancreata were harvested and homogenized in acid-ethanol (1.5% HCl in 70% EtOH) to extract total pancreatic insulin. Pancreatic insulin content was measured using rat insulin RIA kits (Linco Research) and normalized to pancreas weight.
Islet isolation
Male mice were euthanized under anesthesia. Pancreata were harvested, cut into small pieces, and incubated at 37°C for 25 minutes in Hanks' balanced salt solution (HBSS) (pH 7.4) supplemented with 5 mM glucose, 1 mg/mL collagenase P (Roche Diagnostics), and 0.1% BSA as described previously (31). Individual islets were hand-picked and cultured at 37°C and 5% CO2 for 1 day in RPMI 1640 medium supplemented with 10% fetal bovine serum, 100 IU/mL penicillin, and 100 μg/mL streptomycin.
Knockdown and overexpression of SH2B1 in INS-1 832/13 cells
INS-1 832/13 cells (a rat insulinoma cell line) were cultured at 37°C and 5% CO2 in RPMI 1640 medium supplemented with 10% fetal bovine serum and 50 μM β-mercaptoethanol as described previously (32). To knock down SH2B1, INS-1 832/13 cells were infected with SH2B1 short hairpin RNA (shRNA) (5′-CATCTGTGGTTCCAGTCCA-3′) or scramble shRNA (control) retroviral vectors. To overexpress SH2B1, INS-1 832/13 cells were infected with rat SH2B1β or empty (control) lentiviral vectors. Stable lines were generated through a puromycin selection.
Glucose-stimulated insulin secretion (GSIS) in islets and INS-1 832/13 cells
Twenty similarly sized islets were handpicked and incubated at 37°C in 200 μL of HBSS (pH 7.4) containing 0.1% BSA and 2.8 mM glucose for 1 hour, and medium was collected to measure basal insulin release. The islets were then incubated with fresh HBSS containing 16.7 mM glucose for an additional 1 hour, and medium was collected to measure GSIS. Islets were homogenized in lysis buffer (50 mM Tris HCl [pH 7.5], 0.5% Nonidet P-40, 150 mM NaCl, 2 mM EGTA, 1 mM Na3VO4, 100 mM NaF, 10 mM Na4P2O7, 1 mM phenylmethylsulfonyl fluoride, 10 μg/mL aprotinin, and 10 μg/mL leupeptin), and protein concentrations were measured. The islet extracts were then mixed with acid-ethanol (1.5% HCl in 70% EtOH) and used to measure islet insulin content. INS-1 832/13 cells were preincubated for 1 hour in HBSS containing 0.1% BSA and 2.8 mM glucose and then were incubated in HBSS containing either 2.8 mM (basal insulin secretion) or 16.7 mM glucose (GSIS) for an additional hour. Medium was collected to measure insulin secretion using RIA kits. Insulin secretion was normalized to either total protein levels or insulin content.
Immunoprecipitation, immunoblotting, and immunostaining
Mice were euthanized under anesthesia. Tissues were harvested, rapidly frozen in liquid nitrogen, and stored at −80°C until analysis. Tissue samples were homogenized in ice-cold lysis buffer (50 mM Tris HCl [pH 7.5], 0.5% Nonidet P-40, 150 mM NaCl, 2 mM EGTA, 1 mM Na3VO4, 100 mM NaF, 10 mM Na4P2O7, 1 mM phenylmethylsulfonyl fluoride, 10 μg/mL aprotinin, and 10 μg/mL leupeptin). Tissue extracts were immunoprecipitated and immunoblotted with the indicated antibodies. Frozen pancreatic sections (5–8 μm) were prepared from ob/ob or DKO mice at 15 to 16 weeks of age and immunostained with anti-insulin antibody (A0564; Dako) at 1:2000. Insulin-positive cells were visualized using a BX51 microscope equipped with a DP72 digital camera (Olympus), and β-cell areas were quantified using ImageJ software and normalized to total pancreatic section areas.
Real-time quantitative PCR (qPCR)
The procedures for qPCR were described previously (15). Primers were as follows: insulin 5′-GTCATTGTTTCAACATGGCCCTGT-3′ (forward) and 5′-TGCAGTAGTTCTCCAGCTGGTA-3′ (reverse); glucokinase 5′-GAAAAGATCATTGGCGGAAA-3′ (forward) and 5′-CCCAGAGTGCTCAGGATCTT-3′ (reverse); Glut2 5′-TCTTCACGGCTGTCTCTGTG-3′ (forward) and 5′-GAAGATGGCAGTCATGCTCA-3′ (reverse); Pdx15′-CCTTTCCCGTGGATGAAAT-3′ (forward) and 5′-TGTAGGCAGTACGGGTCCTC-3′ (reverse); and β-actin 5′-AAATCGTGCGTGACATCAAA-3′ (forward) and 5′-AAGGAAGGCTGGAAAAGAGC-3′ (reverse).
Luciferase reporter assays
Rat insulin promoter luciferase reporter plasmids and β-galactosidase reporter plasmids were transiently cotransfected with SH2B1, JAK2, and/or JAK2(K882E) expression plasmids into INS1 832/13 cells using polyethylenimine reagents. Cells were treated with 16.7 mM glucose 43 hours after transfection, and luciferase activity was measured 5 hours later using a luciferase assay system (Promega Corporation). Luciferase activity was normalized to β-galactosidase levels.
Chromatin immunoprecipitation (ChIP) assays
Confluent cells were washed with PBS, incubated with 1% formaldehyde for 10 minutes at 37°C, and washed with cold PBS twice. The cells were collected in 1 mL of cold PBS and centrifuged at 3000 rpm for 3 minutes at 4°C, mixed in 300 μL of lysis buffer (1% SDS, 10 mM EDTA, 50 mM Tris-HCl, 1 mM Na3VO4, 1 mM phenylmethylsulfonyl fluoride, 10 μg/mL aprotinin, and 10 μg/mL leupeptin [pH 8.1]) by vortexing and incubated on ice for 10 minutes. The cells were then subjected to sonication (Q800R Sonicator; Active Motif) to break genomic DNA into 500- to 1000-bp fragments. The samples were centrifuged at 14,000 rpm for 10 minutes at 4°C. The supernatants were divided into 3 aliquots: 130 μL for immunoprecipitation with antibody to Pdx1 (5679, Cell Signaling), 130 μL for immunoprecipitation with control IgG, and 20 μL as inputs. The supernatants were diluted 10 times with dilution buffer (1% Triton X-100, 2 mM EDTA, 150 mM NaCl, 1 mM Na3VO4, 1 mM phenylmethylsulfonyl fluoride, 10 μg/mL aprotinin, 10 μg/mL leupeptin, and 20 mM Tris-HCl [pH 8.1]), precleared with salmon sperm DNA (2 μl, 2 mg/mL) and protein A agarose beads and immunoprecipitated with the indicated antibodies overnight at 4°C. Precipitates were washed sequentially with buffer 1 (0.1% SDS, 1% Triton X-100, 2 mM EDTA, 150 mM NaCl, and 20 mM Tris-HCl [pH 8.1]), buffer 2 (0.1% SDS, 1% Triton X-100, 2 mM EDTA, 500 mM NaCl, and 20 mM Tris-HCl [pH 8.1]), buffer 3 (0.25 N LiCl, 1% Nonidet P-40, 1% deoxycholate, 1 mM EDTA, 150 mM NaCl, and 10 mM Tris-HCl [pH 8.1]), and buffer 4 (10 mM Tris-HCl and 1 mM EDTA [pH 8.1]). DNA was eluted with 100 μL of elution buffer (1% SDS and 0.1 M NaHCO3) at 65°C for 15 minutes and collected by centrifugation at 14,000 rpm for 2 minutes at room temperature, and 5 M NaCl (5 μL) was added into the supernatants and incubated at 65°C overnight to reverse protein-DNA crosslinking. Samples were incubated with proteinase K (1 μL, 10 mg/mL) at 45°C for 1 hour. DNA was extracted and used for qPCR analysis. Primers for qPCR were 5′-CTGGGAAATGAGGTGGAAAA-3′ (forward) and 5′-AGGAGGGGTAGGTAGGCAGA-3′ (reverse).
Statistical analysis
Data are presented as means ± SEM. Differences between groups were determined by two-tailed Student t tests. A value of P < .05 was considered statistically significant.
Results
Heterozygous deletion of SH2B1 decreased plasma insulin levels and exacerbated hyperglycemia and glucose intolerance in ob/ob mice
SH2B1 KO mice develop leptin resistance, obesity, and type 2 diabetes (7, 10, 13, 15). To determine whether SH2B1 regulates glucose metabolism by an additional leptin-independent mechanism, we attempted to generate SH2B1 and leptin DKO mice. Surprisingly, we were unable to obtain mice homozygous for both leptin-null and SH2B1-null alleles, and the cause of early death is unclear. We then generated ob/ob mice with SH2B1 haploinsufficiency (herein referred to as DKO mice). As expected, SH2B1 protein levels were 50% lower in DKO mice than in ob/ob mice (Figure 1A). Body weight (Figure 1B) and fat content (Figure 1C) were similar between DKO and ob/ob mice. We examined energy expenditure by measuring O2 consumption. Energy expenditure was lower in both DKO and ob/ob mice than in wild-type (WT) mice but was similar between DKO and ob/ob mice (Figure 1D). These data are consistent with the conclusion that neuronal SH2B1 regulates energy balance and body weight by enhancing leptin sensitivity (15).
Figure 1.
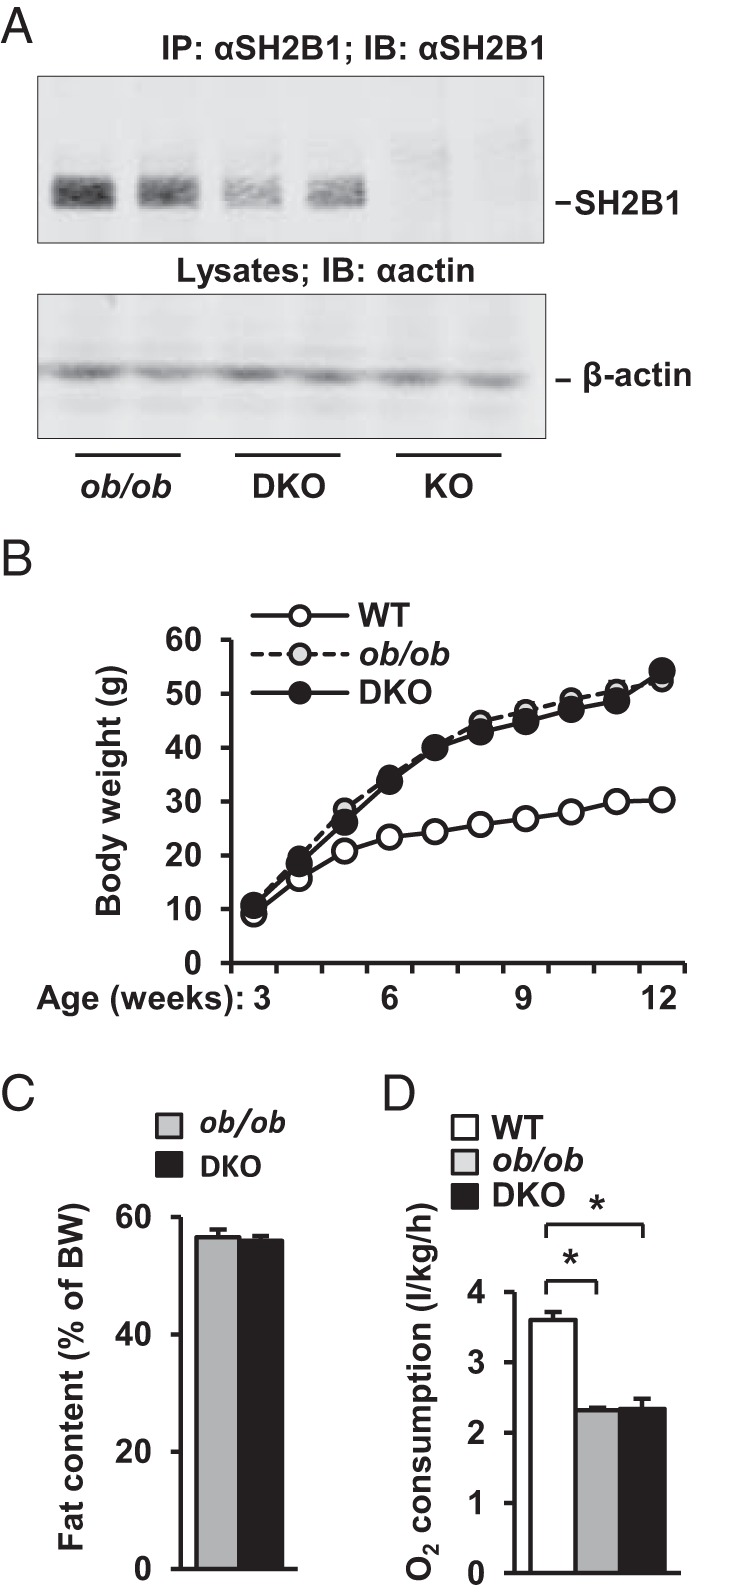
Heterozygous deletion of SH2B1 does not alter energy balance and adiposity in ob/ob mice. A, Liver extracts were immunoprecipitated (IP) and immunoblotted (IB) with anti-SH2B1 antibody. Liver extracts were also immunoblotted with anti-β-actin antibody. B, Growth curves of male mice (WT, n = 6–8; ob/ob, n = 8; DKO, n = 7–8). C, Fat content in male mice (10 weeks of age) was determined by dual energy x-ray absorptiometry (ob/ob, n = 5; DKO, n = 8). D, O2 consumption (normalized to body weight [BW]) in males (15 weeks of age) (WT, n = 4; ob/ob, n = 6; DKO, n = 6). Data are expressed as means ± SEM. *, P < .05.
To determine whether SH2B1 is able to regulate glucose metabolism independently of leptin and adiposity, we measured blood glucose and insulin levels and performed GTTs and ITTs. Compared with WT mice, both DKO and ob/ob mice developed hyperglycemia and hyperinsulinemia (Figure 2A). However, fasting blood glucose levels were 155% higher in DKO than in ob/ob mice, whereas plasma insulin levels were not different (Figure 2A). We further measured blood glucose and plasma insulin in fed mice. Again, both DKO and ob/ob mice were hyperglycemic compared with WT mice (Figure 2B). DKO mice displayed 37% higher glucose levels than ob/ob mice; surprisingly, plasma insulin levels were 78% lower in DKO mice than in ob/ob mice (Figure 2B). In ob/ob mice, plasma insulin levels were ∼5-fold higher in the fed state than in the fasted state (fed: 23.2 ± 6.8 ng/mL, n = 5; fasted: 4.7 ± 0.3 ng/mL, n = 9; P = .0026); in contrast, in DKO mice, plasma insulin levels were similar between the fasted and the fed states (fasted: 4.9 ± 0.4 ng/mL, n = 9; fed: 5.0 ± 1.3 ng/mL, n = 5; P = .9). These data indicate that SH2B1 deficiency disrupts the blood insulin response to a fasted-fed state switch in obese mice. Accordingly, DKO mice displayed more severe glucose intolerance than ob/ob mice (Figure 2C). In ITTs, insulin injection increased blood glucose levels in both DKO and ob/ob mice (Figure 2D), presumably due to injection-induced stress as well as severe insulin resistance. These data indicate that in leptin-deficient obese mice, SH2B1 is required for insulin secretion in the fed state.
Figure 2.
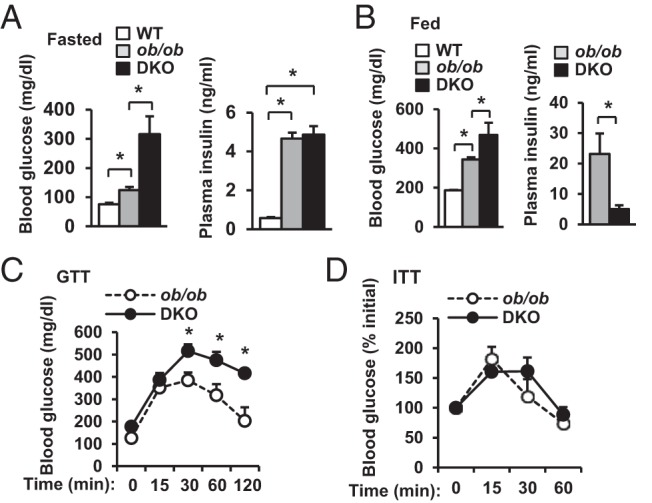
Heterozygous deletion of SH2B1 decreases plasma insulin levels and exacerbates hyperglycemia and glucose intolerance in ob/ob mice. A, Fasting (∼16 hours) blood glucose and plasma insulin in male mice (12 weeks of age) (WT, n = 3–9; ob/ob, n = 9; DKO, n = 7–9). B, Randomly fed blood glucose and plasma insulin in male mice (12 weeks of age) (WT, n = 6; ob/ob, n = 5–6; DKO, n = 5–10). C, GTTs were performed in fasted (16 hours) male mice (9–10 weeks of age) (ob/ob, n = 7; DKO, n = 7). D, ITTs were performed in male mice at 12 to 14 weeks of age (ob/ob, n = 7; DKO, n = 8). Data are expressed as means ± SEM. *, P < .05.
SH2B1-deficient islets have reduced insulin expression and GSIS
To determine whether SH2B1 regulates insulin production, we harvested pancreata and measured pancreatic insulin content. Total pancreatic insulin content was 69% lower in DKO mice than in ob/ob mice (Figure 3A). We also examined β-cell mass by immunostaining pancreatic sections with anti-insulin antibody. β-Cell areas were similar between ob/ob and DKO mice (Figure 3B). These data suggest that reduction in pancreatic insulin content in DKO mice is probably due to decreased insulin synthesis in β-cells. To estimate insulin levels in β-cells, we crossed SH2B1 transgenic (Tg) mice, which express a SH2B1β transgene under the control of the neuronal enolase promoter (15), with SH2B1 KO mice to generate TgKO mice. TgKO mice express recombinant SH2B1β specifically in the brain but lack endogenous SH2B1 in all tissues (15). We purified SH2B1-deficient islets from TgKO mice and measured islet insulin content. β-Cell insulin content was significantly lower in TgKO mice than in WT mice (Figure 3C). We also measured the abundance of total insulin mRNA transcribed from both insulin 1 and insulin 2 promoters by qPCR. Insulin expression was significantly lower in the islets of TgKO mice (Figure 3D). To determine whether reduced insulin expression in SH2B1-deficient islets impairs GSIS, we measured insulin secretion from islets in the presence of 2.8 or 16.7 mM d-glucose. Glucose stimulated robust insulin secretion from WT islets, but GSIS from the islets of TgKO mice was impaired (Figure 3E, left panels). However, after normalization to insulin content, GSIS from SH2B1-deficient islets was slightly higher (no statistical significance, P = .4). The expression of islet glucokinase and Glut2 was similar between WT and TgKO mice (Figure 3F). These data suggest that SH2B1 in β-cells is dispensable for glucose sensing and insulin granule exocytosis. Taken together, these results suggest that SH2B1 in β-cells is able to promote insulin synthesis and secretion in mice.
Figure 3.
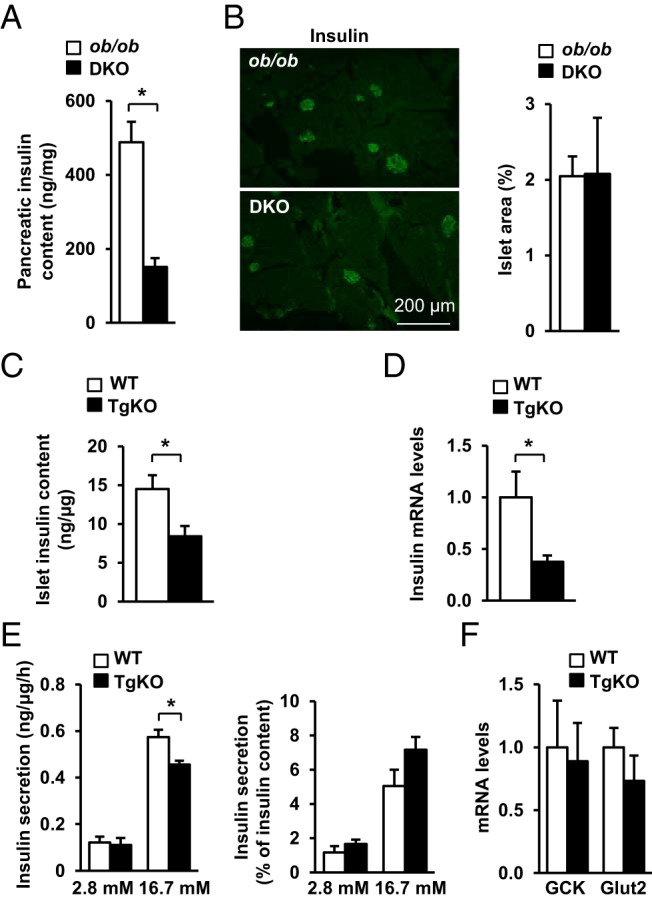
SH2B1 promotes insulin expression and secretion in mice. A, Pancreatic insulin content in fasted (16 hours) male mice (15–16 weeks of age) (ob/ob, n = 8; DKO, n = 8). B, Frozen pancreatic sections were immunostained with an anti-insulin antibody. Insulin-positive cell areas were quantified and normalized to total pancreatic section areas (ob/ob, n = 5; DKO, n = 4). C, Islets were isolated from male mice (10–12 weeks of age), and insulin content was measured and normalized to islet protein levels (WT, n = 7; TgKO, n = 5). D, Islets were isolated from male mice (7–8 weeks of age). Islet insulin expression was measured by qPCR and normalized to β-actin expression (WT, n = 5; TgKO, n = 5). E, Islets were isolated from male mice (10–12 weeks of age) and incubated in medium containing either 2.8 or 16.7 mM glucose. Insulin secretion was measured and normalized to islet protein levels or islet insulin content, respectively (WT, n = 5; TgKO, n = 3). F, Expression of glucokinase and Glut2 in islets was measured by qPCR and normalized to β-actin expression (WT, n = 5; TgKO, n = 5). Data are expressed as means ± SEM. *, P < .05.
SH2B1 cell-autonomously increases insulin expression in β-cells
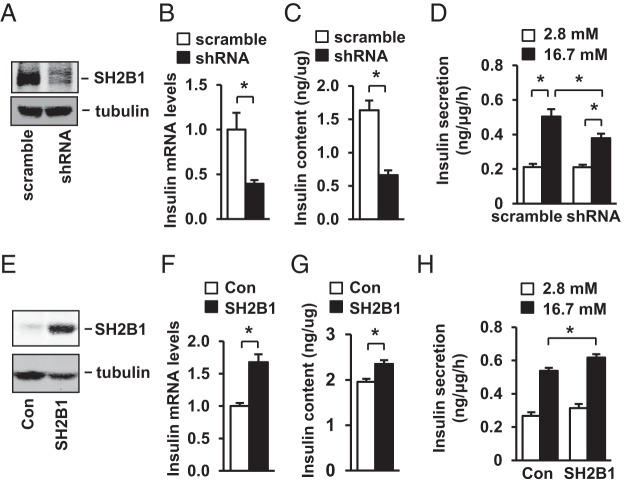
To determine whether SH2B1 promotes insulin expression in β-cells, we knocked down SH2B1 in rat INS-1 832/13 β-cells using shRNA retroviral vectors (Figure 4A). Silencing of SH2B1 significantly decreased insulin mRNA abundance (Figure 4B), insulin protein levels (Figure 4C), and GSIS (Figure 4D). To determine whether SH2B1 overexpression in β-cells has the opposite effects, we stably introduced rat SH2B1β into INS-1 832/13 cells (Figure 4E). SH2B1 overexpression increased insulin mRNA levels (Figure 4F), insulin content (Figure 4G), and GSIS (Figure 4H). Collectively, these data suggest that SH2B1 in β-cells promotes insulin secretion at least in part by increasing insulin expression.
Figure 4.
SH2B1 cell-autonomously promotes insulin synthesis in INS-1 832/13 cells. A–D, INS-1 832/13 cells were infected with SH2B1 shRNA or scramble retroviral vectors to generate stable lines. A, SH2B1 in cell extracts was immunoprecipitated and immunoblotted with anti-SH2B1 antibody. Cell extracts were also immunoblotted with anti-β-tubulin antibody. B, Insulin expression was measured by qPCR and normalized to β-actin expression (scramble, n = 5; shRNA, n = 4). C, Insulin content was measured and normalized to total protein levels (scramble, n = 11; shRNA, n = 12). D, Insulin secretion in cells treated with 2.8 or 16.7 mM glucose for 1 hour (2.8 mM, n = 6; 16.7 mM, n = 5–6). E–H, INS-1 832/13 cells were infected with SH2B1 or empty lentiviral vectors to generate stable cell lines. E, Cell extracts were immunoblotted with anti-SH2B1 and anti-β-tubulin antibodies. F–H, Insulin expression (control [Con], n = 6; SH2B1, n = 6), insulin content (Con, n = 12; SH2B1, n = 12), and insulin secretion (2.8 mM, n = 4; 16.7 mM, n = 6–8) were measured in stable cell lines. Data are expressed as means ± SEM. *, P < .05.
SH2B1 increases JAK2 signaling and insulin promoter activity in β-cells
To gain insights into the molecular mechanism of SH2B1 action in β-cells, we examined the effect of SH2B1 on JAK2 activation. JAK2 is expressed in β-cells (33). GH rapidly stimulated phosphorylation of JAK2 in INS-1 832/13 cells, and silencing of SH2B1 significantly attenuated GH-stimulated phosphorylation of JAK2 (Figure 5A). Conversely, overexpression of SH2B1 increased GH-stimulated phosphorylation of JAK2 (Figure 5B).
Figure 5.
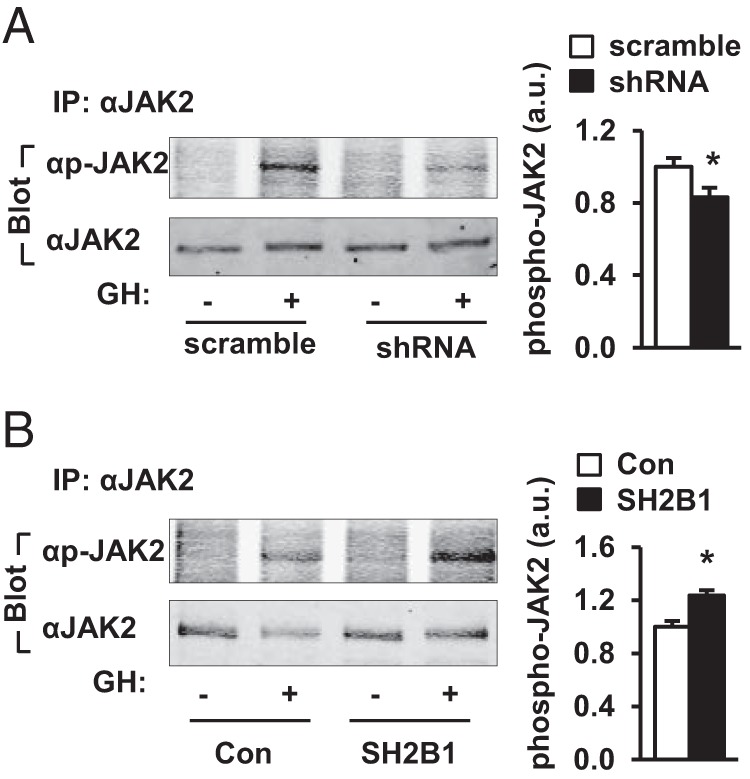
SH2B1 promotes JAK2 signaling in β-cells. INS-1 832/13 cells were infected with SH2B1 shRNA or scramble retroviral vectors to generate stable lines. A, INS-1 832/13 cells were deprived of serum overnight and stimulated with 500 ng/mL GH for 15 minutes. JAK2 in cell extracts was immunoprecipitated (IP) with anti-JAK2 antibody and immunoblotted with anti-phospho (p)-JAK2 (pTyr1007/1008) or anti-JAK2 antibodies. GH-stimulated JAK2 phosphorylation was quantified and normalized to total JAK2 levels (scramble, n = 6; shRNA, n = 6). a.u., arbitrary units. B, SH2B1-overexpressing INS-1 832/13 cells were deprived of serum overnight and stimulated with 500 ng/mL GH for 15 minutes. JAK2 in cell extracts was immunoprecipitated with anti-JAK2 antibody and immunoblotted with anti-phospho-JAK2 or anti-JAK2 antibodies. GH-stimulated JAK2 phosphorylation was quantified and normalized to total JAK2 levels (Con, n = 3; SH2B1, n = 3). Data are expressed as means ± SEM. *, P < .05.
To determine whether SH2B1 increases insulin promoter activity, SH2B1 expression plasmids were transiently cotransfected with rat insulin promoter luciferase reporter constructs into INS-1 832/13 cells, and luciferase activity was measured to estimate insulin promoter activity. SH2B1 dose-dependently increased insulin promoter activity (Figure 6A). JAK2 also dose-dependently increased insulin promoter activity in β-cells (Figure 6B). Moreover, SH2B1 and JAK2 acted synergistically to stimulate insulin promoter activity (Figure 6C). In contrast, kinase-inactive JAK2(K882E) was unable to activate the insulin promoter (Figure 6D). Moreover, JAK2(K882E) blocked the ability of SH2B1 to increase insulin promoter activity (Figure 6D), presumably by functioning as a dominant-negative mutant. These data suggest that SH2B1 promotes insulin expression in β-cells at least in part by enhancing JAK2 signaling in response to hormonal signals.
Figure 6.
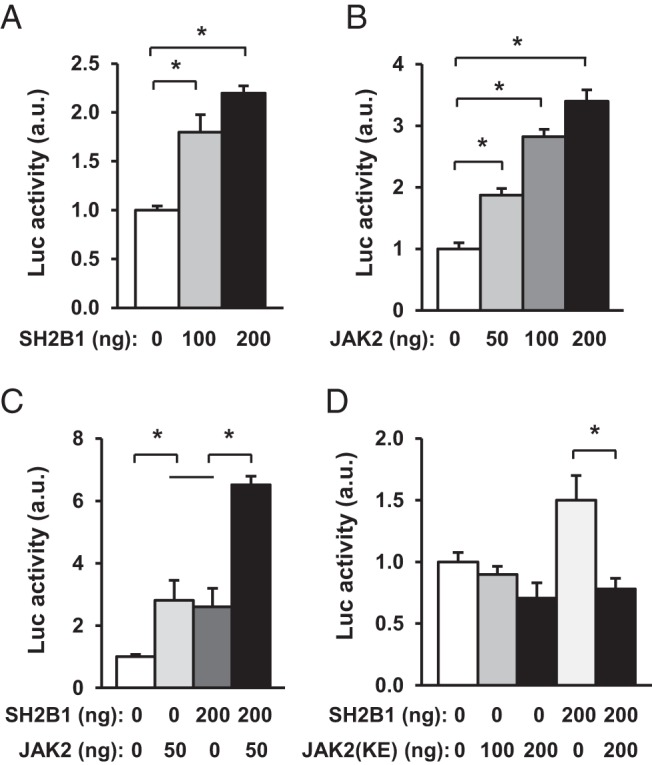
SH2B1 enhances the ability of JAK2 to activate the insulin promoter. A and B, Rat insulin promoter luciferase (Luc) reporter plasmids were cotransfected with SH2B1 or JAK2 plasmids into INS-1 832/13 cells. Luciferase activity was measured 48 hours after transfection (n = 4–6). C, Rat insulin promoter luciferase reporter plasmids were cotransfected into INS-1 832/13 cells with SH2B1 and JAK2 plasmids as indicated, and luciferase activity was measured 48 hours later (n = 4). D, Rat insulin promoter luciferase reporter plasmids were cotransfected into INS-1 832/13 cells with JAK2(K882E) or both JAK2(K882E) and SH2B1 as indicated. Luciferase activity was measured 48 hours after transfection (n = 4). Data are expressed as means ± SEM. *, P < .05. a.u., arbitrary units.
SH2B1 increases Pdx1 expression and the recruitment of Pdx1 to the insulin promoter in β-cells
Pdx1 is an important transcription factor that activates the insulin promoter and stimulates insulin expression in β-cells (34–38). To determine whether Pdx1 is involved in SH2B1 action, we measured Pdx1 expression in INS-1 832/13 cells. Silencing of SH2B1 decreased the expression of Pdx1 (Figure 7A); conversely, overexpression of SH2B1 increased Pdx1 expression (Figure 7B). In agreement, Pdx1 expression in islets was also lower in TgKO than in WT mice (Figure 7C). To determine whether SH2B1 increases the recruitment of Pdx1 to the insulin promoter, we measured the abundance of insulin promoter-bound Pdx1 in INS-1 832/13 cells using ChIP assays. Insulin promoter DNA was detected in anti-Pdx1 antibody but not IgG precipitates (Figure 7D). Silencing of SH2B1 significantly decreased the amount of insulin promoter-bound Pdx1 (Figure 7E); in contrast, overexpression of SH2B1 significantly increased the abundance of insulin promoter–bound Pdx1 (Figure 7F). These data suggest that Pdx1 is involved in mediating SH2B1 stimulation of insulin expression in β-cells.
Figure 7.
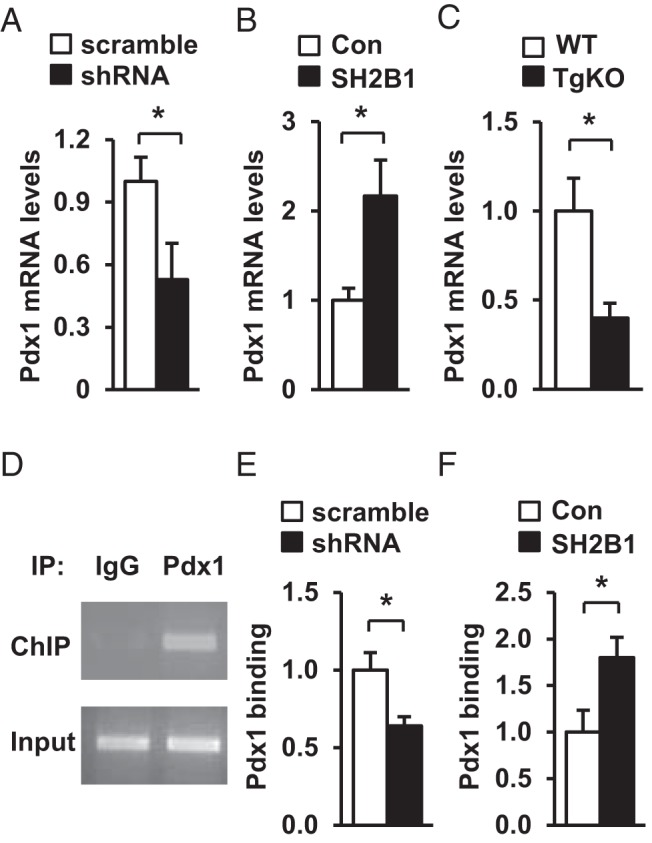
SH2B1 enhances Pdx1 expression and Pdx1 binding to the insulin promoter. A and B, Pdx1 expression in INS-1 832/13 cells with knockdown (A) or overexpression of SH2B1 (B) was measured by qPCR and normalized to β-actin expression (scramble, n = 6; shRNA, n = 6; Con, n = 6; SH2B1, n = 6). C, Islet Pdx1 expression was measured in WT and TgKO mice (7–8 weeks) by qPCR (WT, n = 5; TgKO, n = 5). D, Representative ChIP assay image. Insulin promoter DNA was visualized using ethidium bromide. E and F, ChIP assays were performed in INS-1 832/13 cells with knockdown (E) or overexpression (F) of SH2B1. Recruitment of Pdx1 to the insulin promoter was quantified by qPCR and normalized to scramble (E) or Con (F) groups, respectively (scramble, n = 3; shRNA, n = 3; Con, n = 4; SH2B1, n = 4). Data are expressed as means ± SEM. *, P < .05.
Discussion
Insulin expression is controlled by complex neuronal and hormonal signals and through many intracellular signaling pathways. Defects in these pathways lead to impairment in insulin synthesis and secretion, thus contributing to insulin deficiency, hyperglycemia, and glucose intolerance in diabetes. We recently reported that SH2B1 is highly expressed in β-cells and promotes β-cell expansion in part by enhancing the activation of the PI 3-kinase pathway (30). In the current study, we extend the previous findings by demonstrating that SH2B1 in β-cells also promotes insulin expression.
We provided multiple lines of evidence showing that SH2B1 cell-autonomously promoted insulin expression in β-cells. In INS-1 832/13 β-cells, overexpression of SH2B1 stimulated insulin promoter activity and increased the expression of the endogenous insulin gene; conversely, knockdown of SH2B1 had the opposite effects. Accordingly, SH2B1 overexpression augmented whereas SH2B1 knockout attenuated GSIS. Like INS-1 832/13 β-cells, islets with SH2B1-deficiency also had lower levels of insulin expression, insulin content, and GSIS. In agreement, pancreatic insulin content was lower in DKO mice with SH2B1 haploinsufficiency, although islet areas were similar between ob/ob and DKO mice. These data suggest that reduced pancreatic insulin content in DKO mice is largely due to decreased insulin expression rather than reduced β-cell mass. Unlike ob/ob mice, DKO mice were unable to secrete insulin in response to a fasted-to-fed state switch, leading to exacerbated hyperglycemia and glucose intolerance. The data suggest that under leptin-deficient and/or obesity conditions, a decrease in SH2B1 expression in β-cells impairs insulin expression and secretion, thus contributing to hyperglycemia and glucose intolerance.
SH2B1 stimulates insulin expression in β-cells at least in part by enhancing JAK2 activation. SH2B1 potently enhances the activation of the JAK/signal transducer and activator of transcription pathways in response to multiple hormones and cytokines in multiple cell types (3, 5, 7, 39). In agreement, overexpression of SH2B1 augmented whereas silencing of SH2B1 attenuated GH-stimulated tyrosine phosphorylation of JAK2 in INS-1 832/13 β-cells. Overexpression of WT JAK2 but not of kinase-dead JAK2(K882E) activated the insulin promoter in β-cells, suggesting that JAK2 activation promotes insulin expression. SH2B1 dose-dependently increased insulin promoter activity, and overexpression of SH2B1 further enhanced the ability of JAK2 to activate the insulin promoter. Moreover, kinase-dead JAK2(K882E) acted as a dominant negative to attenuate SH2B1 stimulation of insulin promoter activity. JAK2 mediates cell signaling in response to multiple hormones and cytokines, including GH, prolactin, and IL-6 (40). It is intriguing to hypothesize that SH2B1 in β-cells enhances the ability of these factors to promote insulin expression and secretion by enhancing JAK2 signaling.
Pdx1 is also likely to be involved in mediating SH2B1-induced insulin expression in β-cells. The expression of Pdx1 was lower in SH2B1-deficient islets. Silencing of SH2B1 decreased both the expression of Pdx1 and the recruitment of Pdx1 to the insulin promoter in INS-1 832/13 β-cells; conversely, overexpression of SH2B1 had the opposite effects. Mice with Pdx1 haploinsufficiency (fed a normal chow diet) have relatively normal insulin expression (41), suggesting that a modest reduction in Pdx1 levels does not alter insulin transcription under normal conditions. However, under insulin resistance conditions with an increased demand for insulin expression and secretion, a reduction in Pdx1 levels may have a greater negative impact on insulin expression and secretion. Consistent with this idea, heterozygous deletion of SH2B1 markedly decreased insulin expression and secretion in ob/ob mice with severe insulin resistance.
We recently reported that SH2B1 directly promotes β-cell survival, proliferation, and expansion (30). Insulin has been reported to promote β-cell survival and expansion in an autocrine/paracrine fashion (42). Our current data raise the possibility that SH2B1 in β-cells may also promote β-cell expansion indirectly by increasing insulin expression and secretion. Moreover, Pdx1 promotes β-cell survival and proliferation (43); therefore, SH2B1 may also promote β-cell expansion by increasing Pdx1 expression in addition to enhancing the activation of the PI 3-kinase pathway.
In summary, we show that SH2B1 in β-cells promotes insulin expression and secretion. A decrease in SH2B1 expression impairs insulin synthesis and secretion, leading to decreased blood insulin levels, increased blood glucose levels, and exacerbated glucose intolerance in ob/ob mice. SH2B1 enhances JAK2 activation and the ability of JAK2 to stimulate insulin promoter activity in β-cells. It also increases the expression of Pdx1 and the recruitment of Pdx1 to the insulin promoter. Therefore, SH2B1 in β-cells may serve as a new therapeutic target for the treatment of diabetes.
Acknowledgments
We thank Drs Decheng Ren and Larry Argetsinger and Suqing Wang for their helpful discussions. We thank Dr Christin Carter-Su (University of Michigan) for providing GH and Dr Christopher Newgard (Duke University) for providing INS-1 832/13 cells.
This study was supported by National Institutes of Health (NIH) Grants DK065122, DK091591, and DK094014. This work used cores supported by the Michigan Diabetes Research and Training Center (funded by NIH Grant 5P60 DK20572), the University of Michigan Cancer Center (funded by NIH Grant 5 P30 CA46592), the University of Michigan Nathan Shock Center (funded by NIH Grant P30AG013283), and the University of Michigan Gut Peptide Research Center (funded by NIH Grant DK34933).
Z.C. and L.R. conceived and designed the experiments. Z.C., D.L.M., L.J., and Y.L. prepared reagents and performed the experiments. Z.C., D.L.M., and L.R. wrote the manuscript. Z.C., D.L.M., L.J., Y.L., and L.R. edited the manuscript.
Disclosure Summary: The authors have nothing to disclose.
Footnotes
- ChIP
- chromatin immunoprecipitation
- DKO
- double knockout
- GSIS
- glucose-stimulated insulin secretion
- GTT
- glucose tolerance test
- HBSS
- Hanks' balanced salt solution
- ITT
- insulin tolerance test
- JAK2
- Janus tyrosine kinase 2
- KO
- knockout
- qPCR
- quantitative PCR
- PI
- phosphatidylinositol
- shRNA
- short hairpin RNA
- TgKO
- SH2B1 transgenic and knockout
- WT
- wild-type.
References
- 1. Marchetti P, Lupi R, Del Guerra S, Bugliani M, Marselli L, Boggi U. The β-cell in human type 2 diabetes. Adv Exp Med Biol. 2010;654:501–514 [DOI] [PubMed] [Google Scholar]
- 2. Prentki M, Nolan CJ. Islet β cell failure in type 2 diabetes. J Clin Invest. 2006;116:1802–1812 [DOI] [PMC free article] [PubMed] [Google Scholar]
- 3. Rui L, Mathews LS, Hotta K, Gustafson TA, Carter-Su C. Identification of SH2-Bβ as a substrate of the tyrosine kinase JAK2 involved in growth hormone signaling. Mol Cell Biol. 1997;17:6633–6644 [DOI] [PMC free article] [PubMed] [Google Scholar]
- 4. Yousaf N, Deng Y, Kang Y, Riedel H. Four PSM/SH2-B alternative splice variants and their differential roles in mitogenesis. J Biol Chem. 2001;276:40940–40948 [DOI] [PubMed] [Google Scholar]
- 5. Rui L, Carter-Su C. Identification of SH2-Bβ as a potent cytoplasmic activator of the tyrosine kinase Janus kinase 2. Proc Natl Acad Sci USA. 1999;96:7172–7177 [DOI] [PMC free article] [PubMed] [Google Scholar]
- 6. Kurzer JH, Argetsinger LS, Zhou YJ, Kouadio JL, O'Shea JJ, Carter-Su C. Tyrosine 813 is a site of JAK2 autophosphorylation critical for activation of JAK2 by SH2-Bβ. Mol Cell Biol. 2004;24:4557–4570 [DOI] [PMC free article] [PubMed] [Google Scholar]
- 7. Li Z, Zhou Y, Carter-Su C, Myers MG, Jr, Rui L. SH2B1 enhances leptin signaling by both Janus kinase 2 Tyr813 phosphorylation-dependent and -independent mechanisms. Mol Endocrinol. 2007;21:2270–2281 [DOI] [PubMed] [Google Scholar]
- 8. Wang J, Riedel H. Insulin-like growth factor-I receptor and insulin receptor association with a Src homology-2 domain-containing putative adapter. J Biol Chem. 1998;273:3136–3139 [DOI] [PubMed] [Google Scholar]
- 9. Nelms K, O'Neill TJ, Li S, Hubbard SR, Gustafson TA, Paul WE. Alternative splicing, gene localization, and binding of SH2-B to the insulin receptor kinase domain. Mamm Genome. 1999;10:1160–1167 [DOI] [PubMed] [Google Scholar]
- 10. Duan C, Li M, Rui L. SH2-B promotes insulin receptor substrate 1 (IRS1)- and IRS2-mediated activation of the phosphatidylinositol 3-kinase pathway in response to leptin. J Biol Chem. 2004;279:43684–43691 [DOI] [PMC free article] [PubMed] [Google Scholar]
- 11. Morris DL, Cho KW, Zhou Y, Rui L. SH2B1 enhances insulin sensitivity by both stimulating the insulin receptor and inhibiting tyrosine dephosphorylation of insulin receptor substrate proteins. Diabetes. 2009;58:2039–2047 [DOI] [PMC free article] [PubMed] [Google Scholar]
- 12. Li M, Ren D, Iseki M, Takaki S, Rui L. Differential role of SH2-B and APS in regulating energy and glucose homeostasis. Endocrinology. 2006;147:2163–2170 [DOI] [PubMed] [Google Scholar]
- 13. Ren D, Li M, Duan C, Rui L. Identification of SH2-B as a key regulator of leptin sensitivity, energy balance, and body weight in mice. Cell Metab. 2005;2:95–104 [DOI] [PubMed] [Google Scholar]
- 14. Duan C, Yang H, White MF, Rui L. Disruption of the SH2-B gene causes age-dependent insulin resistance and glucose intolerance. Mol Cell Biol. 2004;24:7435–7443 [DOI] [PMC free article] [PubMed] [Google Scholar]
- 15. Ren D, Zhou Y, Morris D, Li M, Li Z, Rui L. Neuronal SH2B1 is essential for controlling energy and glucose homeostasis. J Clin Invest. 2007;117:397–406 [DOI] [PMC free article] [PubMed] [Google Scholar]
- 16. Bauer F, Elbers CC, Adan RA, et al. Obesity genes identified in genome-wide association studies are associated with adiposity measures and potentially with nutrient-specific food preference. Am J Clin Nutr. 2009;90:951–959 [DOI] [PubMed] [Google Scholar]
- 17. Hester JM, Wing MR, Li J, et al. Implication of European-derived adiposity loci in African Americans. Int J Obes (Lond). 2012;36:465–473 [DOI] [PMC free article] [PubMed] [Google Scholar]
- 18. Hotta K, Kitamoto T, Kitamoto A, et al. Computed tomography analysis of the association between the SH2B1 rs7498665 single-nucleotide polymorphism and visceral fat area. J Hum Genet. 2011;56:716–719 [DOI] [PubMed] [Google Scholar]
- 19. Ng MC, Tam CH, So WY, et al. Implication of genetic variants near NEGR1, SEC16B, TMEM18, ETV5/DGKG, GNPDA2, LIN7C/BDNF, MTCH2, BCDIN3D/FAIM2, SH2B1, FTO, MC4R, and KCTD15 with obesity and type 2 diabetes in 7705 Chinese. J Clin Endocrinol Metab. 2010;95:2418–2425 [DOI] [PubMed] [Google Scholar]
- 20. Prudente S, Morini E, Larmon J, et al. The SH2B1 obesity locus is associated with myocardial infarction in diabetic patients and with NO synthase activity in endothelial cells. Atherosclerosis. 2011;219:667–672 [DOI] [PMC free article] [PubMed] [Google Scholar]
- 21. Renström F, Payne F, Nordström A, et al. Replication and extension of genome-wide association study results for obesity in 4923 adults from northern Sweden. Hum Mol Genet. 2009;18:1489–1496 [DOI] [PMC free article] [PubMed] [Google Scholar]
- 22. Sandholt CH, Vestmar MA, Bille DS, et al. Studies of metabolic phenotypic correlates of 15 obesity associated gene variants. PLoS One. 2011;6:e23531. [DOI] [PMC free article] [PubMed] [Google Scholar]
- 23. Shi J, Long J, Gao YT, et al. Evaluation of genetic susceptibility loci for obesity in Chinese women. Am J Epidemiol. 2010;172:244–254 [DOI] [PMC free article] [PubMed] [Google Scholar]
- 24. Speliotes EK, Willer CJ, Berndt SI, et al. Association analyses of 249,796 individuals reveal 18 new loci associated with body mass index. Nat Genet. 2010;42:937–948 [DOI] [PMC free article] [PubMed] [Google Scholar]
- 25. Takeuchi F, Yamamoto K, Katsuya T, et al. Association of genetic variants for susceptibility to obesity with type 2 diabetes in Japanese individuals. Diabetologia. 2011;54:1350–1359 [DOI] [PubMed] [Google Scholar]
- 26. Willer CJ, Speliotes EK, Loos RJ, et al. Six new loci associated with body mass index highlight a neuronal influence on body weight regulation. Nat Genet. 2009;41:25–34 [DOI] [PMC free article] [PubMed] [Google Scholar]
- 27. Bochukova EG, Huang N, Keogh J, et al. Large, rare chromosomal deletions associated with severe early-onset obesity. Nature. 2010;463:666–670 [DOI] [PMC free article] [PubMed] [Google Scholar]
- 28. Doche ME, Bochukova EG, Su HW, et al. Human SH2B1 mutations are associated with maladaptive behaviors and obesity. J Clin Invest. 2012;122:4732–4736 [DOI] [PMC free article] [PubMed] [Google Scholar]
- 29. Sheng L, Liu Y, Jiang L, et al. Hepatic SH2B1 and SH2B2 regulate liver lipid metabolism and VLDL secretion in mice. PLoS One. 2013;8:e83269. [DOI] [PMC free article] [PubMed] [Google Scholar]
- 30. Chen Z, Morris DL, Jiang L, Liu Y, Rui L. SH2B1 in β-cells regulates glucose metabolism by promoting β-cell survival and islet expansion. Diabetes. 2014;63:585–595 [DOI] [PMC free article] [PubMed] [Google Scholar]
- 31. Chen L, Koh DS, Hille B. Dynamics of calcium clearance in mouse pancreatic β-cells. Diabetes. 2003;52:1723–1731 [DOI] [PubMed] [Google Scholar]
- 32. Hohmeier HE, Mulder H, Chen G, Henkel-Rieger R, Prentki M, Newgard CB. Isolation of INS-1-derived cell lines with robust ATP-sensitive K+ channel-dependent and -independent glucose-stimulated insulin secretion. Diabetes. 2000;49:424–430 [DOI] [PubMed] [Google Scholar]
- 33. Sorenson RL, Stout LE. Prolactin receptors and JAK2 in islets of Langerhans: an immunohistochemical analysis. Endocrinology. 1995;136:4092–4098 [DOI] [PubMed] [Google Scholar]
- 34. Glick E, Leshkowitz D, Walker MD. Transcription factor BETA2 acts cooperatively with E2A and PDX1 to activate the insulin gene promoter. J Biol Chem. 2000;275:2199–2204 [DOI] [PubMed] [Google Scholar]
- 35. Babu DA, Chakrabarti SK, Garmey JC, Mirmira RG. Pdx1 and BETA2/NeuroD1 participate in a transcriptional complex that mediates short-range DNA looping at the insulin gene. J Biol Chem. 2008;283:8164–8172 [DOI] [PMC free article] [PubMed] [Google Scholar]
- 36. Zhang SS, Hao E, Yu J, et al. Coordinated regulation by Shp2 tyrosine phosphatase of signaling events controlling insulin biosynthesis in pancreatic β-cells. Proc Natl Acad Sci USA. 2009;106:7531–7536 [DOI] [PMC free article] [PubMed] [Google Scholar]
- 37. Han SI, Yasuda K, Kataoka K. ATF2 interacts with β-cell-enriched transcription factors, MafA, Pdx1, and β2, and activates insulin gene transcription. J Biol Chem. 2011;286:10449–10456 [DOI] [PMC free article] [PubMed] [Google Scholar]
- 38. Bastidas M, Showalter SA. Thermodynamic and structural determinants of differential Pdx1 binding to elements from the insulin and IAPP promoters. J Mol Biol. 2013;425:3360–3377 [DOI] [PMC free article] [PubMed] [Google Scholar]
- 39. Li M, Li Z, Morris DL, Rui L. Identification of SH2B2β as an inhibitor for SH2B1- and SH2B2alpha-promoted Janus kinase-2 activation and insulin signaling. Endocrinology. 2007;148:1615–1621 [DOI] [PMC free article] [PubMed] [Google Scholar]
- 40. Carter-Su C, Rui L, Herrington J. Role of the tyrosine kinase JAK2 in signal transduction by growth hormone. Pediatr Nephrol. 2000;14:550–557 [DOI] [PubMed] [Google Scholar]
- 41. Brissova M, Shiota M, Nicholson WE, et al. Reduction in pancreatic transcription factor PDX-1 impairs glucose-stimulated insulin secretion. J Biol Chem. 2002;277:11225–11232 [DOI] [PubMed] [Google Scholar]
- 42. Mehran AE, Templeman NM, Brigidi GS, et al. Hyperinsulinemia drives diet-induced obesity independently of brain insulin production. Cell Metab. 2012;16:723–737 [DOI] [PubMed] [Google Scholar]
- 43. Johnson JD, Ahmed NT, Luciani DS, et al. Increased islet apoptosis in Pdx1+/− mice. J Clin Invest. 2003;111:1147–1160 [DOI] [PMC free article] [PubMed] [Google Scholar]


