

Abstract
Ribbon-type presynaptic active zones are a hallmark of excitatory retinal synapses, and the ribbon organelle is thought to serve as the organizing point of the presynaptic active zone. Imaging of exocytosis from isolated retinal neurons, however, has revealed ectopic release (i.e., release away from ribbons) in significant quantities. Here, we demonstrate in an in vitro mouse retinal slice preparation that ribbon-independent release from rod bipolar cells activates postsynaptic AMPARs on AII amacrine cells. This form of release appears to draw on a unique, ribbon-independent, vesicle pool. Experimental, anatomical, and computational analyses indicate that it is elicited by a significant, global elevation of intraterminal [Ca2+] arising following local buffer saturation. Our observations support the conclusion that ribbon-independent release provides a read-out of the average behavior of all of the active zones in a rod bipolar cell's terminal.
Keywords: exocytosis, retina, ribbon, vesicle
Introduction
Glutamatergic sensory neurons that signal via graded potentials (e.g., retinal bipolar cells and cochlear and vestibular hair cells) exhibit specialized presynaptic active zones (AZs) distinguished by synaptic ribbons (Matthews and Fuchs, 2010). These proteinaceous structures are thought to permit the high rates of exocytosis and vesicle replenishment required for tonic transmission in primary sensory structures like the retina and the cochlea, and, consequently, they have been the subjects of much study (Schmitz, 2009; Zanazzi and Matthews, 2009). Though it has been demonstrated that synchronized, stimulus-evoked exocytosis requires synaptic ribbons (Khimich et al., 2005; Buran et al., 2010; Snellman et al., 2011), imaging studies of retinal neurons (goldfish retinal Mb1 bipolar cells or salamander rods) have revealed that a significant number of vesicles undergo exocytosis at sites away from synaptic ribbons, and this ectopic release appears to be evoked with a slower time course than synchronized, ribbon-dependent exocytosis (Zenisek et al., 2003; Midorikawa et al., 2007; Zenisek, 2008; Chen et al., 2013). A limitation of these studies of ectopic release from isolated neurons, however, is their inability to determine whether such exocytosis results in neurotransmitter release at locations near postsynaptic receptors and therefore is physiologically relevant.
Here, we identified a new, physiologically relevant component of release from murine rod bipolar (RB) cells that activates postsynaptic AMPARs on AII amacrine cells. It arises slowly with a time course that depends on intraterminal Ca2+ buffer capacity, and it persists when the synaptic ribbon's function is eliminated by photoablation. Thus, this ribbon-independent release appears to reflect exocytosis from ectopic sites at some distance from synaptic ribbons, and we present anatomical (electron micrographic), computational (simulations of Ca2+ diffusion), and experimental (imaging of fluorescent Ca2+ indicators) evidence that ectopic release is evoked by a spatiotemporally averaged [Ca2+] signal that is likely to arise from buffer saturation elicited by Ca2+ influx from multiple ribbon-type AZs. These results indicate a potential signaling role for ectopic release of vesicles and have important implications for the role of the ribbon itself in neurotransmitter release.
Materials and Methods
Retinal slice recordings.
Slices of the retina (200 μm thickness) were prepared from the light-adapted retina isolated from a wild-type C57BL/6 mouse of either sex (4–8 weeks old) as described previously (Jarsky et al., 2010; Tian et al., 2010; Mehta et al., 2013). The Animal Care and Use Committees of the University of Maryland and of Yale University approved all procedures involving animal use. A retina was isolated into bicarbonate buffered Ames' medium (Sigma) equilibrated with 95% O2 and 5% CO2 (Carbogen) at room temperature. For slice preparation, the retina was embedded in low-melting temperature agarose (Sigma type VIIA, 3% in a HEPES buffered saline), and slices were cut on a vibrating microtome (Leica) or placed on a 0.45 μm cellulose acetate/nitrate membrane filter (Millipore) and cut via a tissue chopper. Slices were stored in Carbogen-bubbled Ames' medium at room temperature until use.
Recordings were performed at near-physiological temperature (30−34°C). Retinal slices were superfused with either Carbogen-bubbled Ames' medium or a Carbogen-bubbled artificial CSF (ACSF) containing the following (in mm): 119 NaCl, 23 NaHCO3, 10 glucose, 1.25 NaH2PO4, 2.5 KCl, 1.1 CaCl2, 1.5 MgCl2, 2 sodium lactate, and 2 sodium pyruvate. Picrotoxin (100 μm), (1,2,5,6-Tetrahydropyridin-4-yl)methylphosphinic acid (TPMPA; 50 μm), strychnine (0.5 μm), tetrodotoxin (TTX; 500 nm), 2-amino-4-phosphonobutyrate (l-AP4; 2 μm), and niflumic acid (100 μm) were added to the ACSF to block GABAAR-, GABACR-, GlyR-, voltage-gated Na channel-, mGluR6-regulated channel-, and Ca2+-activated Cl channel-mediated currents, respectively. Drugs were obtained from Sigma or Tocris Bioscience (except for TTX, which is from Alomone Labs).
Pipettes were filled with the following (in mm): 95 Cs-methanesulfonate, 20 TEA-Cl, 1 4-AP, 10 HEPES, 8 Tris-Phosphocreatine, 4 Mg-ATP, 0.4 Na-GTP, and varying concentrations of EGTA or BAPTA, pH was adjusted to 7.4 with CsOH and osmolarity to ∼285 mOsm with sucrose. Voltage-clamp recordings were made from both RBs and AIIs. Generally, RB holding potential was −60 mV, AII holding potential was −80 mV, and membrane potentials were corrected for junction potentials of approximately −10 mV. Access resistances were <25 ΜΩ for RBs and <20 ΜΩ for AII amacrines and were compensated by 50–90%. Recordings were made using a single Multiclamp 700B amplifier. Synaptic transmission was elicited by stimulation of individual RBs at 20 s intervals. Recorded currents were low-pass filtered at 2–4 kHz and digitized at 10–20 kHz by an ITC-18 A/D board (InstruTech) controlled by software written in Igor Pro (WaveMetrics). Recorded Ca currents were leak subtracted off-line (P/4 protocol). Analysis was performed in Igor Pro. Differences between samples were assessed for significance using a two-tailed Wilcoxon signed-rank test (called Wilcoxon test, below) for paired samples and a Wilcoxon–Mann–Whitney two-sample rank test (called Wilcoxon–Mann–Whitney test, below) for unpaired data. Significance was taken as p < 0.05. Data are illustrated as means ± SEM.
Imaging a fluorescent Ca2+ indicator.
RBs were recorded with pipette solutions containing the Ca2+-insensitive fluorescent tracer Alexa 594 hydrazide (0.02–0.1 mm); the low-affinity fluorescent Ca2+ indicator Fluo-4FF (0.1 mm); and a nonfluorescent, high-affinity Ca2+ chelator (1 mm BAPTA or 0.5–10 mm EGTA). Imaging of Fluo-4FF signals was performed using either two-photon laser-scanning microscopy (2PLSM) or a high-speed camera and epifluorescence imaging. For the former, dyes were excited simultaneously using a pulsed infrared laser (Chameleon; Coherent) tuned to a 910 nm excitation wavelength, and emitted light was passed through a series of dichroic mirrors and filters (to separate Fluo-4FF and Alexa 594 fluorescence) and collected by GaAsP photomultipliers (Thorlabs). Collected data were analyzed using ImageJ (Schneider et al., 2012). For the latter, illumination for epifluorescence was performed using an X-Cite 120Q lamp (EXFO) with a 488 nm bandpass excitation filter set for imaging Fluo-4FF fluorescence or 590 bandpass filter set for imaging Alexa 594. Images were acquired at 90 Hz for 5 s with Andor iXon camera controlled by a Shutter driver VCM-D1 with 40× 0.80 NA water-immersion objective (Axioskop 2 FS plus microscope). Image stacks (16-bit TIFF files) were imported and analyzed using MetaMorph software.
Electron microscopic analysis.
A previously published dataset acquired using scanning block-face electron microscopy (SBEM) was analyzed (retina k0563; Briggman et al., 2011). Voxel dimensions were 12 × 12 × 25 nm (x, y, and z, respectively). RB terminals were identified as large, vesicle-containing structures within the innermost portion of the inner plexiform layer (IPL). Presynaptic ribbons were identified as electron-dense structures surrounded by a halo of vesicles in the presynaptic portion of dyad synapses, and postsynaptic AII and A17 amacrine cells were identified in all cases. A17s made clear reciprocal synapses with RB terminals, and AIIs' dendrites were highly branched and contacted several adjacent RB terminals multiple times (Dacheux and Raviola, 1986; Raviola and Dacheux, 1987; Strettoi et al., 1990; Strettoi et al., 1992). Segmentation of identified RBs and AIIs was performed using ITK-SNAP (www.itksnap.org; Yushkevich et al., 2006), and surface meshes of reconstructed cells were assembled and rendered using ParaView, an open-source software package developed by Kitware and Sandia National Laboratories (www.paraview.org). The dimensions of ribbons were assessed using ParaView, and we measured a line drawn between the centers of neighboring ribbons to assess the spacing between ribbons. Here, we made the assumption, validated by observation of >200 ribbons, that lines drawn between nearest neighbors would not cross either the plasma membrane or mitochondria. RB terminal varicosity volumes were estimated by assuming that varicosities were approximately ellipsoid and by measuring the x-, y-, and z-axes intersecting the varicosities' centers (volume = 4/3*π*0.5*xyz).
Modeling intraterminal [Ca2+].
Changes in axon terminal [Ca2+] were simulated using CalC (http://web.njit.edu/∼matveev; Matveev et al., 2002). The terminal varicosity was taken to be a cube with a volume of 8 μm3 based on EM measurements. The terminal contained seven AZs (i.e., ribbons), with five sides of the cube containing one AZ and one side of the cube containing two AZs spaced 500 nm apart. AZs were modeled as point sources of Ca2+, and each AZ generated a Ca2+ flux equivalent to the current flowing through 2–5 Ca channels, each with a conductance (g) of 1.5 pS, the estimated single-channel conductance with external [Ca2+] = 1.1 mm (Jarsky et al., 2010). The initial ECa2+ was +130 mV, assuming internal resting [Ca2+] = 50 nm (Wan et al., 2010, 2012), and Erev was updated with each time step (optimized by the CalC simulator) based on the calculated internal [Ca2+]. Thus, the Ca current at any VM was given as follows:
The center of the cube contained a mitochondrion approximated as a 1 μm3 cube (based on our determination that mitochondria occupied ∼12% of the varicosity volume). The remaining cube volume was filled with buffers EGTA, BAPTA, and Fluo4-FF at varying concentrations, and reaction schemes were modeled as noted in Table 1. Rate (kon and koff) and diffusion (D) constants (Graydon et al., 2011) were temperature corrected for simulations at physiological temperature assuming Q10 = 2.2 or 1.4, respectively (Santucci and Raghavachari, 2008).
Table 1.
Diffusion model parameters
| Particle | KD (μm) | kon (μm−1 s−1) | koff (s−1) | D (μm2/ms) |
|---|---|---|---|---|
| BAPTA | 0.192 | 500 | 96 | 20 |
| EGTA | 0.180 | 9.6 | 0.86 | 20 |
| CaBP | 2.5 | 8.25 | 16.5 | 20 |
| Fluo-4FF | 9.7 | 412 | 4000 | 20 |
| Ca2+ | 200 |
For each time point, we calculated the global internal [Ca2+] as well as [Ca2+] at two points on the intracellular side of the “plasma membrane.” One of these points was on a cube face containing one AZ and was 250 nm from that AZ, and the other point was on a cube face containing two AZs and was equidistant (250 nm) from each. Simulations were run on a 600 node cluster running Ubuntu Linux.
Results
A delayed component of the EPSC recorded in AII amacrine cells
Exocytosis at sites away from synaptic ribbons (i.e., ectopic release) has been observed in isolated goldfish Mb1 bipolar cells by imaging vesicles labeled with FM1–43 following strong stimulation (Zenisek et al., 2003; Midorikawa et al., 2007; Zenisek, 2008). A limitation of these studies is that imaging alone cannot determine whether this ectopic release is physiologically relevant because the postsynaptic cells have been removed. Moreover, Mb1 bipolar cells represent a class of bipolar cells, unique to a subset of teleosts, with unusually large synaptic terminals and large calcium currents (Ishida et al., 1980; Heidelberger and Matthews, 1992; Tachibana et al., 1993), and it is unclear whether their behavior is representative of bipolar cells generally. Therefore, we turned to the mouse retinal slice preparation to determine whether ectopic release from RBs could be detected in AII amacrine cells by recording from synaptically coupled RBs and AIIs (Singer and Diamond, 2003).
Depolarization of an RB to −10 mV for 1–2 s evoked an EPSC that exhibited a slowly developing and decaying component in addition to the transient and sustained components described previously (Singer and Diamond, 2003; Fig. 1A). With presynaptic pipette solutions containing 2 mm EGTA or 1–2 mm BAPTA to approximate the endogenous buffer capacity of these neurons (Burrone et al., 2002; Singer and Diamond, 2003), this delayed EPSC first appeared after ∼100 ms of stimulation (the length of the longest depolarizing steps used in most published studies of transmission at this synapse) and resembled a delayed component of the EPSC that was observed, but not studied, in a previous study of synaptic transmission that used sustained depolarizations of the RB (Jarsky et al., 2011).
Figure 1.

A delayed component of the EPSC recorded in AII amacrine cells. A1, Prolonged depolarization of the presynaptic RB elicits a partially inactivating Ca current (top) and an EPSC (bottom) with a pronounced delayed component (arrow). The EPSC is blocked by the AMPAR antagonist GYKI 52466 (25 μm; magenta; n = 5 pairs). A2, The delayed EPSC (arrow) on an expanded timescale. The lines show zero current (solid) and the delayed component (dashed). B, Ca current and EPSC are blocked by Cd2+ (200 μm; magenta; n = 4 pairs). C1, Electrical coupling between AIIs is blocked by the gap junction antagonist MFA (100 μm). Top, Electrical coupling under control conditions is stable for 1 h. Bottom, Bath-applied MFA blocks coupling in under 20 min. C2, The delayed EPSC persists after prolonged incubation in MFA (200 μm) to block gap junctions (n = 5 recorded pairs).
Both the transient and delayed components of the EPSC reflected Ca2+-dependent synaptic transmission at the synapses between the recorded RBs and AIIs: the entire EPSC was eliminated by GYKI 52466 (25 μm; n = 5), which blocks postsynaptic AMPARs, and by Cd2+ (200 μm; n = 4), which inhibits presynaptic Ca channels (Fig. 1A,B). These observations are consistent with the finding that Ca2+-dependent synaptic transmission at the RB-AII synapse is mediated by AMPARs exclusively (Singer and Diamond, 2003) and suggest that delayed release of glutamate activates synaptic AMPARs on AIIs.
Because AIIs are coupled electrically by gap junctions (Demb and Singer, 2012), we considered the possibility that the delayed component of the EPSC was a gap junction-mediated current arising from synaptically released glutamate acting on AMPARs on AIIs coupled to the recorded AII. To test this idea, we examined the effect of meclofenamic acid (MFA; 200 μm), a gap junction antagonist, on the evoked EPSCs. Control experiments demonstrated that MFA blocked electrical coupling between AIIs (Figure 1C1; Veruki and Hartveit, 2009). Meclofenamic acid did not affect the EPSCs (n = 5), indicating that the EPSCs reflected direct synaptic inputs to the recorded AIIs (Fig. 1C2).
Delayed release involves a unique vesicle pool and does not require functional presynaptic ribbons
It is notable that the waveform of the recorded EPSCs—the initial transient component followed by a delayed component—resembled the time course of transmitter release from dissociated Mb1 neurons observed by recording glutamate-evoked currents from reporter cells (Sakaba et al., 1997; von Gersdorff et al., 1998). It was suggested that the slowly developing component of glutamate release from Mb1 terminals reflected exocytosis of a recently mobilized vesicle pool distinct from the readily releasable vesicle pool (RRP; Sakaba et al., 1997). Therefore, we examined whether delayed release drew upon the RRP in RB terminals. To do this, we performed a cross-depletion experiment: delayed release was evoked with a voltage step of 1 s to −10 mV, and on alternate trials, this step was preceded by 50 ms by a voltage step of 10 ms to −10 mV (Fig. 2A; n = 8 paired recordings). This brief prepulse did not evoke delayed release and was sufficient to deplete the RRP (Singer and Diamond, 2006). Predictably, the prepulse significantly reduced the amplitude and integral of the transient component of the EPSC as summarized in Figure 2B (p = 0.007 by Wilcoxon test). It, however, had no effect on the delayed component (p = 0.3 by Wilcoxon test).
Figure 2.

The delayed EPSC reflects release from a unique vesicle pool. A1, Depletion of the RRP by a prepulse (magenta) reduces a subsequent transient response but does not depress the delayed EPSC (compare the control—black and RRP-depleted conditions). A2, The currents are shown at higher temporal resolution to illustrate the depression of the transient component of the EPSC by the prepulse. Arrowheads denote the H+-dependent inhibition of the presynaptic Ca current by the release of the acidic contents of vesicles into the synaptic cleft (DeVries, 2001; Palmer et al., 2003; Jarsky et al., 2010). This inhibition is absent after the prepulse depletes the RRP. B, Summary data illustrating that depression of the RRP affects transient but not delayed EPSCs. Illustrated are averaged integrals of the first 10 ms of the EPSC and of the remainder normalized to their values in the absence of a prepulse; n = 8 paired recordings. Error bars are ± SEM. By Wilcoxon tests: p = 0.007 for the transient component (i.e., it is reduced significantly), and p = 0.3 for the delayed component (i.e., it is not affected significantly by the prepulse). C, Pre-incubation of the retina in PMA does not affect the recorded EPSC. The ratio of the transient to the delayed current in the experimental condition normalized to that in the control condition was 1.16 ± 0.1 (n = 4 recorded pairs; p = 0.09 by Wilcoxon–Mann–Whitney test). D, FALI does not eliminate delayed release evoked by a prolonged depolarization to −10 mV. EPSCs from five control experiments (gray) and five separate FALI (magenta) experiments are illustrated (2 mm EGTA internal for both). E, Summary data illustrating that FALI affects preferentially the transient component of the EPSC. The integral of the first 10 ms of the EPSC is compared with the integral of the remainder of the EPSC for experiments performed with 0.5 mm or 2 mm EGTA (10 control and 5 FALI paired recordings for each condition). Error bars are means ± SEM. The initial transient EPSC was reduced by 83% or 94.2%, whereas the remainder of the EPSC was reduced by 42.9% or 72.9% (0.5 or 2 mm EGTA, respectively). The differences between the control and post-FALI responses are highly significant (p < 0.001 for 0.5 mm EGTA and p < 0.001 for 2 mm EGTA by Wilcoxon–Mann–Whitney test).
In goldfish Mb1 terminals, release from a secondary vesicle pool is potentiated by PKC activation (Minami et al., 1998). Therefore, we examined the effects of the PKC activator phorbol-12-myristate-13-acetate (PMA; 200 nm) on delayed release and found that it failed to modulate either the transient or the delayed components of the EPSC (Fig. 2C): the ratio of the transient to the delayed current in the experimental condition normalized to that in the control condition was 1.16 ± 0.1 (n = 4; p = 0.09 by Wilcoxon–Mann–Whitney test).
Because the RRP comprises vesicles attached to presynaptic ribbons (Snellman et al., 2011), we hypothesized that delayed release, which does not involve exocytosis from the RRP, arose from sites away from the ribbons. To test this hypothesis, we photo-damaged the ribbons using fluorophore-assisted light inactivation (FALI; Jay, 1988; Snellman et al., 2011; Mehta et al., 2013) and examined the effect on evoked delayed release. Recorded RBs were filled with a fluorescein-conjugated peptide that binds to the synaptic ribbon protein, Ribeye (Zenisek et al., 2004). Presynaptic pipettes contained either 0.5 mm or 2 mm EGTA. After an equilibration period of 5 min, the retinal slice was subjected to bright illumination that generated local damage to the ribbon. After illumination, RBs were depolarized briefly (−10 mV, 3 × 30 ms at 10 s intervals) to deplete the cycling RRP.
Consistent with previous results (Snellman et al., 2011; Mehta et al., 2013), FALI dramatically reduced transient EPSCs evoked after the cycling RRP was depleted, and the exocytosis giving rise to the transient EPSCs never recovered (the integral of the first 10 ms of the EPSC was reduced by 83% for 0.5 mm EGTA and by 94.2% for 2 mm EGTA; Fig. 2D). Delayed release, however, was still prominent, albeit reduced, after FALI: the integral of the remainder of the EPSC was reduced by 42.9% for 0.5 mm EGTA and by 72.9% for 2 mm EGTA (Fig. 2D). Thus, it would seem that on the order of 25–50% of delayed release was mediated by a mechanism that does not require functional synaptic ribbons. Because some ribbon function remained after FALI (i.e., the transient EPSC was not eliminated completely), we believe that the contribution of ribbon-independent exocytosis to the delayed EPSC was likely at the lower end of this range.
To summarize the relative effects of FALI on the transient and delayed components of the EPSC, we plotted the ratio of the charge of the transient to the sustained component before and after FALI (Fig. 2E). The ratio was reduced significantly in cells loaded with 0.5 mm EGTA (p < 0.001 by Wilcoxon–Mann–Whitney test; n = 10 control and 5 FALI pairs) or 2 mm EGTA (p < 0.001 by Wilcoxon–Mann–Whitney test; n = 10 control and 5 FALI pairs). Control experiments performed in other recorded pairs confirmed that illumination of RBs that were not dialyzed with peptide-containing solution did not affect EPSCs recorded in AIIs (Snellman et al., 2011; Mehta et al., 2013).
Given the slow time course of delayed release and the relatively smooth appearance of delayed EPSCs (i.e., identifiable, fast synaptic currents generally were not observed riding on top of the slow inward current), we thought it important to confirm that the delayed EPSC did not reflect nonvesicular glutamate release. Glutamate transporters (Schwartz, 2002), TREK K channels, and Best1 Cl channels (Woo et al., 2012) have been shown to mediate nonvesicular glutamate release. Here, we found that delayed EPSCs were not affected by the glutamate transporter antagonist TBOA (100 μm; Fig. 3A; n = 12 pairs and p = 0.4 by Wilcoxon–Mann–Whitney test) or by the niflumic acid (100 μm), which generally was present in our external recording solution (see Materials and Methods) and which blocks TREK-mediated and Best1-mediated glutamate release.
Figure 3.

The delayed EPSC reflects Ca channel-dependent vesicular exocytosis. A, Delayed release persists in the presence of the glutamate transporter blocker TBOA (100 μm). B–D, Ca2+ released from intracellular stores does not affect delayed release. Delayed release persists in the presence of thapsigargin, an antagonist of the SERCA pump (B), of cyclosporin A, a mitochondrial toxin (C), and of adenophostin A, an IP3 receptor agonist (D). E, Summary data for the four conditions. Error bars are means ± SEM. The ratios of the integrals of the transient components of the EPSCs and the remainders of the EPSCs in experimental conditions are normalized to those measured under control conditions. The adenophostin A was applied in an internal pipette solution containing 1 mm BAPTA; the other agents were bath applied during recordings that used 2 mm EGTA as a presynaptic buffer. For TBOA, n = 12 paired recordings and p = 0.4 by Wilcoxon–Mann–Whitney test. For thapsigargin, n = 5 paired recordings and p = 0.9 by Wilcoxon–Mann–Whitney test. For cyclosporin A, n = 4 paired recordings and p = 0.8 by Wilcoxon–Mann–Whitney test. For adenophostin A, n = 6 paired recordings and p = 0.09 by Wilcoxon–Mann–Whitney test.
The timing of delayed release is [Ca2+]-dependent
The preceding experimental observations lead to the conclusion that delayed release reflects exocytosis of vesicles from sites other than those at the base of the synaptic ribbon. Because most or all of the Ca channels at bipolar cell synapses are located on the presynaptic membrane at the base of the ribbon (Morgans et al., 2001; Berntson and Morgans, 2003; Zenisek et al., 2003, 2004), it would seem, then, that delayed release occurs at ectopic sites that are some distance from Ca channels. To eliminate the possibility that Ca2+ released from internal stores evoked delayed release, we examined the effects of thapsigargin (a sarco-endoplasmic reticulum Ca2+-ATPase inhibitor; bath applied), cyclosporin A (a mitochondrial transition pore blocker; bath applied), and adenophostin A (an IP3R agonist; included in the recording pipette) on the EPSCs. We found that none affected delayed release significantly (Fig. 3B–D; for thapsigargin, n = 5 pairs and p = 0.9 by Wilcoxon–Mann–Whitney test; for cyclosporine A, n = 5 pairs and p = 0.8 by Wilcoxon-Mann–Whitney test; for adenophostin A, n = 6 pairs and p = 0.09 by Wilcoxon–Mann–Whitney test). Therefore, it appears that delayed release is evoked solely by Ca2+ influx through Ca channels proximate to the synaptic ribbon; we, however, cannot exclude the possibility of minor contributions from extrasynaptic Ca2+ channels.
To examine the [Ca2+] dependence of delayed release, we performed two experimental manipulations that altered either Ca2+ accumulation within or Ca2+ influx into the RB axon terminals. The intracellular buffer capacity of the RB terminal was altered to vary the magnitude of the intracellular [Ca2+] change. We observed that as [EGTA] was increased from 0.5 to 10 mm, or as [BAPTA] was increased from 1 to 2 mm, the onset of the delayed EPSCs evoked by voltage steps to −10 mV increased (Fig. 4A; differences between all groups are statistically significant; p < 0.005 by Wilcoxon–Mann–Whitney test). Varying [EGTA] or [BAPTA] had no effect on the amplitudes of the transient components of the EPSCs (Singer and Diamond, 2003); this is consistent with previous experimental observations and with both buffers' Ca2+-binding kinetics being too slow to affect [Ca2+] within 20–50 nm of Ca channels, the estimated distance between Ca channels and vesicles in the RRP (Naraghi and Neher, 1997; Neher, 1998; Singer and Diamond, 2003; Jarsky et al., 2010).
Figure 4.
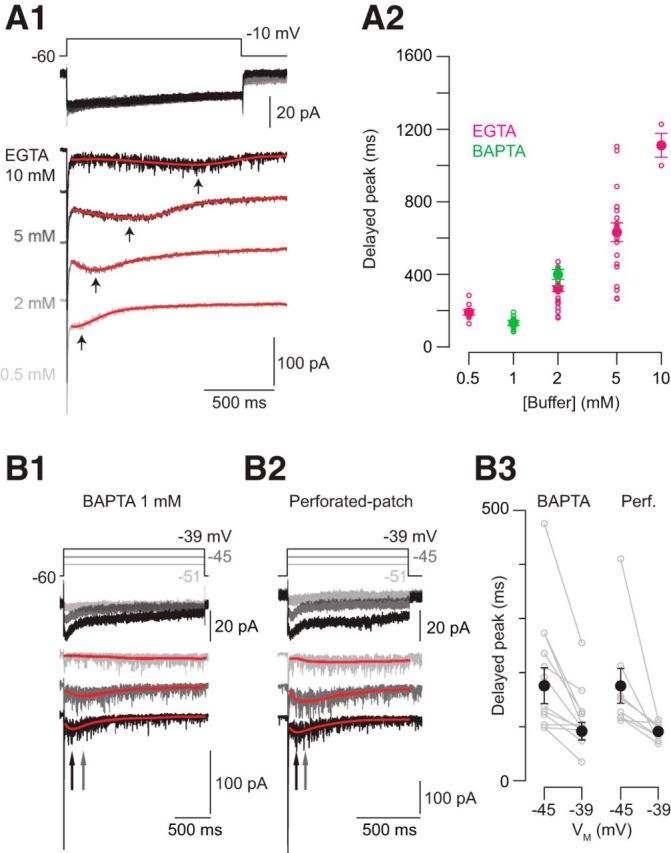
The timing of delayed release is Ca2+ dependent. A1, Examples of EPSCs evoked with varying [EGTA] in the presynaptic recording pipette. Increasing [EGTA] delays the onset of delayed release. Here, the EPSC was fit with a polynomial to generate a smooth curve (red), the peak time of which (arrows) was measured. A2, The time to peak for various [buffers] is summarized. The small symbols illustrate individual observations; the large symbols are means ± SEM. Differences between all groups are statistically significant; p < 0.005 by Wilcoxon–Mann–Whitney tests. B, Increasing Ca2+ influx by increasing the number of open Ca channels with presynaptic depolarization speeds delayed release in both whole-cell (B1) and perforated-patch (B2) recording configurations. B3, Summary data: the peak of the delayed EPSC as a function of presynaptic membrane potential. The small symbols illustrate individual observations; the large symbols are means ± SEM. Differences in both groups are statistically different; p < 0.001 by Wilcoxon tests; n = 10 pairs for whole-cell recordings and n = 8 pairs for perforated-patch recordings.
Next, we evoked delayed release with presynaptic voltage steps to varying potentials (−51 to −39 mV). We observed that the onset of the delayed EPSC became faster with increasing depolarization (Fig. 4B1; p < 0.001 by Wilcoxon test), indicating that increasing the number of open Ca channels sped delayed exocytosis. Additionally, this experiment demonstrated that delayed release was evoked at potentials within the physiological operating ranges of RBs (Berntson and Taylor, 2000; Euler and Masland, 2000; Jarsky et al., 2011).
Finally, we recorded from RBs in the perforated-patch configuration to avoid perturbing the endogenous buffer (Fig. 4B2). We found that the delayed EPSCs exhibited time courses and presynaptic voltage dependence similar to those evoked when the presynaptic terminal contained 1–2 mm EGTA or BAPTA, consistent with the finding that the endogenous buffer capacity of bipolar cell terminals is well approximated by 1 mm BAPTA (Burrone et al., 2002; Singer and Diamond, 2003).
Nonlinear [Ca2+] changes in RB terminals
The notion that delayed release occurs at sites away from Ca channels is supported as well by our observation that the time course of delayed release was similar in the presence of either EGTA or BAPTA (1–2 mm; Fig. 4). As both buffers have similar KD despite binding kinetics that differ by 150-fold, buffer capacity rather than buffer kinetics appears to govern delayed release (Naraghi and Neher, 1997; Neher, 1998). Thus, it is possible that the appearance of delayed release might have reflected local Ca2+ buffer saturation.
We tested this idea experimentally using 2PLSM to image a fluorescent Ca2+ indicator introduced into RB terminals. We used the low-affinity (KD = 9.7 μm) Ca2+ indicator Fluo4-FF (100 μm) to monitor Ca2+ changes in the terminals of RBs filled with an internal solution that included 1 mm BAPTA. The effective buffering power of Fluo4-FF is insignificant here given that BAPTA is 10 times more concentrated than Fluo-4FF and has an affinity for Ca2+ that is >50 times higher than that of Fluo-4FF (Naraghi and Neher, 1997; Neher, 1998).
When RBs were depolarized to −10 mV for 2 s, Fluo4-FF fluorescence increased nonlinearly over time (frames acquired at 48–60 Hz; every four to six frames were averaged to reduce noise, giving an effective rate of 8–15 Hz and an interframe interval of 66–125 ms). Initially, it rose quite slowly, but after a few hundred milliseconds, it changed quite rapidly increasing >10-fold during the depolarization (Fig. 5A–C). Presynaptic depolarization to −45 mV evoked similar, but smaller changes in Fluo-4FF fluorescence after a longer delay to the rapid rise: the delay was 179 ± 11 ms for steps to −10 mV and 264 ± 11 ms for steps to −45 mV (n = 35 observations from n = 14 cells; p < 0.007 by Wilcoxon test. Changes in Fluo-4FF fluorescence evoked by steps to −10 mV were, on average, 2.7 ± 0.2-fold higher than those evoked by steps to −45 mV (Fig. 5; n = 35 observations from n = 14 cells; p < 0.001 by Wilcoxon test). The fact that a low-affinity indicator generated large fluorescence signals indicated that [Ca2+] within the axon terminals rose globally and significantly—by 10- to 20-fold, assuming that we are observing the linear part of the Ca2+–Fluo-4FF binding relationship, at which the slope is 1 (Pologruto et al., 2004)—even in the presence of a high concentration of a strong buffer. The delayed time course of the change in Fluo-4FF fluorescence suggests that the buffer capacities of the terminals were saturated, even at physiological potentials, before Ca2+ began to bind to Fluo-4FF.
Figure 5.

Ca2+ imaging reveals buffer saturation. A, An image stack acquired by 2PLSM illustrates an RB filled with Alexa 594 (visualized) and Fluo-4FF (data not shown). It is evident that the axon terminal structure comprises several varicosities. B1, Steps to −45 (magenta) and −10 mV (green) evoke Ca currents (top) and elicit changes in Fluo-4FF fluorescence (bottom). Responses from three different varicosities are shown. It is evident that there is heterogeneity between varicosities. B2, The Fluo-4FF signal is delayed relative to the voltage step and the Ca current (average delay ± SEM is 179 ± 11 ms for steps to −10 mV and 264 ± 11 ms for steps to −45 mV; n = 35 observations from n = 14 cells; p < 0.007 by Wilcoxon test). C, Summary data illustrating that the amplitude of the Fluo-4FF signal increases with Ca current (C1) and that the variability in signal between varicosities is not dependent upon varicosity volume (n = 35 observations from n = 14 cells; p < 0.001 by Wilcoxon test). D, An RB terminal visualized using epifluorescence imaging with a fast CCD camera has three lobules (top). Depolarization of the terminal with a 2 s step to −10 mV elicits changes in Fluo-4FF fluorescence (bottom; time after the voltage step is noted; 2 mm EGTA in pipette). E1, Fluo-4FF signals acquired at high temporal resolution (∼90 Hz) illustrate variability between the varicosities shown in D. E2, Fluo-4FF signals recorded from 32 varicosities in 17 cells illustrate temporal variability in the [Ca2+] change within various terminal compartments. F, The time course of the Fluo-4FF signal varies with the terminal buffer capacity. Traces are averaged responses for [EGTA] = 0.5, 2, 5, 10 mm (n = 31 varicosities from n = 12 cells for 0.5 EGTA; n = 32 varicosities from n = 17 cells for 2 EGTA; n = 26 varicosities from n = 10 cells for 5 EGTA; n = 28 varicosities from n = 11 cells for 10 EGTA). The bars illustrate the average time to peak of the delayed EPSC ± SEM (Fig. 4) recorded with the same presynaptic buffer conditions.
In some instances, it appeared as though the fluorescence signal plateaued before the end of the depolarization. Though this might reflect saturation of the indicator, we believe it is more likely that [Ca2+] within the terminal reached a steady-state concentration (see Ca2+ diffusion modeling and Fig. 8, below). We favor the latter possibility because (1) the KD of Fluo-4FF is 9.7 μm, so saturation would require unreasonably high [Ca2+] and (2) the maximal ΔF/F0 is only ∼20. Assuming a resting [Ca2+] of 50–100 nm (Wan et al., 2010, 2012), only 1% of the indicator would be bound at rest, and 10-fold or 20-fold increases in fluorescence still would be comfortably in the indicator's linear range (Pologruto et al., 2004).
Figure 8.
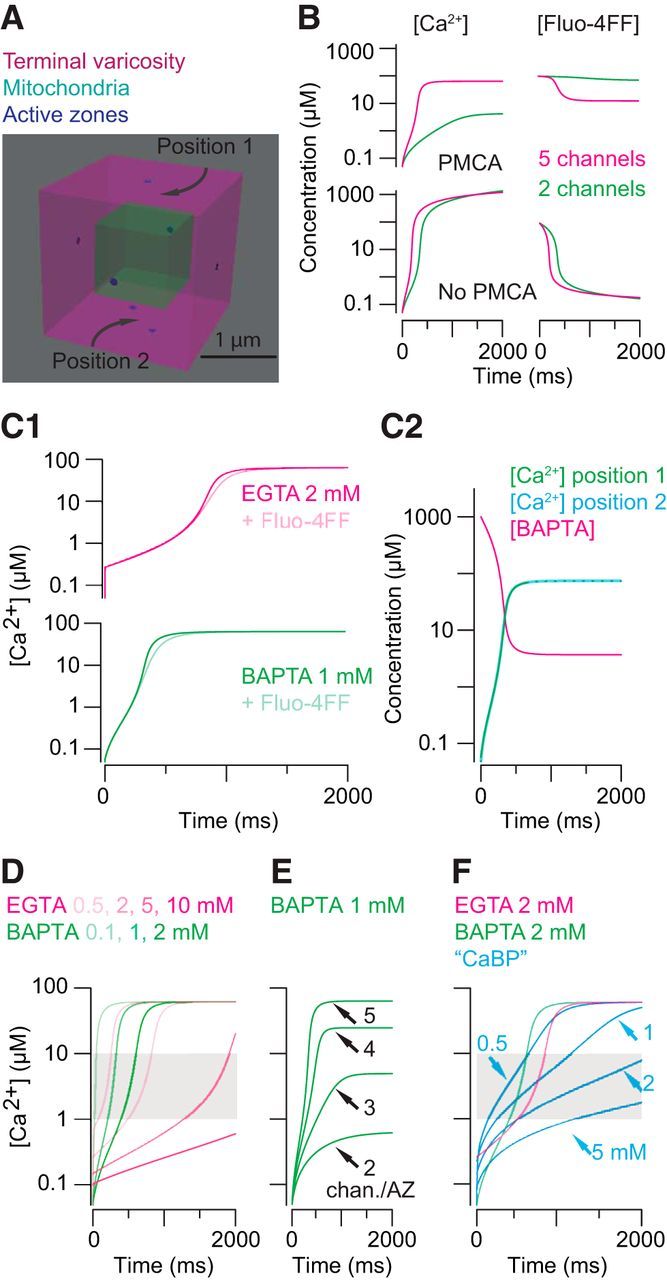
Modeling intraterminal [Ca2+]. A, An RB terminal varicosity represented as a cube with volume = 8 μm3. The mitochondria occupy 12% of the total volume. Seven ribbon-type active zones are represented as point sources for Ca2+; Ca2+ influx at each point source corresponded to the opening of two to five Ca channels. B, Global [Ca2+] and [BAPTA] measured with and without an extrusion mechanism present in the model. The rate of extrusion was adjusted to give a severalfold difference between conditions with few or more open Ca channels. C1, Including Fluo-4FF does not affect the buffering capacity of EGTA (2 mm) or BAPTA (1 mm; Fig. 5). C2, Ca2+ influx (5 channels per AZ) saturates 1 mm BAPTA. The change in [Ca2+] is the same when measured at a surface 250 nm from one AZ and at a surface equidistant from two AZs spaced 500 nm apart. D, For a range of [exogenous buffers], Ca2+ influx through five channels per AZ is sufficient to drive [Ca2+] to 1–10 μm in <1 s. E, Increasing the number of channels per AZ increases the steady-state [Ca2+]. F, For a range of [physiological buffer], Ca2+ influx through five channels per AZ is sufficient to drive [Ca2+] to 1–10 μm in <1 s. Simulated [Ca2+] with 2 mm EGTA or BAPTA present are overlaid to illustrate that buffer capacity (1 mm physiological buffer = 2 mm EGTA or BAPTA) rather than buffer kinetics determines the time course of the global change in [Ca2+].
As well, we noted that fluorescence changes were not uniform throughout the axon terminal structures. The RB axon terminal comprises a few distinct varicosities linked by branches of the axon, and Figure 5A shows the relative fluorescence changes (ΔF/F0) measured in individual varicosities and branches. Notably, the trial-to-trial timing of the nonlinear rise in Fluo4-FF fluorescence was consistent within individual varicosities but varied considerably between varicosities, even within the same cell (Fig. 5B,C). Thus, it would seem that there is significant heterogeneity in Ca2+ influx between RB axon terminal compartments.
To examine at higher resolution the timing of the Fluo-4FF signal, we varied the concentration of nonfluorescent Ca2+ buffer (EGTA 0.5–10 mm) and imaged changes in indicator fluorescence using a fast CCD camera (frame rate = 90 Hz; interframe interval = 11 ms; Fig. 5D). As illustrated in Figure 5, D and E, 2 s voltage steps to −10 mV (EGTA 2 mm; n = 32 varicosities from n = 17 cells) elicited changes in Fluo-4FF fluorescence that were similar to those observed previously (Fig. 5B). The timing of the fluorescence change varied between RBs and between varicosities within a single RB (Fig. 5E) and with EGTA concentration (Fig. 5F). In total, these results support the conclusion that local buffer saturation arising from sustained Ca2+ influx permits [Ca2+] within RB terminals to rise significantly. It is particularly notable that the onset of buffer saturation revealed by the rise in Fluo-4FF fluorescence corresponds closely to the onset of the delayed EPSC (Figs. 4, 5F).
Anatomical analyses of RB terminals
Together, the experiments described above support the hypothesis that delayed EPSCs arise after a global change in [Ca2+] following saturation of the terminals' buffer capacities evoked exocytosis of vesicles independent from synaptic ribbons. To determine whether the structure of the RB-AII synapse supports this hypothesis, we examined in detail the presynaptic organization of RB ribbon synapses by EM reconstruction of five RB axon terminals identified in a published dataset acquired using SBEM (retina k0563; Briggman et al., 2011). Briefly, RB terminals were identified as large, vesicle-filled processes in the inner IPL; synaptic ribbons within these terminals were visualized and their position as the presynaptic elements in dyad synapses was confirmed (Fig. 6A). One of the two postsynaptic processes was easily identifiable as belonging to an A17 amacrine cell, which makes a reciprocal inhibitory synapse onto the RB, making the other an AII dendrite (Dacheux and Raviola, 1986; Raviola and Dacheux, 1987). Figure 7 illustrates in detail the morphology of an RB varicosity and its postsynaptic elements.
Figure 6.

EM analysis of RB terminals. A, Identification of synapses in an RB terminal. Ribbons are at dyad synapses with postsynaptic A17s and AII amacrine cells. Here, the RB makes two synapses onto the same A17 and the same AII. B, Five reconstructed RB axon terminals (C) One RB with two varicosities and one stalk exposed to visualize mitochondria and ribbons: there are two ribbons in the stalk and four and seven ribbons in the two varicosities. Each varicosity has an approximately equivalent volume. D, Distribution of inter-ribbon distances: the dashed lines are cumulative distributions from individual cells, and the solid line is the average of n = 5 RBs. E, The number of ribbons appears to be largely independent from varicosity volume. Error bars ± SD. F, Illustration of an AII dendrite contacting a single RB terminal varicosity. Note that the AII is postsynaptic to vesicles on ribbons as well as vesicles near (<24 nm, or 2 pixels) the plasma membrane but not on ribbons.
Figure 7.
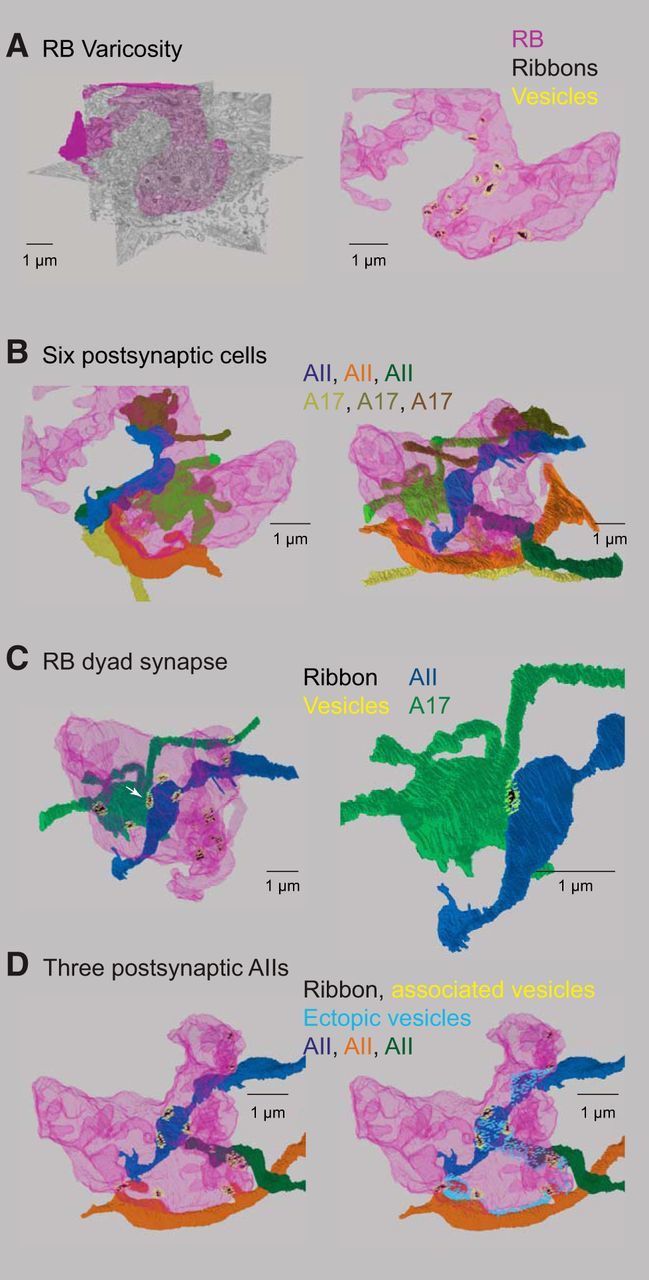
Detailed reconstruction of an RB terminal varicosity. A, Left, An RB terminal varicosity (magenta) superimposed on SBEM sections. Right, The same varicosity contains several synaptic ribbons (green) and their associated vesicles (cyan). Not all of the ribbons in this varicosity are illustrated. B, Three AII amacrine cells (bluish) and three A17 amacrine cells (brownish) are postsynaptic to the ribbons illustrated in A. Right and left show the same cells from two different perspectives. C, A dyad synapse. Left, A single ribbon (arrowhead) is presynaptic to an AII and to an A17. The dyad is shown in more detail at right. D, Left, Three AIIs are postsynaptic to the ribbons illustrated. Right, Vesicles near the plasma membrane but unassociated with ribbons are presynaptic to the AIIs.
The five reconstructed RB axon terminals are illustrated in Figure 6B. Ribbons were found within terminal varicosities, within the axonal terminal branches linking these varicosities, and within the main axon itself (Fig. 6C; Lauritzen et al., 2013; Tsukamoto and Omi, 2013). On average, a single RB axon terminal structure contained 53 ribbons (RBs 1–5 contained 65, 53, 35, 62, and 48 ribbons, respectively; mean ± SD = 53 ± 12 ribbons); this is close to the 55 ribbons per RB reported in a recently published study (Tsukamoto and Omi, 2013) and significantly higher than previous estimates of ∼40 ribbons per RB taken from EM reconstruction (Tsukamoto et al., 2001) and fluorescence microscopy (Singer et al., 2004).
The average ribbon length was 261 ± 75 nm (mean ± SD; n = 234 ribbons). We measured the distances between ribbons (taken as the center-to-center distance between a ribbon and its nearest neighbor). Inter-ribbon distances fell within a skewed, unimodal distribution that did not vary between cells: 50% of the ribbons were within 678 nm of their nearest neighbors, and 30% of the ribbons were within 500 nm of another ribbon (Fig. 6D). Because the inter-ribbon distances were measured center to center, the minimum distance between two ribbons is shorter than reported.
So that we could understand the structural basis of the heterogeneous [Ca2+] changes that we observed by imaging Fluo-4FF, we examined the terminal varicosities more closely (Fig. 6C). Both the volumes of the varicosities and the number of ribbons within each varied widely. The averaged varicosity volume was 8.7 ± 9.8 μm3, and, on average, a varicosity contained 7 ± 5 presynaptic ribbons (n = 21 distinct varicosities; mean ± SD). It is worth noting that because of fixation-induced swelling of the tissue, these volumes likely differ from those found in vivo. There was not a strong correlation between varicosity volume and ribbon number (Fig. 6E). We reconstructed the mitochondria within a subset of these varicosities and determined that mitochondria within the varicosity occupied 13.0 ± 2.5% of the volume; mitochondrial volume was not correlated with the number of ribbons in a varicosity, and, again, we note that these measurements are likely affected by unavoidable artifacts of chemical fixation (n = 10 varicosities).
Thus, our anatomical analysis indicated that the variability in varicosity volume and in the number of sites for Ca2+ entry into a given volume will cause depolarization-evoked changes in [Ca2+] to vary between varicosities, in keeping with our experimental observations (Fig. 5). Notably, vesicles were found close to the plasma membrane at locations in between ribbons throughout the axon terminal structures. This is illustrated in Figure 6F, in which the vesicles closest to ribbons (the SBEM resolution is insufficient to reveal protein tethers between the vesicles and the ribbons) are colored red and vesicles within ∼36 nm —a vesicle's diameter—of the plasma membrane and but not at ribbons are colored yellow. These yellow vesicles were apposed to the dendrites of AIIs that were postsynaptic to the terminal (Fig. 6F), suggesting that Ca2+ that reached these sites could encounter release-competent vesicles. The distribution of vesicles in an RB terminal varicosity relative to postsynaptic AIIs is illustrated as well in Figure 7 and in Movie 1, which display the anatomy of the RB terminal in more detail. We did not observe any larger structures like endosomes or lysosomes that would be indicative of compound vesicle fusion or another unconventional mode of synaptic transmission.
Three hundred sixty degree rotation allows visualization of pre- and postsynaptic elements at a reconstructed RB terminal varicosity.
Estimating [Ca2+] changes evoked by presynaptic depolarization
To estimate how delayed release was related to intraterminal [Ca2+], we simulated using CalC (http://www.calciumcalculator.org; Matveev et al., 2002) the changes in [Ca2+] arising during our experiments. Briefly (see Materials and Methods for details), a presynaptic varicosity was modeled as a cube, 2 μm on each side (for a total volume of 8 μm3, close to the measured average varicosity volume; Fig. 6). The varicosity's mitochondria were modeled as a cube, 1 μm on each side, so that the mitochondrial volume was 12.5% of the total volume in keeping with our anatomical measurements (Fig. 8A). The cube representing the varicosity was filled with varying concentrations of diffusible buffers (including, in some cases, Fluo-4FF). Seven sites of Ca2+ entry, corresponding to the average number of presynaptic ribbons, were distributed over the surface, and Ca2+ influx at each entry site corresponded to the flux through two to five open Ca2+ channels, depending on the presynaptic VM (Jarsky et al., 2010). This range of open channels (2.5-fold variation) is in keeping with our observation that Fluo-4FF signals were 2.7 times larger at VM = −10 mV than at VM = −45 mV (Fig. 5A–C).
We began by simulating the change in [Ca2+] that would arise during a 2 s depolarization to −10 mV with 1 mm BAPTA and 0.1 mm Fluo4-FF present. We assumed that at this presynaptic potential, five Ca channels opened at each AZ (Jarsky et al., 2010). Because intraterminal [Ca2+] in the RB terminal appears to be controlled largely by a plasma membrane ATPase, likely PCMA2 (Krizaj et al., 2002; Wan et al., 2012), we included a high-affinity Ca2+ extrusion mechanism. The efficiency of the ATPase was set to provide for an ∼3-fold difference in Ca2+-bound Fluo4-FF between simulations in which two or five Ca channels opened, in keeping with the 2.7-fold variations observed in our Fluo4-FF imaging (Figs. 5A–C, 8B). The simulated changes in global [Ca2+] were not affected significantly by the addition of Fluo-4FF, mimicking our fluorescence imaging experiments (Figs. 5, 8C1).
As well, we estimated the [Ca2+] on various interior surfaces (corresponding to the cytoplasmic side of the presynaptic membrane) and found that mitochondria do not appear to present significant barriers to Ca2+ diffusion and that global [Ca2+] was an accurate representation of [Ca2+] near individual AZs (Fig. 8C2). We did not attempt to model diffusion barriers that were closer to the sites of Ca2+ entry because such barriers were not observed anatomically (Fig. 6). Synaptic ribbons in RB axon terminals extended ∼250 nm into the cytoplasm from the plasma membrane, making it impossible for mitochondria to be located any closer to the plasma membrane at presynaptic AZs. Additionally, although a role for synaptic ribbons themselves as diffusion barriers has been proposed for auditory hair cells, in which the ribbons are spheroids ∼200 nm in diameter (Graydon et al., 2011), it is extremely unlikely that synaptic ribbons in RB terminals serve as significant diffusion barriers: RB axon terminal synaptic ribbons are only 36–48 nm wide (3–4 pixels in our images).
Next, we simulated the changes in [Ca2+] that would arise during 2 s depolarizations to −10 mV for the various exogenous buffer concentrations examined experimentally (0.1–2 mm BAPTA and 0.5–10 mm EGTA; Fig. 8D). Initially, global [Ca2+] rose slowly, and then after a delay that increased with increasing buffer capacity, jumped rapidly to a plateau of ∼60 μm for all but the highest [buffer] conditions. The initial increase in global [Ca2+] occurred more rapidly with EGTA than with BAPTA because of BAPTA's faster binding of Ca2+ (Fig. 8D). These results indicate that Ca2+ influx into the RB terminal can saturate mobile Ca2+ buffers and elevate [Ca2+] into the 1–10 μm range that is thought to be sufficient to sustain exocytosis (Jarsky et al., 2010; see Rieke and Schwartz, 1996; Thoreson et al., 2004 for a discussion of photoreceptor ribbon synapses).
Next, we simulated the changes in global [Ca2+] that would arise as presynaptic membrane potential was varied through the physiological range and increasing numbers of channels opened at each AZ (Fig. 5). With 1 mm BAPTA in the simulated terminal, Ca2+ influx through two to five channels per AZ was simulated, with two channels per AZ open at −45 mV and three to five channels per AZ open at −10 mV, in keeping with published estimates (Jarsky et al., 2010; Fig. 8E). Examination of the simulated changes in global [Ca2+] revealed that the opening of only three channels per AZ (or a Ca current of ∼2–3 pA in a compartment with a volume of 8 μm3) was sufficient to elevate [Ca2+] to the low micromolar levels sufficient to evoke exocytosis in <500 ms. Together with the results of our simulations of PMCA efficiency, this result indicates that global [Ca2+] within the axon terminal structure is capable of rising quite quickly as a result of buffer saturation, even when relatively few channels open and when PMCA activity is substantial.
Of course, neither BAPTA nor EGTA is the endogenous buffer found in RBs in situ. Though the native buffer(s) in RBs is/are not known, calcium-binding protein (CaBP) 5 is likely to be a major one: it is expressed in RBs (Rieke et al., 2008), and RBs do not exhibit immunoreactivity for other well known Ca2+ buffers like parvalbumin, calretinin, and calbindin (Ghosh et al., 2004; Wässle et al., 2009). The kinetics of Ca2+ binding to CaBP5 are not characterized; those of the closely related protein, CaBP1, however, have been examined (Wingard et al., 2005). CaBP1 (like CaBP5) contains four Ca2+-binding, EF-hand domains, EF1–4 (Haeseleer et al., 2000; Yang et al., 2002). EF3–4 bind Ca2+ with weak cooperativity (Hill coefficient = 1.3) with a combined KD estimated to be 2.5 μm; EF1 has a much higher KD for Ca2+ binding (>100 μm), and Ca2+ does not bind detectably to EF2 (Wingard et al., 2005). Therefore, we simulated Ca2+ diffusion buffered by a simplified approximation of the endogenous Ca2+ buffer: a molecule with two independent binding sites, each with KD = 2.5 μm (see Table 1 for details). Thus, 1 mm of this “physiological” buffer molecule will act as 2 mm buffer.
As illustrated in Figure 8F, intraterminal [Ca2+] changes in the presence of this “physiological” buffer at concentrations thought to exist normally in ribbon-containing terminals (Roberts, 1994) were quite similar to those observed in simulations using BAPTA and EGTA. The results of this simulation are consistent with our assertion that delayed release depends primarily on intraterminal buffer capacity (Fig. 2).
Discussion
We identified a slow component of exocytosis from RBs that involved vesicles apart from the ribbon-associated RRP. These vesicles were released following large, global changes in intraterminal [Ca2+] observed by fluorescent indicator imaging. Computational modeling of presynaptic Ca2+ dynamics based on EM reconstruction supported the conclusion that physiologically relevant, ribbon-independent transmission occurs at RB synapses following saturation of endogenous Ca2+ buffers. Similarly, physiologically relevant buffer saturation has been observed at other synapses, e.g., the calyx of Held (Felmy et al., 2003; Habets and Borst, 2006).
Ca channel-release site coupling at ribbon synapses
Presynaptic Ca channels at ribbon synapses are located in the plasma membrane at the base of the ribbon (Roberts et al., 1990; Morgans et al., 2001; Berntson and Morgans, 2003; tom Dieck et al., 2005; Frank et al., 2010). In keeping with the notion that the ribbon serves to tether the RRP close to Ca channels (for review, see Moser et al., 2006; Matthews and Fuchs, 2010; Cho and von Gersdorff, 2012), the opening of single Ca channels in RB terminals controls exocytosis on millisecond timescales (Jarsky et al., 2010). This implies that [Ca2+] changes over spatially restricted “nanodomains” evoke neurotransmission from RBs (Jarsky et al., 2010); the existence of similar nanodomain release sites at other ribbon and conventional synapses also has been inferred (Stanley, 1993; Brandt et al., 2005; Keen and Hudspeth, 2006; Shahrezaei et al., 2006; Wang et al., 2008; Bucurenciu et al., 2010; Graydon et al., 2011; Scimemi and Diamond, 2012).
Here, two experimental observations indicated that exocytosis over longer (>100 ms) timescales is regulated by global, rather than local, [Ca2+] changes arising from sustained Ca2+ influx. One, sustained presynaptic depolarizations, even to physiological potentials, evoked delayed EPSCs (Fig. 4). Delayed EPSCs were not dependent upon release of Ca2+ from intracellular stores (Fig. 3), and the rates at which they developed varied with presynaptic buffer capacity but were independent of buffer kinetics (Fig. 4). In some respects, then, delayed release from RB terminals resembles a slow component of exocytosis from auditory hair cells, from which slow exocytosis of vesicles not originally associated with the RRP is driven by delayed elevation in [Ca2+] (Schnee et al., 2011). It is uncertain, though, whether slow exocytosis from hair cells contributes to auditory stimulus coding in auditory nerve fibers (Frank et al., 2010).
Two, delayed release persisted after ribbon function was eliminated by FALI (Fig. 2), and it was similar in the presence of fast and slow Ca2+ buffers (BAPTA and EGTA, respectively; Fig. 4). The former suggested that the vesicles underlying the delayed current might undergo exocytosis at sites distinct from ribbon-type AZs, though we cannot eliminate the possibility that a slow mode of exocytosis, driven by global [Ca2+] and unaffected by FALI, occurs at synaptic ribbons. The latter indicated that buffer capacity, not kinetics, governed exocytosis of the responsible vesicles and implied that delayed release was evoked by Ca2+ acting in the RB terminal at some distance from its sites of entry at the base of the ribbon (Naraghi and Neher, 1997; Neher, 1998).
Large, global [Ca2+] changes in RB terminals
Ca channels in RB terminals have low maximal open probabilities, and the endogenous buffer capacities of bipolar cell axon terminals are high (Burrone et al., 2002; Singer and Diamond, 2003; Jarsky et al., 2010). Thus, it would seem that global [Ca2+] changes generated by few open channels per AZ would be minimal. But, imaging of the low-affinity Ca2+ indicator Fluo-4FF indicated that sustained depolarizations, even at physiological potentials, generated intraterminal [Ca2+] sufficient to saturate strong buffers (Fig. 5): 10- to 20-fold increases in Fluo-4FF fluorescence were observed during prolonged depolarizations; this represents a 10- to 20-fold—or greater—increase in [Ca2+] (Pologruto et al., 2004). Assuming resting [Ca2+] ≈ 50–100 nm (Wan et al., 2010), such an increase would place intraterminal [Ca2+] in the low micromolar range required for neurotransmitter release from RBs (Jarsky et al., 2010).
Our model supports this interpretation of our observations. Notably, simulated buffer saturation (Fig. 8), the large change in Fluo-4FF fluorescence (Fig. 5), and the onset of delayed release (Fig. 4) developed with similar time courses. This correspondence indicated that a simple model was sufficient to describe the phenomenon at hand. In particular, we did not try to capture Ca2+ diffusion from a varicosity into an axon branch because in a whole RB, Ca2+ influx at AZs both in the varicosities and in the axon branches (Fig. 6) will occur simultaneously, thereby reducing or eliminating [Ca2+] gradients between compartments.
Finally, both numbers of AZs (Fig. 6) and Fluo-4FF signals (Fig. 5) varied between varicosities and did not depend on varicosity size. Thus, it seems possible that signaling from different RB varicosities is heterogeneous and, perhaps, that individual varicosities can signal independently; an evaluation of this idea, however, requires first determining whether different varicosities contact unique postsynaptic AIIs. It is notable, though, that heterogeneity in Ca2+ influx between ribbon-type AZs in cochlear hair cells has been observed and may contribute to differences in postsynaptic fiber responses (Frank et al., 2009).
Implications for understanding the role(s) of synaptic ribbons
The RRP at RB synapses comprises <10 vesicles, and a functional synaptic ribbon is a prerequisite for release from the RRP (Singer and Diamond, 2006; Zhou et al., 2006; Oltedal and Hartveit, 2010; Snellman et al., 2011). In keeping with the ribbon's role as an organizing site for exocytosis of cycling vesicles, capacitance measurements of the functional vesicle pool size at retinal ribbon synapses is correlated closely with the number of ribbon-associated vesicles determined from EM (von Gersdorff et al., 1996; Heidelberger, 1998; Heidelberger et al., 2002; Zhou et al., 2006). Thus, it would appear that the vesicles that contribute to synaptic signaling should undergo exocytosis proximate to the ribbons on which they were primed.
Vesicles undergo final priming steps after associating with ribbons (Heidelberger, 1998; Heidelberger et al., 2002). When ribbon function is disrupted by FALI, although vesicles continue to associate with ribbons, synchronized exocytosis evoked by brief voltage steps (<100 ms) is abolished (Snellman et al., 2011). These findings support the notion that exocytosis occurs from the plasma membrane at the bases of the synaptic ribbons.
Here, we found that following FALI and the inhibition of transient EPSCs, delayed EPSCs persisted (Fig. 2). This finding does not eliminate the ribbon as a site of tonic exocytosis at ribbon synapses; indeed, transmission at retinal and cochlear ribbon synapses involves both transient and sustained release that is well described as originating from a single, ribbon-associated RRP (Singer and Diamond, 2006; Frank et al., 2010; Jarsky et al., 2011; Oesch and Diamond, 2011). Rather, we suggest that only the delayed component of the EPSCs reflected exocytosis of vesicles at sites away from ribbons, as has been observed by imaging the fluorescent vesicle marker FM1–43 in isolated teleost and amphibian retinal neurons (Zenisek et al., 2003; Midorikawa et al., 2007; Chen et al., 2013).
We believe that these sites are truly ectopic rather than conventional (i.e., not ribbon) synapses within the RB terminal because RBs have not been found to contain conventional presynaptic AZs (Raviola and Raviola, 1982; Dacheux and Raviola, 1986; Raviola and Dacheux, 1987; Strettoi et al., 1990; Tsukamoto et al., 2001; Tsukamoto and Omi, 2013). Additional evidence for this type of ectopic release comes from an EM study of mammalian rods that found “omega” profiles indicative of exocytosis on the presynaptic membrane away from the ribbon (Zampighi et al., 2011).
Although it is possible that the delayed EPSC arises from exocytosis of ribbon-associated vesicles that are driven into a releasable state by elevated intraterminal [Ca2+], two lines of experimental evidence argue against this being the primary mechanism underlying the phenomenon: (1) depletion of the RRP (presumably ribbon-associated) has no effect on the delayed EPSC (Fig. 2) and (2) the ribbon is fairly small, and most vesicles on it are within ∼200 nm of the plasma membrane, a distance over which BAPTA and EGTA would be expected to affect release differentially because of their different Ca2+ binding rates (Naraghi and Neher, 1997; Neher, 1998).
Together with results from experiments with turtle hair cells (Schnee et al., 2011), salamander photoreceptors (Chen et al., 2013), and goldfish bipolar cells (Midorikawa et al., 2007), our study provides evidence that synaptic ribbons are not required for exocytosis from neurons with ribbon-type presynaptic AZs. Notably, our results add to a growing body of evidence indicating that disruption of the AZ or of the function of proteins resident to it does not eliminate synaptic transmission entirely. For example, knock-outs of piccolo, bassoon, rim1, rim2, cast1, and cast2, proteins found near or within synaptic ribbons or conventional AZs, still exhibit synaptic transmission, albeit in a compromised manner (tom Dieck et al., 2005; Kaeser et al., 2009; Frank et al., 2010; Mukherjee et al., 2010; Han et al., 2011; Kantardzhieva et al., 2012). Interestingly, proteins essential for exocytosis (e.g., SNAREs) are found dispersed throughout the synaptic terminals of photoreceptor and bipolar cell terminals rather than concentrated specifically at synaptic ribbons (Morgans et al., 1996).
Footnotes
We thank J. Jiang for technical support; S. Ali, A. Ayala, P. Ghorbani, C. Hahn, J. Masison, A. Merrihew, N. Park, K. Sistani, and M. Yi for assistance with EM reconstruction; Victor Matveev for his help with CalC; and Greg Sullivan for access to the computing resources of the UMD Particle Astrophysics group. Supported by EY017836 to J.H.S.; by 014990 to D.Z.; and by the Intramural Research Program of the National Institutes of Health, National Institute of Neurological Disorders and Stroke (K.L.B.). S.N. received support from a grant to the University of Maryland from the Howard Hughes Medical Institute through the Precollege and Undergraduate Science Education Program.
The authors declare no competing financial interests.
References
- Berntson A, Taylor WR. Response characteristics and receptive field widths of on-bipolar cells in the mouse retina. J Physiol. 2000;524:879–889. doi: 10.1111/j.1469-7793.2000.00879.x. [DOI] [PMC free article] [PubMed] [Google Scholar]
- Berntson AK, Morgans CW. Distribution of the presynaptic calcium sensors, synaptotagmin I/II and synaptotagmin III, in the goldfish and rodent retinas. J Vis. 2003;3(4):274–280. doi: 10.1167/3.4.3. [DOI] [PubMed] [Google Scholar]
- Brandt A, Khimich D, Moser T. Few CaV1.3 channels regulate the exocytosis of a synaptic vesicle at the hair cell ribbon synapse. J Neurosci. 2005;25:11577–11585. doi: 10.1523/JNEUROSCI.3411-05.2005. [DOI] [PMC free article] [PubMed] [Google Scholar]
- Briggman KL, Helmstaedter M, Denk W. Wiring specificity in the direction-selectivity circuit of the retina. Nature. 2011;471:183–188. doi: 10.1038/nature09818. [DOI] [PubMed] [Google Scholar]
- Bucurenciu I, Bischofberger J, Jonas P. A small number of open Ca2+ channels trigger transmitter release at a central GABAergic synapse. Nat Neurosci. 2010;13:19–21. doi: 10.1038/nn.2461. [DOI] [PubMed] [Google Scholar]
- Buran BN, Strenzke N, Neef A, Gundelfinger ED, Moser T, Liberman MC. Onset coding is degraded in auditory nerve fibers from mutant mice lacking synaptic ribbons. J Neurosci. 2010;30:7587–7597. doi: 10.1523/JNEUROSCI.0389-10.2010. [DOI] [PMC free article] [PubMed] [Google Scholar]
- Burrone J, Neves G, Gomis A, Cooke A, Lagnado L. Endogenous calcium buffers regulate fast exocytosis in the synaptic terminal of retinal bipolar cells. Neuron. 2002;33:101–112. doi: 10.1016/S0896-6273(01)00565-7. [DOI] [PubMed] [Google Scholar]
- Chen M, Van Hook MJ, Zenisek D, Thoreson WB. Properties of ribbon and non-ribbon release from rod photoreceptors revealed by visualizing individual synaptic vesicles. J Neurosci. 2013;33:2071–2086. doi: 10.1523/JNEUROSCI.3426-12.2013. [DOI] [PMC free article] [PubMed] [Google Scholar]
- Cho S, von Gersdorff H. Ca2+ influx and neurotransmitter release at ribbon synapses. Cell Calcium. 2012;52:208–216. doi: 10.1016/j.ceca.2012.06.004. [DOI] [PMC free article] [PubMed] [Google Scholar]
- Dacheux RF, Raviola E. The rod pathway in the rabbit retina: a depolarizing bipolar and amacrine cell. J Neurosci. 1986;6:331–345. doi: 10.1523/JNEUROSCI.06-02-00331.1986. [DOI] [PMC free article] [PubMed] [Google Scholar]
- Demb JB, Singer JH. Intrinsic properties and functional circuitry of the AII amacrine cell. Vis Neurosci. 2012;29:51–60. doi: 10.1017/S0952523811000368. [DOI] [PMC free article] [PubMed] [Google Scholar]
- DeVries SH. Exocytosed protons feedback to suppress the Ca2+ current in mammalian cone photoreceptors. Neuron. 2001;32:1107–1117. doi: 10.1016/S0896-6273(01)00535-9. [DOI] [PubMed] [Google Scholar]
- Euler T, Masland RH. Light-evoked responses of bipolar cells in a mammalian retina. J Neurophysiol. 2000;83:1817–1829. doi: 10.1152/jn.2000.83.4.1817. [DOI] [PubMed] [Google Scholar]
- Felmy F, Neher E, Schneggenburger R. Probing the intracellular calcium sensitivity of transmitter release during synaptic facilitation. Neuron. 2003;37:801–811. doi: 10.1016/S0896-6273(03)00085-0. [DOI] [PubMed] [Google Scholar]
- Frank T, Khimich D, Neef A, Moser T. Mechanisms contributing to synaptic Ca2+ signals and their heterogeneity in hair cells. Proc Natl Acad Sci U S A. 2009;106:4483–4488. doi: 10.1073/pnas.0813213106. [DOI] [PMC free article] [PubMed] [Google Scholar]
- Frank T, Rutherford MA, Strenzke N, Neef A, Pangrs̆ic̆ T, Khimich D, Fetjova A, Gundelfinger ED, Liberman MC, Harke B, Bryan KE, Lee A, Egner A, Riedel D, Moser T. Bassoon and the synaptic ribbon organize Ca(2)+ channels and vesicles to add release sites and promote refilling. Neuron. 2010;68:724–738. doi: 10.1016/j.neuron.2010.10.027. [DOI] [PMC free article] [PubMed] [Google Scholar]
- Ghosh KK, Bujan S, Haverkamp S, Feigenspan A, Wässle H. Types of bipolar cells in the mouse retina. J Comp Neurol. 2004;469:70–82. doi: 10.1002/cne.10985. [DOI] [PubMed] [Google Scholar]
- Graydon CW, Cho S, Li GL, Kachar B, von Gersdorff H. Sharp Ca2+ nanodomains beneath the ribbon promote highly synchronous multivesicular release at hair cell synapses. J Neurosci. 2011;31:16637–16650. doi: 10.1523/JNEUROSCI.1866-11.2011. [DOI] [PMC free article] [PubMed] [Google Scholar]
- Habets RL, Borst JG. An increase in calcium influx contributes to post-tetanic potentiation at the rat calyx of Held synapse. J Neurophysiol. 2006;96:2868–2876. doi: 10.1152/jn.00427.2006. [DOI] [PubMed] [Google Scholar]
- Haeseleer F, Sokal I, Verlinde CL, Erdjument-Bromage H, Tempst P, Pronin AN, Benovic JL, Fariss RN, Palczewski K. Five members of a novel Ca2+-binding protein (CABP) subfamily with similarity to calmodulin. J Biol Chem. 2000;275:1247–1260. doi: 10.1074/jbc.275.2.1247. [DOI] [PMC free article] [PubMed] [Google Scholar]
- Han Y, Kaeser PS, Südhof TC, Schneggenburger R. RIM determines Ca2+ channel density and vesicle docking at the presynaptic active zone. Neuron. 2011;69:304–316. doi: 10.1016/j.neuron.2010.12.014. [DOI] [PMC free article] [PubMed] [Google Scholar]
- Heidelberger R. Adenosine triphosphate and the late steps in calcium-dependent exocytosis at a ribbon synapse. J Gen Physiol. 1998;111:225–241. doi: 10.1085/jgp.111.2.225. [DOI] [PMC free article] [PubMed] [Google Scholar]
- Heidelberger R, Matthews G. Calcium influx and calcium current in single synaptic terminals of goldfish retinal bipolar neurons. J Physiol. 1992;447:235–256. doi: 10.1113/jphysiol.1992.sp019000. [DOI] [PMC free article] [PubMed] [Google Scholar]
- Heidelberger R, Sterling P, Matthews G. Roles of ATP in depletion and replenishment of the releasable pool of synaptic vesicles. J Neurophysiol. 2002;88:98–106. doi: 10.1152/jn.2002.88.1.98. [DOI] [PubMed] [Google Scholar]
- Ishida AT, Stell WK, Lightfoot DO. Rod and cone inputs to bipolar cells in goldfish retina. J Comp Neurol. 1980;191:315–335. doi: 10.1002/cne.901910302. [DOI] [PubMed] [Google Scholar]
- Jarsky T, Tian M, Singer JH. Nanodomain control of exocytosis is responsible for the signaling capability of a retinal ribbon synapse. J Neurosci. 2010;30:11885–11895. doi: 10.1523/JNEUROSCI.1415-10.2010. [DOI] [PMC free article] [PubMed] [Google Scholar]
- Jarsky T, Cembrowski M, Logan SM, Kath WL, Riecke H, Demb JB, Singer JH. A synaptic mechanism for retinal adaptation to luminance and contrast. J Neurosci. 2011;31:11003–11015. doi: 10.1523/JNEUROSCI.2631-11.2011. [DOI] [PMC free article] [PubMed] [Google Scholar]
- Jay DG. Selective destruction of protein function by chromophore-assisted laser inactivation. Proc Natl Acad Sci U S A. 1988;85:5454–5458. doi: 10.1073/pnas.85.15.5454. [DOI] [PMC free article] [PubMed] [Google Scholar]
- Kaeser PS, Deng L, Chávez AE, Liu X, Castillo PE, Südhof TC. ELKS2alpha/CAST deletion selectively increases neurotransmitter release at inhibitory synapses. Neuron. 2009;64:227–239. doi: 10.1016/j.neuron.2009.09.019. [DOI] [PMC free article] [PubMed] [Google Scholar]
- Kantardzhieva A, Peppi M, Lane WS, Sewell WF. Protein composition of immunoprecipitated synaptic ribbons. J Proteome Res. 2012;11:1163–1174. doi: 10.1021/pr2008972. [DOI] [PMC free article] [PubMed] [Google Scholar]
- Keen EC, Hudspeth AJ. Transfer characteristics of the hair cell's afferent synapse. Proc Natl Acad Sci U S A. 2006;103:5537–5542. doi: 10.1073/pnas.0601103103. [DOI] [PMC free article] [PubMed] [Google Scholar]
- Khimich D, Nouvian R, Pujol R, Tom Dieck S, Egner A, Gundelfinger ED, Moser T. Hair cell synaptic ribbons are essential for synchronous auditory signalling. Nature. 2005;434:889–894. doi: 10.1038/nature03418. [DOI] [PubMed] [Google Scholar]
- Krizaj D, Demarco SJ, Johnson J, Strehler EE, Copenhagen DR. Cell-specific expression of plasma membrane calcium ATPase isoforms in retinal neurons. J Comp Neurol. 2002;451:1–21. doi: 10.1002/cne.10281. [DOI] [PMC free article] [PubMed] [Google Scholar]
- Lauritzen JS, Anderson JR, Jones BW, Watt CB, Mohammed S, Hoang JV, Marc RE. ON cone bipolar cell axonal synapses in the OFF inner plexiform layer of the rabbit retina. J Comp Neurol. 2013;521:977–1000. doi: 10.1002/cne.23244. [DOI] [PMC free article] [PubMed] [Google Scholar]
- Matthews G, Fuchs P. The diverse roles of ribbon synapses in sensory neurotransmission. Nat Rev Neurosci. 2010;11:812–822. doi: 10.1038/nrn2924. [DOI] [PMC free article] [PubMed] [Google Scholar]
- Matveev V, Sherman A, Zucker RS. New and corrected simulations of synaptic facilitation. Biophys J. 2002;83:1368–1373. doi: 10.1016/S0006-3495(02)73907-6. [DOI] [PMC free article] [PubMed] [Google Scholar]
- Mehta B, Snellman J, Chen S, Li W, Zenisek D. Synaptic ribbons influence the size and frequency of miniature-like evoked postsynaptic currents. Neuron. 2013;77:516–527. doi: 10.1016/j.neuron.2012.11.024. [DOI] [PMC free article] [PubMed] [Google Scholar]
- Midorikawa M, Tsukamoto Y, Berglund K, Ishii M, Tachibana M. Different roles of ribbon-associated and ribbon-free active zones in retinal bipolar cells. Nat Neurosci. 2007;10:1268–1276. doi: 10.1038/nn1963. [DOI] [PubMed] [Google Scholar]
- Minami N, Berglund K, Sakaba T, Kohmoto H, Tachibana M. Potentiation of transmitter release by protein kinase C in goldfish retinal bipolar cells. J Physiol. 1998;512:219–225. doi: 10.1111/j.1469-7793.1998.219bf.x. [DOI] [PMC free article] [PubMed] [Google Scholar]
- Morgans CW, Brandstätter JH, Kellerman J, Betz H, Wässle H. A SNARE complex containing syntaxin 3 is present in ribbon synapses of the retina. J Neurosci. 1996;16:6713–6721. doi: 10.1523/JNEUROSCI.16-21-06713.1996. [DOI] [PMC free article] [PubMed] [Google Scholar]
- Morgans CW, Gaughwin P, Maleszka R. Expression of the alpha1F calcium channel subunit by photoreceptors in the rat retina. Mol Vis. 2001;7:202–209. [PubMed] [Google Scholar]
- Moser T, Neef A, Khimich D. Mechanisms underlying the temporal precision of sound coding at the inner hair cell ribbon synapse. J Physiol. 2006;576:55–62. doi: 10.1113/jphysiol.2006.114835. [DOI] [PMC free article] [PubMed] [Google Scholar]
- Mukherjee K, Yang X, Gerber SH, Kwon HB, Ho A, Castillo PE, Liu X, Südhof TC. Piccolo and bassoon maintain synaptic vesicle clustering without directly participating in vesicle exocytosis. Proc Natl Acad Sci U S A. 2010;107:6504–6509. doi: 10.1073/pnas.1002307107. [DOI] [PMC free article] [PubMed] [Google Scholar]
- Naraghi M, Neher E. Linearized buffered Ca2+ diffusion in microdomains and its implications for calculation of [Ca2+] at the mouth of a calcium channel. J Neurosci. 1997;17:6961–6973. doi: 10.1523/JNEUROSCI.17-18-06961.1997. [DOI] [PMC free article] [PubMed] [Google Scholar]
- Neher E. Vesicle pools and Ca2+ microdomains: new tools for understanding their roles in neurotransmitter release. Neuron. 1998;20:389–399. doi: 10.1016/S0896-6273(00)80983-6. [DOI] [PubMed] [Google Scholar]
- Oesch NW, Diamond JS. Ribbon synapses compute temporal contrast and encode luminance in retinal rod bipolar cells. Nat Neurosci. 2011;14:1555–1561. doi: 10.1038/nn.2945. [DOI] [PMC free article] [PubMed] [Google Scholar]
- Oltedal L, Hartveit E. Transient release kinetics of rod bipolar cells revealed by capacitance measurement of exocytosis from axon terminals in rat retinal slices. J Physiol. 2010;588:1469–1487. doi: 10.1113/jphysiol.2010.186916. [DOI] [PMC free article] [PubMed] [Google Scholar]
- Palmer MJ, Hull C, Vigh J, von Gersdorff H. Synaptic cleft acidification and modulation of short-term depression by exocytosed protons in retinal bipolar cells. J Neurosci. 2003;23:11332–11341. doi: 10.1523/JNEUROSCI.23-36-11332.2003. [DOI] [PMC free article] [PubMed] [Google Scholar]
- Pologruto TA, Yasuda R, Svoboda K. Monitoring neural activity and [Ca2+] with genetically encoded Ca2+ indicators. J Neurosci. 2004;24:9572–9579. doi: 10.1523/JNEUROSCI.2854-04.2004. [DOI] [PMC free article] [PubMed] [Google Scholar]
- Raviola E, Dacheux RF. Excitatory dyad synapse in rabbit retina. Proc Natl Acad Sci U S A. 1987;84:7324–7328. doi: 10.1073/pnas.84.20.7324. [DOI] [PMC free article] [PubMed] [Google Scholar]
- Raviola E, Raviola G. Structure of the synaptic membranes in the inner plexiform layer of the retina: a freeze-fracture study in monkeys and rabbits. J Comp Neurol. 1982;209:233–248. doi: 10.1002/cne.902090303. [DOI] [PubMed] [Google Scholar]
- Rieke F, Lee A, Haeseleer F. Characterization of Ca2+-binding protein 5 knockout mouse retina. Invest Ophthalmol Vis Sci. 2008;49:5126–5135. doi: 10.1167/iovs.08-2236. [DOI] [PMC free article] [PubMed] [Google Scholar]
- Rieke F, Schwartz EA. Asynchronous transmitter release: control of exocytosis and endocytosis at the salamander rod synapse. J Physiol. 1996;493:1–8. doi: 10.1113/jphysiol.1996.sp021360. [DOI] [PMC free article] [PubMed] [Google Scholar]
- Roberts WM. Localization of calcium signals by a mobile calcium buffer in frog saccular hair cells. J Neurosci. 1994;14:3246–3262. doi: 10.1523/JNEUROSCI.14-05-03246.1994. [DOI] [PMC free article] [PubMed] [Google Scholar]
- Roberts WM, Jacobs RA, Hudspeth AJ. Colocalization of ion channels involved in frequency selectivity and synaptic transmission at presynaptic active zones of hair cells. J Neurosci. 1990;10:3664–3684. doi: 10.1523/JNEUROSCI.10-11-03664.1990. [DOI] [PMC free article] [PubMed] [Google Scholar]
- Sakaba T, Tachibana M, Matsui K, Minami N. Two components of transmitter release in retinal bipolar cells: exocytosis and mobilization of synaptic vesicles. Neurosci Res. 1997;27:357–370. doi: 10.1016/S0168-0102(97)01168-1. [DOI] [PubMed] [Google Scholar]
- Santucci DM, Raghavachari S. The effects of NR2 subunit-dependent NMDA receptor kinetics on synaptic transmission and CaMKII activation. PLoS Comput Biol. 2008;4:e1000208. doi: 10.1371/journal.pcbi.1000208. [DOI] [PMC free article] [PubMed] [Google Scholar]
- Schmitz F. The making of synaptic ribbons: how they are built and what they do. Neuroscientist. 2009;15:611–624. doi: 10.1177/1073858409340253. [DOI] [PubMed] [Google Scholar]
- Schnee ME, Santos-Sacchi J, Castellano-Muñoz M, Kong JH, Ricci AJ. Calcium-dependent synaptic vesicle trafficking underlies indefatigable release at the hair cell afferent fiber synapse. Neuron. 2011;70:326–338. doi: 10.1016/j.neuron.2011.01.031. [DOI] [PMC free article] [PubMed] [Google Scholar]
- Schneider CA, Rasband WS, Eliceiri KW. NIH Image to ImageJ: 25 years of image analysis. Nat Methods. 2012;9:671–675. doi: 10.1038/nmeth.2089. [DOI] [PMC free article] [PubMed] [Google Scholar]
- Schwartz EA. Transport-mediated synapses in the retina. Physiol Rev. 2002;82:875–891. doi: 10.1152/physrev.00010.2002. [DOI] [PubMed] [Google Scholar]
- Scimemi A, Diamond JS. The number and organization of Ca2+ channels in the active zone shapes neurotransmitter release from Schaffer collateral synapses. J Neurosci. 2012;32:18157–18176. doi: 10.1523/JNEUROSCI.3827-12.2012. [DOI] [PMC free article] [PubMed] [Google Scholar]
- Shahrezaei V, Cao A, Delaney KR. Ca2+ from one or two channels controls fusion of a single vesicle at the frog neuromuscular junction. J Neurosci. 2006;26:13240–13249. doi: 10.1523/JNEUROSCI.1418-06.2006. [DOI] [PMC free article] [PubMed] [Google Scholar]
- Singer JH, Diamond JS. Sustained Ca2+ entry elicits transient postsynaptic currents at a retinal ribbon synapse. J Neurosci. 2003;23:10923–10933. doi: 10.1523/JNEUROSCI.23-34-10923.2003. [DOI] [PMC free article] [PubMed] [Google Scholar]
- Singer JH, Diamond JS. Vesicle depletion and synaptic depression at a mammalian ribbon synapse. J Neurophysiol. 2006;95:3191–3198. doi: 10.1152/jn.01309.2005. [DOI] [PubMed] [Google Scholar]
- Singer JH, Lassová L, Vardi N, Diamond JS. Coordinated multivesicular release at a mammalian ribbon synapse. Nat Neurosci. 2004;7:826–833. doi: 10.1038/nn1280. [DOI] [PubMed] [Google Scholar]
- Snellman J, Mehta B, Babai N, Bartoletti TM, Akmentin W, Francis A, Matthews G, Thoreson W, Zenisek D. Acute destruction of the synaptic ribbon reveals a role for the ribbon in vesicle priming. Nat Neurosci. 2011;14:1135–1141. doi: 10.1038/nn.2870. [DOI] [PMC free article] [PubMed] [Google Scholar]
- Stanley EF. Single calcium channels and acetylcholine release at a presynaptic nerve terminal. Neuron. 1993;11:1007–1011. doi: 10.1016/0896-6273(93)90214-C. [DOI] [PubMed] [Google Scholar]
- Strettoi E, Dacheux RF, Raviola E. Synaptic connections of rod bipolar cells in the inner plexiform layer of the rabbit retina. J Comp Neurol. 1990;295:449–466. doi: 10.1002/cne.902950309. [DOI] [PubMed] [Google Scholar]
- Strettoi E, Raviola E, Dacheux RF. Synaptic connections of the narrow-field, bistratified rod amacrine cell (AII) in the rabbit retina. J Comp Neurol. 1992;325:152–168. doi: 10.1002/cne.903250203. [DOI] [PubMed] [Google Scholar]
- Tachibana M, Okada T, Arimura T, Kobayashi K, Piccolino M. Dihydropyridine-sensitive calcium current mediates neurotransmitter release from bipolar cells of the goldfish retina. J Neurosci. 1993;13:2898–2909. doi: 10.1523/JNEUROSCI.13-07-02898.1993. [DOI] [PMC free article] [PubMed] [Google Scholar]
- Thoreson WB, Rabl K, Townes-Anderson E, Heidelberger R. A highly Ca2+-sensitive pool of vesicles contributes to linearity at the rod photoreceptor ribbon synapse. Neuron. 2004;42:595–605. doi: 10.1016/S0896-6273(04)00254-5. [DOI] [PMC free article] [PubMed] [Google Scholar]
- Tian M, Jarsky T, Murphy GJ, Rieke F, Singer JH. Voltage-gated Na channels in AII amacrine cells accelerate scotopic light responses mediated by the rod bipolar cell pathway. J Neurosci. 2010;30:4650–4659. doi: 10.1523/JNEUROSCI.4212-09.2010. [DOI] [PMC free article] [PubMed] [Google Scholar]
- tom Dieck S, Altrock WD, Kessels MM, Qualmann B, Regus H, Brauner D, Fejtová A, Bracko O, Gundelfinger ED, Brandstätter JH. Molecular dissection of the photoreceptor ribbon synapse: physical interaction of Bassoon and RIBEYE is essential for the assembly of the ribbon complex. J Cell Biol. 2005;168:825–836. doi: 10.1083/jcb.200408157. [DOI] [PMC free article] [PubMed] [Google Scholar]
- Tsukamoto Y, Morigiwa K, Ueda M, Sterling P. Microcircuits for night vision in mouse retina. J Neurosci. 2001;21:8616–8623. doi: 10.1523/JNEUROSCI.21-21-08616.2001. [DOI] [PMC free article] [PubMed] [Google Scholar]
- Tsukamoto Y, Omi N. Functional allocation of synaptic contacts in microcircuits from rods via rod bipolar to AII amacrine cells in the mouse retina. J Comp Neurol. 2013;521:3541–3555. doi: 10.1002/cne.23370. [DOI] [PMC free article] [PubMed] [Google Scholar]
- Veruki ML, Hartveit E. Meclofenamic acid blocks electrical synapses of retinal AII amacrine and on-cone bipolar cells. J Neurophysiol. 2009;101:2339–2347. doi: 10.1152/jn.00112.2009. [DOI] [PubMed] [Google Scholar]
- von Gersdorff H, Vardi E, Matthews G, Sterling P. Evidence that vesicles on the synaptic ribbon of retinal bipolar neurons can be rapidly released. Neuron. 1996;16:1221–1227. doi: 10.1016/S0896-6273(00)80148-8. [DOI] [PubMed] [Google Scholar]
- von Gersdorff H, Sakaba T, Berglund K, Tachibana M. Submillisecond kinetics of glutamate release from a sensory synapse. Neuron. 1998;21:1177–1188. doi: 10.1016/S0896-6273(00)80634-0. [DOI] [PubMed] [Google Scholar]
- Wan QF, Zhou ZY, Thakur P, Vila A, Sherry DM, Janz R, Heidelberger R. SV2 acts via presynaptic calcium to regulate neurotransmitter release. Neuron. 2010;66:884–895. doi: 10.1016/j.neuron.2010.05.010. [DOI] [PMC free article] [PubMed] [Google Scholar]
- Wan QF, Nixon E, Heidelberger R. Regulation of presynaptic calcium in a mammalian synaptic terminal. J Neurophysiol. 2012;108:3059–3067. doi: 10.1152/jn.00213.2012. [DOI] [PMC free article] [PubMed] [Google Scholar]
- Wang LY, Neher E, Taschenberger H. Synaptic vesicles in mature calyx of Held synapses sense higher nanodomain calcium concentrations during action potential-evoked glutamate release. J Neurosci. 2008;28:14450–14458. doi: 10.1523/JNEUROSCI.4245-08.2008. [DOI] [PMC free article] [PubMed] [Google Scholar]
- Wässle H, Puller C, Müller F, Haverkamp S. Cone contacts, mosaics, and territories of bipolar cells in the mouse retina. J Neurosci. 2009;29:106–117. doi: 10.1523/JNEUROSCI.4442-08.2009. [DOI] [PMC free article] [PubMed] [Google Scholar]
- Wingard JN, Chan J, Bosanac I, Haeseleer F, Palczewski K, Ikura M, Ames JB. Structural analysis of Mg2+ and Ca2+ binding to CaBP1, a neuron-specific regulator of calcium channels. J Biol Chem. 2005;280:37461–37470. doi: 10.1074/jbc.M508541200. [DOI] [PMC free article] [PubMed] [Google Scholar]
- Woo DH, Han KS, Shim JW, Yoon BE, Kim E, Bae JY, Oh SJ, Hwang EM, Marmorstein AD, Bae YC, Park JY, Lee CJ. TREK-1 and Best1 channels mediate fast and slow glutamate release in astrocytes upon GPCR activation. Cell. 2012;151:25–40. doi: 10.1016/j.cell.2012.09.005. [DOI] [PubMed] [Google Scholar]
- Yang J, McBride S, Mak DO, Vardi N, Palczewski K, Haeseleer F, Foskett JK. Identification of a family of calcium sensors as protein ligands of inositol trisphosphate receptor Ca2+ release channels. Proc Natl Acad Sci U S A. 2002;99:7711–7716. doi: 10.1073/pnas.102006299. [DOI] [PMC free article] [PubMed] [Google Scholar]
- Yushkevich PA, Piven J, Hazlett HC, Smith RG, Ho S, Gee JC, Gerig G. User-guided 3D active contour segmentation of anatomical structures: significantly improved efficiency and reliability. Neuroimage. 2006;31:1116–1128. doi: 10.1016/j.neuroimage.2006.01.015. [DOI] [PubMed] [Google Scholar]
- Zampighi GA, Schietroma C, Zampighi LM, Woodruff M, Wright EM, Brecha NC. Conical tomography of a ribbon synapse: structural evidence for vesicle fusion. PLoS One. 2011;6:e16944. doi: 10.1371/journal.pone.0016944. [DOI] [PMC free article] [PubMed] [Google Scholar]
- Zanazzi G, Matthews G. The molecular architecture of ribbon presynaptic terminals. Mol Neurobiol. 2009;39:130–148. doi: 10.1007/s12035-009-8058-z. [DOI] [PMC free article] [PubMed] [Google Scholar]
- Zenisek D. Vesicle association and exocytosis at ribbon and extraribbon sites in retinal bipolar cell presynaptic terminals. Proc Natl Acad Sci U S A. 2008;105:4922–4927. doi: 10.1073/pnas.0709067105. [DOI] [PMC free article] [PubMed] [Google Scholar]
- Zenisek D, Davila V, Wan L, Almers W. Imaging calcium entry sites and ribbon structures in two presynaptic cells. J Neurosci. 2003;23:2538–2548. doi: 10.1523/JNEUROSCI.23-07-02538.2003. [DOI] [PMC free article] [PubMed] [Google Scholar]
- Zenisek D, Horst NK, Merrifield C, Sterling P, Matthews G. Visualizing synaptic ribbons in the living cell. J Neurosci. 2004;24:9752–9759. doi: 10.1523/JNEUROSCI.2886-04.2004. [DOI] [PMC free article] [PubMed] [Google Scholar]
- Zhou ZY, Wan QF, Thakur P, Heidelberger R. Capacitance measurements in the mouse rod bipolar cell identify a pool of releasable synaptic vesicles. J Neurophysiol. 2006;96:2539–2548. doi: 10.1152/jn.00688.2006. [DOI] [PubMed] [Google Scholar]
Associated Data
This section collects any data citations, data availability statements, or supplementary materials included in this article.
Supplementary Materials
Three hundred sixty degree rotation allows visualization of pre- and postsynaptic elements at a reconstructed RB terminal varicosity.