Abstract
Auxological data is the gold standard index of the therapeutic condition in CYP21A2 deficiency over a long-range period, whereas urinary pregnanetriol for 24 h (PT) is variable for a shorter-range period. Ideal PT levels in comparison with auxological data have not been reported. The main purpose of this study was to analyze ideal PT values as an index of optimal control for CYP21A2 deficiency. First, inter-daily fluctuation of PT was analyzed in one participant. PT levels were distributed over a wide range of 0.44–14.7 mg/day (n=42) in this participant, suggesting that the therapeutic condition should be judged by multiple PT samples. Second, the therapeutic periods of 15 participants with CYP21A2 deficiency were classified using auxological data and Cushing-like symptoms, and the PT levels were analyzed in each period retrospectively. The 95% confidence intervals for the means of the PT levels in the excessive, good and poor control periods were 0.03–1.25 (n=26), 1.23–2.09 (n=116), and 5.35–8.37 (n=72) mg/m2/day, respectively. In conclusion, 1.2–2.1 mg/m2/day of PT values can be used as an index of optimal control in CYP21A2 deficiency.
Keywords: CYP21A2 deficiency, urinary pregnanetriol, auxological data
Introduction
CYP21A2 deficiency is an autosomal recessive disease caused by mutations in the CYP21A2 gene (1). About 90% of cases of congenital adrenal hyperplasia are due to mutations in the CYP21A2 gene (1), and its incidence is about 1 in 20,000 live births in Japan (2). The aims of treatment for CYP21A2 deficiency are to supply glucocorticoids and mineralocorticoids and to suppress excessive secretions of androgen and ACTH. The major goals of the treatment are to maintain normal growth and to allow normal sexual maturation in order for the patient to achieve normal adult height and fertility. Glucocorticoids have a narrow optimal therapeutic dose and overtreatment leads to Cushing-like symptoms. Conversely, undertreatment leads to increased height velocity, advanced bone age and hyperpigmentation due to excesses of androgen and ACTH. Therefore careful monitoring of clinical, auxological and biochemical indexes has been used to judge the therapeutic condition.
Auxological data is the gold standard index of the therapeutic condition in patients with CYP21A2 deficiency over a long-range period (months to a year) (3,4,5). Urinary pregnanetriol for 24 h (PT) (5,6,7,8) and serum 17OH-progesterone (17OHP) (6,7,8,9,10) are used as indexes for a shorter-range period (hours to days). Previous studies have shown that single random measurement of 17OHP was not reliable, because it fluctuated widely depending on the circadian rhythm of ACTH (9, 10). PT presumably can be used as a more stable index of the therapeutic condition than 17OHP in patients with CYP21A2 deficiency. Ideal PT levels in comparison with auxological data have not been reported. The main purpose of this study was to analyze ideal PT values as an index of optimal control, compared with auxological data and Cushing-like symptoms.
Participants
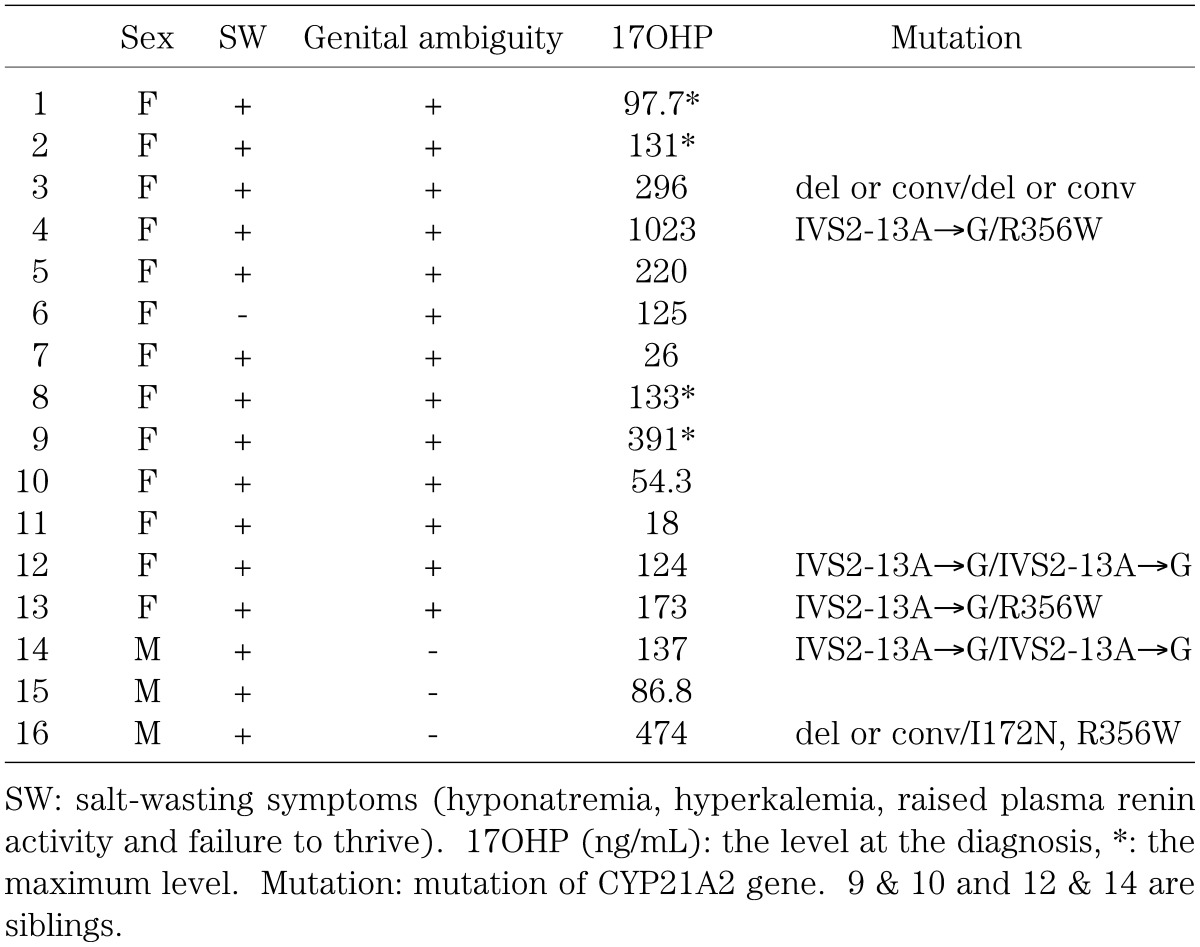
Sixteen participants with CYP21A2 deficiency (3 males and 13 females) who had been followed up in Tokyo Metropolitan Kiyose Children’s Hospital were studied. The characteristics of all the participants are shown in Table 1. As replacement therapy, oral hydrocortisone or dexamethasone was used for all participants, and fludrocortisone was used together except for one participant who had the simple virilizing form (Table 1; participant 6). CYP21A2 gene analyses were performed for 6 participants after obtaining informed consent of the participants and/or their parents, and its mutations were identified for all the participants.
Table 1. Participants.
Methods
1. Auxological data
Standard deviation scores (SDS) of height (HT) and body weight (BW) were analyzed for 15 participants (Table 1; participant 2–16) using software, Growth Curve for Access 2000 (11). In this software, the normalized growth curve was drawn based on the results of the survey conducted by Japanese Ministry of Health, Labour and Welfare (12) and the Ministry of Education, Culture, Sports, Science and Technology (13) in 2000. Monthly standard levels of HT and BW were defined and SDSs of HT and BW were calculated using the LMS method (14, 15). The original sources of the growth curve (12, 13) in this program were the same as those of another growth curve published by Ito et al. (16).
2. PT
Inter-daily fluctuation of PT
Inter-daily fluctuation of PT was analyzed in one adult participant (Table 1; participant 1). This participant took medication and collected the 24-h urine samples at her home under the supervision of her mother. Forty-two urine samples for PT measurements were obtained over a period of about 3 yr (25–28 yr old) and the creatinine index was distributed within a range of 11.9–26.5 mg/kg/day. The participant was treated with about 30 mg/m2/day of hydrocortisone given twice and the dose was not changed during the period. Her body weight was fairly constant (48.3–49.0 kg) during the analysis period.
Standard values of PT as indexes of therapeutic conditions
For 15 participants (Table 1; participant 2–16), 24-h urine samples for PT measurements were taken at their homes or at our hospital every 1–3 mo. The creatinine index was used to judge the accuracy of the urine collection, and only samples with 10–25 mg/kg/day of creatinine index were analyzed retrospectively in this study.
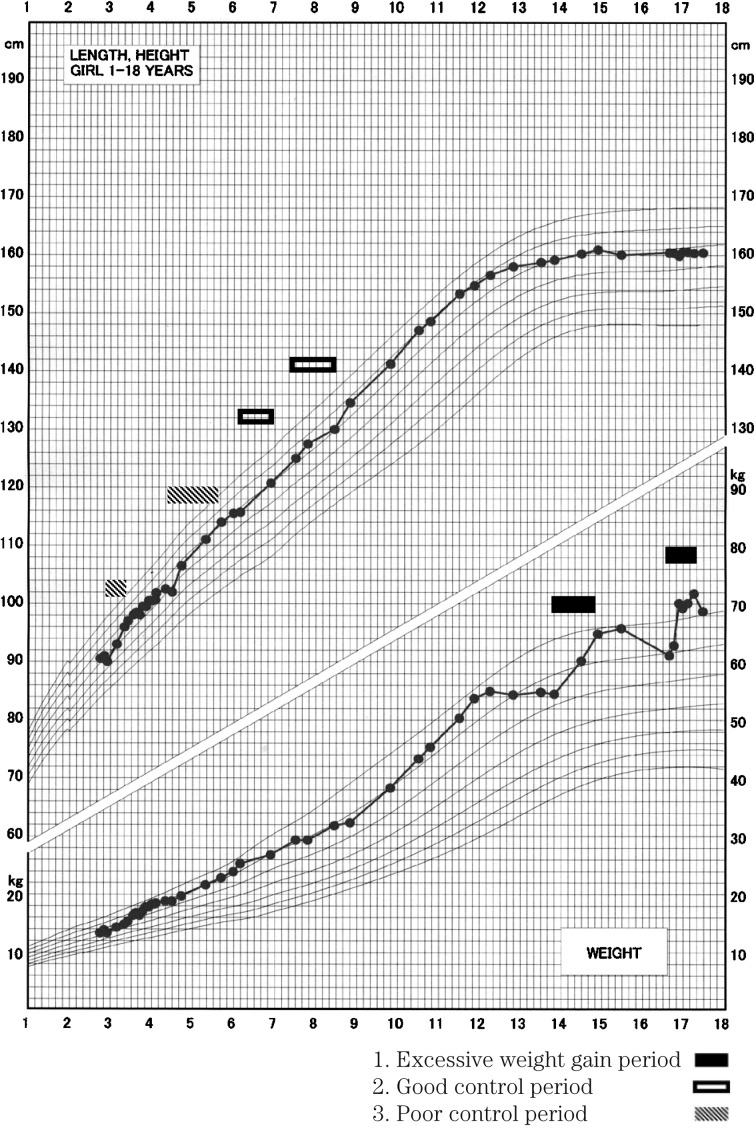
PT levels were analyzed in the periods shown in Fig. 1 and Table 2. PT measurements from the first and last months of the periods were excluded from the analysis.
Fig. 1.
Growth curve.
Table 2. Definitions of the investigative periods.
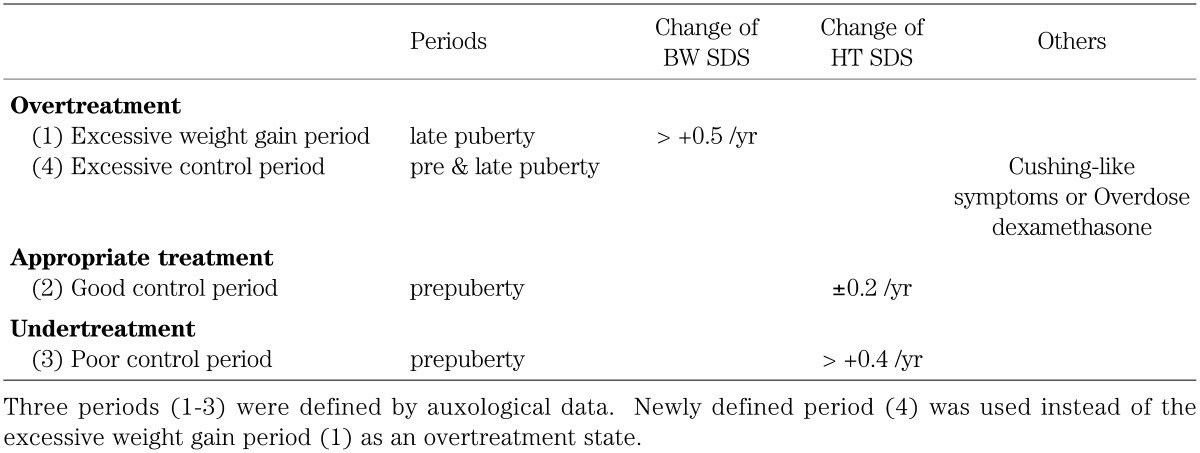
Excessive weight gain period: When change of BW SDS was more than 0.5/yr during the late pubertal period (male > 14 yr old, female > 12 yr old), it was classified as an excessive weight gain period. The periods ranged from 5–17 mo and BW SDSs steadily increased in these periods. These periods may reflect overtreatment.
Good control period: When maximal change of HT SDS was less than ± 0.2/yr during the prepubertal period (Tanner stage 1), it was classified as a good control period. The periods ranged from 12–30 mo. These periods may reflect appropriate treatment.
Poor control period: When change of HT SDS was more than 0.4/yr during the prepubertal period, it was classified as a poor control period. The periods ranged from 5–23 mo and HT SDSs continuously increased in these periods. These periods may reflect undertreatment.
The PT levels in the excessive weight gain period were distributed widely and they overlapped with PT levels in the other 2 periods (see Results). Thus, the reason for the wide distribution of PT was analyzed and a fourth period, the excessive control period (Table 2), was newly defined as described below.
Excessive control period: When the participants had Cushing-like symptoms (moon face, striae, etc), they were classified under the excessive control period.
3. Assays
Urinary PT was measured by gas chromatography-mass spectrometry using a HP-6690 mass selective detector (Bio Medical Laboratories) with a sensitivity of 0.05 mg/L. The inter-assay coefficients of variation (C.V.) and intra-assay C.V. were 5.66% and 3.78%, respectively, at physiological concentrations.
Serum 17OHP was measured by a solid phase RIA using a DPC 17α-OH progesterone kit (Diagnostic Products Corporation) with a sensitivity of 0.07 ng/mL. The inter-assay C.V. and intra-assay C.V. were both < 10% at physiological concentrations.
4. Statistics
Comparisons between the 3 control periods (excessive, good and poor control period) were performed using Mann-Whitney’s U test. Tenth to 90th percentile ranges, 25th–75th percentile ranges and 95% C.I. of PT levels in each period were calculated.
Results
1. Inter-daily fluctuation of PT
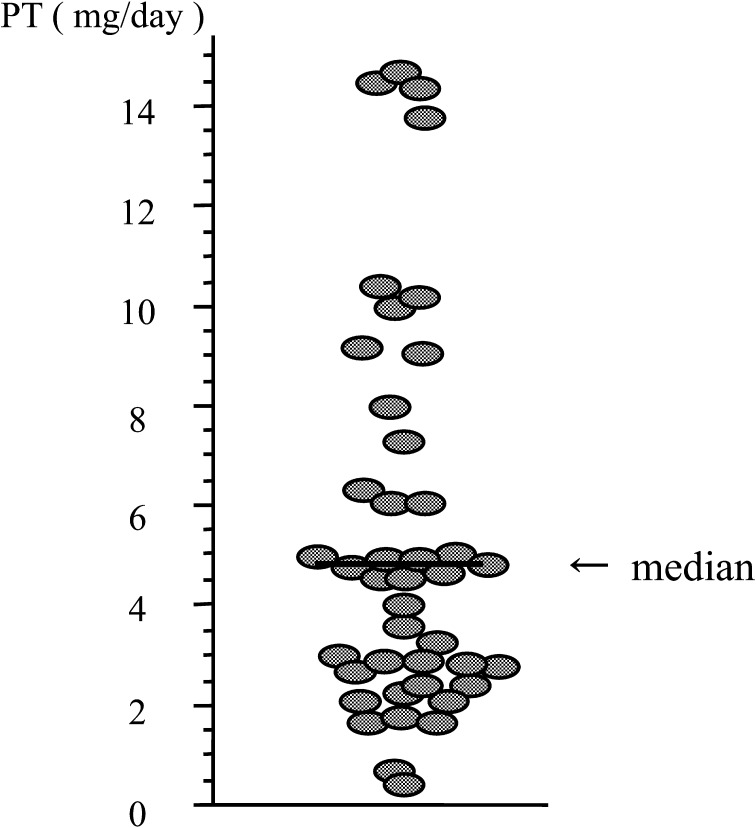
PT levels were distributed in a wide range of 0.44–14.7 mg/day (n=42) in participant 1 (Fig. 2), suggesting that the therapeutic condition should be judged by multiple PT samples.
Fig. 2.
Inter-daily fluctuation of PT. PT levels fluctuated 0.44–14.7 mg/day (n=42).
2. Standard values of PT as indexes of therapeutic conditions
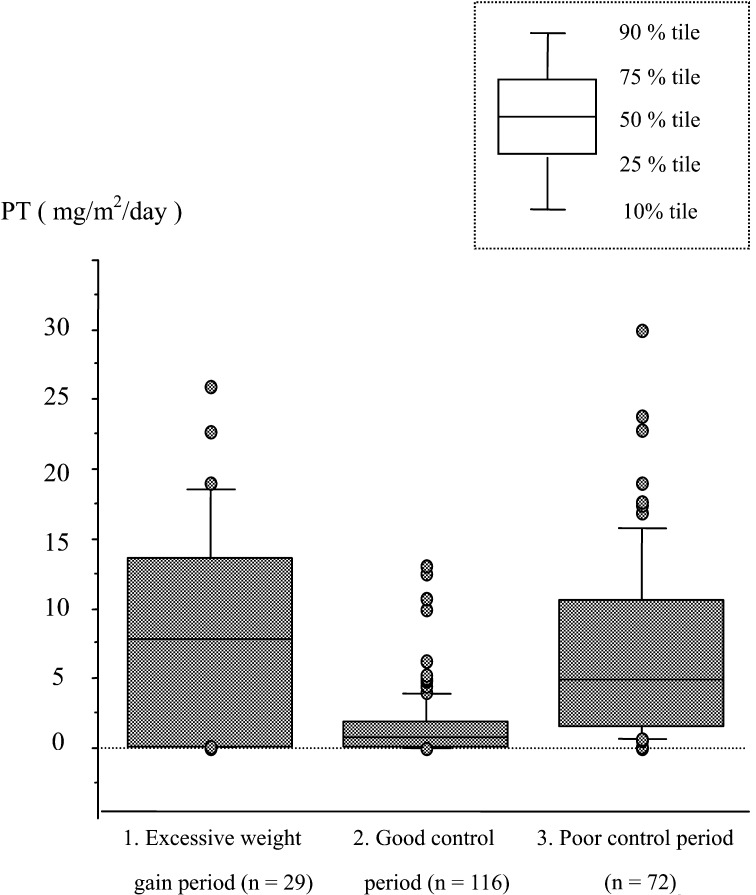
PT levels were distributed in a range of 0.05–25.93 (29 samples from 5 participants, aged 12 yr and 10 mo to 17 yr and 4 mo), 0.06–13.06 (116 samples from 10 participants, aged 2 yr and 6 mo to 9 yr and 7 mo) and 0.08–30.0 (72 samples from 7 participants, aged 2 yr and 5 mo to 7 yr and 3 mo) mg/m2/day in the excessive weight gain period, the good control period and the poor control period, respectively (Fig. 3). For the good and poor control periods, 11.5–31.9 and 11.8–24.3 mg/m2 of hydrocortisone were used, respectively. Dosage adjustments occurred in 5 of 10 participants and 4 of 7 participants in the good and the poor control periods, respectively.
Fig. 3.
PT in the 3 periods classified by auxological data. PT levels were distributed over the ranges of 0.05–25.93, 0.06–13.06, 0.08–30.0 mg/m2/day in the excessive weight gain, good control and poor control periods, respectively.
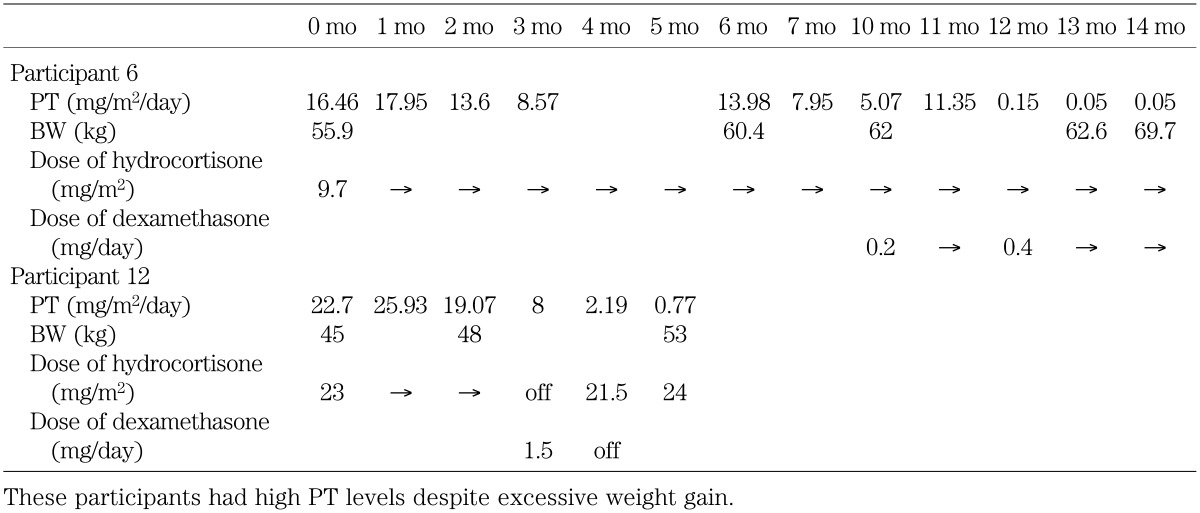
The PT levels in the excessive weight gain period were distributed widely and they overlapped with PT levels in the other 2 periods. Thus, we analyzed the reason for the wide distribution. In this period, 3 of the 5 participants had high PT levels despite excessive weight gain. Transitions of PT levels, BW and dose of drugs in 2 of these 3 participants (Table 1; participant 6 & 12) are shown in Table 3. The dose of hydrocortisone had been increased gradually from 1 yr before these periods, because their therapeutic conditions were judged as undertreatment. It seems that the high PT levels in these periods were influenced by the preceding undertreatment periods. The reason for excessive weight gain in the other participant (Table 1; participant 2) was unknown. However it was not related with overtreatment, because she did not have any other Cushing-like symptoms and the dose of hydrocortisone had not been increased around this period. Taken together, the excessive weight gain periods in these 3 participants did not reflect overtreatment. The other 2 of the 5 participants in the excessive weight gain period had low PT levels (6 samples, 0.1–0.19 mg/m2/day).
Table 3. PT levels, BW and dose of drugs of 2 participants in the excessive weight gain period.
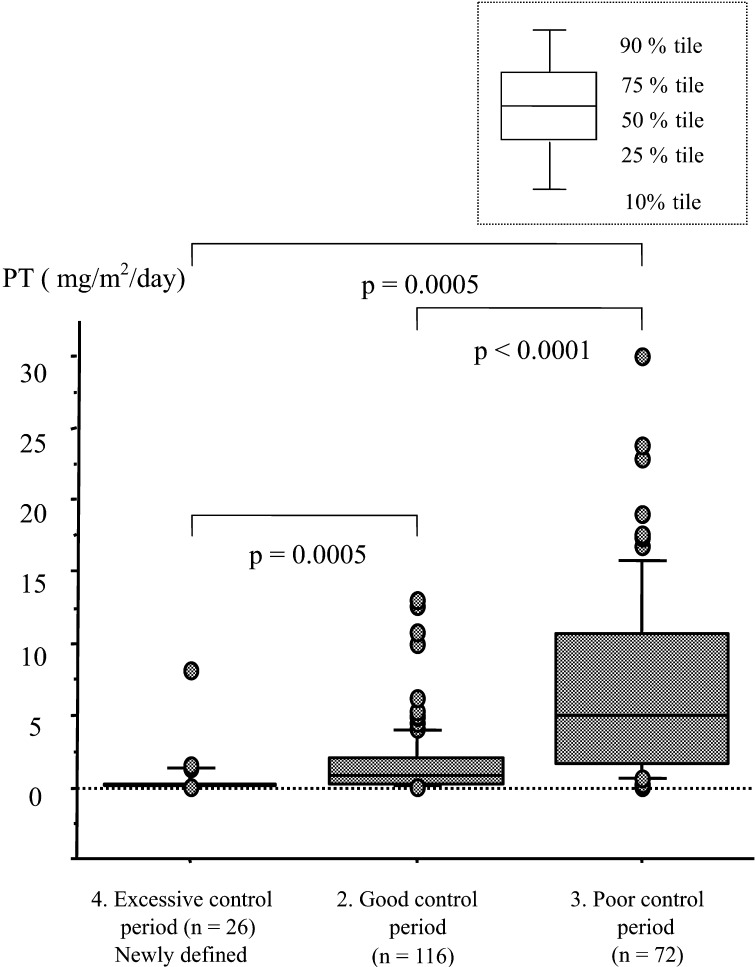
Therefore, we created a fourth period, the excessive control period, defined as an overtreatment state instead of the excessive weight gain period as stated above. PT levels were distributed in a range of 0.05–8.6 mg/m2/day (26 samples from 5 participants) in the excessive control period, and the range was significantly lower than those of the other 2 periods (Fig. 4). Tenth to 90th percentile ranges, 25th–75th percentile ranges, and 95% C.I. of PT levels of the 3 control periods are shown in Table 4. These ranges had a tendency to increase with deterioration of the control state and 95% C.I. of PT levels in each period had narrow overlapping ranges.
Fig. 4.
PT in the periods 2, 3 and 4. PT levels were distributed over the range of 0.05–8.6 mg/m2/day in the newly defined excessive control period. Comparisons between the 3 periods were performed using Mann-Whitney’s U test.
Table 4. Ranges of PT in the 3 control periods.

When PT levels were analyzed similarly using another growth curve (16), we obtained nearly identical results. For example, 95% C.I. of PT levels in the good control period was 1.23–2.11 (n=89) mg/m2/day.
Discussion
The aims of treatment for CYP21A2 deficiency are to maintain a normal growth velocity, to suppress the effects of excessive androgen secretion, to allow normal puberty and to achieve a final height as close to patient’s target height as possible. Auxological data is the most reliable index of the therapeutic conditions over a long-range period. On the other hand, biochemical measurements have been used as indexes of the therapeutic condition over a shorter-range periods, and previous studies have shown their values (5,6,7,8,9,10). PT is one of these indexes and it can be used as a more stable index than 17OHP.
In this study, ideal PT values as an index of optimal control were analyzed. Auxological data and Cushing-like symptoms were used to define therapeutic conditions. As far as we know, this is the first report in which ideal values of PT have been analyzed using auxological data in patients with CYP21A2 deficiency.
Lack of samples in the infantile and pubertal periods is a limitation of this study. It was difficult to collect 24-h urine samples in the infantile period and to assess auxological data in the pubertal period. Therefore, the usefulness of our values of PT were not proven in infantile and pubertal periods in this study. A previous study has shown that the ranges of PT indicating optimal control in patients with CYP21A2 deficiency were 0.05–0.2, 0.2–1.5 and 0.5–3.0 mg/day in the infantile, child and adult periods, respectively (6). When these ranges were adjusted for body surface areas of infants (from 3–24 mo of age; 0.33–0.52 m2) (12), children (from 6–10 yr of age; 0.83–1.16 m2) (13) and adults (1.73 m2), they became 0.1–0.61, 0.17–1.81, and 0.28–1.73 mg/m2/day in the infantile, child and adult periods, respectively. Since these adjusted PT ranges of child and adult periods are close, our ranges of PT may be useful in the pubertal and adult periods, similarly to the prepubertal period.
In conclusion, 1.2–2.1 mg/m2/day of PT can be used as an index of optimal control for CYP21A2 deficiency during the prepubertal period. This is the range of 95% C.I. of PT levels in the good control periods, and it can be used during the pubertal and adult periods, as well. However, the therapeutic condition should be judged by multiple PT samples, because it may fluctuate from day to day.
References
- 1.Paul MS. The adrenal cortex. In: Larsen PR, Kronenberg HM, Melmed S, Polonsky KS, editors. Wiliams textbook of endocrinology. 10th ed, Philadelphia: WB Saunders; 2002. p.491–551. [Google Scholar]
- 2.Tajima T, Fujieda K, Nakae J, Toyoura T, Shimozawa K, Kusuda S, et al. Molecular basis of nonclassical steroid 21-hydroxylase deficiency detected by neonatal mass screening in Japan. J Clin Endocrinol Metab 1997; 82: 2350–6 [DOI] [PubMed] [Google Scholar]
- 3.Appan S, Hindmarsh PC, Brook CGD. Monitoring treatment in congenital adrenal hyperplasia. Arch Dis Child 1989; 64: 1235–9 doi: 10.1136/adc.64.9.1235 [DOI] [PMC free article] [PubMed] [Google Scholar]
- 4.Einaudi S, Lala R, Corrias A, Matarazzo P, Pagliardini S, Sanctis C. Auxological and biochemical parameters in assessing treatment of infants and toddlers with congenital adrenal hyperplasia due to 21-hydroxylase deficiency. J Pediatr Endocrinol 1993; 6: 173–8 [PubMed] [Google Scholar]
- 5.Bailey CC, Komrower GM, Palmer M. Management of congenital adrenal hyperplasia. Arch Dis Child 1978; 53: 132–5 doi: 10.1136/adc.53.2.132 [DOI] [PMC free article] [PubMed] [Google Scholar]
- 6.Knorr D, Bidlingmaier F, Holler W, Kuhnle U. Diagnosis of homozygosity and heterozygosity in congenital adrenal hyperplasia and control of treatment. J Steroid Biochem 1983; 19: 645–53 doi: 10.1016/0022-4731(83)90231-5 [DOI] [PubMed] [Google Scholar]
- 7.Erhardt E, Solyom J, Homoki J, Juricskay S, Soltesz G. Correlation of blood-spot 17-hydroxyprogesterone daily profiles and urinaly steroid profiles in congenital adrenal hyperplasia. J Pediatr Endocrinol Metab 2000; 13: 205–10 doi: 10.1515/JPEM.2000.13.2.205 [DOI] [PubMed] [Google Scholar]
- 8.Hughes IE, Winter JSD. The relationships between serum concentrations of 17OH-progesterone and other serum and urinaly steroids in patients with congenital adrenal hyperplasia. J Clin Endocrinol Metab 1978; 46: 98–104 doi: 10.1210/jcem-46-1-98 [DOI] [PubMed] [Google Scholar]
- 9.Charmandari E, Matthews DR, Johnston A, Brook CGD, Hindmarsh PC. Serum cortisol and 17-hydroxyprogesterone interrelation in classic 21-hydroxylase deficiency: Is current replacement therapy satisfactory? J Pediatr Endocrinol Metab 2001; 86: 4679–85 [DOI] [PubMed] [Google Scholar]
- 10.Young MC, Robinson JA, Read GF, Riad-Fahmy D, Hughes IA. 17OH-progesterone rhythms in congenital adrenal hyperplasia. Arch Dis Child 1988; 63: 617–23 doi: 10.1136/adc.63.6.617 [DOI] [PMC free article] [PubMed] [Google Scholar]
- 11. www.vector.co.jp/soft/dl/win95/business/se255423.html
- 12. www.mhlw.go.jp/houdou/0110/h1024-4.html
- 13. www.mext.go.jp/b_menu/toukei/001/h12/003/001.xls
- 14.Cole TJ. The LMS method for constructing normalized growth standards. Eur J Clin Nutr 1990; 44: 45–60 [PubMed] [Google Scholar]
- 15.Cole TJ. Using the LMS method to measure skewness in the NCHS and Dutch national height standards. Ann Hum Biol 1989; 16: 407–19 doi: 10.1080/03014468900000532 [DOI] [PubMed] [Google Scholar]
- 16.Ito Y, Kato N, Tachibana K, Fujieda K. Growth standard for children from 0 up to 17.5 years of age based on height criteria for start growth hormone treatment in the medical aid program for chronic pediatric diseases of specified categories. J Pediatr Practice 2005; 68: 1343–51 [Google Scholar]


