

Abstract
Allogeneic hematopoietic stem cell transplantation (allo-HSCT) is the most effective form of tumor immunotherapy available to date and the frequency of transplants continues to increase worldwide. However, while allo-HSCT usually induces a beneficial graft-versus-leukemia (GVL) effect, a major source of morbidity and mortality following allo-HSCT is graft-versus-host disease (GVHD). Currently available diagnostic and staging tools frequently fail to identify those at higher risk for GVHD morbidity, treatment unresponsiveness, and death. Furthermore, there are shortcomings in the risk stratification of patients before GVHD clinical signs develop. In parallel, recent years have been characterized by an explosive evolution of omics technologies, largely due to technological advancements in chemistry, engineering, and bioinformatics. Building on these opportunities, plasma biomarkers have been identified and validated as promising diagnostic and prognostic tools for acute GVHD. This review summarizes current information on the types of GVHD biomarkers, the omics tools used to identify them, the biomarkers currently validated as acute GVHD markers, and future recommendations for incorporating biomarkers into new grading algorithms for risk-stratifying patients and creating more personalized treatment courses. Future directions will include randomized evaluations of these biomarkers in multicenter prospective studies while extending on the need for biomarkers of chronic GVHD.
Keywords: Graft-versus-Host Disease (GVHD), hematopoietic stem cell transplantation (HSCT), biomarkers, proteomics
1. Introduction
Allogeneic hematopoietic stem cell transplantation (allo-HSCT) is a widely used therapy for a range of malignant and non-malignant hematologic diseases. In allo-HSCT, the host’s immune and bone marrow systems are replaced by the donor’s immune and bone marrow systems. The donor immune system recognizes residual tumor cells as foreign and eradicates them via the graft-versus-leukemia (GVL) effect. Unfortunately, donor immune cells may also attack normal host tissue, particularly the skin, liver and gastro-intestinal (GI) tract, resulting in graft-versus-host disease (GVHD). The occurrence of GVHD remains one of the major barriers to a more widespread and successful applications of allo-HSCT. GVHD has classically been distinguished into two forms: acute GVHD (aGVHD) which arises before the 100 day mark post-HSCT and chronic GVHD (cGVHD), which occurs after the 100 day mark post-HSCT [1, 2]. These two classical forms are separate pathophysiological entities. However, in 2005, the National Institute of Health new classification recognized additional categories such as late-onset acute GVHD (after day 100) and an overlap syndrome with features of both the acute and chronic disorder [3, 4]. These new forms of GVHD can be explained by wider utilization of HSCT in older recipients who have undergone reduced-intensity conditioning regimens prior to transplantation.
A major barrier to aGVHD research and treatment is that the diagnosis and prognosis rely almost entirely on the presence of clinical symptoms. Currently, no validated laboratory tests exist to predict the risk of developing aGVHD, responsiveness to treatment, or patient survival. This absence of validated aGVHD biomarkers is partially due to the complex pathology of GVHD. Biomarkers in HSCT settings are crucial for identifying patients at high risk for aGVHD early in their transplant course. Biomarkers may also lead to altered treatments including more stringent monitoring and/or preventative care. The ability to identify patients who will not respond to traditional treatment and who are at particularly high risk for subsequent morbidity and mortality could result in personalized treatment plans such as additional immunosuppressive treatments introduced early for patients at a high risk. Equally important is the identification of patients who will respond well to treatment, which could allow for rapid tapering of steroid regimens, thereby reducing long-term toxicity in low risk patients.
The current review will provide an update on Omics tools, the discovery and validation of the most clinically relevant biomarkers of aGVHD, and specific recommendations for their use in clinical trials.
2. Types of aGVHD biomarkers
The classical definition of a biomarker is any characteristic that can be objectively measured and validated as an indicator of a biological, pathogenic, or pharmacological response process [5]. With regards to aGVHD, a biomarker is being sought that indicates the GVHD risk after allo-HSCT, the prognosis once incurred, and the treatment responsiveness. Below are the types of biomarkers that are being investigated as potential aGVHD markers.
2.1 Histocompatibility antigen disparities
Antigen disparity can be at the level of the major histocompatibility complex (MHC), or at the level of minor histocompatibility antigens (mHA). The severity of aGVHD is directly related to the degree of MHC mismatch [6]. In transplantations that are MHC matched but mHA disparate, donor T cells still recognize MHC peptides derived from the products of recipient polymorphic genes, the mHAs [7, 8]. The expression of mHAs is wide and variable. Thus, different mHAs might dictate variable phenotype, target organ involvement, development kinetics of GVHD, or antitumor responses after allogeneic HSCTs [9]. Some mHAs, such as HA-1, HA-2, HB-1 and BCL2A1, are primarily found on hematopoietic cells, whereas others such as the H-Y antigens, HA-3, HA-8 and UGT2B17 are ubiquitous [10-12]. These disparities are well known risk factors before transplantation and the goal of clinicians is always to best match the MHC disparities although full match is not always possible and mHA matching is not yet a common practice in the clinic. However, MHC disparities are not ideal biomarkers because they are static indicators incapable of providing the dynamic information necessary for monitoring aGVHD after transplantation.
2.2. Non-HLA polymorphisms
Increasing evidence indicates that non-HLA polymorphisms influence the risk of aGVHD and chronic GVHD (cGVHD). Most genetic variation among humans consists of single nucleotide polymorphisms (SNPs) that result in functional differences in gene products. Several SNPs have been identified as risk factors for GVHD (e.g., tumor necrosis factor [TNF]α, interleukin [IL]-6, interferon[IFN]-γ, IL-10, UDP-glucuronosyltransferase 2B17) [13, 14]. However, clinicians are confronted with the same issue as mHA disparities; donor selection according to SNP genotyping is still not performed clinically, although it may be available in the near future as recently reported by Petersdorf et al. [15] An IL-23 receptor polymorphism has recently been found to lead to decreased CD4 and CD8 T-cell function [16] and to lower incidence of aGVHD [17, 18]. The protective role of IL-23, which mediates the production of IL-22 when tissue is damaged has also been demonstrated in an experimental model of intestinal GVHD indicating that the IL-23/IL-22 pathway acts as a protector of intestinal stem cells during times of inflammation and disease [19].
2.3 MicroRNAs, or miRNAs, are small, noncoding segments of RNA derived from a larger coding RNA, such as mRNA. miRNAs are approximately 20-25 nucleotides in length and function by binding to mRNAs. The binding of these two molecules is responsible for the regulation of gene expression. This binding typically modifies or silences translational products but can have effects on post-transcriptional modification also [20]. More recent identification of stable miRNA in circulating bodily fluids has allowed for their use as biomarkers of certain diseases [21], including aGVHD [22]. While protein is the prototypical biomarker and is much more informative than miRNA, miRNA does offer several advantages of its own. Aside from their stability in body fluids, miRNAs are also easily measurable via the use of quantitative PCR. Unfortunately, there remains a lack of standardization in the application of miRNA as a biomarker often introducing bias into the data analysis. Despite this, miRNA has shown promise as a novel biomarker for predicting aGVHD. A recent study has shown that miR-155 expression is up-regulated in a GVHD experimental model and that its blockade in donor T-cells led to a decreased incidence of aGVHD and improved survival rates [22]. These findings suggest that miR-155 could not only be an interesting biomarker but also a potential new target for therapeutic agents of GVHD. Another recent study has also identified miR-100, which may be involved in the development of intestinal neovascularization in aGVHD. This study showed that miR-100 expression was down-regulated throughout the progression of aGVHD in mice, suggesting that miR-100 negatively regulates aGVHD. Furthermore, inactivation of miR-100 worsened the severity of aGVHD, leading the authors to conclude that it may have a protective role in aGVHD, specifically through inhibition of inflammatory neovascularization [23].
2.4 Cellular biomarkers
There are several different immune cells populations, whose functions are altered in the aGVHD and cGVHD disease states. The potential to manipulate specific immune cell populations ex vivo and in vivo may allow for the development of new aGVHD therapies. In addition, some of these immune cell subsets look promising as biomarkers of aGVHD and cGVHD.
The maintenance of immune tolerance after allogeneic HSCT by regulatory T cells (Tregs), traditionally characterized as CD4+CD25+ forkheadbox protein 3 (FOXP3)+, has been confirmed in patients. Daily administration of low-dose interleukin-2 (IL-2) induces selective expansion of functional Tregs and clinical improvement of cGVHD [24, 25]. Ex vivo expanded Tregs infused in patients after HLA-haploidentical transplantation have also been shown to prevent aGVHD and promote immune reconstitution [26]. Tregs are also promising cellular biomarkers. Two studies demonstrated that high numbers of donor graft Tregs were correlated with a lower incidence of aGVHD with improved survival in HSCT-recipients [27, 28]. Another study showed that Tregs frequency and aGVHD severity were negatively correlated. This inverse relationship lends itself useful for diagnostic and prognostic purposes [29].
CD30, a member of the tumor necrosis (TNF) receptor superfamily, is expressed on some activated memory T cells and released as a soluble form. Both have recently been shown as potential markers of aGVHD [30, 31].
Another cell population tagged as being potential cellular biomarkers of aGVHD is the invariant natural killer T cells (iNKTs). One recently conducted study found that a high dose of iNKTs in the graft was the only parameter to correlate with a decreased risk of aGVHD in a multivariate analysis including 57 HSCT recipients [32]. Another group analyzed a day 15 pre-GVHD iNKT / T-cell ratio and found that a low ratio was a predictor for aGVHD and increased mortality [33]. Of note, both studies included only patients who received in vivo T cell depleted transplants.
Dendritic cells, monocytes and gamma-delta T cells are cellular subsets that have also been explored as potential markers [34, 35]. In cGVHD, B cells and their modulators, such as B-cell activating factor, are possible future biomarkers [36-41].
2.5 Proteomic biomarkers are detailed below.
3. Omics tools for the discovery and validation of proteomic biomarkers
Advances in engineering have allowed for increased data throughput, enabling the study of complete sets of molecules (“Omics”) with exponential speed, accuracy, and cost-effectiveness. Thus, the analysis of the entire spectrum of molecular and cellular organization is now possible, enabling researchers to gain insight into the mechanisms of disease, with fewer a priori assumptions. However, from genes (~20,000) to proteins, there are two more levels of complexity: the transcriptome (~100,000 RNA transcripts) and the proteome (~1,000,000 proteins) (Figure 1).
Figure 1. The complexity of Omics as represented by the transformation of a caterpillar into a butterfly.

A caterpillar and a butterfly have the same genome but different transcriptomes and proteomes. This increasing complexity from genome to proteome has sparked research into creating more efficient proteome discovery techniques.
Here, we focus on the use of proteomics for the molecular diagnosis of aGVHD post-HSCT, since proteins are more proximal than other cellular metabolites to the ongoing pathophysiology of a disease [42]. The term “proteomics” indicates PROTEins expressed by a genOME and is the systematic analysis of a sample’s protein profile. Unlike the genome, the proteome varies with time and is defined as “the proteins present in one sample at a certain point of time”. Detailed below are the various proteomic techniques available for the discovery and validation of biomarkers with the basic workflow described in Figure 2.
Figure 2. Workflow for the discovery, validation, and implementation of new biomarkers.
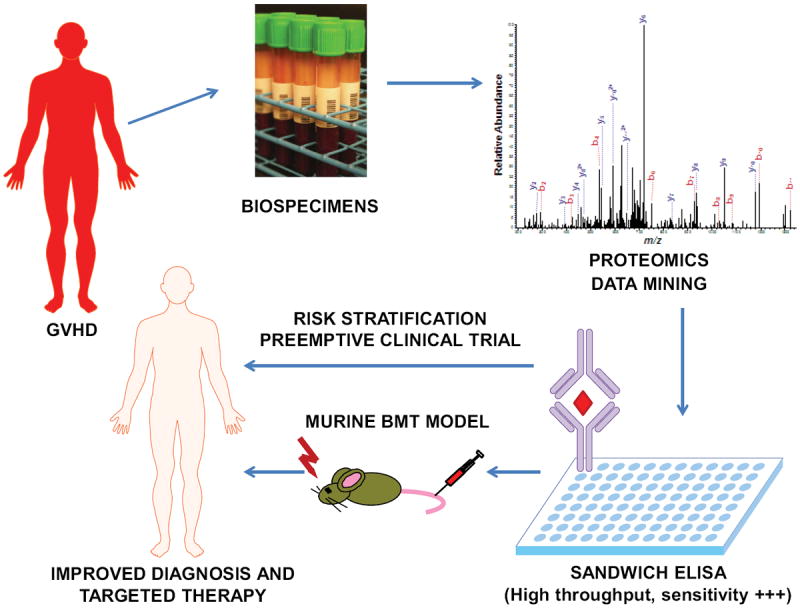
Samples are obtained from patients diagnosed in the clinic with GVHD. The proteins in the sample are subjected to separation and purification subsequently followed by mass spectrometry for protein identification. The protein concentrations from the patients’ samples are then compared to known concentrations of the identified protein in an immunoassay (usually sandwich ELISA). Once a biomarker is validated, it is carried into clinical trials for analysis of its ability as a diagnostic and prognostic tool. The end goal is more personalized treatment and improved patient outcomes.
3.1 Which biofluid should be used for clinical tests?
Ideal clinical tests are based on noninvasive collection, which allows for repetitive sample collection from the same patient in a short amount of time. GVHD biomarkers may be produced by several sources such as donor cells, the local or systemic cytokine milieu, or recipient target tissues during disease development. These biomarkers may then be released into a variety of body fluids. For noninvasive tests used in diagnostics, biofluids, such as plasma, sera, or urine, are the preferred samples. Enormous effort has been placed into developing standardized methods for clinical sample collection [43, 44]. Plasma and sera are the most frequently analyzed biofluids. The levels of individual blood proteins represents a summation of multiple, disparate events that occur in every organ system. Plasma and sera contain proteins shed by the affected tissue as well as proteins that reflect secondary systemic changes. However, plasma and sera are highly complex mixtures that contain high levels of many different proteins with a wide dynamic range, spanning twelve orders of magnitude from albumin to the lowest abundance protein. Often, the most clinically relevant proteins are in the lowest abundance such as cytokines and their receptors [45, 46]. To be able to detect these low abundance proteins, depletion of the pre-dominant proteins and subsequent fractionation of the proteome is required [47].
Urine samples represent an alternative to plasma/sera samples for biomarker discovery. Urine has four main advantages over plasma/sera: (i) it can be obtained in large quantities; (ii) the protein mixture is far less complex; (iii) the variation in protein abundance is low; and (iv) it is more stable than plasma. However, a limitation is that urine yields better information about diseases in the organs directly involved in its production and excretion, such as the kidneys. The proteins in urine are mainly products from kidney function (~70%) and glomerular filtration of plasma proteins (~30%) thus, urine is less informative for systemic diseases.
Another useful source of biofluid in the context of gastrointestinal diseases is feces. For instance, fecal markers of leukocytes influx into the mucosa are promising indicators of intestinal inflammation. Some neutrophil-derived proteins may be linked to the pathogenesis of intestinal inflammation due to their functions as damage-associated molecular pattern molecules (DAMPs). Phagocyte-specific DAMPs of the S100 family are released from neutrophils or monocytes, followed by pro-inflammatory activation of pattern recognition receptors. The complex of S100A8/S100A9, termed “calprotectin”, has been in use as a fecal marker of inflammatory bowel disease for 10 years [48]. Calprotectin has recently been shown to be an important intestinal aGVHD marker: a high-risk feature for mortality [49, 50]. The role of the intestinal microbiota in GVHD has been also been emphasized [51, 52]. Furthermore, proteomics studies with feces have been employed [53].
Aliquots of peripheral blood mononuclear cells (PBMCs) have also been used by immunologists to study cellular biomarkers. Unfortunately most of the repositories contain plasma and sera rather than PBMCs; one reason being the cost of processing PBMCs.
In sum, for proteomic studies the availability of the biofluids in the biorepositories will dictate the type of analysis to be performed. For instance, looking at markers in the damaged tissue itself could be more informative than systemic markers. However, there are three limitations to this approach i) the limited material available in biopsies, ii) tissue biopsies are invasive and an ideal biomarker should be traceable without having to perform serial invasive biopsies, and iii) tissue proteomics is reputed to be difficult.
3.2 Which proteomic tools can be used for biomarker discovery and rapid validation?
3.2.1 Antibody profiling for discovery
Antibody-based approaches are focused around immunoassays which use antibody-antigen interactions to identify proteins within a specific sample. The unique characteristics of antibodies are derived from their three important properties: (i) their ability to bind to an extremely wide range of natural and man-made chemicals, biomolecules, and cells due to the huge number of potential amino acid sequences at the paratope; (ii) their exceptional binding specificity that enables the measurement of picomolar (10-12) amounts of proteins in blood samples; and (iii) the strength of binding between an antibody and its target makes immunoassays accurate and precise, even at low concentrations. To screen for aGVHD biomarkers, antibody microarrays dotted with hundreds of antibodies have been employed, allowing for hundreds of proteins in complex biological matrices to be isolated and measured [54].
3.2.2 Mass spectrometry for discovery
Most non-antibody proteomic strategies are based on mass spectrometry (MS), which is a powerful tool for characterizing and assessing qualitative and quantitative changes in complex protein mixtures [55]. Two types of MS techniques have been used in clinical proteomics: (i) pattern profiles which identifies peptides sets and (ii) detailed protein identification and characterization.
Pattern profiles compare polypeptide spectra obtained by matrix-assisted laser desorption/ionization time-of-flight (MALDI-TOF) or surface-enhanced laser desorption/ionization (SELDI-TOF) MS to show which patients suffer from a particular disease [56]. These MS methods do not require in-depth analysis because they do not identify individual components of the profile. These two techniques have been used to screen for aGVHD biomarker candidates in both serum [57] and saliva [58].
Techniques which identify and characterize individual proteins are detailed below and always rely on protein separation within samples. One approach for protein separation are gel-based techniques such as two-dimensional polyacrylamide gel electrophoresis [59] and two-dimensional differential gel electrophoresis (2-D DIGE) [60]. Three-dimensional separation of proteins that are differentially labeled with fluorescent dyes according to their charge, hydrophobicity, and molecular mass have been used to diagnose aGVHD [61] and heart ischemia [62].
Despite the utility of gel-based techniques, gel-free separation methods such as liquid chromatography (LC) [47, 63-65] and capillary electrophoresis [66] provide better separation because they overcome several limitations of gel separation, such as lengthy analysis time; poor separation of proteins with low molecular weight, or an extreme isoelectric point; and difficult quantification of mixed spots. This analytical procedure reliably identifies proteins and determines their isoforms and posttranslational modifications. MS also allows quantification, particularly when tandem MS (MS/MS) is used [67], and has been used most recently for quantification with label-free methods or isotopically labeled tags [47, 63, 68]. In addition, new instrumentation such as the ultra-high resolution linear ion trap Orbitrap mass spectrometer (Orbitrap Elite) facilitates top-down LC-MS/MS and versatile peptide fragmentation modes [69]. The mass spectra are then matched to a sequence database to identify proteins [70]. These approaches are not suitable for validation purposes because of the time required for analysis, but they remain the most efficient methods for biomarker discovery in clinical research.
3.2.3 Data mining
Massive amounts of complex and heterogeneous proteomic data are generated from a single experiment. However, there is no immediate solution when it comes to proteomics data analysis. The challenges encountered are several fold: 1) high-dimensional parameters measured that exceed the number of conditions in the experiment, 2) the noise or false discovery rate. To address many of these challenges, the National Cancer Institute launched the Clinical Proteomic technologies for Cancer Initiative to develop standard operating procedures, data analysis standards, and an open access proteomics database [71-74]. Other proteomics workflows that have led to biomarker discovery include the ones detailed here [64, 65]. First, the acquired spectra are automatically processed by a Computational Proteomics Analysis System to identify proteins with a false discovery rate <5% [75]. False discovery rates are now recognized as markers of significance in Omics studies, with standard p-values reserved for testing individual hypotheses in classic experiments [76, 77]. To sequentially refine the list of candidate proteins, proteins can be selected based on their relationship to the tissue of origin using the Human Protein Atlas website, which aims to annotate human proteins using antibodies to systematically analyze the cellular distribution of proteins in normal and pathologic tissues [78]. Another refinement can be obtained by using pathway analysis tools such as Database for Annotation, Visualization and Integrated Discovery; Onto-tools’ PathwayExpress; GeneGo Metacore; Ingenuity Pathway Analysis; and BIOBASE ExPlain Analysis. Data mining can be developed to meet specific needs. For instance, we have developed a data mining strategy that has enabled us to discover biologically meaningful proteins from proteomics sets [64, 65, 79]. These candidate proteins then require further validation by other biotechnological techniques, ideally those that allow for high-throughput testing as detailed in the next paragraph.
3.2.4 High-throughput immunoassays for validation
Of critical importance for all immunoassays is the ability to produce a large amount of results in a short period of time. Immunoassays that can analyze multiple quantities of a sample at the same time are considered high-throughput. The ability to multiplex is another desired quality in an immunoassay. Multiplexing is the ability to analyze large quantities of different proteins at the same time. Thus, the ideal immunoassay should have the quality of being both high-throughput and multiplexing [80].
The sandwich enzyme-linked immunosorbent assay (ELISA) is an immunoassay that relies on the principle of antibody-antigen binding for measurement of a known protein’s concentration within a sample. In singleplex ELISAs, the protein of interest in the sample can be measured with relatively little cross-talk between the antibodies and proteins. However, in multiplex ELISAs, antibody cross-talk is a major source of issue. Antibody cross-reactivity increases with the degree of plexing, increasing the number of false positives. Clearly there is a need for improvement on the ELISA, especially to increase its simplicity and multiplexing capabilities. A step in this direction was accomplished by our sequential ELISA workflow that allows for measurement of multiple proteins per plasma sample by reusing the same aliquot consecutively in individual ELISA plates [80]. Another technique is an on-chip immunoassay that will save time and labor with its inexpensive setup [81, 82]. A two-phase system that allows for the detection of multiple proteins in a sample without cross-talk has also been proposed. In this technique, the antibodies are introduced into a solution immiscible with the buffer. Antigens introduced into the buffer diffuse into the antibody phases for sandwiching and detection. This technique is still in its early stages and has shown promise in increasing specificity and sensitivity. It can be used for multiplexed ELISAs or multiplexed amplified luminescent proximity homogenous assays (AlphaLISA) which have the main advantage of being no-wash assays.
In summary, the advantages of immunoassays are their (i) suitability for the characterization of complex protein mixtures, such as human plasma, (ii) quantitativeness, (iii) high sensitivity for low abundance proteins such as cytokines, and (iv) high-throughput nature. The disadvantages are the restriction of the number of antibody pairs available and the high cross-reactivity between antibodies with each other and other non-target proteins. Multiplexing immunoassays without cross-talk have recently been developed and if validated on a large scale, may show promise in the years to come.
3.2.5 Mass spectrometry for validation
MS can also be used for biomarker validation. Recently, selected reaction monitoring-mass spectrometry (SRM-MS) also called multiple reaction monitoring (MRM) has emerged as a potentially useful technique for clinical diagnostics [83-86]. SRM-MS is used for targeted, multiplexed quantitative proteomics to screen and quantify proteins in patients plasma samples with high sensitivity, absolute specificity and high throughput. SRM-MS is primarily performed on triple quadrupole mass spectrometers. In SRM, researchers select which protein they want to observe and then subject the sample to MS to measure the mass of a specified molecule in the sample. The researcher pre-sets which fragments are recognized by the analyzer. In addition, SRM can be used to construct a calibration curve that can provide the absolute quantification of the native peptide, and by extension, its parent protein. This rapid SRM-MS technique enables the targeted monitoring and quantification of candidate molecules in complex samples. While immunoassays are the current standard for biomarker validation, SRM may become a complement addition within the next decade. SRM is attractive for its high reproducibility and multiplexing capabilities. However, it needs to become more standardized before use in the clinic.
4. In sum, which are the characteristics of an ideal biomarker?
The ideal aspects are based on its usefulness in the clinic. An ideal biomarker should be non-invasive while easy to test (e.g. not invasive biopsies). Its measurement should be reproducible and accurate within cost-effective, standardized techniques. Furthermore, as described below, the ideal biomarker should be diagnostic with high specificity and sensitivity while being able to distinguish patients with GVHD from those without the disease (e.g. GI GVHD vs. infectious colitis, skin GVHD vs. drug rash). If a biomarker correlates with treatment response, then it could be used to guide the treatment intensity in high-risk patients and immunosuppression withdrawal in low-risk patients. Probably the most useful biomarker will be able to risk-stratify patients before the GVHD clinical signs appear which will allow for its use in preemptive trials. Finally, if the biomarker indicates the pathophysiology of GVHD, it could be targeted and represent a novel class of treatment.
5. Statistical considerations
5.1 Sample sizes
The number of specimens that should be tested depends on the objective of the study and the extent of biomarker variability in the study. When the objective is to select a subset of biomarkers from a list of candidates, the following factors contribute to variability: the disease’s subtypes (i.e., skin GVHD, GI GVHD); the capacity of the biomarkers to discriminate among the different disease subtypes; the number of biomarkers being studied; the number of case and control subjects; and the statistical algorithm used to select promising biomarkers. Thus, as suggested by Pepe et al. [87], there are no simple methods for recommending samples sizes. In particular, traditional sample size calculations that are based on statistical hypothesis testing are not relevant. Pepe et al. propose that investigators use computer simulations to guide their choice of sample sizes. By varying the number of cases and controls, one can assess at what sample size a reasonable proportion of promising biomarkers is likely to be selected for further study [87].
5.2 Single versus multiple biomarkers of GVHD
In most cases no single biomarker is sufficiently sensitive or specific on its own for either a diagnostic or predictive test. Thus, the simultaneous use of several markers may increase specificity, predictability, or diagnostic performance. To create a comprehensive GVHD biomarker panel, proportional odds logistic regression models are used to determine a composite panel. Presumably, for a GVHD diagnosis, a combination of tissue-specific and systemic biomarkers will be more informative than individual biomarkers. However, if a biomarker is not highly correlated to other biomarkers or clinical predictors, one or two biomarkers could be sufficient for either diagnostic or predictive tests.
5.3 Receiver Operating Characteristics (ROC) curves
Several statistical methods can be used to estimate the diagnostic likelihood ratio of a continuous biomarker. The ROC curve is primarily used [88]. It is a plot of the true-positive rate (sensitivity = 1 – false negative error rate) versus the false-positive rate (1 – specificity), and is associated with rules that classify an individual as “positive” if the marker value is above a threshold c for all possible thresholds. Because combinations of multiple markers are often required, combining the ROC curves of all biomarkers is an optimal way of estimating the risk score because the ROC curve is maximized at every cutpoint [89].
5.4 Training, validation, independent sets
One statistical approach for the validation of biomarkers is to randomly divide patients into training and validation sets. The statistical model is developed with the training set and subsequently tested in the validation set, therefore representing a blinded measure of biomarker performance [54]. Because of potential center effects, the biomarkers must also be tested in independent sets [64]. Finally, biomarkers must be validated in multicenter prospective studies [90, 91].
5.5 Risk Stratification
Predictive models can compare different risk groups using several metrics [92]. The most frequently used are 1) hazard ratios from Cox proportional hazard analysis and their statistical significance, 2) AUC, the area under the ROC curve also called C-statistic, a scaled version of the Wilcoxon Rank Sum statistic, 3) model calibration, which is usually assessed with a Hosmer-Lemeshow test that requires a categorization of fitted probabilities, i.e. deciles, 4) net reclassification index as described by Pencina et al. [93] that requires risk categories, which might be arbitrary and not well-defined, and 5) continuous form of the net reclassification index [94] which does not require categories.
6. aGVHD biomarkers
GVHD is not only a systemic immunological disorder but can also affect specific organ systems, including the skin, GI tract, and liver. Due to the long-recognized “cytokine storm” that occurs early after donor graft infusion, cytokines and their receptors have been tested as potential aGVHD biomarkers [95].
6.1 Individual biomarkers identified using aGVHD’s pathology
Table 1 summarizes several studies that identify candidate biomarkers based on aGVHD’s pathology.
Table 1.
Candidate aGVHD biomarkers based on aGVHD’s pathology.
| Protein | Studies | Biofluid Sources | No. of patients in studies | Function(s) | Role in aGVHD |
|---|---|---|---|---|---|
|
| |||||
|
Soluble factors
| |||||
| Albumin | Rezvani 2011124 | Serum | 401 | Comprises about one-half of the blood serum proteins; functions to regulate oncotic pressure and to carry proteins. | Decreased serum concentration before transplantation and up until treatment is associated with development of grade III/IV aGVHD and increased mortality. |
|
| |||||
| α4β7 Integrin | Chen 2009119 | Blood | 59 | Lymphocyte-trafficking to the intestines and lymph nodes. | Increased expression on naïve and memory T cells prior to intestinal aGVHD. |
|
| |||||
| Angiopoietin-2 | Luft 2011123 | Serum | 48 | Promotes maturation of blood vessels and pro-inflammatory cytokine activity. | High Angiopoietin-2 levels and Angiopoietin-2/VEGF ratios prior to HSCT are associated with refractory aGVHD. |
|
| |||||
| Calprotectin | Rodriguez-Otero 201249 | Feces | 72 | Fecal marker of leukocyte influx into intestinal mucosa. | Increased levels at the time of GI-GVHD diagnosis are predictive of treatment responsiveness. |
| Chiusolo 201250 | 68 | ||||
|
| |||||
| CD8 | August 2011102 | Plasma | 61 | Class I MHC TCR co-receptor. | Elevated levels on day 15 post-transplantation are associated with severe aGVHD. |
|
| |||||
| CRP | Schots 2002110 | Serum, plasma | 96 | Acute phase reactant. | CRP levels reflect the risk of transplant-related mortality and major transplant-related complications. |
| Pihusch 2006108 | 350 | ||||
| Malone 2007109 | 147 | ||||
|
| |||||
| CXCL10 | Piper 2007117 | Serum | 34 | Ligand of CXCR3 on T cells. | Significant elevation at the time of aGVHD diagnosis. |
|
| |||||
| HGF | Okamoto 2001120 | Serum | 38 | Mitogen for hepatocytes; enhances liver repair and regeneration. | HGF is increased in patients with aGVHD and correlates to the grade of aGVHD. Predictive of 1-year non-relapse mortality and treatment unresponsiveness. |
| Harris 2012126 | |||||
|
| |||||
| IL-2Rα | Miyamoto 199699 | Serum, plasma | 30 | Soluble form released after IL-2R expression; presence is an indication of T cell proliferation. | Early post-transplantation levels are high prior to clinical signs of aGVHD. |
| Foley 1998100 | 36 | ||||
| Seidel 200398 | 60 | ||||
| Visentainer 200396 | 13 | ||||
| Shaiegan 200697 | 67 | ||||
| August 2011102 | 62 | ||||
|
| |||||
| IL-6 | Mohty 2005112 | Serum | 113 | B cell maturation; pleiotropic cytokine during inflammation. | Elevated at the onset of aGVHD. |
| Pihusch 2006108 | 350 | ||||
| Malone 2007109 | 147 | ||||
|
| |||||
| IL-7 | Dean 2008116 | Serum, plasma | 31 | Homeostatic proliferation of lymphocytes. | Levels increase significantly post-transplantation with an inverse correlation to absolute T-cell count. |
| Thiant 2010115 | 40 | ||||
| Thiant 2011114 | 45 | ||||
|
| |||||
| IL-8 | Uguccioni 1993111 | Serum | 30 | Neutrophil chemotaxis and adhesion; angiogenesis promoter. | Early increase post-transplantation is associated with increased mortality. Some studies show no difference between aGVHD and other complications. |
| Schots 2003103 | 84 | ||||
| Mohty 2005112 | 113 | ||||
|
| |||||
| IL-10 | Visentainer 200396 | Serum | 13 | Inhibits Th1 cells; promotes regulatory T cells. | Levels increase transiently following HSCT. |
|
| |||||
| IL-12 | Mohty 2005112 | Serum | 113 | Maturation of Th1 cells. | Associated with grade II to IV aGVHD development after receiving reduced intensity conditioning. |
|
| |||||
| IL-18 | Fujimori 2002101 | Serum | 14 | Stimulates release of IFN-γ. | Correlates with the levels of IL-2Rα. |
| Shaiegan 200697 | 67 | ||||
|
| |||||
| KRT18 | Luft 2007121 | Serum | 55 | Intermediate filament cleaved during apoptosis. | Increased levels during hepatic and intestinal aGVHD. Increased levels correlate to treatment unresponsiveness. |
| Luft 2011123 | 48 | ||||
| Harris 2012126 | 954 | ||||
|
| |||||
| TNFα / TNFR1 | Holler 1990104 | Serum, Plasma | 56 | Key cytokine involved in the cytokine storm after HSCT. | Elevation early post-transplantation is associated with severe aGVHD and treatment-related mortality. Increased levels during period of clinical symptoms. |
| Abdallah 1997105 | 80 | ||||
| Schots 2003103 | 84 | ||||
| Mohty 2005112 | 113 | ||||
| Choi 2008106 | 438 | ||||
| August 2011102 | 62 | ||||
|
| |||||
| TGFβ | Visentainer 200396 | Serum | 13 | Tissue regeneration. | Decreased levels after transplantation are associated with aGVHD. |
|
| |||||
| VEGF | Luft 2011123 | Serum | 48 | Stimulates angiogenesis. | High Angiopoietin-2/VEGF ratios prior to HSCT are associated with refractory aGVHD. |
|
| |||||
|
miRNAs
| |||||
| miR-100 | Leonhardt 201323 | Intestinal Tissue | 12 | Blocks intestinal neovascularization. | Expression is down-regulated throughout the progression of aGVHD. |
|
| |||||
| miR-155 | Ranganathan 201222 | Intestinal Tissue | 8 | Crucial for lymphocyte differentiation, maturation, and proliferation. | Up-regulated in T cells following HSCT. Preventing expression decreases aGVHD severity and increases survival. |
|
| |||||
|
Cellular Biomarkers
| |||||
| CD30 | Hubel 201031 | Serum, Plasma, Blood | 30 | Expressed on activated memory T cells. | Increased plasma levels and expression on T cells during aGVHD. Increased levels are associated with the severity of aGVHD. |
| Chen 201230 | 53 | ||||
|
| |||||
| Dendritic Cells | Lau 200735 | Blood | 40 | Antigen-presenting cells; connection between innate and acquired immunity. | Decreased total blood DC count is associated with severity and development of aGVHD. |
| Ahktari 201034 | 25 | ||||
|
| |||||
| Invariant Natural Killer T cells | Chaidos 201232 | Donor Grafts, Recipient Blood | 57 | Respond to glycolipids presented by the polymorphic class I-like molecule CD1d. | Increased iNKT/T cell ratio is associated with the occurrence of aGVHD and increased non-relapse mortality. |
| Rubio 201233 | 71 | ||||
|
| |||||
| Regulatory T cells | Rezvani 200627 | Blood, Donor Grafts | 32 | Maintenance of immune tolerance. | Promotes immune reconstitution after HSCT and increased levels prevent aGVHD. Prognostic indicator after diagnosis. Levels are inversely correlated with the severity of aGVHD. |
| Wolf 200728 | 58 | ||||
| Magenau 201029 | 215 | ||||
| Koreth 201124 | 23 | ||||
| Di Ianni 201126 | 28 | ||||
| Matsuoka 201325 | 45 | ||||
VEGF= Vascular Endothelial Growth Factor, TGF= Tumor Growth Factor, CTL = Cytotoxic T Lymphocytes
Soluble IL-2 receptor α chain (sIL-2Rα) concentrations were found to be increased in aGVHD patients in many studies [96-100]. However, some studies found that sIL-2Rα concentrations were also increased in patients with other transplantation-related complications such as veno-occlusive disease and sepsis [100]. Concentrations of IL-18 are closely correlated with IL-2Rα concentrations [97, 101]. Recently, August et al. reported that patients with elevated sIL-2Rα, sTNFR1, and sCD8 had high predictive values for aGVHD occurrence. Using these three markers, the authors demonstrated the feasibility of detecting severe aGVHD prior to the appearance of clinical symptoms [102]. Similarly, TNF-α and its receptors, particularly TNFR1, were implicated in the pathology of aGVHD; their concentrations were found elevated in aGVHD patients [102-106]. The same precautions used to evaluate sIL-2Rα concerning its elevation in other complications post-transplant. The roles of TNF-α/TNFR1 and IL-2/IL-2Rα in aGVHD pathogenesis are supported by evidence that suggests that antibodies directed against TNF-α or TNFR1, or IL-2/IL-2Rα, are effective therapies for steroid-refractory aGVHD [107]. Acute phase reactants such as C-reactive protein (CRP) and IL-6 were found to be increased in patients with aGVHD [103, 108-110]. Concentrations of IL-8 were clearly correlated with aGVHD in one study by Uguccioni et al. [111]. However, Schots et al. showed that IL-8 was released due to all types of complications post-transplant, rather than specifically in cases of aGVHD [103]. Similarly, increases in IL-8 and other cytokines (e.g., IL-6, and IL-18) as aGVHD diagnostic markers were not confirmed in a study that only included patients receiving a reduced intensity conditioning regimen [112]. Unexpectedly, anti-inflammatory cytokines such as IL-10 which operates to inhibit the function of Th1 cells while promoting regulatory T cells were found increased in some studies [96]. IL-7 is the key cytokine implicated in the homeostatic proliferation of lymphocytes after the lymphopenia induced by the preparative regimen [113]. At days 7 and 14 post-HSCT, increased IL-7 concentrations have been correlated to the development of aGVHD in recipients of both myeloablative and reduced intensity conditioning [114-116]. Chemokines and chemokine receptors that are mediators of lymphocyte trafficking to the target organs and lymph nodes were also found to be elevated in patients with aGVHD [117-119].
Hepatocyte growth factor (HGF) is a multifunctional cytokine that is secreted by mesenchymal cells and acts primarily on cells of epithelial origin. Okamoto et al. observed increased serum HGF concentrations in patients who developed aGVHD. These authors also found that these increased HGF concentrations correlated significantly with the severity of aGVHD [120]. HGF appears to belong to a different category of biomarkers, representing a physiologic response to aGVHD damage. In this respect, HGF seems similar to cytokeratin-18 fragments (KRT18), markers of epithelial apoptosis that have been associated with intestinal and hepatic aGVHD damage [121]. However, HGF possesses anti-apoptotic properties and acts as a mitogen for hepatocytes, enhancing liver repair and regeneration; HGF administration has been shown to prevent aGVHD in a murine model [122]. HGF would therefore appear not only to indicate the extent of target organ damage from aGVHD, but may also reflect the physiologic response intended to limit further damage from aGVHD. KRT18 and markers of endothelial dysfunction (e.g., angiopoietin-2, VEGF, and thrombomodulin) were found elevated in steroid-refractory aGVHD patients [123]. Rezvani et al. found that a decrease of 0.5 g/dl in serum albumin from the pre-transplantation baseline level to the onset of treatment for aGVHD predicted the subsequent development of aGVHD and survival in a cohort of 401 patients [124]. Recently, fecal concentrations of calprotectin have been reported in two independent studies as an excellent prognostic value when measured at diagnosis of intestinal GVHD [49, 50].
6.2 Biomarkers identified using Proteomics
Table 2 summarizes several studies that identify candidate biomarkers based on proteomics discovery.
Table 2.
Candidate aGVHD biomarkers identified by proteomics.
| Protein | Study | Biofluid Sources | No. of patients in studies | Function(s) | Role in aGVHD |
|---|---|---|---|---|---|
|
| |||||
| Peptides Sets | Kaiser 200466, Srinivasan 200657 | Urine | 45 | Spectral profiles of peptides involved in aGVHD were identified. | Identification of the peptides present in the proteome during aGVHD (e.g. leukotriene A4 hydrolase, albumin, collagen α chain I, and collagen α1 chain III) |
| Serum | 34 | ||||
| Imanguli 200758 | Saliva | 41 | |||
| Weissinger 2007125 | 175 | ||||
|
| |||||
| Biomarker panel of four proteins: IL-2Rα, TNFR1, IL-8, HGF | Paczesny 200954 | Plasma | 424 | See Table 1 for individual cytokine functions. | Diagnose aGVHD in patients at onset of clinical symptoms with AUC of 0.91 in training set and 0.86 in validation set. Also provide prognostic information including long term survival. |
|
| |||||
| CCL8 | Hori 2008118 | Serum | 14 | Major chemoattractant for dendritic cells, monocytes, and activated T cells. | Serum concentration correlates with aGVHD severity. |
|
| |||||
| Elafin | Paczesny 201065 | Plasma | 522 | Elastase inhibitor overexpressed in inflamed epidermis in response to IL-1 and TNFα. | Produced by keratinocytes. Increased concentrations at onset of skin aGVHD. Correlates with the severity and mortality of skin aGVHD. |
|
| |||||
| REG3α | Ferrara 201164 | Plasma | 1034 | Antimicrobial protein secreted by Paneth cells to protect the epithelial barrier function of the intestinal mucosa. | Released into circulation via GVHD-induced breaches of the mucosal intestinal barrier. Elevated in GI-GVHD and correlates to nonrelapse mortality. |
|
| |||||
| ST2 (IL-33 Rc) | Vander Lugt 201391 | Plasma | 1054 | Receptor for IL-33; effector molecule of Th2 responses. Soluble form acts as decoy receptor for interleukin-33, driving Th2 cells toward a Th1-cell phenotype. | Increased levels at therapy initiation correlate with treatment unresponsiveness and mortality. Levels early post-transplantation (day 14) are associated with increased risk for death. |
Four studies have identified the proteomic pattern of aGVHD using MS-based approaches [57, 58, 66, 118]. The peptide set from the Kaiser’s study was used to screen 63 samples collected from 33 patients after allo-HSCT [125]. A subsequent blind evaluation of 599 samples from 141 patients enabled the prediction of aGVHD before clinical symptoms with a sensitivity of 83% and a specificity of 75%.
Clinical symptoms of the skin (e.g., maculopapular rash) and GI tract (e.g., nausea, diarrhea) caused by aGVHD can be difficult to distinguish from other causes (e.g., infectious, drug-induced). Thus, biomarkers that are target specific may improve the diagnosis of aGVHD. Plasma pooled from ten patients with skin-specific aGVHD was compared to plasma pooled from ten controls by proteomics. Elafin emerged as the lead biomarker candidate for skin aGVHD detection at the time of clinical diagnosis. Plasma elafin concentrations in samples from 492 patients had significant diagnostic and prognostic value, including long-term survival, as a biomarker for skin aGVHD [65]. Using the same proteomics strategy in patients with GI aGVHD, Regenerating-Islet-Derived-3-alpha (REG3α) was discovered and validated as a biomarker of lower GI aGVHD [64]. In a follow-up study, REG3α that was compared to KRT18 and HGF showed a better diagnostic precision for lower GI aGVHD than the other two GI aGVHD markers [126].
There are also shortcomings in the prediction of the response to aGVHD therapy. Recently, Luft et al. showed that KRT18 and markers of endothelial dysfunction are elevated in steroid-refractory aGVHD patients [123]. Six previously validated diagnostic biomarkers of aGVHD from samples prospectively obtained at the initiation of treatment, day 14, and day 28, in a multicenter, randomized, four-arm, phase II clinical trial for newly diagnosed aGVHD were measured. For each of the three time points, aGVHD onset, 2 weeks into treatment, and 4 weeks into treatment, the six-biomarker panel predicted the clinical outcomes of non-response at day 28 post-therapy and mortality at day 180 from onset [127]. However, none of these studies were designed to find biomarkers of glucocorticoid resistance. Thus, a plasma proteomic approach comparing responders and non-responders was developed and identified suppression of tumorigenicity 2 (ST2) as the most significant of the 12 markers of non-response to GVHD therapy and subsequent nonrelapse mortality. Patients with high ST2 at therapy initiation were 2.3 times more likely not to respond to treatment and 3.7 times more likely to die six months after therapy. Patients with low ST2 values experienced less nonrelapse mortality than patients with high ST2 regardless of the GVHD grade. In addition, when tested at day 14 post-transplant prior to aGVHD diagnosis, plasma values of ST2 were associated with nonrelapse mortality at six months after transplant. Therefore, ST2 levels measured at initiation of GVHD therapy and early in the transplant course improve risk stratification for GVHD and nonrelapse mortality after transplantation. ST2 is thus considered as one of the most promising of all currently known aGVHD biomarkers [91].
7. GVHD biomarkers and personalized medicine
Given the progress being made in GVHD biomarker identification and validation, it is not surprising that clinical trial design will begin incorporating biomarkers. Target-specific diagnostic biomarkers that can differentiate skin GVHD from other rashes and GI GVHD from other forms of enteritis will allow for replacement of invasive biopsies. First, a simple observational trial during which samples and biopsies will be taken at the onset of GVHD should be performed. During this trial, physicians will treat according to symptoms and perform biopsies as usual. A retrospective analysis of the samples with different thresholds of biomarkers will determine whether the biomarkers can replace the invasive biopsies. If this study concludes that the biomarker does as well as the biopsies, then the next trial would be a randomized interventional trial; one-half of the patients will be treated according to the biopsy results, and one-half will be treated according to the biomarker results. The development of GVHD and other outcomes will then be evaluated.
The most important role of biomarkers is risk stratification for risk-adapted clinical trials. At present, given the absence of further risk stratification, the standard of care for all patients with GVHD is the prompt initiation of systemic steroid treatment, with the addition of second line agents reserved for patients who fail initial therapy. Unfortunately, most patients who require second-line therapy die, highlighting the need for refinement of risk beyond what the current grading system provides. Current biomarkers have enough sensitivity and specificity to allow for risk stratification in patients with newly diagnosed GVHD. In turn, early identification of patients at high risk for steroid unresponsiveness may permit alternative testing or additional therapies before the development of refractory disease. Equally important is the identification of low risk patients who will respond well to treatment. These patients may tolerate a more rapid tapering of steroid regimens for prevention of long-term toxicity, infection, and loss of the GVL effect. A schema for treating newly diagnosed GVHD using biomarkers is shown in Figure 3.
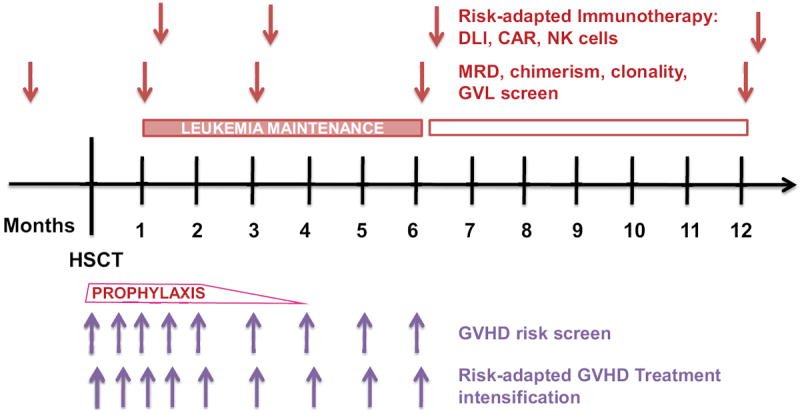
Figure 3. Risk stratification management of a patient after allo-HSCT.
Risk analysis will begin shortly after HSCT. Biomarkers will help predict the risk of GVHD and guide the therapy of those with an increased risk for severe GVHD. The biomarkers will indicate need for treatment intensification and the response to treatment. Patients transplanted with high risk leukemia or with significant minimal residual disease (MRD) will be considered for additional consolidative chemotherapy. Scheduled MRD analysis will assess the relapse risk and could lead to the use of more specific immunotherapies such as infusions of donor total lymphocytes (DLI) or chimeric antigen T cells (CAR) with suicide gene. The end goal is to create a more personalized, risk-adapted approach.
The ability to identify patients at high risk for GVHD early in their transplant and treatment course also has important therapeutic consequences, including preemptive interventions. The success of preemption must include not only a reduction in the incidence of GVHD, but also in infectious complications and relapse. Ultimately, a randomized trial will be needed to assess the effectiveness of GVHD preemption. An example of a proposed preemptive clinical trial based on biomarkers risk-stratification is shown in Figure 4.
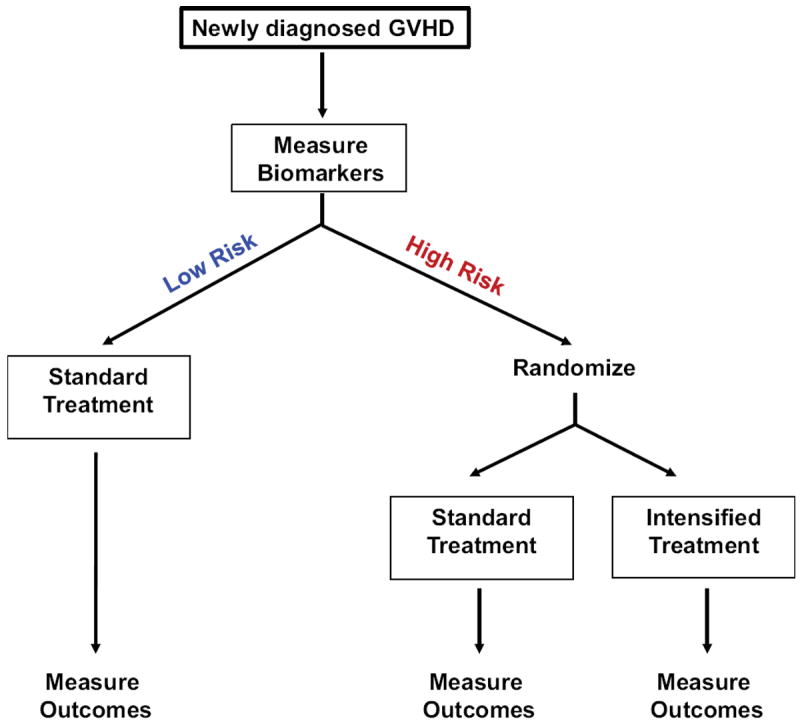
Figure 4. Proposed clinical study for newly diagnosed GVHD.
Biomarker cutpoints will determine if a patient is at high or low risk of treatment unresponsiveness at the diagnosis of GVHD. Low risk patients will receive the standard GVHD treatment; high risk patients will be randomized to receive either the standard GVHD treatment or an intensified GVHD treatment. Comparison of outcomes from the randomized high risk groups will show if intensified treatment at onset of GVHD improves responses rates and lowers mortality in high risk patients identified by biomarkers.
8. Challenges and pitfalls of biomarkers development
The daunting process of biomarker development and the huge logistical challenges for integration into clinical trials has limited the wide use of GVHD biomarkers so far. Indeed, the different type of conditioning given [full (including total body irradiation-based) or reduced] seems to have an impact on a biomarker levels [91, 128]. Another limitation is that GVHD biomarker studies have mostly been performed in T cell repleted HSCT. In addition, none of these biomarkers have been studied in large cohorts of recipients receiving umbilical cord blood transplant. Due to the increasing number of double cord transplants performed and the high rate of grade II-IV GVHD observed in these cohorts[129-132], it has become even more crucial to study biomarkers in these patients. Another possibility for differences is the diverse type of prophylaxis administered as some are known to induce less GVHD such as the combination of sirolimus, tacrolimus and low-dose methotrexate [133]. All of these parameters will need to be evaluated in large scale multicenter studies.
Another step to overcome is to determine which time point or which combination of different time points measurements will be the most useful. This will be best achieved by realizing a kinetic of biomarker levels changes mostly during the first month post-transplant such as published in some studies [91, 99, 102, 134].
Ideally, the validated biomarkers should be subjected to a multi-center clinical prospective study as they have not been tested in such a far-spanning population yet. This independent validation is important because a risk algorithm should take into account the variability between centers (center effect) and the individual risks. The successful design of subsequent trials, which is ideally performed through an institution such as the Blood and Marrow Transplant Clinical Trial Network (BMTCTN), should establish a unique resource for bone marrow transplantation (BMT) clinicians and provide a further national resource for investigators to explore BMT. However, this endeavor will be expensive and might include some variation in collection and interpretation of clinical data.
9. Future directions
As mentioned above the first future direction is a blinded evaluation of these biomarkers from samples collected in a multicenter prospective study. A multicenter cohort reduces center effects and facilitates the successful design of subsequent trials. Because biomarkers may represent promising targets, other directions include new therapeutics. These drugs would target the appropriate effector T cell, thus increasing efficacy and decreasing toxicity. This approach represents the first step in a continuum of research that is expected to lead to the development of pharmacologic strategies for specifically treating aGVHD.
So far, development of biomarkers post-HSCT has focused on aGVHD biomarkers. Clinical diagnosis and current consensus criteria for cGVHD are labor-intensive and there is yet to be any widespread validation of them. Thus, future biomarker discovery efforts and validation for cGVHD could be particularly valuable.
Recurrent malignancy remains a major cause of mortality following HSCT thus risk-stratification for relapse is a necessity and should be conducted in parallel with risk-stratification for GVHD that is tightly linked to the GVL effect. Future approaches to minimizing the risk of relapse will consider factors from both the patients and the underlying malignancy. Possible ways to ameliorate the current standards will be the early identification of very high risk patients, and close monitoring for disease relapse particularly with minimal residual disease. Possible interventions to implementing personalized medicine could be (i) combination of targeted leukemic therapies and stem cell transplant, (ii) adapted GVHD prophylaxis that maintain GVL, (iii) improved disease-specific conditioning, (iv) effective maintenance therapy after transplant with new drugs, and (v) use of new promising cellular therapies such as specific antitumor T cells or chimeric Antigen Receptor (CAR) T cells. An example of personalized medicine based on risk-stratification of GVHD and relapse after transplantation is shown in Figure 5.
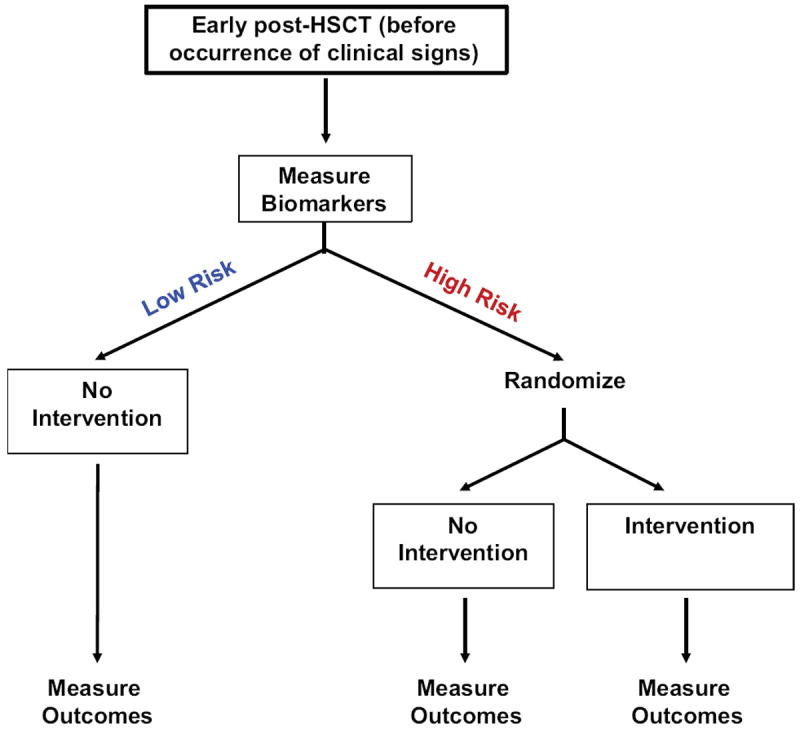
Figure 5. Proposed GVHD preemptive clinical study.
Biomarker cutpoints will risk-stratify patients at low- or high-risk of developing GVHD before occurrence of the clinical signs. Low risk patients will have no intervention; high risk patients will be randomized to receive either a standard GVHD intervention or none. Comparison of outcomes from the randomized high risk groups will show whether the preemptive intervention lowers aGVHD incidence in high-risk patients identified by biomarkers. The expectation is that the subclinical aGVHD could be treated, which would defuse the full blown graft-versus-host reaction.
10. Conclusions
Proteomics is a revolutionary field that can be used to detect the most proximal proteins to the real-time pathophysiology of aGVHD. In a short time, the use of proteomics has led to the identification of novel aGVHD biomarkers, which are unlikely to have been discovered by traditional hypothesis-driven research. A promising proteomics approach is to use protein biomarkers in risk stratification to better employ current disease treatment modalities. Furthermore, the biomarker findings presented above offer the potential for exploring targeted therapeutics. Unlike genes, protein levels may be influenced by several post-transcriptional modifications and other factors, such as the cytokine milieu. The principal barrier that must be circumvented is the validation of biomarker concentrations in different types of allo-HSCT settings [e.g., conditioning intensity, donor sources (particularly cord blood, T cell-depleted grafts)]. Achieving this aim will require a much larger validation study, ideally in a multicenter prospective trial. Once an algorithm for each setting is established, personalized medicine will be possible.
Acknowledgments
Sophie Paczesny (S.P.) is supported by National Institute of Health grants R01-CA168814, and R01-CA174667. S.P. is an investigator of the Amy Strelzer Manasevit Research Program and the Lilly Physician Scientist Initiative Program.
Footnotes
Conflicts of Interest
S.P. holds a patent on “Methods of detection of graft-versus-host disease” (U.S. Patent #13/573,766).
References
- 1.Martin P, Schoch G, Fisher L, Byers V, Anasetti C, Appelbaum FR, Beatty PG, Doney K, McDonald GB, Sanders JE. A retrospective analysis of therapy for acute graft-versus-host disease: initial treatment. Blood. 1990;76:1464–1472. [PubMed] [Google Scholar]
- 2.Sullivan KM, Mori M, Sanders J, Siadak M, Witherspoon RP, Anasetti C, Appelbaum FR, Bensinger W, Bowden R, Buckner CD, et al. Late complications of allogeneic and autologous marrow transplantation. Bone Marrow Transpl. 1992;10(Suppl 1):127–134. [PubMed] [Google Scholar]
- 3.Filipovich AH, Weisdorf D, Pavletic S, Socie G, Wingard JR, Lee SJ, Martin P, Chien J, Przepiorka D, Couriel D, et al. National Institutes of Health consensus development project on criteria for clinical trials in chronic graft-versus-host disease: I. Diagnosis and staging working group report. Biol Blood Marrow Transplant. 2005;11:945–956. doi: 10.1016/j.bbmt.2005.09.004. [DOI] [PubMed] [Google Scholar]
- 4.Griffith LM, Pavletic SZ, Lee SJ, Martin PJ, Schultz KR, Vogelsang GB. Chronic graft-versus-host disease--Implementation of the National Institutes of Health Consensus Criteria for Clinical Trials. Biol Blood Marrow Transpl. 2008;14:379–384. doi: 10.1016/j.bbmt.2008.01.005. [DOI] [PMC free article] [PubMed] [Google Scholar]
- 5.Biomarkers Definitions Working G. Biomarkers and surrogate endpoints: preferred definitions and conceptual framework. Clin Pharmacol Ther. 2001;69:89–95. doi: 10.1067/mcp.2001.113989. [DOI] [PubMed] [Google Scholar]
- 6.Flomenberg N, Baxter-Lowe LA, Confer D, Fernandez-Vina M, Filipovich A, Horowitz M, Hurley C, Kollman C, Anasetti C, Noreen H, et al. Impact of HLA class I and class II high-resolution matching on outcomes of unrelated donor bone marrow transplantation: HLA-C mismatching is associated with a strong adverse effect on transplantation outcome. Blood. 2004;104:1923–1930. doi: 10.1182/blood-2004-03-0803. [DOI] [PubMed] [Google Scholar]
- 7.Goulmy E, Schipper R, Pool J, Blokland E, Falkenburg JH, Vossen J, Gratwohl A, Vogelsang GB, van Houwelingen HC, van Rood JJ. Mismatches of minor histocompatibility antigens between HLA-identical donors and recipients and the development of graft-versus-host disease after bone marrow transplantation. N Engl J Med. 1996;334:281–285. doi: 10.1056/NEJM199602013340501. [DOI] [PubMed] [Google Scholar]
- 8.Murata M, Warren EH, Riddell SR. A human minor histocompatibility antigen resulting from differential expression due to a gene deletion. J Exp Med. 2003;197:1279–1289. doi: 10.1084/jem.20030044. [DOI] [PMC free article] [PubMed] [Google Scholar]
- 9.Kaplan DH, Anderson BE, McNiff JM, Jain D, Shlomchik MJ, Shlomchik WD. Target antigens determine graft-versus-host disease phenotype. J Immunol. 2004;173:5467–5475. doi: 10.4049/jimmunol.173.9.5467. [DOI] [PubMed] [Google Scholar]
- 10.Bleakley M, Otterud BE, Richardt JL, Mollerup AD, Hudecek M, Nishida T, Chaney CN, Warren EH, Leppert MF, Riddell SR. Leukemia-associated minor histocompatibility antigen discovery using T-cell clones isolated by in vitro stimulation of naive CD8+ T cells. Blood. 2010;115:4923–4933. doi: 10.1182/blood-2009-12-260539. [DOI] [PMC free article] [PubMed] [Google Scholar]
- 11.Bleakley M, Riddell SR. Molecules and mechanisms of the graft-versus-leukaemia effect. Nat Rev Cancer. 2004;4:371–380. doi: 10.1038/nrc1365. [DOI] [PubMed] [Google Scholar]
- 12.Bleakley M, Riddell SR. Exploiting T cells specific for human minor histocompatibility antigens for therapy of leukemia. Immunol Cell Biol. 2011;89:396–407. doi: 10.1038/icb.2010.124. [DOI] [PMC free article] [PubMed] [Google Scholar]
- 13.Hansen JA, Chien JW, Warren EH, Zhao LP, Martin PJ. Defining genetic risk for graft-versus-host disease and mortality following allogeneic hematopoietic stem cell transplantation. Curr Opin Hematol. 2010;17:483–492. doi: 10.1097/MOH.0b013e32833eb770. [DOI] [PMC free article] [PubMed] [Google Scholar]
- 14.Harris AC, Ferrara JL, Levine JE. Advances in predicting acute GVHD. Br J Haematol. 2013;160:288–302. doi: 10.1111/bjh.12142. [DOI] [PMC free article] [PubMed] [Google Scholar]
- 15.Petersdorf EW, Malkki M, Gooley TA, Spellman SR, Haagenson MD, Horowitz MM, Wang T. MHC-Resident Variation Affects Risks After Unrelated Donor Hematopoietic Cell Transplantation. Sci Transl Med. 2012;4:144ra101. doi: 10.1126/scitranslmed.3003974. [DOI] [PMC free article] [PubMed] [Google Scholar]
- 16.Sarin R, Wu X, Abraham C. Inflammatory disease protective R381Q IL23 receptor polymorphism results in decreased primary CD4+ and CD8+ human T-cell functional responses. Proc Natl Acad Sci U S A. 2011;108:9560–9565. doi: 10.1073/pnas.1017854108. [DOI] [PMC free article] [PubMed] [Google Scholar]
- 17.Elmaagacli AH, Koldehoff M, Landt O, Beelen DW. Relation of an interleukin-23 receptor gene polymorphism to graft-versus-host disease after hematopoietic-cell transplantation. Bone Marrow Transplant. 2008;41:821–826. doi: 10.1038/sj.bmt.1705980. [DOI] [PubMed] [Google Scholar]
- 18.Gruhn B, Intek J, Pfaffendorf N, Zell R, Corbacioglu S, Zintl F, Beck JF, Debatin KM, Steinbach D. Polymorphism of interleukin-23 receptor gene but not of NOD2/CARD15 is associated with graft-versus-host disease after hematopoietic stem cell transplantation in children. Biol Blood Marrow Transplant. 2009;15:1571–1577. doi: 10.1016/j.bbmt.2009.08.001. [DOI] [PubMed] [Google Scholar]
- 19.Hanash AM, Dudakov JA, Hua G, O’Connor MH, Young LF, Singer NV, West ML, Jenq RR, Holland AM, Kappel LW, et al. Interleukin-22 protects intestinal stem cells from immune-mediated tissue damage and regulates sensitivity to graft versus host disease. Immunity. 2012;37:339–350. doi: 10.1016/j.immuni.2012.05.028. [DOI] [PMC free article] [PubMed] [Google Scholar]
- 20.Moss EG, Poethig RS. MicroRNAs: something new under the sun. Curr Biol. 2002;12:R688–690. doi: 10.1016/s0960-9822(02)01206-x. [DOI] [PubMed] [Google Scholar]
- 21.Ajit SK. Circulating microRNAs as Biomarkers, Therapeutic Targets, and Signaling Molecules. Sensors (Basel) 2012;12:3359–3369. doi: 10.3390/s120303359. [DOI] [PMC free article] [PubMed] [Google Scholar]
- 22.Ranganathan P, Heaphy CE, Costinean S, Stauffer N, Na C, Hamadani M, Santhanam R, Mao C, Taylor PA, Sandhu S, et al. Regulation of acute graft-versus-host disease by microRNA-155. Blood. 2012;119:4786–4797. doi: 10.1182/blood-2011-10-387522. [DOI] [PMC free article] [PubMed] [Google Scholar]
- 23.Leonhardt F, Grundmann S, Behe M, Bluhm F, Dumont RA, Braun F, Fani M, Riesner K, Prinz G, Hechinger AK, et al. Inflammatory neovascularization during graft-versus-host disease is regulated by alphav integrin and miR-100. Blood. 2013;121:3307–3318. doi: 10.1182/blood-2012-07-442665. [DOI] [PubMed] [Google Scholar]
- 24.Koreth J, Matsuoka K, Kim HT, McDonough SM, Bindra B, Alyea EP, 3rd, Armand P, Cutler C, Ho VT, Treister NS, et al. Interleukin-2 and regulatory T cells in graft-versus-host disease. N Engl J Med. 2011;365:2055–2066. doi: 10.1056/NEJMoa1108188. [DOI] [PMC free article] [PubMed] [Google Scholar]
- 25.Matsuoka K, Koreth J, Kim HT, Bascug G, McDonough S, Kawano Y, Murase K, Cutler C, Ho VT, Alyea EP, et al. Low-dose interleukin-2 therapy restores regulatory T cell homeostasis in patients with chronic graft-versus-host disease. Sci Transl Med. 2013;5:179ra143. doi: 10.1126/scitranslmed.3005265. [DOI] [PMC free article] [PubMed] [Google Scholar]
- 26.Di Ianni M, Falzetti F, Carotti A, Terenzi A, Castellino F, Bonifacio E, Del Papa B, Zei T, Ostini RI, Cecchini D, et al. Tregs prevent GVHD and promote immune reconstitution in HLA-haploidentical transplantation. Blood. 2011;117:3921–3928. doi: 10.1182/blood-2010-10-311894. [DOI] [PubMed] [Google Scholar]
- 27.Rezvani K, Mielke S, Ahmadzadeh M, Kilical Y, Savani BN, Zeilah J, Keyvanfar K, Montero A, Hensel N, Kurlander R, Barrett AJ. High donor FOXP3-positive regulatory T-cell (Treg) content is associated with a low risk of GVHD following HLA-matched allogeneic SCT. Blood. 2006;108:1291–1297. doi: 10.1182/blood-2006-02-003996. [DOI] [PMC free article] [PubMed] [Google Scholar]
- 28.Wolf D, Wolf AM, Fong D, Rumpold H, Strasak A, Clausen J, Nachbaur D. Regulatory T-cells in the graft and the risk of acute graft-versus-host disease after allogeneic stem cell transplantation. Transplantation. 2007;83:1107–1113. doi: 10.1097/01.tp.0000260140.04815.77. [DOI] [PubMed] [Google Scholar]
- 29.Magenau JM, Qin X, Tawara I, Rogers CE, Kitko C, Schlough M, Bickley D, Braun TM, Jang PS, Lowler KP, et al. Frequency of CD4(+)CD25(hi)FOXP3(+) regulatory t cells has diagnostic and prognostic value as a biomarker for acute graft-versus-host-disease. Biol Blood Marrow Transplant. 2010;16:907–914. doi: 10.1016/j.bbmt.2010.02.026. [DOI] [PMC free article] [PubMed] [Google Scholar]
- 30.Chen YB, McDonough S, Hasserjian R, Chen H, Coughlin E, Illiano C, Park IS, Jagasia M, Spitzer TR, Cutler CS, et al. Expression of CD30 in patients with acute graft-versus-host disease. Blood. 2012;120:691–696. doi: 10.1182/blood-2012-03-415422. [DOI] [PMC free article] [PubMed] [Google Scholar]
- 31.Hubel K, Cremer B, Heuser E, von Strandmann EP, Hallek M, Hansen HP. A prospective study of serum soluble CD30 in allogeneic hematopoietic stem cell transplantation. Transpl Immunol. 2010;23:215–219. doi: 10.1016/j.trim.2010.07.001. [DOI] [PubMed] [Google Scholar]
- 32.Chaidos A, Patterson S, Szydlo R, Chaudhry MS, Dazzi F, Kanfer E, McDonald D, Marin D, Milojkovic D, Pavlu J, et al. Graft invariant natural killer T-cell dose predicts risk of acute graft-versus-host disease in allogeneic hematopoietic stem cell transplantation. Blood. 2012;119:5030–5036. doi: 10.1182/blood-2011-11-389304. [DOI] [PMC free article] [PubMed] [Google Scholar]
- 33.Rubio MT, Moreira-Teixeira L, Bachy E, Bouillie M, Milpied P, Coman T, Suarez F, Marcais A, Sibon D, Buzyn A, et al. Early posttransplantation donor-derived invariant natural killer T-cell recovery predicts the occurrence of acute graft-versus-host disease and overall survival. Blood. 2012;120:2144–2154. doi: 10.1182/blood-2012-01-404673. [DOI] [PubMed] [Google Scholar]
- 34.Akhtari M, Giver CR, Ali Z, Flowers CR, Gleason CL, Hillyer CD, Kaufman J, Khoury HJ, Langston AA, Lechowicz MJ, et al. Receiver operating characteristic curve analysis of circulating blood dendritic cell precursors and T cells predicts response to extracorporeal photopheresis in patients with chronic graft-versus-host disease. Transfusion. 2010;50:2424–2431. doi: 10.1111/j.1537-2995.2010.02712.x. [DOI] [PMC free article] [PubMed] [Google Scholar]
- 35.Lau J, Sartor M, Bradstock KF, Vuckovic S, Munster DJ, Hart DN. Activated circulating dendritic cells after hematopoietic stem cell transplantation predict acute graft-versus-host disease. Transplantation. 2007;83:839–846. doi: 10.1097/01.tp.0000258731.38149.61. [DOI] [PubMed] [Google Scholar]
- 36.Levine JE, Paczesny S, Sarantopoulos S. Clinical applications for biomarkers of acute and chronic graft-versus-host disease. Biol Blood Marrow Transplant. 2012;18:S116–124. doi: 10.1016/j.bbmt.2011.10.019. [DOI] [PMC free article] [PubMed] [Google Scholar]
- 37.Rozmus J, Schultz KR. Biomarkers in chronic graft-versus-host disease. Expert Rev Hematol. 2011;4:329–342. doi: 10.1586/ehm.11.27. [DOI] [PMC free article] [PubMed] [Google Scholar]
- 38.Allen JL, Fore MS, Wooten J, Roehrs PA, Bhuiya NS, Hoffert T, Sharf A, Deal AM, Armistead P, Coghill J, et al. B cells from patients with chronic GVHD are activated and primed for survival via BAFF-mediated pathways. Blood. 2012;120:2529–2536. doi: 10.1182/blood-2012-06-438911. [DOI] [PMC free article] [PubMed] [Google Scholar]
- 39.Sarantopoulos S, Stevenson KE, Kim HT, Cutler CS, Bhuiya NS, Schowalter M, Ho VT, Alyea EP, Koreth J, Blazar BR, et al. Altered B-cell homeostasis and excess BAFF in human chronic graft-versus-host disease. Blood. 2009;113:3865–3874. doi: 10.1182/blood-2008-09-177840. [DOI] [PMC free article] [PubMed] [Google Scholar]
- 40.Kuzmina Z, Krenn K, Petkov V, Kormoczi U, Weigl R, Rottal A, Kalhs P, Mitterbauer M, Ponhold L, Dekan G, et al. CD19(+)CD21(low) B cells and patients at risk for NIH-defined chronic graft-versus-host disease with bronchiolitis obliterans syndrome. Blood. 2013;121:1886–1895. doi: 10.1182/blood-2012-06-435008. [DOI] [PubMed] [Google Scholar]
- 41.Kuzmina Z, Greinix HT, Weigl R, Kormoczi U, Rottal A, Frantal S, Eder S, Pickl WF. Significant differences in B-cell subpopulations characterize patients with chronic graft-versus-host disease-associated dysgammaglobulinemia. Blood. 2011;117:2265–2274. doi: 10.1182/blood-2010-07-295766. [DOI] [PubMed] [Google Scholar]
- 42.Mann M, Jensen ON. Proteomic analysis of post-translational modifications. Nat Biotechnol. 2003;21:255–261. doi: 10.1038/nbt0303-255. [DOI] [PubMed] [Google Scholar]
- 43.Court M, Selevsek N, Matondo M, Allory Y, Garin J, Masselon CD, Domon B. Toward a standardized urine proteome analysis methodology. Proteomics. 2011;11:1160–1171. doi: 10.1002/pmic.201000566. [DOI] [PubMed] [Google Scholar]
- 44.Rai AJ, Gelfand CA, Haywood BC, Warunek DJ, Yi J, Schuchard MD, Mehigh RJ, Cockrill SL, Scott GB, Tammen H, et al. HUPO Plasma Proteome Project specimen collection and handling: towards the standardization of parameters for plasma proteome samples. Proteomics. 2005;5:3262–3277. doi: 10.1002/pmic.200401245. [DOI] [PubMed] [Google Scholar]
- 45.Anderson NL, Anderson NG. The human plasma proteome: history, character, and diagnostic prospects. Mol Cell Proteomics. 2002;1:845–867. doi: 10.1074/mcp.r200007-mcp200. [DOI] [PubMed] [Google Scholar]
- 46.Tirumalai RS, Chan KC, Prieto DA, Issaq HJ, Conrads TP, Veenstra TD. Characterization of the low molecular weight human serum proteome. Mol Cell Proteomics. 2003;2:1096–1103. doi: 10.1074/mcp.M300031-MCP200. [DOI] [PubMed] [Google Scholar]
- 47.Hanash SM, Pitteri SJ, Faca VM. Mining the plasma proteome for cancer biomarkers. Nature. 2008;452:571–579. doi: 10.1038/nature06916. [DOI] [PubMed] [Google Scholar]
- 48.Foell D, Wittkowski H, Roth J. Monitoring disease activity by stool analyses: from occult blood to molecular markers of intestinal inflammation and damage. Gut. 2009;58:859–868. doi: 10.1136/gut.2008.170019. [DOI] [PubMed] [Google Scholar]
- 49.Rodriguez-Otero P, Porcher R, Peffault de Latour R, Contreras M, Bouhnik Y, Xhaard A, Andreoli A, Ribaud P, Kapel N, Janin A, et al. Fecal calprotectin and alpha-1 antitrypsin predict severity and response to corticosteroids in gastrointestinal graft-versus-host disease. Blood. 2012;119:5909–5917. doi: 10.1182/blood-2011-12-397968. [DOI] [PubMed] [Google Scholar]
- 50.Chiusolo P, Metafuni E, Giammarco S, Bellesi S, Piccirillo N, Fanali C, Castagnola M, Zuppi C, De Michele T, Leone G, Sica S. Role of fecal calprotectin as biomarker of gastrointestinal GVHD after allogeneic stem cell transplantation. Blood. 2012;120:4443–4444. doi: 10.1182/blood-2012-08-447326. [DOI] [PubMed] [Google Scholar]
- 51.Eriguchi Y, Takashima S, Oka H, Shimoji S, Nakamura K, Uryu H, Shimoda S, Iwasaki H, Shimono N, Ayabe T, et al. Graft-versus-host disease disrupts intestinal microbial ecology by inhibiting Paneth cell production of alpha-defensins. Blood. 2012;120:223–231. doi: 10.1182/blood-2011-12-401166. [DOI] [PubMed] [Google Scholar]
- 52.Jenq RR, Ubeda C, Taur Y, Menezes CC, Khanin R, Dudakov JA, Liu C, West ML, Singer NV, Equinda MJ, et al. Regulation of intestinal inflammation by microbiota following allogeneic bone marrow transplantation. J Exp Med. 2012;209:903–911. doi: 10.1084/jem.20112408. [DOI] [PMC free article] [PubMed] [Google Scholar]
- 53.Rooijers K, Kolmeder C, Juste C, Dore J, de Been M, Boeren S, Galan P, Beauvallet C, de Vos WM, Schaap PJ. An iterative workflow for mining the human intestinal metaproteome. BMC Genomics. 2011;12:6. doi: 10.1186/1471-2164-12-6. [DOI] [PMC free article] [PubMed] [Google Scholar]
- 54.Paczesny S, Krijanovski OI, Braun TM, Choi SW, Clouthier SG, Kuick R, Misek DE, Cooke KR, Kitko CL, Weyand A, et al. A biomarker panel for acute graft-versus-host disease. Blood. 2009;113:273–278. doi: 10.1182/blood-2008-07-167098. [DOI] [PMC free article] [PubMed] [Google Scholar]
- 55.Boja E, Hiltke T, Rivers R, Kinsinger C, Rahbar A, Mesri M, Rodriguez H. Evolution of clinical proteomics and its role in medicine. J Proteome Res. 2011;10:66–84. doi: 10.1021/pr100532g. [DOI] [PubMed] [Google Scholar]
- 56.Rodland KD. Proteomics and cancer diagnosis: the potential of mass spectrometry. Clin Biochem. 2004;37:579–583. doi: 10.1016/j.clinbiochem.2004.05.011. [DOI] [PubMed] [Google Scholar]
- 57.Srinivasan R, Daniels J, Fusaro V, Lundqvist A, Killian JK, Geho D, Quezado M, Kleiner D, Rucker S, Espina V, et al. Accurate diagnosis of acute graft-versus-host disease using serum proteomic pattern analysis. Exp Hematol. 2006;34:796–801. doi: 10.1016/j.exphem.2006.02.013. [DOI] [PubMed] [Google Scholar]
- 58.Imanguli MM, Atkinson JC, Harvey KE, Hoehn GT, Ryu OH, Wu T, Kingman A, Barrett AJ, Bishop MR, Childs RW, et al. Changes in salivary proteome following allogeneic hematopoietic stem cell transplantation. Exp Hematol. 2007;35:184–192. doi: 10.1016/j.exphem.2006.10.009. [DOI] [PMC free article] [PubMed] [Google Scholar]
- 59.O’Farrell PH. High resolution two-dimensional electrophoresis of proteins. J Biol Chem. 1975;250:4007–4021. [PMC free article] [PubMed] [Google Scholar]
- 60.Marouga R, David S, Hawkins E. The development of the DIGE system: 2D fluorescence difference gel analysis technology. Anal Bioanal Chem. 2005;382:669–678. doi: 10.1007/s00216-005-3126-3. [DOI] [PubMed] [Google Scholar]
- 61.Wang H, Clouthier SG, Galchev V, Misek DE, Duffner U, Min CK, Zhao R, Tra J, Omenn GS, Ferrara JL, Hanash SM. Intact-protein-based high-resolution three-dimensional quantitative analysis system for proteome profiling of biological fluids. Mol Cell Proteomics. 2005;4:618–625. doi: 10.1074/mcp.M400126-MCP200. [DOI] [PubMed] [Google Scholar]
- 62.Chen CH, Budas GR, Churchill EN, Disatnik MH, Hurley TD, Mochly-Rosen D. Activation of aldehyde dehydrogenase-2 reduces ischemic damage to the heart. Science. 2008;321:1493–1495. doi: 10.1126/science.1158554. [DOI] [PMC free article] [PubMed] [Google Scholar]
- 63.Faca V, Coram M, Phanstiel D, Glukhova V, Zhang Q, Fitzgibbon M, McIntosh M, Hanash S. Quantitative analysis of acrylamide labeled serum proteins by LC-MS/MS. J Proteome Res. 2006;5:2009–2018. doi: 10.1021/pr060102+. [DOI] [PubMed] [Google Scholar]
- 64.Ferrara JL, Harris AC, Greenson JK, Braun TM, Holler E, Teshima T, Levine JE, Choi SW, Huber E, Landfried K, et al. Regenerating islet-derived 3-alpha is a biomarker of gastrointestinal graft-versus-host disease. Blood. 2011;118:6702–6708. doi: 10.1182/blood-2011-08-375006. [DOI] [PMC free article] [PubMed] [Google Scholar]
- 65.Paczesny S, Braun TM, Levine JE, Hogan J, Crawford J, Coffing B, Olsen S, Choi SW, Wang H, Faca V, et al. Elafin is a biomarker of graft-versus-host disease of the skin. Science Translational Medicine. 2010;2:13ra12. doi: 10.1126/scitranslmed.3000406. [DOI] [PMC free article] [PubMed] [Google Scholar]
- 66.Kaiser T, Kamal H, Rank A, Kolb HJ, Holler E, Ganser A, Hertenstein B, Mischak H, Weissinger EM. Proteomics applied to the clinical follow-up of patients after allogeneic hematopoietic stem cell transplantation. Blood. 2004;104:340–349. doi: 10.1182/blood-2004-02-0518. [DOI] [PubMed] [Google Scholar]
- 67.Brewis IA, Brennan P. Proteomics technologies for the global identification and quantification of proteins. Adv Protein Chem Struct Biol. 2010;80:1–44. doi: 10.1016/B978-0-12-381264-3.00001-1. [DOI] [PubMed] [Google Scholar]
- 68.Elliott MH, Smith DS, Parker CE, Borchers C. Current trends in quantitative proteomics. J Mass Spectrom. 2009;44:1637–1660. doi: 10.1002/jms.1692. [DOI] [PubMed] [Google Scholar]
- 69.Michalski A, Damoc E, Lange O, Denisov E, Nolting D, Muller M, Viner R, Schwartz J, Remes P, Belford M, et al. Ultra high resolution linear ion trap Orbitrap mass spectrometer (Orbitrap Elite) facilitates top down LC MS/MS and versatile peptide fragmentation modes. Mol Cell Proteomics. 2012;11:O111–013698. doi: 10.1074/mcp.O111.013698. [DOI] [PMC free article] [PubMed] [Google Scholar]
- 70.MacLean B, Eng JK, Beavis RC, McIntosh M. General framework for developing and evaluating database scoring algorithms using the TANDEM search engine. Bioinformatics. 2006;22:2830–2832. doi: 10.1093/bioinformatics/btl379. [DOI] [PubMed] [Google Scholar]
- 71.Paulovich AG, Billheimer D, Ham AJ, Vega-Montoto L, Rudnick PA, Tabb DL, Wang P, Blackman RK, Bunk DM, Cardasis HL, et al. Interlaboratory study characterizing a yeast performance standard for benchmarking LC-MS platform performance. Mol Cell Proteomics. 2010;9:242–254. doi: 10.1074/mcp.M900222-MCP200. [DOI] [PMC free article] [PubMed] [Google Scholar]
- 72.Tabb DL, Vega-Montoto L, Rudnick PA, Variyath AM, Ham AJ, Bunk DM, Kilpatrick LE, Billheimer DD, Blackman RK, Cardasis HL, et al. Repeatability and reproducibility in proteomic identifications by liquid chromatography-tandem mass spectrometry. J Proteome Res. 2010;9:761–776. doi: 10.1021/pr9006365. [DOI] [PMC free article] [PubMed] [Google Scholar]
- 73.Rudnick PA, Clauser KR, Kilpatrick LE, Tchekhovskoi DV, Neta P, Blonder N, Billheimer DD, Blackman RK, Bunk DM, Cardasis HL, et al. Performance metrics for liquid chromatography-tandem mass spectrometry systems in proteomics analyses. Mol Cell Proteomics. 2010;9:225–241. doi: 10.1074/mcp.M900223-MCP200. [DOI] [PMC free article] [PubMed] [Google Scholar]
- 74.Rodriguez H, Snyder M, Uhlen M, Andrews P, Beavis R, Borchers C, Chalkley RJ, Cho SY, Cottingham K, Dunn M, et al. Recommendations from the 2008 International Summit on Proteomics Data Release and Sharing Policy: the Amsterdam principles. J Proteome Res. 2009;8:3689–3692. doi: 10.1021/pr900023z. [DOI] [PMC free article] [PubMed] [Google Scholar]
- 75.Rauch A, Bellew M, Eng J, Fitzgibbon M, Holzman T, Hussey P, Igra M, Maclean B, Lin CW, Detter A, et al. Computational Proteomics Analysis System (CPAS): An extensible, open-source analytic system for evaluating and publishing proteomic data and high throughput biological experiments. J Proteome Res. 2006;5:112–121. doi: 10.1021/pr0503533. [DOI] [PubMed] [Google Scholar]
- 76.Pawitan Y, Michiels S, Koscielny S, Gusnanto A, Ploner A. False discovery rate, sensitivity and sample size for microarray studies. Bioinformatics. 2005;21:3017–3024. doi: 10.1093/bioinformatics/bti448. [DOI] [PubMed] [Google Scholar]
- 77.Butte A. The use and analysis of microarray data. Nat Rev Drug Discov. 2002;1:951–960. doi: 10.1038/nrd961. [DOI] [PubMed] [Google Scholar]
- 78.Berglund L, Bjorling E, Oksvold P, Fagerberg L, Asplund A, Szigyarto CA, Persson A, Ottosson J, Wernerus H, Nilsson P, et al. A genecentric Human Protein Atlas for expression profiles based on antibodies. Mol Cell Proteomics. 2008;7:2019–2027. doi: 10.1074/mcp.R800013-MCP200. [DOI] [PubMed] [Google Scholar]
- 79.Paczesny S. Discovery and validation of graft-versus-host disease biomarkers. Blood. 2013;121:585–594. doi: 10.1182/blood-2012-08-355990. [DOI] [PMC free article] [PubMed] [Google Scholar]
- 80.Fiema B, Harris AC, Gomez A, Pongtornpipat P, Lamiman K, Vander Lugt MT, Paczesny S. High throughput sequential ELISA for validation of biomarkers of acute graft-versus-host disease. J Vis Exp. 2012 doi: 10.3791/4247. [DOI] [PMC free article] [PubMed] [Google Scholar]
- 81.Kim SJ, Paczesny S, Takayama S, Kurabayashi K. Preprogrammed, Parallel On-Chip Immunoassay Using System-Level Capillarity Control. Anal Chem. 2013 doi: 10.1021/ac401292d. [DOI] [PMC free article] [PubMed] [Google Scholar]
- 82.Kim SJ, Paczesny S, Takayama S, Kurabayashi K. Preprogrammed capillarity to passively control system-level sequential and parallel microfluidic flows. Lab Chip. 2013;13:2091–2098. doi: 10.1039/c3lc50187f. [DOI] [PMC free article] [PubMed] [Google Scholar]
- 83.Addona TA, Abbatiello SE, Schilling B, Skates SJ, Mani DR, Bunk DM, Spiegelman CH, Zimmerman LJ, Ham AJ, Keshishian H, et al. Multi-site assessment of the precision and reproducibility of multiple reaction monitoring-based measurements of proteins in plasma. Nat Biotechnol. 2009;27:633–641. doi: 10.1038/nbt.1546. [DOI] [PMC free article] [PubMed] [Google Scholar]
- 84.Kitteringham NR, Jenkins RE, Lane CS, Elliott VL, Park BK. Multiple reaction monitoring for quantitative biomarker analysis in proteomics and metabolomics. J Chromatogr B Analyt Technol Biomed Life Sci. 2009;877:1229–1239. doi: 10.1016/j.jchromb.2008.11.013. [DOI] [PubMed] [Google Scholar]
- 85.Huttenhain R, Soste M, Selevsek N, Rost H, Sethi A, Carapito C, Farrah T, Deutsch EW, Kusebauch U, Moritz RL, et al. Reproducible quantification of cancer-associated proteins in body fluids using targeted proteomics. Sci Transl Med. 2012;4:142ra194. doi: 10.1126/scitranslmed.3003989. [DOI] [PMC free article] [PubMed] [Google Scholar]
- 86.Grote E, Fu Q, Ji W, Liu X, Van Eyk JE. Using pure protein to build a multiple reaction monitoring mass spectrometry assay for targeted detection and quantitation. Methods Mol Biol. 2013;1005:199–213. doi: 10.1007/978-1-62703-386-2_16. [DOI] [PubMed] [Google Scholar]
- 87.Pepe MS, Etzioni R, Feng Z, Potter JD, Thompson ML, Thornquist M, Winget M, Yasui Y. Phases of biomarker development for early detection of cancer. J Natl Cancer Inst. 2001;93:1054–1061. doi: 10.1093/jnci/93.14.1054. [DOI] [PubMed] [Google Scholar]
- 88.Gu W, Pepe MS. Estimating the diagnostic likelihood ratio of a continuous marker. Biostatistics. 2011;12:87–101. doi: 10.1093/biostatistics/kxq045. [DOI] [PMC free article] [PubMed] [Google Scholar]
- 89.Pepe MS, Longton G. Standardizing diagnostic markers to evaluate and compare their performance. Epidemiology. 2005;16:598–603. doi: 10.1097/01.ede.0000173041.03470.8b. [DOI] [PubMed] [Google Scholar]
- 90.Levine JE, Logan BR, Wu J, Alousi AM, Bolanos-Meade J, Ferrara JL, Ho VT, Weisdorf DJ, Paczesny S. Acute graft-versus-host disease biomarkers measured during therapy can predict treatment outcomes: a Blood and Marrow Transplant Clinical Trials Network study. Blood. 2012 doi: 10.1182/blood-2012-01-403063. [DOI] [PMC free article] [PubMed] [Google Scholar]
- 91.Vander Lugt MT, Braun TM, Hanash S, Ritz J, Ho VT, Antin JH, Zhang C, Wong C-H, Wang H, Chin A, et al. ST2 as a Marker for Risk of Therapy-Resistant Graft-versus-Host Disease and death. New England Journal of Medicine. 2013;369:529–539. doi: 10.1056/NEJMoa1213299. [DOI] [PMC free article] [PubMed] [Google Scholar]
- 92.Li J, Jiang B, Fine JP. Multicategory reclassification statistics for assessing improvements in diagnostic accuracy. Biostatistics. 2013;14:382–394. doi: 10.1093/biostatistics/kxs047. [DOI] [PMC free article] [PubMed] [Google Scholar]
- 93.Pencina MJ, D’Agostino RB, Vasan RS. Statistical methods for assessment of added usefulness of new biomarkers. Clin Chem Lab Med. 2010;48:1703–1711. doi: 10.1515/CCLM.2010.340. [DOI] [PMC free article] [PubMed] [Google Scholar]
- 94.Pencina MJ, D’Agostino RB, Sr, Steyerberg EW. Extensions of net reclassification improvement calculations to measure usefulness of new biomarkers. Stat Med. 2011;30:11–21. doi: 10.1002/sim.4085. [DOI] [PMC free article] [PubMed] [Google Scholar]
- 95.Toubai T, Tanaka J, Paczesny S, Shono Y, Reddy P, Imamura M. Role of cytokines in the pathophysiology of acute graft-versus-host disease (GVHD): are serum/plasma cytokines potential biomarkers for diagnosis of acute GVHD following allogeneic hematopoietic cell transplantation (Allo-HCT)? Curr Stem Cell Res Ther. 2012;7:229–239. doi: 10.2174/157488812799859856. [DOI] [PubMed] [Google Scholar]
- 96.Visentainer JEL, Lieber SR, Persoli LBL, Vigorito AC, Aranha FJP, de Brito Eid KA, Oliveira GB, Miranda ECM, de Souza CA. Serum cytokine levels and acute graft-versus-host disease after HLA-identical hematopoietic stem cell transplantation. Exp Hematol. 2003;31:1044–1050. doi: 10.1016/j.exphem.2003.08.005. [DOI] [PubMed] [Google Scholar]
- 97.Shaiegan M, Iravani M, Babaee G, Ghavamzadeh A. Effect of IL-18 and sIL2R on aGVHD occurrence after hematopoietic stem cell transplantation in some Iranian patients. Transpl Immunol. 2006;15:223–227. doi: 10.1016/j.trim.2005.10.002. [DOI] [PubMed] [Google Scholar]
- 98.Seidel C, Ringdén O, Remberger M. Increased levels of syndecan-1 in serum during acute graft-versus-host disease. Transplantation. 2003;76:423–426. doi: 10.1097/01.TP.0000074316.76104.A5. [DOI] [PubMed] [Google Scholar]
- 99.Miyamoto T, Akashi K, Hayashi S, Gondo H, Murakawa M, Tanimoto K, Harada M, Niho Y. Serum concentration of the soluble interleukin-2 receptor for monitoring acute graft-versus-host disease. Bone Marrow Transpl. 1996;17:185–190. [PubMed] [Google Scholar]
- 100.Foley R, Couban S, Walker I, Greene K, Chen CS, Messner H, Gauldie J. Monitoring soluble interleukin-2 receptor levels in related and unrelated donor allogenic bone marrow transplantation. Bone Marrow Transpl. 1998;21:769–773. doi: 10.1038/sj.bmt.1701163. [DOI] [PubMed] [Google Scholar]
- 101.Fujimori Y, Yoshimoto T, Matsui K, Tsutsui H, Okamoto T, Kashiwamura S, Hada T, Okamura H, Kakishita E, Hara H, Nakanishi K. Increased expression of interleukin-18 receptor on T lymphocytes in patients with acute graft-versus-host disease after allogeneic bone marrow transplantation. J Interferon Cytokine Res. 2002;22:751–754. doi: 10.1089/107999002320271332. [DOI] [PubMed] [Google Scholar]
- 102.August KJ, Chiang KY, Bostick RM, Flanders WD, Waller EK, Langston A, Worthington-White D, Rowland P, Moore KF, Khoury HJ, Horan JT. Biomarkers of immune activation to screen for severe, acute GVHD. Bone Marrow Transplant. 2011;46:601–604. doi: 10.1038/bmt.2010.165. [DOI] [PubMed] [Google Scholar]
- 103.Schots R, Kaufman L, Van Riet I, Ben Othman T, De Waele M, Van Camp B, Demanet C. Proinflammatory cytokines and their role in the development of major transplant-related complications in the early phase after allogeneic bone marrow transplantation. Leukemia. 2003;17:1150–1156. doi: 10.1038/sj.leu.2402946. [DOI] [PubMed] [Google Scholar]
- 104.Holler E, Kolb HJ, Moller A, Kempeni J, Liesenfeld S, Pechumer H, Lehmacher W, Ruckdeschel G, Gleixner B, Riedner C. Increased serum levels of tumor necrosis factor alpha precede major complications of bone marrow transplantation. Blood. 1990;75:1011–1016. [PubMed] [Google Scholar]
- 105.Abdallah AN, Boiron JM, Attia Y, Cassaigne A, Reiffers J, Iron A. Plasma cytokines in graft vs host disease and complications following bone marrow transplantation. Hematol Cell Ther. 1997;39:27–32. doi: 10.1007/s00282-997-0027-2. [DOI] [PubMed] [Google Scholar]
- 106.Choi SW, Kitko CL, Braun T, Paczesny S, Yanik G, Mineishi S, Krijanovski O, Jones D, Whitfield J, Cooke K, et al. Change in plasma tumor necrosis factor receptor 1 levels in the first week after myeloablative allogeneic transplantation correlates with severity and incidence of GVHD and survival. Blood. 2008;112:1539–1542. doi: 10.1182/blood-2008-02-138867. [DOI] [PMC free article] [PubMed] [Google Scholar]
- 107.Paczesny S, Choi SW, Ferrara JL. Acute graft-versus-host disease: new treatment strategies. Curr Opin Hematol. 2009;16:427–436. doi: 10.1097/MOH.0b013e3283319a6f. [DOI] [PMC free article] [PubMed] [Google Scholar]
- 108.Pihusch M, Pihusch R, Fraunberger P, Pihusch V, Andreesen R, Kolb HJ, Holler E. Evaluation of C-reactive protein, interleukin-6, and procalcitonin levels in allogeneic hematopoietic stem cell recipients. Eur J Haematol. 2006;76:93–101. doi: 10.1111/j.0902-4441.2005.00568.x. [DOI] [PubMed] [Google Scholar]
- 109.Malone FR, Leisenring WM, Storer BE, Lawler R, Stern JM, Aker SN, Bouvier ME, Martin PJ, Batchelder AL, Schoch HG, McDonald GB. Prolonged anorexia and elevated plasma cytokine levels following myeloablative allogeneic hematopoietic cell transplant. Bone Marrow Transplant. 2007;40:765–772. doi: 10.1038/sj.bmt.1705816. [DOI] [PubMed] [Google Scholar]
- 110.Schots R, Van Riet I, Othman TB, Trullemans F, De Waele M, Van Camp B, Kaufman L. An early increase in serum levels of C-reactive protein is an independent risk factor for the occurrence of major complications and 100-day transplant-related mortality after allogeneic bone marrow transplantation. Bone Marrow Transplant. 2002;30:441–446. doi: 10.1038/sj.bmt.1703672. [DOI] [PubMed] [Google Scholar]
- 111.Uguccioni M, Meliconi R, Nesci S, Lucarelli G, Ceska M, Gasbarrini G, Facchini A. Elevated interleukin-8 serum concentrations in beta-thalassemia and graft-versus-host disease. Blood. 1993;81:2252–2256. [PubMed] [Google Scholar]
- 112.Mohty M, Blaise D, Faucher C, Vey N, Bouabdallah R, Stoppa A-M, Viret F, Gravis G, Olive D, Gaugler B. Inflammatory cytokines and acute graft-versus-host disease after reduced-intensity conditioning allogeneic stem cell transplantation. Blood. 2005;106:4407–4411. doi: 10.1182/blood-2005-07-2919. [DOI] [PubMed] [Google Scholar]
- 113.Boyman O, Krieg C, Homann D, Sprent J. Homeostatic maintenance of T cells and natural killer cells. Cell Mol Life Sci. 2012;69:1597–1608. doi: 10.1007/s00018-012-0968-7. [DOI] [PMC free article] [PubMed] [Google Scholar]
- 114.Thiant S, Labalette M, Trauet J, Coiteux V, de Berranger E, Dessaint JP, Yakoub-Agha I. Plasma levels of IL-7 and IL-15 after reduced intensity conditioned allo-SCT and relationship to acute GVHD. Bone Marrow Transplant. 2011;46:1374–1381. doi: 10.1038/bmt.2010.300. [DOI] [PubMed] [Google Scholar]
- 115.Thiant S, Yakoub-Agha I, Magro L, Trauet J, Coiteux V, Jouet JP, Dessaint JP, Labalette M. Plasma levels of IL-7 and IL-15 in the first month after myeloablative BMT are predictive biomarkers of both acute GVHD and relapse. Bone Marrow Transplant. 2010;45:1546–1552. doi: 10.1038/bmt.2010.13. [DOI] [PubMed] [Google Scholar]
- 116.Dean RM, Fry T, Mackall C, Steinberg SM, Hakim F, Fowler D, Odom J, Foley J, Gress R, Bishop MR. Association of serum interleukin-7 levels with the development of acute graft-versus-host disease. J Clin Oncol. 2008;26:5735–5741. doi: 10.1200/JCO.2008.17.1314. [DOI] [PMC free article] [PubMed] [Google Scholar]
- 117.Piper KP, Horlock C, Curnow SJ, Arrazi J, Nicholls S, Mahendra P, Craddock C, Moss PAH. CXCL10-CXCR3 interactions play an important role in the pathogenesis of acute graft-versus-host disease in the skin following allogeneic stem-cell transplantation. Blood. 2007;110:3827–3832. doi: 10.1182/blood-2006-12-061408. [DOI] [PubMed] [Google Scholar]
- 118.Hori T, Naishiro Y, Sohma H, Suzuki N, Hatakeyama N, Yamamoto M, Sonoda T, Mizue Y, Imai K, Tsutsumi H, Kokai Y. CCL8 is a potential molecular candidate for the diagnosis of graft-versus-host disease. Blood. 2008;111:4403–4412. doi: 10.1182/blood-2007-06-097287. [DOI] [PMC free article] [PubMed] [Google Scholar]
- 119.Chen YB, Kim HT, McDonough S, Odze RD, Yao X, Lazo-Kallanian S, Spitzer TR, Soiffer R, Antin JH, Ritz J. Up-Regulation of alpha4beta7 integrin on peripheral T cell subsets correlates with the development of acute intestinal graft-versus-host disease following allogeneic stem cell transplantation. Biol Blood Marrow Transplant. 2009;15:1066–1076. doi: 10.1016/j.bbmt.2009.05.003. [DOI] [PMC free article] [PubMed] [Google Scholar]
- 120.Okamoto T, Takatsuka H, Fujimori Y, Wada H, Iwasaki T, Kakishita E. Increased hepatocyte growth factor in serum in acute graft-versus-host disease. Bone Marrow Transpl. 2001;28:197–200. doi: 10.1038/sj.bmt.1703095. [DOI] [PubMed] [Google Scholar]
- 121.Luft T, Conzelmann M, Benner A, Rieger M, Hess M, Strohhaecker U, Görner M, Hegenbart U, Ho A, Dreger P. Serum cytokeratin-18 fragments as quantitative markers of epithelial apoptosis in liver and intestinal graft-versus-host disease. Blood. 2007;110:4535–4542. doi: 10.1182/blood-2006-10-049817. [DOI] [PubMed] [Google Scholar]
- 122.Kuroiwa T, Kakishita E, Hamano T, Kataoka Y, Seto Y, Iwata N, Kaneda Y, Matsumoto K, Nakamura T, Ueki T, et al. Hepatocyte growth factor ameliorates acute graft-versus-host disease and promotes hematopoietic function. J Clin Invest. 2001;107:1365–1373. doi: 10.1172/JCI11808. [DOI] [PMC free article] [PubMed] [Google Scholar]
- 123.Luft T, Dietrich S, Falk C, Conzelmann M, Hess M, Benner A, Neumann F, Isermann B, Hegenbart U, Ho AD, Dreger P. Steroid-refractory GVHD: T-cell attack within a vulnerable endothelial system. Blood. 2011;118:1685–1692. doi: 10.1182/blood-2011-02-334821. [DOI] [PubMed] [Google Scholar]
- 124.Rezvani AR, Storer BE, Storb RF, Mielcarek M, Maloney DG, Sandmaier BM, Martin PJ, McDonald GB. Decreased serum albumin as a biomarker for severe acute graft-versus-host disease after reduced-intensity allogeneic hematopoietic cell transplantation. Biol Blood Marrow Transplant. 2011;17:1594–1601. doi: 10.1016/j.bbmt.2011.07.021. [DOI] [PMC free article] [PubMed] [Google Scholar]
- 125.Weissinger EM, Schiffer E, Hertenstein B, Ferrara JL, Holler E, Stadler M, Kolb HJ, Zander A, Zurbig P, Kellmann M, Ganser A. Proteomic patterns predict acute graft-versus-host disease after allogeneic hematopoietic stem cell transplantation. Blood. 2007;109:5511–5519. doi: 10.1182/blood-2007-01-069757. [DOI] [PubMed] [Google Scholar]
- 126.Harris AC, Ferrara JL, Braun TM, Holler E, Teshima T, Levine JE, Choi SW, Landfried K, Akashi K, Lugt MV, et al. Plasma biomarkers of lower gastrointestinal and liver acute GVHD. Blood. 2012;119:2960–2963. doi: 10.1182/blood-2011-10-387357. [DOI] [PMC free article] [PubMed] [Google Scholar]
- 127.Levine JE, Logan BR, Wu J, Alousi AM, Bolanos-Meade J, Ferrara JL, Ho VT, Weisdorf DJ, Paczesny S. Acute graft-versus-host disease biomarkers measured during therapy can predict treatment outcomes: a Blood and Marrow Transplant Clinical Trials Network study. Blood. 2012;119:3854–3860. doi: 10.1182/blood-2012-01-403063. [DOI] [PMC free article] [PubMed] [Google Scholar]
- 128.Andersen J, Heilmann C, Jacobsen N, Nielsen C, Bendtzen K, Muller K. Differential effect of conditioning regimens on cytokine responses during allogeneic stem cell transplantation. Bone Marrow Transplant. 2006;37:635–640. doi: 10.1038/sj.bmt.1705295. [DOI] [PubMed] [Google Scholar]
- 129.Sauter C, Barker JN. Unrelated donor umbilical cord blood transplantation for the treatment of hematologic malignancies. Curr Opin Hematol. 2008;15:568–575. doi: 10.1097/MOH.0b013e3283136718. [DOI] [PMC free article] [PubMed] [Google Scholar]
- 130.Brunstein CG, Fuchs EJ, Carter SL, Karanes C, Costa LJ, Wu J, Devine SM, Wingard JR, Aljitawi OS, Cutler CS, et al. Alternative donor transplantation after reduced intensity conditioning: results of parallel phase 2 trials using partially HLA-mismatched related bone marrow or unrelated double umbilical cord blood grafts. Blood. 2011;118:282–288. doi: 10.1182/blood-2011-03-344853. [DOI] [PMC free article] [PubMed] [Google Scholar]
- 131.Brunstein CG, Gutman JA, Weisdorf DJ, Woolfrey AE, Defor TE, Gooley TA, Verneris MR, Appelbaum FR, Wagner JE, Delaney C. Allogeneic hematopoietic cell transplantation for hematologic malignancy: relative risks and benefits of double umbilical cord blood. Blood. 2010;116:4693–4699. doi: 10.1182/blood-2010-05-285304. [DOI] [PMC free article] [PubMed] [Google Scholar]
- 132.Ponce DM, Gonzales A, Lubin M, Castro-Malaspina H, Giralt S, Goldberg JD, Hanash AM, Jakubowski A, Jenq R, Papadopoulos EB, et al. Graft-versus-host disease after double-unit cord blood transplantation has unique features and an association with engrafting unit-to-recipient HLA match. Biol Blood Marrow Transplant. 2013;19:904–911. doi: 10.1016/j.bbmt.2013.02.008. [DOI] [PMC free article] [PubMed] [Google Scholar]
- 133.Alyea EP, Li S, Kim HT, Cutler C, Ho V, Soiffer RJ, Antin JH. Sirolimus, Tacrolimus, and Low-Dose Methotrexate as Graft-versus-Host Disease Prophylaxis in Related and Unrelated Donor Reduced-Intensity Conditioning Allogeneic Peripheral Blood Stem Cell Transplantation. Biol Blood Marrow Transpl. 2008;14:920–926. doi: 10.1016/j.bbmt.2008.05.024. [DOI] [PMC free article] [PubMed] [Google Scholar]
- 134.Grimm J, Zeller W, Zander AR. Soluble interleukin-2 receptor serum levels after allogeneic bone marrow transplantations as a marker for GVHD. Bone Marrow Transpl. 1998;21:29–32. doi: 10.1038/sj.bmt.1701041. [DOI] [PubMed] [Google Scholar]