Abstract
Pyruvate is a key intermediary in energy metabolism and can exert antioxidant and anti-inflammatory effects. However, the fate of pyruvate during AKI remains unknown. Here, we assessed renal cortical pyruvate and its major determinants (glycolysis, gluconeogenesis, pyruvate dehydrogenase [PDH], and H2O2 levels) in mice subjected to unilateral ischemia (15–60 minutes; 0–18 hours of vascular reflow) or glycerol-induced ARF. The fate of postischemic lactate, which can be converted back to pyruvate by lactate dehydrogenase, was also addressed. Ischemia and glycerol each induced persistent pyruvate depletion. During ischemia, decreasing pyruvate levels correlated with increasing lactate levels. During early reperfusion, pyruvate levels remained depressed, but lactate levels fell below control levels, likely as a result of rapid renal lactate efflux. During late reperfusion and glycerol-induced AKI, pyruvate depletion corresponded with increased gluconeogenesis (pyruvate consumption). This finding was underscored by observations that pyruvate injection increased renal cortical glucose content in AKI but not normal kidneys. AKI decreased PDH levels, potentially limiting pyruvate to acetyl CoA conversion. Notably, pyruvate therapy mitigated the severity of AKI. This renoprotection corresponded with increases in cytoprotective heme oxygenase 1 and IL-10 mRNAs, selective reductions in proinflammatory mRNAs (e.g., MCP-1 and TNF-α), and improved tissue ATP levels. Paradoxically, pyruvate increased cortical H2O2 levels. We conclude that AKI induces a profound and persistent depletion of renal cortical pyruvate, which may induce additional injury.
Increasing evidence indicates the diverse role that pyruvate can play as a potential modulator of tissue injury. Pyruvate is classically viewed as a key determinant of cellular energy metabolism. Under aerobic conditions, pyruvate, generated from glucose by glycolysis, undergoes decarboxylation by the enzyme complex pyruvate dehydrogenase (PDH), forming acetyl CoA. Alternatively, pyruvate can be carboxylated by pyruvate carboxylase, yielding oxaloacetate, with subsequent acetyl CoA/oxaloacetate metabolism through the Krebs cycle and increased aerobic ATP production results. Conversely, under anaerobic conditions, pyruvate is metabolized by lactate dehydrogenase (LDH) to lactate, and in the process, NAD is generated, which is required for additional glycolytic ATP production.
In addition to its central role in supporting both aerobic and anaerobic energy production, pyruvate may exert a variety of cytoprotective effects. For example, studies by Salahudeen et al.1 and Nath et al.2 showed that pyruvate is a potent H2O2 scavenger, which was assessed in an in vitro system. Furthermore, Salahudeen et al.1 and Nath et al.2 reported that pyruvate administration decreased renal injury after intrarenal H2O2 injection and during the course of the glycerol model of rhabdomyolysis-induced ARF.
In addition to its antioxidant properties, pyruvate may also exert anti-inflammatory and cytoprotective effects. For example, Miyaji et al.3 and Ulloa et al.4 reported that ethyl pyruvate conferred protection against the cecal ligation and puncture model of sepsis-induced AKI. Ulloa et al.4 also noted that ethyl pyruvate decreased lethality in sepsis-induced inflammatory states.4 Ethyl pyruvate has been shown to protect against experimental ischemic-reperfusion injury and shock.5–7 Finally, pyruvate administration has been noted to decrease myocardial inflammation after cardiopulmonary bypass8 as well as stroke.9 The importance of these latter studies is underscored by the fact that Na, rather than ethyl-pyruvate, was used, given that the ethyl pyruvate formulation may exert compound-specific effects.3
Despite the critical role of pyruvate in cellular energy production as well as its potential to impact experimental tissue injury, the impact of ischemic or nephrotoxic AKI on tissue pyruvate levels and its determinants has remained undefined. Hence, the goals of this study were threefold: first, document the influence of evolving ischemic and toxic AKI on pyruvate levels within renal cortex; second, ascertain the metabolic pathways that ultimately alter pyruvate expression; third, further elucidate the potential effects of pyruvate on the course and selected potential mediators of experimental models of ARF.
Results
Renal Cortical Pyruvate Depletion during Progressive Renal Ischemia
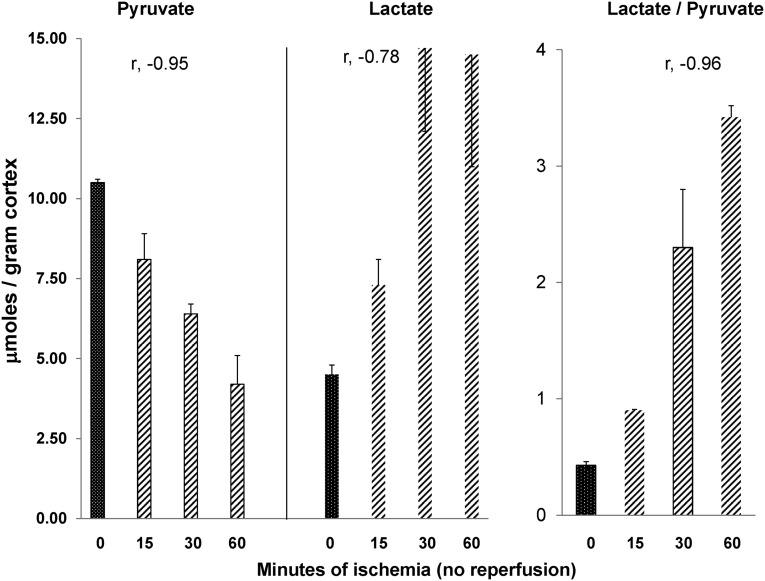
To assess the impact of ischemia on renal cortical pyruvate levels, mice were subjected to 15, 30, or 60 minutes of unilateral renal pedicle occlusion, with the contralateral (CL) kidneys serving as nonischemic controls. As shown in Figure 1, progressive ischemia induced stepwise pyruvate depletion, with values falling ∼25%, ∼40%, and ∼60% from control values with 15, 30, and 60 minutes of ischemia, respectively. Corresponding with the falling pyruvate levels were reciprocal equimolar increases in tissue lactate, consistent with LDH-mediated pyruvate → lactate conversion. The progressive decreases in pyruvate with reciprocal lactate increases led to stepwise increases in lactate/pyruvate ratios.
Figure 1.
Progressive renal ischemia induces increasing pyruvate depletion. Changes in renal cortical pyruvate and lactate concentrations in response to progressive renal ischemia without reperfusion. Increasing ischemia times from baseline (0 minutes) to 60 minutes led to a progressive, steep decline in tissue pyruvate concentrations. Reciprocal increases in tissue lactate concentrations were observed, consistent with pyruvate → lactate conversion by LDH activity. This pyruvate → lactate shift was reflected by progressive stepwise increases in lactate/pyruvate ratios (n=2 mice at each time point; unilateral ischemia results compared with results obtained in the uninjured CL kidney). The r values reflect pyruvate, lactate, or lactate/pyruvate ratios versus ischemia times.
Two-Hour Postischemic Pyruvate and Lactate Levels
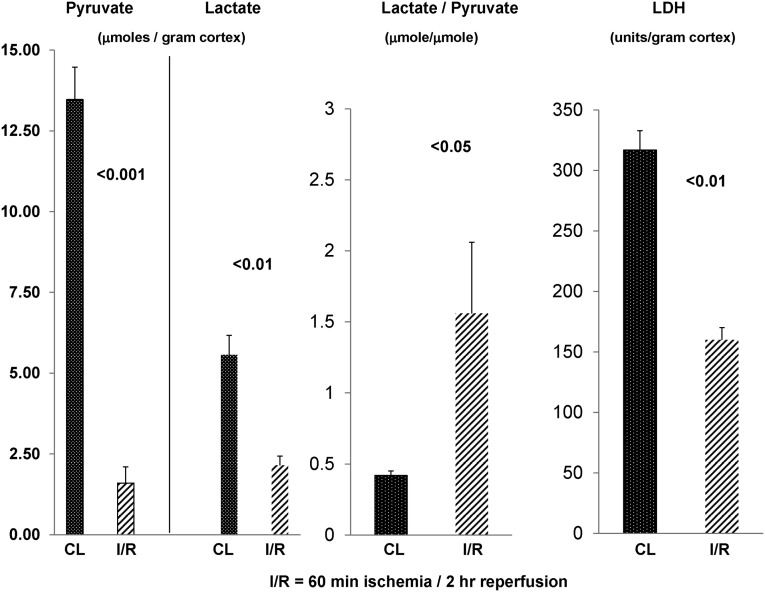
To assess the fate of pyruvate during early reperfusion, renal cortical tissues were harvested 2 hours after 60 minutes of unilateral ischemia. Again, the CL kidney provided control tissue values. As shown in Figure 2, despite 2 hours of reperfusion, no recovery of renal cortical pyruvate levels was observed. Rather, another ∼20% pyruvate decline occurred versus end ischemic (Figure 1) values (reaching ∼80% pyruvate depletion). Conversely, the lactate elevations observed at the end of ischemia were reversed by 2 hours postischemia. Surprising in this regard is that the postischemic lactate levels fell to ∼30% below control kidney values. Thus, both pyruvate and lactate depletion were observed in the early (2 hour) reperfusion period. A greater reduction in postischemic pyruvate versus lactate levels was reflected by a significantly increased lactate/pyruvate ratio compared with control tissue values.
Figure 2.
Persistent pyruvate depletion during early vascular reflow. Pyruvate/lactate concentrations and renal cortical LDH levels after 60 minutes of unilateral ischemia and 2 hours of vascular reflow. After 2 hours of unilateral ischemia, an approximately 80% reduction in renal cortical pyruvate concentrations was observed (compared with values in the uninjured CL kidney). Additionally, an approximate 60% reduction in renal cortical lactate levels occurred. The relatively greater pyruvate versus lactate reduction was reflected by higher lactate/pyruvate ratios. Renal ischemia-reperfusion (I/R) also led to an approximately 50% reduction in renal cortical LDH activity, which was previously reported.10 Hence, the loss of LDH activity likely contributed to the heightened lactate/pyruvate ratios by limiting lactate → pyruvate conversion under oxygenated conditions (n=8 mice; postischemic versus the CL kidney results depicted).
Cortical tissue LDH levels were reduced by ∼50% by 2 hours postischemia (data not shown), consistent with our prior data.10 Given that LDH converts lactate to pyruvate under aerobic (not anaerobic) conditions, these LDH reductions potentially contributed to the elevated postischemic lactate/pyruvate ratios.
Eighteen-Hour Postischemic Pyruvate and Lactate Levels
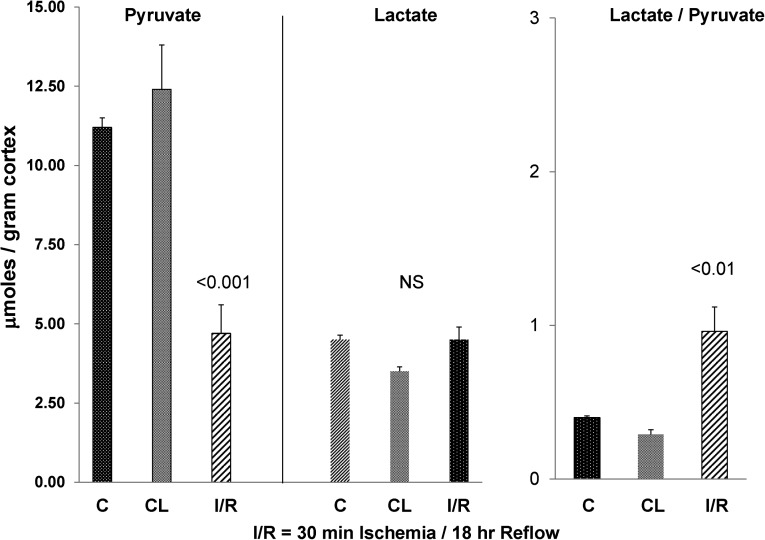
To ascertain the durability of ischemia-induced pyruvate depletion, additional mice were subjected to 30 minutes of unilateral ischemia (versus 60 minutes of ischemia as used above), and 18 hours later, pyruvate, lactate, and LDH levels were assessed. The values were contrasted with those values seen in kidneys from sham-operated mice and the CL kidneys from the mice subjected to the unilateral ischemia protocol. As shown in Figure 3, despite an 18-hour postischemic recovery period, renal cortical pyruvate levels remained markedly depressed (by ∼67% compared with control kidney values). Conversely, lactate levels had returned to control tissue values. Normal lactate levels with concomitant depressed pyruvate levels were reflected by a doubling of lactate/pyruvate ratios (P<0.01).
Figure 3.
Persistent pyruvate depletion following ischemic reperfusion injury. Pyruvate and lactate concentrations after 30 minutes of ischemia and 18 hours of vascular reflow. After a less severe ischemic insult and a greater reperfusion time than used in the experiments depicted in Figure 2, marked pyruvate reductions were still observed. The values given reflect those values found in control (sham-operated) mice postunilateral I/R and those values in the CL kidneys (n=6 each). By 18 hours of reflow, lactate concentrations returned to control values. Although not depicted, tissue LDH levels were depressed by approximately 50%,10 likely contributing to the higher lactate/pyruvate ratios because of reduced lactate → pyruvate conversion under oxygenated conditions.
Tissue LDH levels at 18 hours postischemia remained depressed by ∼50% compared with control values (not depicted). Thus, as noted above, depressed LDH levels likely contributed to the elevated lactate/pyruvate ratios by limiting lactate → pyruvate conversion under aerobic conditions.
Exploring Mechanisms for Postischemic Pyruvate Depletion
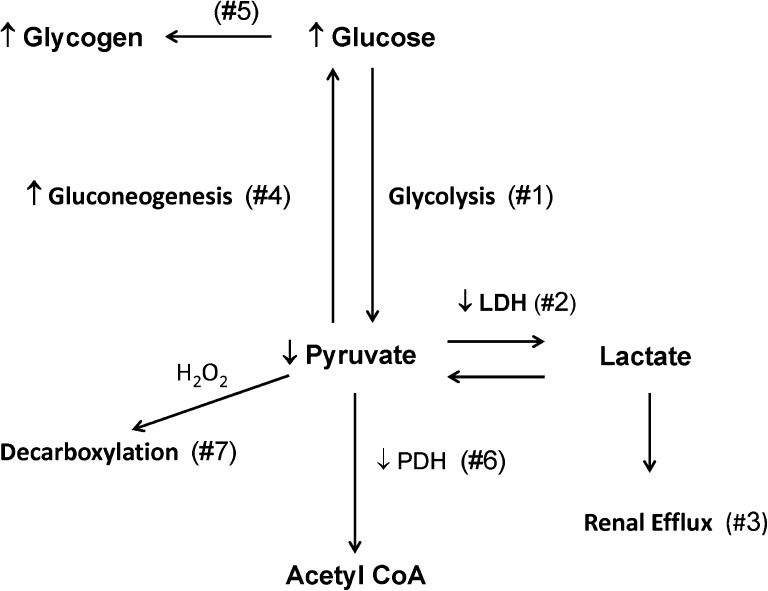
As shown in Figure 4, multiple mechanisms exist by which ischemic-reperfusion injury might cause pyruvate depletion. The results of experiments that examined this issue are described below.
Figure 4.
Schematic representation of potential mechanisms for postischemic pyruvate depletion. Reaction 1 represents glucose conversion to pyruvate and ultimately, lactate under conditions of ischemia. With vascular reperfusion, a loss of tissue LDH content (reaction 2) would be expected to reduce lactate conversion back to pyruvate. Furthermore, lactate efflux from renal cortex into the systemic circulation would further limit pyruvate synthesis because of loss of lactate as a pyruvate precursor (reaction 3). Reaction 4 depicts pyruvate conversion to glucose and ultimately, glycogen (reaction 5) because of gluconeogenesis during postischemic vascular reperfusion. Reaction 6 depicts potential pyruvate conversion by PDH to acetyl CoA for entry into the Kreb’s cycle. However, tissue PDH assay revealed suppressed PDH levels after ischemic- or glycerol-induced tissue injury. Finally, reaction 7 depicts potential pyruvate consumption by H2O2-mediated decarboxylation (H2O2 scavenging).
Pyruvate Flux into Glucose: Gluconeogenesis
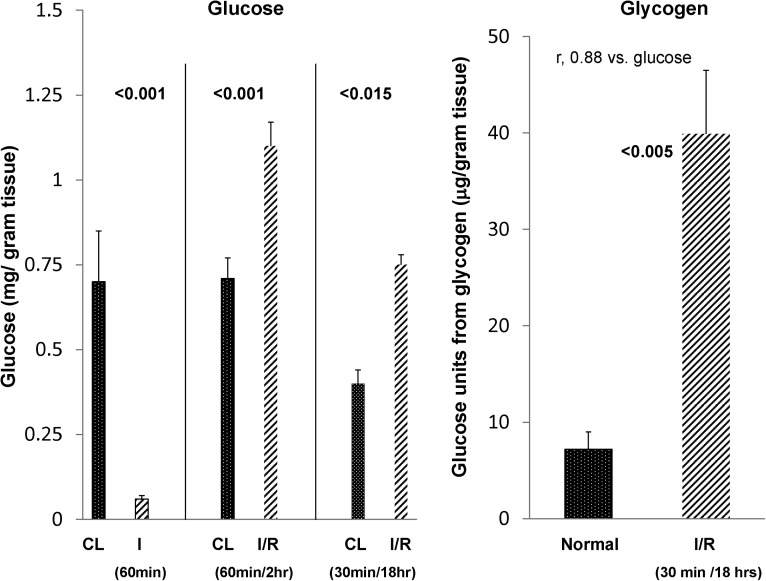
As shown in Figure 4, pyruvate is a key gluconeogenic substrate. Therefore, glucose levels in renal cortex were assessed at three time points: (1) at completion of 60 minutes of unilateral ischemia, (2) after 60 minutes of ischemia + 2 hours of reperfusion, and (3) 18 hours after 30 minutes of unilateral ischemia. As shown in Figure 5, ischemia in the absence of reperfusion led to >90% glucose depletion in renal cortex, consistent with marked renal cortical glycolysis. By 2 hours of vascular reflow, a marked recovery in renal cortical glucose content was observed, with values rising to ∼50% above those values in CL kidneys. These glucose elevations were also observed at 18 hours after 30 minutes of ischemia compared with values in normal kidneys.
Figure 5.
Changes in renal cortical glucose and glycogen content after ischemic renal injury. Sixty minutes of unilateral renal ischemia caused a near total loss of renal cortical glucose content, indicative of glycolysis. However, by 2 hours of reperfusion, renal cortical glucose levels rebounded, achieving values that were ∼50% greater than those values seen in the CL uninjured kidney (consistent with enhanced postischemic gluconeogenesis). These postischemic glucose elevations were persistent in nature, which was indicated by 18-hour postischemic renal cortical glucose values. Consistent with increased gluconeogenesis was an approximately sixfold increase in postischemic renal cortical glycogen content. All postischemic values are contrasted with those values found in uninjured CL kidneys (n=6 for each determination).
Because a postischemic increase in renal cortical glucose could reflect either gluconeogenesis or glycogenolysis, renal cortical glycogen content was measured in 18-hour postischemic kidneys and CL uninjured kidneys. As shown in Figure 5, right panel, an approximately fivefold increase in renal cortical glycogen content was observed in the postischemic kidneys. A direct relationship was observed between renal cortical glucose and glycogen levels (r=0.88: individual glucose versus glycogen values). Hence, these data indicate that (1) renal ischemia without reperfusion evokes marked glycolysis (reaction 1 in Figure 4) and (2) after vascular reflow, gluconeogenesis is suggested by significant increases in renal cortical glucose (reaction 4 in Figure 4) and glycogen content (reaction 5 in Figure 4). Of note, plasma glucose was minimally affected by the ischemia-reperfusion protocol (controls, 160±11 mg/dl; postischemia, 210±22 mg/dl; NS).
Postischemic PDH Levels
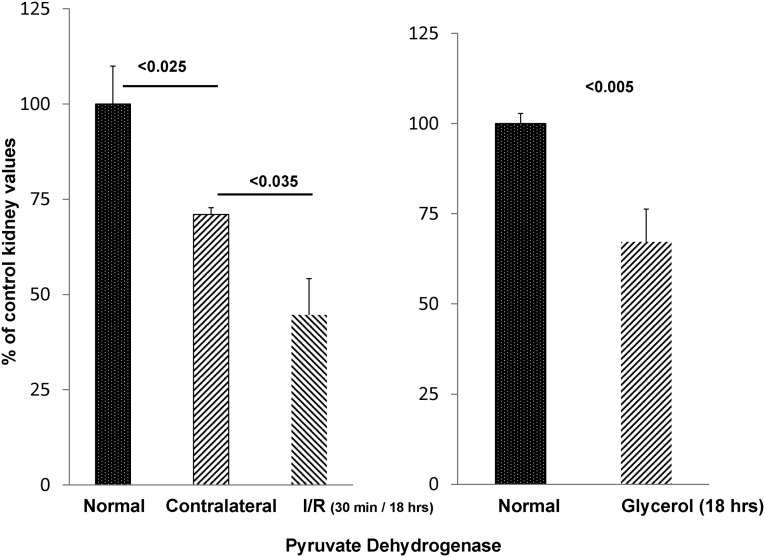
An additional potential mechanism for postischemic pyruvate depletion would be increased pyruvate conversion into acetyl CoA by PDH, which is shown in Figure 4. Thus, the impact of postischemic injury on renal cortical PDH levels was assessed. Compared with control kidneys, the postischemic kidneys manifested an approximately 70% PDH reduction (reaction 6 in Figure 4). The uninjured CL kidney also had decreased PDH levels compared with normal kidney values (∼30% reduction). However, as shown in Figure 6, left panel, the postischemic kidneys still revealed ∼40% lower PDH levels versus the CL kidney controls (P<0.04).
Figure 6.
PDH levels fall in response to AKI. PDH levels after AKI. By 18 hours after 30 minutes of unilateral ischemia, an approximately 55% reduction in renal cortical PDH was observed compared with normal kidney values (left panel). The uninjured CL kidney also had reduced PDH, but it remained significantly higher than its postischemic counterpart (P<0.04). As shown in right panel, glycerol-induced AKI also induced a significant PDH reduction (n=5 determinations each).
Loss of Lactate from Injured Cells
Given that lactate is generated during tissue injury (e.g., in the presence of mitochondrial damage or ischemia) and can be converted back to pyruvate by LDH under aerobic conditions, we questioned whether renal lactate loss from injured kidneys might limit LDH-mediated pyruvate formation. To test for renal lactate efflux, plasma lactate levels were measured at 2 hours after 60 minutes of unilateral ischemic injury and compared with values observed in sham-operated controls. Plasma lactate rose from control values of 1.98±0.25 μmol/ml to 2.97±0.31 μmol/ml (P<0.04), which is consistent with postischemic renal lactate efflux. Conversely, only a slight increase in plasma pyruvate levels was observed (control values, 0.57±0.02 μmol/ml; postischemic values, 0.67±0.03 μmol/ml, P<0.03).
Isolated Tubule Experiments
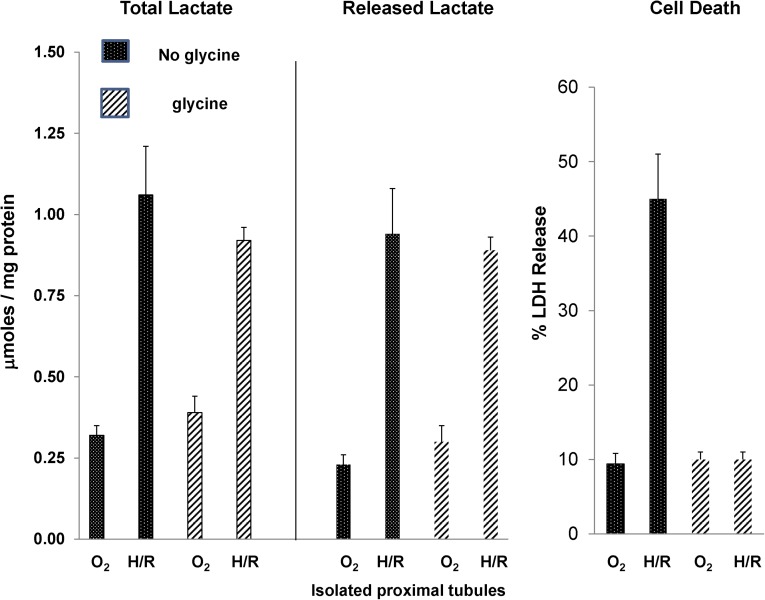
To further explore the issue of postinjury cellular lactate efflux, proximal tubules were isolated from normal mice, and they were subjected to in vitro hypoxia/reoxygenation injury in the presence or absence of 2 mM glycine. Glycine was added to allow hypoxic injury to develop in the absence of cell death.11 As shown in Figure 7, left panel, 15 minutes of hypoxia+15 minutes of reoxygenation caused a fourfold increase in total (cell pellet+media) lactate content, indicative of hypoxia-triggered glycolysis in proximal tubules. As shown in Figure 7, center panel, almost all of this lactate increase was in the cell culture medium, indicating that there was rapid efflux of intracellular lactate into the extracellular space. Finally, this lactate efflux occurred even when lethal cell injury was prevented by glycine (Figure 7, right panel, shows that glycine completely prevented lethal cell injury, which was assessed by cellular LDH release).
Figure 7.
Generation and release of lactate in isolated proximal tubules subjected to hypoxic-reoxygenation (H/R) injury in the presence and absence of glycine. As shown in left panel, 15 minutes of hypoxia and 15 minutes of reoxygenation caused an approximately fourfold increase in total lactate levels (tubule pellet+media lactate content). This lactate generation occurred in the presence or absence of 2 mM glycine, which prevented hypoxic cell death (right panel). Almost all of the generated lactate was found in the tubule culture medium, indicating the rapid release of lactate. Again, it occurred in the presence or absence of lethal membrane injury, given that glycine did not block lactate efflux. These results were obtained with four separate, isolated tubule preparations.
Because alanine (1 mM) within the tubule incubation medium could conceivably be converted to lactate, tubules were subjected to hypoxia/reoxygenation in the presence (1 mM) and absence (0 mM) of alanine. Identical levels of lactate generation were observed (0.81±0.15 versus 0.81±0.2 μmol/mg protein in the presence and absence of alanine; n=3 each). This finding represented an approximately fourfold increase (P<0.003) over continuous oxygenation values (0.19±0.05 and 0.22+0.06 with and without alanine). As above, the presence of glycine blocked hypoxic cell death (inclusive range of 11%–14% LDH release for all oxygenated as well as posthypoxic tubules).
In sum, these isolated tubule experiments confirmed that (1) proximal tubules can generate lactate independent of alanine and (2) intracellular lactate rapidly effluxes from injured cells, entering the extracellular fluid space whether or not lethal cell injury has occurred. This finding undoubtedly accounts for the above-described in vivo result (i.e., that renal ischemia-reperfusion results in lactate efflux into the systemic circulation).
Loss of Pyruvate Because of H2O2 Scavenging
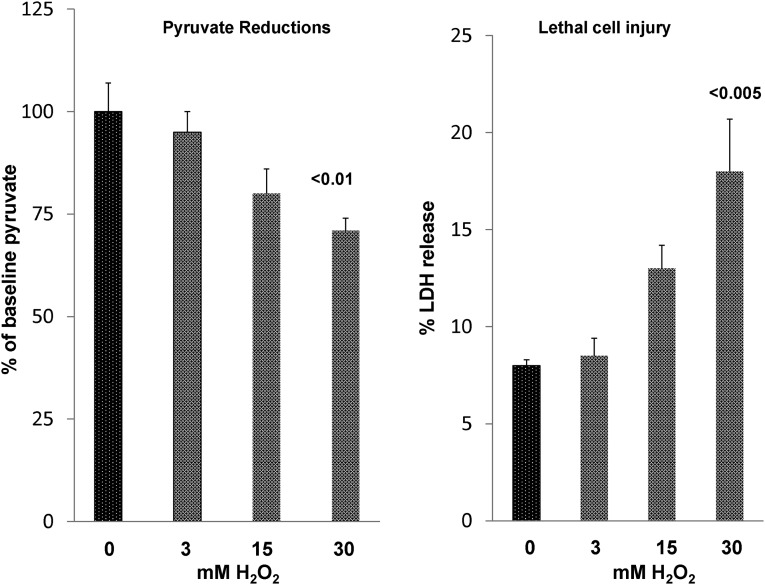
As indicated by Salahudeen et al.,1 H2O2 can be scavenged by pyruvate, leading to its decarboxylation. Thus, to determine whether this reaction occurs in proximal tubules, we incubated isolated tubules with increasing doses of H2O2. As shown in Figure 8, stepwise additions of H2O2 to the isolated tubules induced stepwise reductions in tubule pyruvate levels (reaction 7, Figure 4). Only relatively minor increases in lethal cell injury occurred (maximum increase from 8% baseline to 17% with maximal H2O2 dose), implying that the pyruvate reductions were not simply a manifestation of cell death.
Figure 8.
Pyruvate reductions in isolated proximal tubule segments in response to H2O2 exposure. Increasing doses of H2O2 caused progressive pyruvate reductions. It was associated with small but progressive increases in lethal cell injury, which were assessed by percent LDH release.
Glycerol Model of AKI
Pyruvate/Lactate Levels
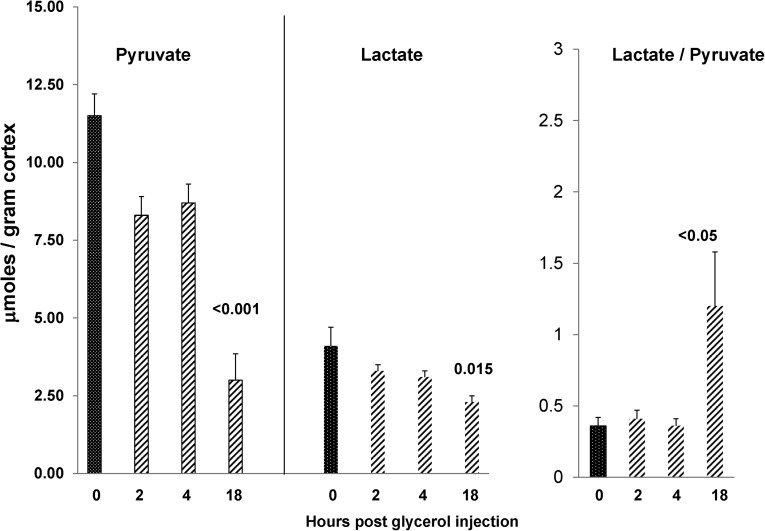
To assess whether a nephrotoxic form of renal injury could recapitulate the results obtained after ischemic renal injury, the glycerol model of rhabdomyolysis-induced AKI was studied. As shown in Figure 9, only small changes in pyruvate or lactate levels were noted in renal cortex at 2 or 4 hours postglycerol injection. However, by 18 hours, a time when significant azotemia was apparent (BUN: 115±19 mg/dl; controls: 20±1 mg/dl), an approximate 75% reduction in pyruvate levels was observed. This finding coincided with lesser, albeit significant (40%) reductions in renal cortical lactate concentrations, leading to a significant increase in lactate/pyruvate ratios.
Figure 9.
Glycerol-induced AKI induces progressive pyruvate depletion. Renal cortical pyruvate levels fell by ∼25% over the first 2–4 hours postglycerol injection. However, by 18 hours, ∼80% pyruvate reductions were observed (n=5–6 at each time point; versus normal kidney values). The late reductions in pyruvate were associated with reductions in tissue lactate concentrations. However, the latter were less marked than those findings of pyruvate, leading to an elevation in lactate/pyruvate ratios.
Glycerol-Mediated Changes in Glucose/Glycogen Content
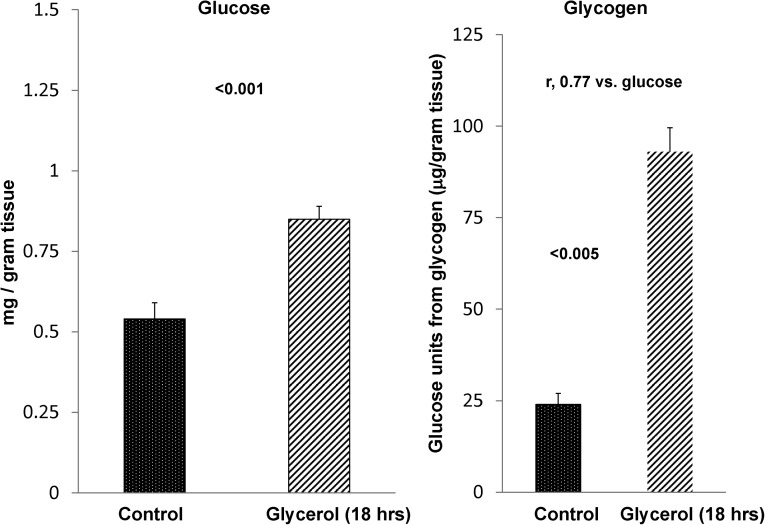
As with postischemic injury, the 18-hour postglycerol-mediated pyruvate reductions were associated with significant increases in renal cortical glucose, with the glucose levels correlating (r=0.77) with approximately fourfold increases in renal cortical glycogen content (Figure 10). These renal cortical glucose/glycogen elevations were observed, despite the fact that glycerol caused a significant lowering of plasma glucose levels (controls, 170±3 mg/dl; glycerol, 132±6 mg/dl, P<0.01).
Figure 10.
AKI induces increases in both renal cortical glucose and glycogen content. By 18 hours postglycerol injection, glucose concentrations were increased by approximately 40%. Although not shown, this finding was despite the fact that glycerol injection caused a significant lowering of plasma glucose levels (controls, 170±3 mg/dl; glycerol, 132±6 mg/dl, P<0.01). The renal glucose elevations were associated with an approximately fourfold increase in renal glycogen content (n=4 each). The r value compares glucose with glycogen content in individual samples.
Pyruvate Loading: Impact on Renal Cortical Glucose Levels
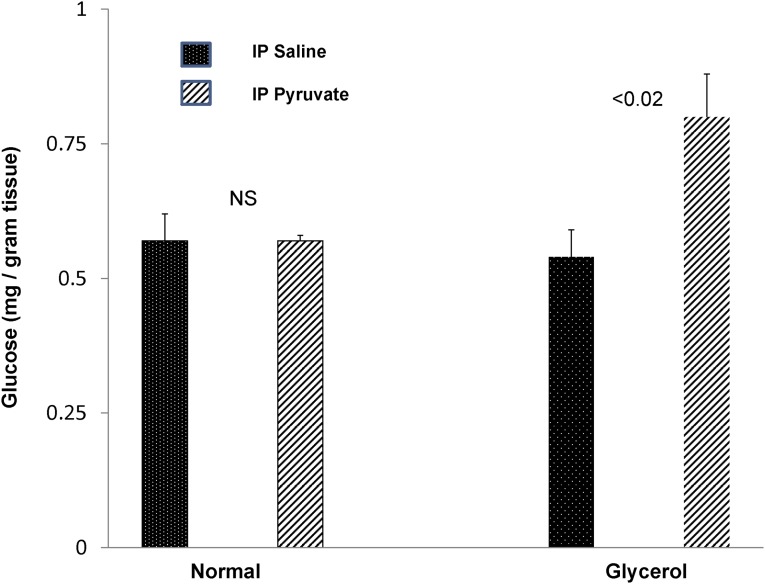
To test whether the acutely injured kidney manifests increased glucose synthesis from pyruvate, exogenous pyruvate was administered to control mice and mice during the first 4 hours of glycerol-induced AKI. As shown in Figure 11, although pyruvate administration failed to raise renal cortical glucose levels in normal mice, it caused an approximately 40% increase in renal cortical glucose content in their glycerol-treated counterparts. Thus, these data are consistent with an AKI-induced enhancement of gluconeogenesis.
Figure 11.
Pyruvate injection causes increased glucose production in the setting of AKI but not in normal kidneys. Injection of 50 mg pyruvate two times over a 4-hour period failed to increase renal cortical glucose levels in normal mice. Conversely, mice subjected to glycerol-induced AKI developed an approximately 60% increase in renal cortical glucose content (n=3 pairs of normal mice; n=6 pairs of glycerol mice). IP, intraperitoneal.
PDH Activity
As with postischemic renal damage, glycerol-induced AKI was associated with a significant decrease (∼33%) in PDH levels (Figure 6, right panel).
Pyruvate Effects on the Evolution and Severity of Glycerol-Induced ARF
To ascertain the impact of pyruvate on the evolution and cellular mediators of glycerol-induced AKI, mice were treated with pyruvate or its saline vehicle, and either 4 or 18 hours later, renal assessments were made.
Four-Hour Assessments
Injury Severity.
As shown in Table 1, pyruvate-mediated protection was observed as early at 4 hours postglycerol injection, which was denoted by a significant reduction in BUN concentrations (51±3 versus 26±2 mg/dl; glycerol versus glycerol+pyruvate; P<0.001) and a 50% blunting of neutrophil gelatinase–associated lipocalin (NGAL) mRNA induction (a cell injury marker).
Table 1.
Pyruvate-mediated protection against glycerol-mediated AKI assessed 4 hours postglycerol injection
| Groups | BUN (mg/dl) | LDH/plasma (units/ml) | NGAL (mRNA) | MCP-1 (mRNA) | IL-10 (mRNA) | HO-1 (mRNA) | H2O2 (μmol/g) | ATP (μmol/g) |
|---|---|---|---|---|---|---|---|---|
| Controls | 22±1 | 2.0±0.3 | 0.002±001 | 0.06±0.03 | 0.58±0.13 | 0.07±0.01 | 2.68±0.23 | 6.8±0.3 |
| Glycerol | 51±3 | 19.4±1.5 | 0.26±0.05 | 1.58±0.22 | 1.3±0.3 | 2.09±0.1 | 1.21±0.25 | 2.4±0.6 |
| Glycerol+pyruvate | 26±2 (<0.001) | 18.9±1.3 (NS) | 0.12±0.03 (<0.03) | 0.40±0.06 (<0.001) | 2.51±0.4 (<0.04) | 2.45±0.1 (<0.02) | 2.28±0.24 (<0.03) | 3.5±0.7 (<0.01)a |
Eighteen mice were injected with glycerol: one half with and one half without pyruvate therapy. Four hours later, plasma and renal cortical samples were obtained, and the values were contrasted with the values seen in six normal mice. Glycerol caused early ARF, which was denoted by BUN elevations. Pyruvate almost completely normalized postglycerol BUN concentrations (P<0.001 compared with glycerol alone; P<0.001), but it did not seem to alter the severity of muscle injury or hemolysis (based on comparable plasma LDH elevations with or without pyruvate therapy). Renal protection with pyruvate was also supported by a marked reduction in NGAL mRNA levels (factored by glyceraldehyde-3-phosphate dehydrogenase; P<0.03). Pyruvate-mediated protection was associated with a marked reduction in the inflammatory marker MCP-1 mRNA and significant increases in the mRNAs for IL-10 and HO-1 (P values given represent comparisons with glycerol treatment alone). Furthermore, pyruvate improved ATP levels. Finally, glycerol induced a paradoxical decrease in renal cortical H2O2 levels, which was largely normalized by pyruvate therapy (P<0.03 versus glycerol alone).
P<0.02 by nonparametric testing.
MCP-1, IL-10, and HO-1 mRNAs.
The above-noted protection at 4 hours postglycerol injection was associated with a decrease in proinflammatory pathways, which was indicated by a pyruvate-induced 75% reduction in MCP-1 mRNA, a doubling of anti-inflammatory IL-10 mRNA, and a significant pyruvate-induced increase in HO-1 mRNA (Table 1).
Plasma LDH.
As a marker of the severity of glycerol-induced muscle necrosis and hemolysis, plasma LDH levels were measured. Ten-fold increases were noted at 4 hours postglycerol injection, but no reduction was seen with pyruvate therapy (Table 1). This finding indicates that the observed renal protection was not caused by decreased glycerol-induced myolysis/hemolysis.
H2O2.
Surprisingly (see Discussion), the glycerol AKI model caused a marked reduction in renal cortical H2O2 levels (P<0.03) (Table 1). This reduction was reversed by pyruvate therapy.
ATP Concentrations.
As an assessment of cellular energetics, renal cortical ATP levels were assessed. As presented in Table 1, glycerol caused an approximate 65% reduction in ATP levels. Pyruvate administration raised these ATP levels by ∼50% versus baseline glycerol levels.
Renal Histology.
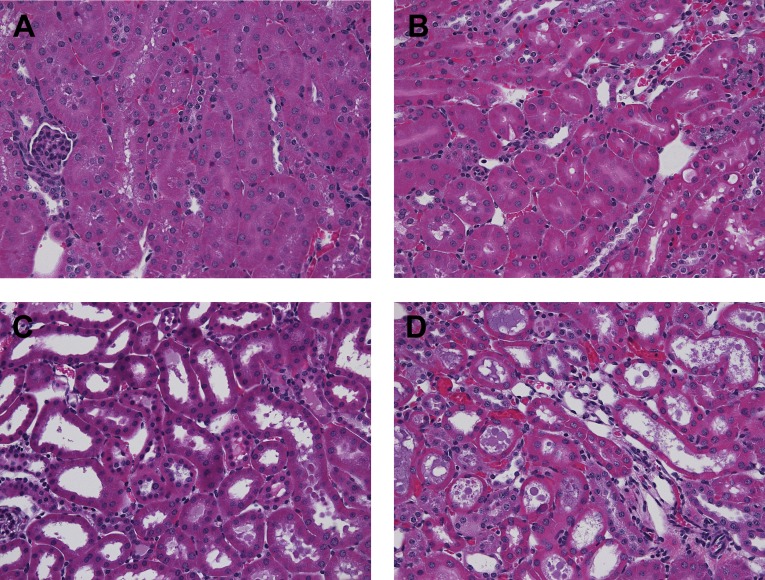
Renal histologic assessments performed at 4 hours postglycerol±pyruvate therapy revealed marked differences between the two groups. Glycerol evoked diffuse proximal tubule brush border membrane blebbing and early tubule necrosis in both renal cortex and the outer medullary stripe (Figure 12). Tubular obstruction, resulting from observed intraluminal debris and casts, was implied by the presence of dilated proximal tubule segments. Pyruvate essentially completely blocked these changes. Although there was mild heme pigment cast deposition, this change did not differ between the glycerol±pyruvate groups.
Figure 12.
Pyruvate preserves renal morphology in the setting of glycerol-induced AKI. Renal histology at 4 hours postglycerol injection±pyruvate treatment. (A and B) Renal cortex and outer medullary stripe, respectively, at 4 hours after glycerol+pyruvate injection showing normal histopathology. (C and D) Cortex and outer medullary stripe, respectively, at 4 hours postglycerol injection without pyruvate. Extensive brush border blebbing and tubule dilatation/early cast formation are apparent.
Eighteen-Hour Assessments
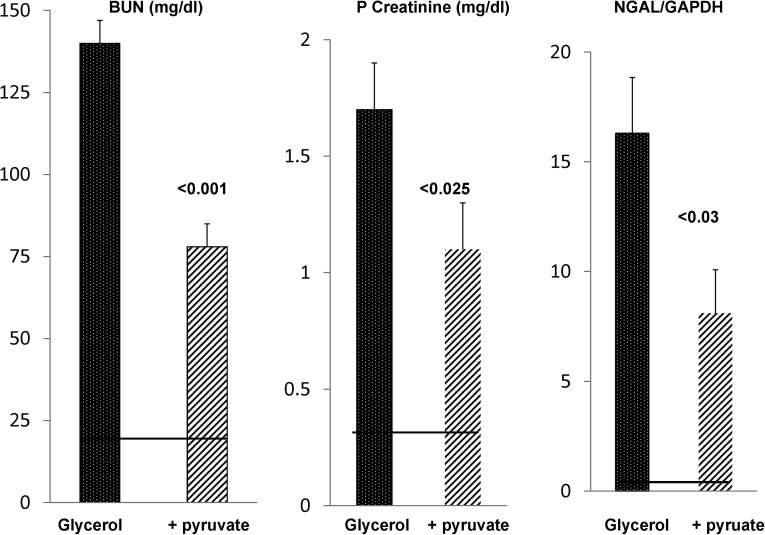
To ascertain the durability of the above-noted protection, BUN, plasma creatinine, and renal cortical NGAL mRNA levels were assessed in glycerol ± pyruvate-treated mice at 18 hours postinjury induction. As shown in Figure 13, a marked diminution of AKI severity was induced by pyruvate therapy, which was assessed by each of these three injury parameters. As with the 4-hour results, the renal protection could not be ascribed to decreased muscle injury/hemolysis given that the 18-hour plasma LDH values were highly comparable between the glycerol±pyruvate treatment groups (controls: 2±1 units; glycerol: 33±1 units; glycerol+pyruvate: 29±1 units).
Figure 13.
Pyruvate confers protection against glycerol-induced AKI. Pyruvate-mediated protection against glycerol-induced AKI as assessed 18 hours postglycerol injection. Glycerol injection caused marked azotemia and marked increases in renal cortical NGAL mRNA levels in normal mice (normal BUN, plasma creatinine, and NGAL levels are depicted by the horizontal lines). Pyruvate therapy of glycerol AKI conferred significant protection, which was determined by significant reductions in each of these three injury parameters. GAPDH, glyceraldehyde-3-phosphate dehydrogenase.
Assessments of Pyruvate Effects on ATP Depletion Renal Injury
To assess whether pyruvate could mitigate ATP depletion injury, mice were subjected to 30 minutes of bilateral renal pedicle occlusion±pyruvate therapy (see Concise Methods). Renal injury was assessed 4 hours later by measuring by BUN concentrations and renal cortical NGAL levels. However, no pyruvate-mediated protection was observed (BUNs: 20±1, 48±4, 47±4 mg/dl; creatinines: 0.35±0.03, 0.52±0.08, 0.48±05 mg/dl; NGAL: 0.01±0.001, 0.25±0.04, 0.19±0.03 mg/dl for normal mice, maleate mice, and maleate+pyruvate mice, respectively; NS, maleate±pyruvate).
We questioned whether the presence of renal artery occlusion prevented pyruvate delivery during the period of ischemia, thus leading to a lack of protective effect. Hence, we tested whether pyruvate might protect against a chemical model of ischemic injury, in which renal blood flow is preserved (i.e., maleate nephrotoxicity).12 Of note, maleate induces profound ATP depletion by depleting CoA, thereby limiting substrate entry into the Krebs cycle. Indeed, in a prior study, we showed the close similarities between renal artery occlusion-induced AKI and maleate-induced AKI.12 As shown in Table 2, pyruvate induced profound protection against maleate-induced AKI, which was assessed at 4 hours postmaleate injection; early increases in BUN and creatinine were essentially prevented, a 13-fold maleate-induced increase in NGAL expression was completely blocked, and both TNF-α and MCP-1 mRNA levels were markedly reduced. Finally, pyruvate caused a doubling of HO-1 mRNA levels. Thus, these changes were consistent with the changes observed with pyruvate therapy of glycerol-induced AKI.
Table 2.
Four hours postmaleate injection±pyruvate therapy
| Groups | BUN | PCr | NGAL mRNA | HO-1 mRNA | MCP-1 mRNA | TNF-α mRNA |
|---|---|---|---|---|---|---|
| Control | 20±1 | 0.4±0.02 | 0.02±0.01 | 0.25±0.02 | 0.07±0.04 | 0.3±0.04 |
| Maleate | 43±3 | 0.76±0.11 | 0.27±0.06 | 1.43±0.41 | 0.79±0.2 | 2.28±0.4 |
| Maleate + pyruvate | 20±3a | 0.45±0.04a | 0.04±0.02a | 2.99±0.2a | 0.12±0.03a | 0.81±0.2 |
Eight mice were injected with Na maleate (600 mg/kg). One half received Na pyruvate therapy. Four hours later, BUN, plasma creatinine (PCr), and renal cortical mRNAs were assessed. Marked protection was observed with pyruvate, which was indicated by markedly reduced or normalized BUN, PCr, and renal cortical NGAL levels. Furthermore, a pyruvate-mediated anti-inflammatory effect was observed (reduced TNF-α and MCP-1 mRNAs and increased HO-1 mRNA).
Statistical comparisons of maleate versus maleate+pyruvate: BUN, P<0.03; PCr, P<0.04; NGAL, P<0.02; HO-1, P<0.001; MCP-1, P<0.03; TNF-α, P<0.02.
Discussion
Despite its pivotal position in both anaerobic and aerobic energy production and recent demonstrations of its antioxidant, anti-inflammatory, and cytoprotective effects,1–9 the impact of AKI on renal pyruvate expression has remained undefined. The results of the present study provide what we believe to be the first insights in this regard, given that both ischemic and nephrotoxic AKI induced profound reductions in pyruvate levels within renal cortex, and importantly, during a time frame in which active tubule injury occurs. Given its previously defined potential to impact diverse injury pathways, it seems likely that AKI-induced pyruvate depletion is not simply a marker of kidney injury but rather, a potential secondary mediator of it. In support of this view are prior observations by Salahudeen et al.1 that pyruvate therapy can mitigate glycerol-induced AKI. As will be discussed, we have confirmed and extended those findings.
Given the above observations, a major focus of the present study was to discern the pathways through which AKI might initiate and then maintain depressed renal cortical pyruvate levels. To this end, we studied each of the major determinants of tissue pyruvate levels: (1) glycolysis, which leads to pyruvate generation; (2) gluconeogenesis, which reduces pyruvate through its conversion to glucose; (3) pyruvate decarboxylation by PDH, leading to acetyl CoA formation; (4) reduced lactate → pyruvate conversion, a process that is dependent on both tissue LDH content and lactate levels; and (5) pyruvate decarboxylation during H2O2 scavenging. Each of these pathways, which are depicted in Figure 4, will be discussed.
Regarding glycolysis, there is a widely held belief that renal proximal tubules have a minimal capacity to undertake anaerobic glucose metabolism because of exceedingly low levels of glycolytic enzymes compared with those levels that exist in distal nephron segments.13–15 Hence, an appealing initial hypothesis that we tested is whether the renal cortex cannot generate pyruvate from glucose; thus, with conversion of the constitutive pyruvate pool to lactate during ischemia, marked pyruvate depletion could develop. However, the results obtained refute this hypothesis given that 60 minutes of ischemia produced >90% renal cortical glucose depletion. Although some of this decline undoubtedly reflected glycolysis in distal nephron segments, it is notable that >70% of renal cortex is comprised of proximal tubules, which contain relatively high glucose levels compared with more distal nephron segments.15 Given these considerations, it seems certain that proximal tubules participated in the ischemia-induced 90% glucose loss through the glycolytic pathway. This result seemingly contradicts the traditional view that proximal tubules have a minimal glycolytic capacity.13–15 However, seminal studies from Gullans et al.16 and Dickman and Mandel17 provide valuable insights in this regard. These studies showed that, when isolated rabbit proximal tubules were maintained under hypoxic (1%) but not anoxic (0%) conditions, substantial glycolysis, resulting in lactate production, occurred.16,7 Expanding on those observations were their findings that proximal tubule glycolysis was only inhibited by site 2 (antimycin A) but not site 1 or 3 respiratory chain blockade.16,17 The fact that lactate was being generated from glucose in those experiments was indicated by the fact that 2-deoxyglucose–mediated blockade of glucose transport suppressed lactate generation.17 Hence, our in vivo results of ischemia-induced glucose depletion, with reciprocal increases in tissue lactate, as well as our isolated proximal tubule results (vide infra) are completely consistent with the findings of Gullans et al.16 and Dickman and Mandel17. Hence, despite its appeal, it seems that decreased glycolysis cannot explain the observed pyruvate depletion that developed during ischemia. Rather, the ischemia-triggered pyruvate reductions almost certainly reflected increased pyruvate conversion to lactate, which was indicated by the ∼15-fold increases in cortical lactate/pyruvate ratios.
Although pyruvate → lactate conversion is likely the dominant mechanism for pyruvate reductions during ischemia, during early reperfusion, lactate should be converted back to pyruvate by LDH. However, two potential reasons exist for reduced lactate → pyruvate conversion during reperfusion, thereby limiting pyruvate replenishment during this period. First, as we have previously reported10 and confirmed in this study, LDH activity is markedly reduced (up to 70%) in response to ischemia-reperfusion, in part because of LDH efflux from renal cortex into urine and the systemic circulation and potentially because of intracellular degradation.10 Hence, if viable tubule cells were to have reduced LDH content, then those cells would be expected to have a reduced capacity for lactate → pyruvate conversion, thereby diminishing reconstitution of pyruvate stores. Indeed, the fact that lactate/pyruvate ratios were elevated by two- to threefold in both postischemic and glycerol-exposed kidneys is consistent with this hypothesis. The second potential early postischemic event potentially limiting early reperfusion pyruvate formation is rapid lactate efflux from injured tubular cells. This finding was evidenced by a prompt increase in plasma lactate levels during reperfusion and the finding that damaged isolated proximal tubules generated large amounts of lactate, which then underwent rapid efflux into the extracellular space. Notably, this cellular lactate loss was not dependent on the presence of lethal cell injury, given that preventing proximal tubule cell death by the addition of glycine did not retard cellular lactate egress. Thus, both cellular lactate loss and diminished LDH activity could potentially diminish early postischemic pyruvate formation.
A third pathway by which AKI might reduce tissue pyruvate levels would be by an enhancement of gluconeogenesis. Of note in this regard is that, unlike glycolysis, it is well accepted that proximal tubules possess substantial gluconeogenic capacity.13–15 To gain insights in this regard, renal cortical glucose levels were assessed in the aftermath of ischemic renal injury. As shown in Figure 5, within 2 hours of vascular reflow, not only had renal cortex recovered from ischemia-induced glucose depletion, but in addition, the glucose levels rose to supranormal values (∼50% greater than values seen in uninjured CL kidneys). Furthermore, these glucose elevations were maintained throughout an 18-hour reperfusion period. Because an increase in renal cortical glucose could reflect increased glycogenolysis18 rather than gluconeogenesis, renal cortical glycogen levels were also assessed, and significant glycogen elevations, not depressions, were observed. Indeed, the tight correlation (r=0.88) between glucose and glycogen levels implies that their elevations were physiologically linked. Finally, an upregulation of gluconeogenesis in the setting of AKI was strongly supported by the observation that intraperitoneal pyruvate administration during the evolution of glycerol-induced AKI caused a prompt increase in renal cortical glucose concentrations, whereas no such increase occurred in normal mouse kidneys. It remains theoretically possible that an increase in postischemic renal cortical glucose levels could arise, at least in part, from increased tubular glucose uptake from the systemic circulation. However, this result seems unlikely for two reasons. First, an AKI-induced decrease in GFR decreases glucose filtration; second, proximal tubule glucose reabsorption is coupled to Na transport.19 Given that Na transport is decreased by AKI, decreased, not increased, glucose uptake should result. Indeed, the frequent occurrence of renal tubular glycosuria in response to AKI19–21 speaks to this point. To our knowledge, the current observation of AKI-initiated glucose and glycogen loading is the first of its kind and strongly suggests that enhanced gluconeogenesis contributes to postischemic pyruvate consumption and hence, suppressed renal cortical pyruvate levels.
As depicted in Figure 4, an additional pathway that could potentially contribute to AKI-induced pyruvate depletion would be pyruvate decarboxylation to acetyl CoA through increased PDH activity. To explore the possibility, we assessed postischemic PDH levels, and ∼50% decreases, not increases, were observed. The reason for these decreases (e.g., proteolysis?) remains unknown. Whatever its cause, a decrease in PDH would presumably help to maintain, rather than depress, pyruvate levels.
Because all of the above results were obtained with the ischemia-reperfusion injury model, it was unclear whether the observed changes are restricted to this particular form of AKI or whether they are more widely expressed. To resolve this issue, the glycerol AKI model was studied, and all of the data obtained with it confirmed the results seen with ischemic-reperfusion injury: (1) glycerol induced profound pyruvate depletion; (2) a correlate was a decrease in tissue lactate and LDH levels (limiting lactate → pyruvate conversion); (3) increased glucose and glycogen loading resulted. Furthermore, as noted above, a preferential increase in gluconeogenesis was observed in glycerol versus normal AKI mice in response to pyruvate injection; and (4) glycerol-mediated renal injury decreased PDH levels. Thus, it seems that pyruvate depletion may be a widely expressed consequence of diverse forms of AKI.
Finally, to test for potential functional significance of pyruvate deficiency to the pathogenesis of AKI, the impact of pyruvate therapy on the initiation and maintenance phase of glycerol-induced ARF was assessed. Within 4 hours of glycerol injection, early pyruvate-mediated protection was observed (prevention of BUN increases, halving of NGAL mRNA levels versus glycerol controls, and prevention of histologic damage). Furthermore, this protection was durable, given that pyruvate therapy led to significant decreases in BUN, plasma creatinine, and renal cortical NGAL mRNA levels at 18 hours postglycerol injection. To assess potential mechanisms for this protection, we tested whether pyruvate therapy suppresses glycerol-mediated renal cortical H2O2 increases (previously reported in ref. 22). Much to our surprise, H2O2 levels were markedly suppressed, not elevated, at 4 hours postglycerol injection, and paradoxically, pyruvate administration normalized these H2O2 depressions. The most likely explanation for this surprising result is that a glycerol-induced reduction in GFR would undoubtedly reduce Na filtration, Na reabsorption, and hence, mitochondrial ATP production/O2 consumption. Thus, with decreased electrons flowing down the electron transport chain to molecular O2, decreased superoxide and hence, decreased superoxide dismutase-mediated H2O2 production would result. Supporting this hypothesis are our additional data (not shown) that renal ischemia-reperfusion injury also suppressed renal cortical H2O2 levels. Thus, given that pyruvate therapy preserved GFR at 4 hours postglycerol injection (gauged by a normalized BUN concentration), it is not surprising that a normalization of H2O2 levels was observed. The reason why others22 have reported increases in H2O2 after glycerol injection (in sharp contrast to our results) remains unknown. Perhaps, the most likely explanation is that these former studies used indirect H2O2 assessments (aminotriazole-mediated catalase inhibition) rather than direct H2O2 measurements as performed here.
Given the marked reduction in H2O2 levels after glycerol injection and that pyruvate normalized them, we needed to test for additional potential avenues for pyruvate-mediated protection. First, given the role of pyruvate in energy production, might its administration improve cellular energetics? Second, might pyruvate decrease renal inflammatory pathways postglycerol injection and thus, lead to cytoprotective effects? The answers to both of these questions seem to be yes. Regarding the first issue, pyruvate therapy mitigated early glycerol-induced ATP declines (Table 1). When these ATP data are viewed in the context of the pyruvate-mediated H2O2 increases, it would seem that pyruvate was, indeed, able to increase mitochondrial electron transport to O2, thereby causing parallel increases in both H2O2 and ATP. Indeed, that pyruvate is known to be actively transported into mitochondria23 suggests its potential to directly or indirectly impact their function. Regarding the second issue, the findings of a marked decrease in MCP-1 mRNA and concomitant increases in the mRNAs for cytoprotective IL-10 and HO-1 support the concept for pyruvate-mediated anti-inflammatory and direct cytoprotective effects.24–27 The fact that pyruvate also induced marked protection against the maleate model of ATP depletion-induced AKI while upregulating HO-1 mRNA and decreasing MCP-1/TNF-α RNAs underscores the broad-ranging renal cytoprotective effects of pyruvate.
Two weaknesses in this study should be noted. First, most of our assessments were performed on whole renal cortex, and thus, we cannot provide cell type-specific data. However, given that the proximal tubule is the primary target of ischemic and toxic AKI and that the proximal tubule is, by far, the most abundant cell type in renal cortex, it seems likely that the observed metabolic changes likely reflected, at least in part, proximal tubule events. Second, although we were able to exclude alanine as a source of hypoxia-driven lactate generation in isolated tubules, we cannot exclude such an event in vivo, because alanine cannot be removed from the systemic circulation. Indeed, in vivo proof of ischemic alanine–lactate conversion would seemingly require in vivo 13C alanine tracer studies. However, even those studies would be difficult to decipher given that extrarenal alanine metabolism (e.g., in the liver as part of the alanine cycle) would generate 13C metabolites that would likely gain renal access and thus, obfuscate data interpretation.
In conclusion, we believe that the present studies provide the following new insights. First, AKI induces profound and persistent renal cortical pyruvate depletion. Second, it occurs in parallel with marked changes in renal cortical glucose metabolism. During ischemia, profound glucose depletion results, consistent with marked glycolysis; conversely, after ischemic or nephrotoxic injury, increased gluconeogenesis (rising renal cortical glucose/glycogen levels) occurs, presumably consuming pyruvate. Third, in response to AKI, lactate rapidly effluxes from proximal tubules, lowering the amount of lactate that might be available for LDH-mediated lactate → pyruvate conversion. The fact that AKI also markedly decreases renal LDH activity could potentially diminish lactate capture and hence, replenishment of the pyruvate pool. Fourth, AKI-mediated reductions in PDH content would be expected to exert a countervailing effect on pyruvate depletion by decreasing its conversion to acetyl CoA. Fifth, glycerol-induced AKI causes a paradoxical reduction in renal H2O2 production, a phenomenon that is reversed by pyruvate. Sixth, pyruvate therapy can mitigate both the functional and histologic severity of AKI through a variety of cytoprotective effects (e.g., improvements in cellular energetics, increases in cytoprotective/anti-inflammatory defenses [e.g., IL-10 and HO-1 gene expression], and decreases in selected proinflammatory pathways [e.g., MCP-1 and TNF-α mRNAs]). Finally, given that pyruvate administration can attenuate AKI, it seems reasonable to postulate that pyruvate depletion as defined by this study is not merely a benign consequence of ischemic or toxic renal injury; rather, it likely plays a significant pathophysiologic role in their development.
Concise Methods
Mouse Experiments
Male CD-1 mice (30–45 g; Charles River Laboratories, Wilmington, MA) housed under routine vivarium conditions were used for all experiments. Free food and water access was provided throughout. Protocols were approved by the institution’s Institutional Animal Care and Use Committee. All surgeries were performed under deep pentobarbital anesthesia (40–50 mg/kg; intraperitoneal injections).
Ischemic Injury Protocols
After induction of anesthesia, mice were subjected to a midline abdominal incision, and the left renal pedicle was occluded for 15–60 minutes with an atraumatic vascular clamp (figures give more specifics/numbers of animals with each protocol). Body temperature was maintained at 36–37°C. Both the clamped kidneys and uninjured right kidneys were resected after either 15, 30, or 60 minutes of ischemia (no reperfusion) or vascular clamp removal and 2 or 18 hours of reflow. The abdominal incisions were closed with either tissue clamps (2-hour reperfusion experiments; anesthesia maintained throughout) or two layers of sutures (18-hour reperfusion experiments) followed by recovery from anesthesia. At the completion of the ischemia or ischemia-reperfusion protocols, the abdominal incisions were opened, a blood sample was obtained from the vena cava, and then, both kidneys were resected. The kidneys were iced, and cortical tissues were collected and extracted for pyruvate, lactate, PDH, glucose, glycogen, H2O2, mRNA, or ATP assessments (see below). Mice subjected to sham surgery or CL uninjured kidneys provided control kidney and blood samples.
Glycerol-Induced AKI Protocol
Mice were lightly anesthetized with isofluorane and then subjected to intramuscular glycerol injection (9 ml/kg 50% glycerol administered in two equally divided injections into the hind limbs). 2, 4, or 18 hours later, the mice were anesthetized with pentobarbital, a blood sample was obtained from the inferior vena cava, and then, the kidneys were resected. Cortical tissues were extracted for pyruvate, lactate, PDH, mRNA, glucose, or glycogen analyses (see below).
Influence of Exogenous Pyruvate Therapy on Renal Gluconeogenesis
Twelve mice were injected with glycerol, and then, one half (n=6 per group) were injected with either Na pyruvate (50 mg in 250 μl saline) or equimolar saline vehicle. Two hours later, the intraperitoneal injections were repeated. At 4 hours postglycerol injection, the mice were killed, and renal cortical samples were extracted for glucose/glycogen concentrations. The results were contrasted with the results seen in 12 normal mice that received either pyruvate (n=6) or an equal amount of vehicle (n=6).
Influence of Exogenous Pyruvate Therapy on the Severity of Glycerol-Induced AKI
Eighteen-Hour Assessments.
Sixteen mice were injected with glycerol as above. At the same time, one half received either an intraperitoneal injection of Na pyruvate as above or an equal volume (250 μl) of saline vehicle. These intraperitoneal injections were repeated 2 hours later. The pyruvate-treated mice or their controls were then given free food and water access. To help maintain pyruvate levels in the pyruvate-treated mice, Na pyruvate (35 mM) was added to the drinking water. The glycerol control mice were given drinking water with 35 mM NaCl. Eighteen hours postglycerol injection, the mice were killed, and the severity of AKI was assessed by measuring terminal BUN, plasma creatinine, and renal cortical NGAL mRNA levels (see below).
Four-Hour Assessments.
To be able to study early injury events, the above experiment was repeated in 18 mice: one half with and one half without pyruvate therapy as above. At 4 hours, the kidneys were removed, and injury severity was assessed by BUN and renal cortical NGAL mRNA levels (creatinine was not measured, because myohemoglobinemia interferes with the creatinine colorimetric assay). As an index of inflammation, cortical MCP-1 mRNA levels were assessed. As indices of anti-inflammatory/cytoprotective influences, the impact of pyruvate therapy on IL-10 and HO-1 mRNAs was determined.28,29 Finally, whole-kidney sections were fixed in 10% formalin, and 2-μm paraffin-embedded sections were cut and stained with hematoxylin/eosin for histologic assessments. Postglycerol results were contrasted between the pyruvate versus no pyruvate groups and against values found in normal mouse samples.
Renal Cortical H2O2 Assessments.
To assess the impact of glycerol and pyruvate therapy on renal cortical H2O2 levels, 12 mice were injected with glycerol: one half with and one half without pyruvate therapy as above. Six normal mice served as controls. At the end of 4 hours, renal cortical tissues were extracted and assayed for H2O2 levels as noted below.
Renal Cortical ATP Assessments.
Ten mice were subjected to glycerol injection: one half with and one half without intraperitoneal pyruvate therapy as noted above. At 4 hours postglycerol injection, the abdomen was opened, the left renal pedicle was transected, and the kidney was dropped into liquid nitrogen (<1 second of ischemia time). Pieces of renal cortex were chipped off the frozen kidney, ground into a fine powder under liquid nitrogen, and then, extracted in phenol. After chloroform, the aqueous phase was assayed for ATP levels (see below). Five normal kidneys provided control ATP concentrations.
Influence of Pyruvate on Ischemic AKI
Ten mice were subjected to 30 minutes of bilateral renal artery occlusion as noted above: one half with and one half without pyruvate therapy. The pyruvate doses were administered subcutaneously in the neck to prevent leakage during and after abdominal surgery. The control mice received subcutaneous saline injection. Four hours postischemia, the mice were killed, and the severity of AKI was assessed by BUN and plasma creatinine concentrations and renal cortical NGAL mRNA levels.28,29
Influence of Pyruvate on Maleate-Induced AKI
Eight mice were subjected to the maleate model of AKI (600 mg Na maleate in 0.5 ml saline; intraperitoneal injection).12 One half of the mice received pyruvate therapy (50 mg in 250 μl saline injected subcutaneously at the time of maleate injection and again at 2 hours later). The remaining maleate-injected mice received vehicle injection. Four hours later, blood samples were assayed for BUN and creatinine determinations. Renal cortical NGAL, HO-1, MCP-1, and TNF-α mRNAs were assessed.28,29
Isolated Proximal Tubule Experiments
Isolated tubules were harvested from normal mice, suspended in experimentation medium (100 mmol/L NaCl, 2.1 mmol/L KCl, 25 mmol/L NaHCO3, 2.4 mmol/LK H2PO4, 1.2 mmol/L MgSO4, 1.2 mmol/L MgCl2, 1.2 mmol/L CaCl2, 5 mmol/L glucose, 1 mmol/L alanine, 4 mmol/L Na lactate, and 10 mmol/L Na butyrate as well as 36 kDa dextran [0.6%]), and gassed with 95% O2/5% CO2 (final pH 7.4) as previously described.30 To assess the impact of hypoxia/reoxygenation on pyruvate/lactate levels, four separate tubule preparations were each split into four aliquots as follows: aliquots 1 and 2: oxygenated incubation×30 minutes (95% O2/5% CO2)±2 mM glycine; aliquots 3 and 4: 15 minutes of hypoxia (95% N2/5% CO2)/15 minutes reoxygenation±2 mM glycine. At the completion of the 30-minute incubations, lethal cell injury was assessed by percent LDH release. The tubule pellets and their corresponding supernatants were assayed for pyruvate and lactate content. (Of note, lactate concentrations are given as the increase over the basal amount of lactate normally present in the incubation medium.)
To assess whether exogenous alanine (1 mM in the tubule buffer) might have led to lactate conversion during hypoxia, three sets of isolated tubules were each split into four aliquots: 1 and 2: 35 minutes of continuous oxygenation with 0 or 1 mM alanine in the media; 3 and 4: 20 minutes hypoxia/15 minutes reoxygenation with 0 or 1 mM alanine in the media. Glycine was added to the incubation media as above. At the completion of the incubations, percent LDH release and lactate concentrations were assessed as noted above.
To determine the impact of H2O2-mediated tubule injury on pyruvate levels, five sets of tubules were divided into four aliquots and incubated×30 minutes with either 0, 3, 15, or 30 mM H2O2. The percent of pyruvate loss (pellet+supernatant) was assessed compared with pyruvate levels found in control incubated aliquots. Lethal injury was assessed by percent LDH release.
Biochemical Analyses
Pyruvate and Lactate Assays
Cortical and plasma pyruvate and lactate were assessed using fluorometric enzymatic assays (K609–100 and K607–100, respectively; BioVision, Milpitas, CA). Cortical samples were dounce-homogenized in 4°C pyruvate or lactate assay buffer (supplied in their respective kits), and cellular debris was removed by centrifugation. To deproteinate the samples, both cortical supernatant and undiluted plasma were passed through 10-kD filters (1997–25; BioVision) followed by assay according to kit protocols.
Glucose Assay
Cortical and plasma glucose was assessed using a colorimetric enzymatic assay (10009582; Caymen, Ann Arbor, MI). Cortical samples were dounce-homogenized in 4°C PBS, and cellular debris was removed by centrifugation. All plasma and cortical homogenates were filtered with a 10-kD filter and then assayed according to kit protocol.
Glycogen Assay
Cortical glycogen was assessed using a fluorometric enzymatic assay (K646–100; BioVision). Cortical samples were dounce-homogenized in 4°C PBS and immediately boiled in vented tubes for 5 minutes to minimize glycogen degradation. Cellular debris was removed by centrifugation, and samples were assayed according to kit protocol.
PDH Assay
Cortical PDH was measured by ELISA (ab110174; Abcam, Cambridge, MA). The protein concentration of dounce-homogenized cortical samples (in 4°C 4× PBS) was quantified and diluted to kit-specific concentration. Using kit reagents, samples were detergent-solubilized and assayed according to kit protocol.
Hydrogen Peroxide Assay
Cortical H2O2 was assessed using a fluorometric enzymatic assay (K265–200; BioVision). Cortical samples were dounce-homogenized in 4°C PBS, and cellular debris was removed by centrifugation. Samples were filtered with a 10-kD filter to deproteinate and assayed according to kit protocol.
NGAL, MCP-1, HO-1, and IL-10 mRNA Levels
Total RNA was extracted using the RNeasy kit (Qiagen, Valencia, CA). Specific mRNAs were measured by RT-PCR and factored by simultaneously obtained glyceraldehyde-3-phosphate dehydrogenase product as previously described.28,29
Renal Cortical ATP Concentrations
Extracted ATP was assayed using a kit from BioVision (K354–100). Values were expressed as micromoles per gram extracted tissue.
Calculations and Statistics
All values are given as means±1 SEM. Statistical comparisons were by unpaired t tests unless stated otherwise. If multiple comparisons were made, the Bonferroni correction was applied.
Disclosures
None.
Acknowledgments
This work was supported by National Institutes of Health Grants DK38432 and DK68520.
Footnotes
Published online ahead of print. Publication date available at www.jasn.org.
References
- 1.Salahudeen AK, Clark EC, Nath KA: Hydrogen peroxide-induced renal injury. A protective role for pyruvate in vitro and in vivo. J Clin Invest 88: 1886–1893, 1991 [DOI] [PMC free article] [PubMed] [Google Scholar]
- 2.Nath KA, Enright H, Nutter L, Fischereder M, Zou JN, Hebbel RP: Effect of pyruvate on oxidant injury to isolated and cellular DNA. Kidney Int 45: 166–176, 1994 [DOI] [PubMed] [Google Scholar]
- 3.Miyaji T, Hu X, Yuen PS, Muramatsu Y, Iyer S, Hewitt SM, Star RA: Ethyl pyruvate decreases sepsis-induced acute renal failure and multiple organ damage in aged mice. Kidney Int 64: 1620–1631, 2003 [DOI] [PubMed] [Google Scholar]
- 4.Ulloa L, Ochani M, Yang H, Tanovic M, Halperin D, Yang R, Czura CJ, Fink MP, Tracey KJ: Ethyl pyruvate prevents lethality in mice with established lethal sepsis and systemic inflammation. Proc Natl Acad Sci USA 99: 12351–12356, 2002 [DOI] [PMC free article] [PubMed] [Google Scholar]
- 5.Sims CA, Wattanasirichaigoon S, Menconi MJ, Ajami AM, Fink MP: Ringer’s ethyl pyruvate solution ameliorates ischemia/reperfusion-induced intestinal mucosal injury in rats. Crit Care Med 29: 1513–1518, 2001 [DOI] [PubMed] [Google Scholar]
- 6.Tawadrous ZS, Delude RL, Fink MP: Resuscitation from hemorrhagic shock with Ringer’s ethyl pyruvate solution improves survival and ameliorates intestinal mucosal hyperpermeability in rats. Shock 17: 473–477, 2002 [DOI] [PubMed] [Google Scholar]
- 7.Yang R, Gallo DJ, Baust JJ, Uchiyama T, Watkins SK, Delude RL, Fink MP: Ethyl pyruvate modulates inflammatory gene expression in mice subjected to hemorrhagic shock. Am J Physiol Gastrointest Liver Physiol 283: G212–G221, 2002 [DOI] [PubMed] [Google Scholar]
- 8.Ryou MG, Flaherty DC, Hoxha B, Gurji H, Sun J, Hodge LM, Olivencia-Yurvati AH, Mallet RT: Pyruvate-enriched cardioplegia suppresses cardiopulmonary bypass-induced myocardial inflammation. Ann Thorac Surg 90: 1529–1535, 2010 [DOI] [PubMed] [Google Scholar]
- 9.Ryou MG, Liu R, Ren M, Sun J, Mallet RT, Yang SH: Pyruvate protects the brain against ischemia-reperfusion injury by activating the erythropoietin signaling pathway. Stroke 43: 1101–1107, 2012 [DOI] [PMC free article] [PubMed] [Google Scholar]
- 10.Zager RA, Johnson AC, Becker K: Renal cortical lactate dehydrogenase: A useful, accurate, quantitative marker of in vivo tubular injury and acute renal failure. PLoS One 8: e66776, 2013 [DOI] [PMC free article] [PubMed] [Google Scholar]
- 11.Weinberg JM, Davis JA, Abarzua M, Rajan T: Cytoprotective effects of glycine and glutathione against hypoxic injury to renal tubules. J Clin Invest 80: 1446–1454, 1987 [DOI] [PMC free article] [PubMed] [Google Scholar]
- 12.Zager RA, Johnson AC, Naito M, Bomsztyk K: Maleate nephrotoxicity: Mechanisms of injury and correlates with ischemic/hypoxic tubular cell death. Am J Physiol Renal Physiol 294: F187–F197, 2008 [DOI] [PubMed] [Google Scholar]
- 13.Bagnasco S, Good D, Balaban R, Burg M: Lactate production in isolated segments of the rat nephron. Am J Physiol 248: F522–F526, 1985 [DOI] [PubMed] [Google Scholar]
- 14.Guder WG, Ross BD: Enzyme distribution along the nephron. Kidney Int 26: 101–111, 1984 [DOI] [PubMed] [Google Scholar]
- 15.Bastin J, Cambon N, Thompson M, Lowry OH, Burch HB: Changes in energy reserves in different segments of the nephron during brief ischemia. Kidney Int 31: 1239–1247, 1987 [DOI] [PubMed] [Google Scholar]
- 16.Gullans SR, Brazy PC, Soltoff SP, Dennis VW, Mandel LJ: Metabolic inhibitors: Effects on metabolism and transport in the proximal tubule. Am J Physiol 243: F133–F140, 1982 [DOI] [PubMed] [Google Scholar]
- 17.Dickman KG, Mandel LJ: Differential effects of respiratory inhibitors on glycolysis in proximal tubules. Am J Physiol 258: F1608–F1615, 1990 [DOI] [PubMed] [Google Scholar]
- 18.Landau BR: Methods for measuring glycogen cycling. Am J Physiol Endocrinol Metab 281: E413–E419, 2001 [DOI] [PubMed] [Google Scholar]
- 19.Schmidt C, Höcherl K, Bucher M: Regulation of renal glucose transporters during severe inflammation. Am J Physiol Renal Physiol 292: F804–F811, 2007 [DOI] [PubMed] [Google Scholar]
- 20.Cronin RE, Bulger RE, Southern P, Henrich WL: Natural history of aminoglycoside nephrotoxicity in the dog. J Lab Clin Med 95: 463–474, 1980 [PubMed] [Google Scholar]
- 21.Vaidya VS, Ramirez V, Ichimura T, Bobadilla NA, Bonventre JV: Urinary kidney injury molecule-1: A sensitive quantitative biomarker for early detection of kidney tubular injury. Am J Physiol Renal Physiol 290: F517–F529, 2006 [DOI] [PubMed] [Google Scholar]
- 22.Guidet B, Shah SV: Enhanced in vivo H2O2 generation by rat kidney in glycerol-induced renal failure. Am J Physiol 257: F440–F445, 1989 [DOI] [PubMed] [Google Scholar]
- 23.Bricker DK, Taylor EB, Schell JC, Orsak T, Boutron A, Chen YC, Cox JE, Cardon CM, Van Vranken JG, Dephoure N, Redin C, Boudina S, Gygi SP, Brivet M, Thummel CS, Rutter J: A mitochondrial pyruvate carrier required for pyruvate uptake in yeast, Drosophila, and humans. Science 337: 96–100, 2012 [DOI] [PMC free article] [PubMed] [Google Scholar]
- 24.Grilli M, Barbieri I, Basudev H, Brusa R, Casati C, Lozza G, Ongini E: Interleukin-10 modulates neuronal threshold of vulnerability to ischaemic damage. Eur J Neurosci 12: 2265–2272, 2000 [DOI] [PubMed] [Google Scholar]
- 25.Boyd ZS, Kriatchko A, Yang J, Agarwal N, Wax MB, Patil RV: Interleukin-10 receptor signaling through STAT-3 regulates the apoptosis of retinal ganglion cells in response to stress. Invest Ophthalmol Vis Sci 44: 5206–5211, 2003 [DOI] [PubMed] [Google Scholar]
- 26.Nath KA, Balla G, Vercellotti GM, Balla J, Jacob HS, Levitt MD, Rosenberg ME: Induction of heme oxygenase is a rapid, protective response in rhabdomyolysis in the rat. J Clin Invest 90: 267–270, 1992 [DOI] [PMC free article] [PubMed] [Google Scholar]
- 27.Nath KA: The role of renal research in demonstrating the protective properties of heme oxygenase-1. Kidney Int 84: 3–6, 2013 [DOI] [PMC free article] [PubMed] [Google Scholar]
- 28.Zager RA, Johnson AC, Becker K: Acute unilateral ischemic renal injury induces progressive renal inflammation, lipid accumulation, histone modification, and “end-stage” kidney disease. Am J Physiol Renal Physiol 301: F1334–F1345, 2011 [DOI] [PMC free article] [PubMed] [Google Scholar]
- 29.Johnson AC, Becker K, Zager RA: Parenteral iron formulations differentially affect MCP-1, HO-1, and NGAL gene expression and renal responses to injury. Am J Physiol Renal Physiol 299: F426–F435, 2010 [DOI] [PMC free article] [PubMed] [Google Scholar]
- 30.Zager RA, Gmur DJ, Bredl CR, Eng MJ: Temperature effects on ischemic and hypoxic renal proximal tubular injury. Lab Invest 64: 766–776, 1991 [PubMed] [Google Scholar]


