

Abstract
BACKGROUND & AIMS
Hepatitis C virus (HCV) predominantly infects hepatocytes, but many hepatocytes are not infected; studies have shown that HCV antigens cluster within the liver. We investigated spatial distribution and determinants of HCV replication in human liver samples.
METHODS
We analyzed liver samples from 4 patients with chronic HCV infection (genotype 1, Metavir scores 0–1) to estimate the proportion of infected hepatocytes and the amount of HCV viral RNA (vRNA) per cell. Single-cell laser capture microdissection was used to capture more than 1000 hepatocytes in grids, to preserve geometric relationships. HCV vRNA and interferon-induced transmembrane protein 3 (IFITM3) messenger RNA (the transcript of an interferon-stimulated gene) were measured in the same hepatocytes by quantitative polymerase chain reaction and assembled in maps to identify areas of high and low HCV replication.
RESULTS
Patients’ serum levels of HCV RNA ranged from 6.87 to 7.40 log10 IU/mL; the proportion of HCV-infected hepatocytes per person ranged from 21% to 45%, and the level of vRNA ranged from 1 to 50 IU/hepatocyte. Infection was not random; we identified clustering of HCV-positive hepatocytes using infected-neighbor analysis (P < .0005) and distance to the kth nearest neighbor compared with random distributions, obtained by bootstrap simulations (P < .02). Hepatocytes that expressed IFITM3 did not appear to cluster and were largely HCV negative.
CONCLUSIONS
We used single-cell laser capture and high-resolution analysis to show that in human liver HCV infects hepatocytes in nonrandom clusters, whereas expression of antiviral molecules is scattered among hepatocytes. These findings show that quantitative single-cell RNA measurements can be used to estimate the abundance of HCV vRNA per infected human hepatocyte and are consistent with cell–cell propagation of infection in the absence of clustered IFITM3.
Keywords: ISG, Intrahepatic Infection, Virology, scLCM
Worldwide, hepatitis C virus (HCV) infects 170 million people, the majority of whom have chronic infection.1–3 HCV predominantly infects hepatocytes, but earlier research has shown that most hepatocytes are un-infected, and HCV antigens appear to cluster grossly.4,5 Clustering of infection is suggestive of a localized mechanism of intrahepatic propagation and control, rather than of a stochastic process, and may have implications for HCV control. Indeed, in vitro models of HCV have shown cell-to-cell spread of infection.6,7 We undertook an intensive study of viral replication in liver tissue from chronic HCV-infected persons, establishing that productive HCV infection of hepatocytes is not random. Moreover, because innate immune activation is highly predictive of treatment outcome in chronic HCV infection, we measured innate immune responses in infected and uninfected hepatocytes. Our objectives were to estimate the amount of HCV viral RNA (vRNA) per infected hepatocyte, to determine mathematically whether clustered infection occurs in vivo, and to identify antiviral molecules that contribute to local HCV control.
Laser-capture microdissection (LCM) is a technology that unites light microscopy with a low-intensity ultraviolet laser to ensnare enriched cellular material from archived tissues. An advantage of LCM is its preservation of positional information that is lost in standard techniques relying on homogenized tissue. We recently reported an optimized technique that permits analysis of RNA from small numbers of human hepatocytes using LCM.8 In the present report, we have further improved the technique to heighten the resolution of the RNA analysis: herein we describe single-cell LCM (scLCM), a novel technique that permits us to study vRNA and host RNA molecules (vRNA and messenger RNA [mRNA], respectively) in small concentrations. The resulting viral landscapes, or viroscapes, of HCV vRNA were superimposed with a candidate interferon-stimulated gene (ISG) and studied using novel analytic tools.
Materials and Methods
Study Population
Liver tissues were obtained from participants in the AIDS Linked to the Intravenous Experience (ALIVE) cohort, a community-based study of the natural history of HCV and human immunodeficiency virus (HIV) infections in an urban intravenous drug users population. Between 1996 and 1998, 210 of 1625 participants were selected randomly from ALIVE to participate in a cross-sectional study designed to determine the severity and correlates of liver disease. Liver biopsy specimens were obtained from participants and stored in a repository for future study (details are provided later).9 Four participants with chronic HCV infection were chosen for intensive study based on their viral genotype, HCV-RNA level, the availability of well-preserved liver tissue, and contemporaneous liver disease fibrosis staging indicative of minimal fibrosis from the same liver biopsy. None of the participants had HIV or hepatitis B virus co-infection, and all were treatment-naive for HCV at the time of the biopsy.
Tissue Preparation and LCM
Liver biopsy specimens were obtained using 16-gauge needles and were divided into 2 pieces at the bedside; 1 piece was immediately snap-frozen in neutral media and stored in a liquid nitrogen repository. The second and larger piece was formalin-fixed, stained with H&E and trichrome, and graded and staged for fibrosis (Metavir) by an experienced hepatopathologist. Tissues that were of poor quality or of inadequate length were excluded before review. Preparation of tissues for LCM have been described earlier.8
scLCM
To appreciate cellular detail, 10-μm sections were used (Figure 1). Hepatocytes were identified morphologically, as has been described previously, by their size, cell membranes, nuclear:cytoplasm ratios, and their dual nuclei; although albumin messenger RNA (mRNA) was not abundant enough at single-cell resolution for confirmation, we previously showed that cells identified by this method show high quantities of albumin mRNA when analyzed in aggregate.8 Although not prespecified, the measured volumes of acquired hepatocytes were found to be in a narrow range (8500–8750 μm3). scLCM was used to separately acquire more than 1000 captures, or 200–300 consecutive hepatocyte equivalents from each tissue (Supplementary Figure 1), depending on the availability of tissue sections with sufficient parenchyma for spatial grids of 10 × 10 adjacent hepatocytes to be evaluated.
Figure 1.

scLCM schematic. Ten-micron sections were made from liver tissue obtained by core biopsy. Because hepatocytes are roughly cuboidal and vary on each side from 20 to 40 μm, scLCM obtained cytoplasm that often was smaller, rather than larger, than that expected from single cells. For HCV-vRNA qPCR, half of the material for each of 2 adjacent hepatocytes was pooled. qPCR for IFITM3 mRNA and 7SL RNA was performed on hepatocytes from single captured cells.
RNA Purification and Quantification
Hepatocytes were collected directly into proprietary lysis buffer that was provided with the Agencourt RNAdvance Tissue kit (no. A32646; Beckman Coulter Beverly, MA); the captured cellular material in lysis buffer was stored at −80°C until further use. RNA from each hepatocyte was extracted separately using paramagnetic beads after addition of an internal control (RNA Amp Check; Abbot part no: 08L51-30; Abbott, Abbott Park, IL) to test polymerase chain reaction (PCR) inhibition and additional lysis buffer; the extraction included DNase treatment. The 18s and 28s ratios were not available to assess the quality and concentration of RNA given the small amount of template material. Superscript III reverse transcriptase (cat. 18080-044; Life Technologies, Carlsbad, CA) was used to synthesize complementary DNA (cDNA). The conditions used for cDNA synthesis were as follows: 25°C for 5 minutes, 50°C for 60 minutes, and 70°C for 15 minutes. The synthesized cDNA was treated with RNase H for 20 minutes at 37°C followed by a hold at 65°C for 20 minutes.
7SL, a small ribosomal-associated RNA that is found abundantly in the cytoplasm, was used to normalize for the amount of captured cytoplasm in each hepatocyte as being representative of the compartment in which HCV vRNA and mRNA principally reside. 7SL was detected and quantified using SsoAdvanced universal SYBR Green supermix (#172-5260, Bio-Rad laboratories Hercules, CA). Quantitative PCR (qPCR) was done on the the synthesized cDNA using primers that were developed based on its published sequence.10 Absolute numbers of 7SL copies per hepatocyte were determined against a cloned 7SL standard and performed in the linear range for RNA isolated from 1 to 200 scLCM-acquired cells (Supplementary Figure 2A; Supplementary Materials and Methods). When quantifying copies from scLCM-captured hepatocytes, 7SL levels consistently were positive across all dissections with few exceptions (Supplementary Figure 3). Hepatocytes with fewer than 1260 copies/cell of 7SL were excluded from the final analysis because this was the prespecified threshold of 5 standard deviations higher than negative control, thereby stringently avoiding false detection of cellular material and excluding cell fragments. Negative controls for cellular material included empty portions of the same slides that did not contain liver tissue: there was a low proportion of 7SL contamination detected (0.05) in empty sections and only slides without any contamination were used in the final analysis. HCV vRNA quantities, therefore, are presented only in the context of a prespecified amount of 7SL that is representative of membrane-delineated hepatocytes.
HCV vRNA was found to be quantified most sensitively using the Abbott RealTime HCV Amplification Reagent Kit (no. 04J86-90; Des Plaines, IL) compared with other platforms, with minor modification to reaction volumes used. HCV transcripts of known copy number were used as standards for the HCV PCR. The transcripts, stored in multiple aliquots with each aliquot being used only once, were quantified using the Optiquant HCV RNA Quantification Panel from Acrometrix Life Tech (no. 942011; Benicia, CA). In addition to validating the linear performance of the HCV-RNA qPCR, the limit of quantification of the HCV-qPCR assays after extraction with liver tissue was tested by adding in known amounts of HCV RNA into HCV-uninfected tissues, extracting, and then quantifying HCV RNA in comparison with the expected values (Supplementary Figure 4). Although sensitive detection was present at less than 1 IU/hepatocyte, this was considered uninterpretable for the chief aims of the study. Hepatocytes with detectable but not quantifiable HCV vRNA values were considered HCV negative and assigned a value of 0.5 IU/hepatocyte along with hepatocytes without detectable HCV vRNA to facilitate calculations. Hepatocytes with quantifiable HCV vRNA values were considered HCV positive and assigned the quantified value. As an additional negative control, nonparenchymal cells from an HCV-infected liver were dissected using the same methods and were not found to contain HCV vRNA (Supplementary Table 1).
After an exhaustive search for detectable ISGs at the single-cell level, mRNA for interferon-induced transmembrane protein 3 (IFITM3), a potent antiviral molecule, was found to be abundant and detectable in single hepatocytes by qPCR using a SYBR Green–based assay (Supplementary Table 2). The limit of quantification of IFITM3 using this qPCR assay was determined from cell culture: primary human hepatocytes were stimulated using Toll-like receptor 3 and retinoic acid-inducible gene 1 agonists to induce IFITM3 transcription, and 200 cells were counted and serially diluted to derive the limit of quantification using qPCR (Supplementary Figure 2B). Based on these results, the limit of IFITM3 mRNA quantification was set at 40 copies/hepatocyte: hepatocytes with undetectable IFITM3 mRNA or with detectable but not quantifiable IFITM3 mRNA were considered IFITM3 negative, and assigned a value of 20 copies/hepatocyte for calculations. Hepatocytes with quantifiable IFITM3 mRNA were considered IFITM3 positive and assigned the quantified value.
qPCR was performed using the LC 480 (Roche Diagnostics, Rotkreuz, Switzerland) in batches to avoid variability. The cycling conditions for pre-amplification involved 10 cycles at 95°C and 60°C. The sample was diluted (1:20) and 2 uL of the diluted sample was subjected to amplification using the following cyclic conditions: 45 cycles of 95°C and 60°C followed by a melt curve as per the manufacturer’s protocol.
HCV vRNA qPCR was optimized for 10 μL of template material; because eluted RNA was limited, and to maximize the number of hepatocytes tested, half of the material for each of 2 adjacent hepatocytes was pooled for HCV RNA qPCR, which still permitted per-hepatocyte estimates of HCV RNA because pooling did not double the concentration of template RNA (Figure 1). qPCR for IFITM3 and 7SL, in contrast, was optimized for 2 μL of template material, permitting direct quantification in single hepatocytes that comprised the complete 10 × 10 grids of hepatocytes. To visualize 10 × 10 grids of hepatocytes, HCV vRNA amounts were divided proportionally between the 2 adjacent hepatocytes to remain unbiased as to the contribution of each of the 2 hepatocytes to the total amount of HCV vRNA for the pair; these individual values were normalized to 7SL amounts for each cell to maintain the proportionality of vRNA to a fixed amount of cellular material, as shown (Figure 1): normalized HCV
Statistical Analysis
Two analytic approaches were used to test for clustering of HCV infection. The infected-neighbor mean field analysis was adapted from the Bragg–Williams approximation used in statistical mechanics to characterize the effect of a uniform field on points in a lattice.11 In the present study, the proportion of cells of interest (HCV positive or IFITM3 positive) that neighbor an index cell was compared with the mean proportion of cells of interest on a given grid; each index cell was considered separately and, as a consequence of the pooled quantification of HCV RNA, spatial analysis of index and target hepatocytes by this method was condensed into 10 × 5 grids. A mixed-effects modeling approach was used that treated subject and grid within subject as random factors to take into account the structure of the data. The null hypothesis, that the index cell is surrounded by the same proportion of cells of interest as the overall mean for the grid, was rejected in favor of the alternate hypothesis that the index cell is surrounded by a higher proportion of cells of interest than the overall mean at a level of 5% significance.
The second approach was based on the distance to the kth-nearest infected neighbor by examining the proximity of HCV-positive hepatocytes to each other (Supplementary Figure 5). On each grid, the Euclidean distance δ of an infected cell to each of the other infected cells on the slide was calculated and the observed distribution of the distance to the kth-nearest infected cell (δk) for each lattice was compared with simulations of 1000 bootstrapped replicates (δksim). This method requires square grids, so 10 × 10 grids of hepatocytes were analyzed; because the kth-nearest infected neighbor method is less dependent on adjacent HCV-positive hepatocytes than on all of the HCV-positive hepatocytes on a grid, it is less prone to the bias of adjacent-pair vRNA measurements than the infected-neighbor mean field analysis.
Logistic regression using a mixed-effects approach, with subject and grid within subject as random factors, was used to test whether the proportions of HCV-positive/IFITM3-positive, HCV-positive/IFITM3-negative, HCV-negative/IFITM3-positive, and HCV-negative/IFITM3-negative hepatocytes were similar or skewed from a random frequency distribution given by the overall proportion of HCV-positive and IFITM3-positive cells considered independently. These mixed-effects models were implemented in the statistical language R (available at: http://www.r-project.org/). Viroscapes were generated using SigmaPlot 10.0 (San Jose, CA) and rgl in R.
Results
Subject Characteristics
Archived liver tissues were obtained from 4 participants with chronic genotype 1 HCV infection in the ALIVE cohort, a long-term study of intravenous drug users. Tissues were selected for intensive single-cell study based on minimal liver disease stage and availability of high-quality liver tissue. The median age of the subgroup was 43.5 years (range, 40–47 y) at the time of the biopsy, 4 of 4 were black, and 3 of 4 were male (Supplementary Table 3). None of the individuals had received treatment for HCV, and none were co-infected with HIV or hepatitis B virus. The plasma HCV viral RNA level of the study group ranged from 6.87 to 7.40 log10 IU/mL.
Single-Cell Laser Capture Microdissection
scLCM was performed on 10 × 10 grids of hepatocytes (Supplementary Figure 1) from each subject, totaling 1002 separate hepatocyte equivalents (hereby referred to as hepatocytes) from all subjects. 7SL, an abundant cytoplasmic RNA, was quantified from all scLCM hepatocytes and compared with the amount obtained from bulk liver that was diluted to the single-cell range but that was not treated with laser capture; the number of cells in bulk liver was quantified using qPCR for ERV3, an endogenous retroviral element with a constant copy number per cell (Supplementary Materials and Methods). scLCM showed negligible RNA loss, and 7SL subsequently was used to standardize qPCR measures (Figure 2). HCV vRNA was measured in each hepatocyte (see Materials and Methods section for details) and normalized to 7SL values for the same hepatocyte; values were similar whether or not they were normalized to 7SL, confirming that scLCM consistently obtained similar amounts of cellular material (Supplementary Figure 3). The HCV vRNA level ranged from 1 to 50 IU/hepatocyte across all subjects’ tissues, which was estimated at 2–94.6 copies/cell (Supplementary Materials and Methods) and did not show appreciable differences between subjects. The majority of cells produced less than 10 IU of vRNA (Figure 3, Supplementary Figure 6). The proportion of hepatocytes with HCV vRNA ranged from 0.21 to 0.45. There were too few subjects to assess the association of the proportion of infected hepatocytes with host factors or plasma HCV-RNA level.
Figure 2.
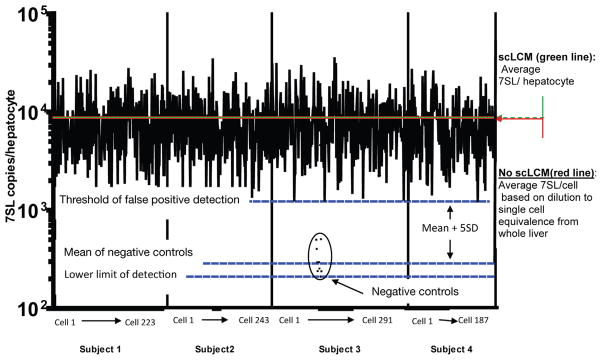
scLCM results in negligible RNA loss. 7SL was quantified by qPCR in each scLCM-isolated hepatocyte against a quantitative standard (mean value is indicated by hashed green line) and was found to be comparable with RNA from single-cell equivalents of homogenized bulk liver tissue that was isolated by the same technique but without exposure to the laser (mean value is indicated by the red line). Single-cell equivalency of bulk liver homogenates was estimated by qPCR measurement of ERV3 DNA (data not shown; Supplementary Materials and Methods). Negative control empty isolations of equivalent volume polyethylene napthalate membrane were derived from the same slides and found to contain low levels of 7SL (black dots). A stringent threshold of 5 standard deviations over the mean negative control amount was set to avoid false quantification of HCV vRNA in cell fragments; of the 1002 hepatocytes that were captured successfully, 58 were excluded from the final analysis because their 7SL quantities were lower than the false-positive detection threshold.
Figure 3.

Histogram of HCV vRNA from all subjects’ scLCM hepatocytes shows a small number of heavily infected hepatocytes. HCV vRNA was quantified separately in individual hepatocytes from 4 subjects using qPCR. The histogram summarizes the accumulated data from all 4 subjects to indicate the numbers of hepatocytes with different amounts of HCV vRNA.
HCV Viroscape
A map of normalized vRNA was assembled to display the microdissected area of hepatocytes, permitting spatial statistical analysis of the viroscape. Each viroscape showed hepatocytes containing narrow HCV replication peaks surrounded by broad regions with minimal or no HCV vRNA that resembled valleys (Figure 4 and Supplementary Figure 7). HCV vRNA containing hepatocytes appeared grossly to cluster, as has been described in previous reports.5
Figure 4.

Simulated representation of the HCV viroscape. HCV vRNA was quantified from subject 1 in a grid of 10 × 5 hepatocyte pairs and normalized to 7SL expression that was quantified in a grid of 10 × 10 hepatocytes dividing the vRNA quantities proportionally; both were performed according to known standards. Viroscapes were assembled to depict spatial coordinates in the x- and y-axes using arbitrary units, and the amount of normalized HCV vRNA is shown in the z-axis. In the top panel (scatter plot) the amount of HCV vRNA is presented in noncontinuous space and is the most accurate view of the viroscapes. The middle (mesh plot) and bottom (heat plot) panels are presented under the assumption of continuous space to facilitate visualization of the viroscape topographies.
To confirm the presence of HCV replication clusters, 2 analytic methods were used. In the first method, the proportion of HCV-positive hepatocytes that were adjacent to each index HCV-positive hepatocyte was compared with the overall frequency of infected hepatocytes on the same grid (infected-neighbor mean field analysis). The null hypothesis, that HCV-positive hepatocytes are surrounded by the same proportion of HCV-positive neighbors that is found on the full grid, was rejected because HCV-positive hepatocytes had a higher proportion of HCV-positive neighbors than was found on the full grid using a linear mixed-effects model (P < .0005). Individually, all subjects had evidence of clustering by this method (Figure 5A). To examine the extent of clustering in greater depth, a second method was used that was based on spatial stochastic processes. In this method the full distribution of neighbors of HCV-positive hepatocytes was assessed, not only first-degree neighbors. The Euclidean distance δ between each infected cell and its kth-nearest infected neighbor was compared with a random distribution of HCV-positive and HCV-negative hepatocytes (in the same proportion as in the original grid) that was simulated by 1000 bootstrap replicates (δk vs δksim; Figure 5B and Supplementary Figure 5). For 7 of 11 grids the difference between the mean δksim and the mean δk increased significantly (P < .02) with k, indicating that k-degree neighbors were observed to be closer than expected in a random distribution, thus strongly supporting clustering of infected hepatocytes.
Figure 5.

HCV-infected hepatocytes are found in clusters. (A) Using the infected-neighbor mean field analysis, each HCV-positive hepatocyte was interrogated separately for the number of neighboring HCV-positive hepatocytes. To be most conservative, 10 × 5 grids of hepatocytes were used for this analysis. Exploiting the maximum abutting surface area that is evident in performing grid dissections, only first-degree neighbors, and not diagonally oriented neighbors, were considered in the analysis. Hence, each HCV-positive hepatocyte could have between 0 and 4 possible HCV-positive hepatocytes. The proportion of observed HCV-positive hepatocytes to possible neighbors was calculated for each HCV-positive hepatocyte and from that measure was subtracted the overall proportion of HCV-positive hepatocytes on the same grid. For each subject, the null hypothesis, that there was no difference between observed HCV-positive neighbors and expected HCV-positive hepatocytes, was rejected in favor of the alternative hypothesis that HCV-positive hepatocytes had higher proportions of HCV-positive neighbors than the observed proportion of HCV-positive hepatocytes on each grid using a one-sample t test at the 95% significance level and is denoted by an individual bracket and P value comparing the subject’s observed distribution with the normalized expected distribution. The line overlying all subjects indicates significantly higher proportions of HCV-positive neighbors than the normalized expected distribution when all values were measured in aggregate and tested using a mixed-effects model with subject and grid within subject as random effects. (B) Comparison of the distance to the kth-nearest infected neighbor between observed and simulated data for each subject and each of the 10 × 10 grids. Simulated distributions for the distance to the kth-nearest infected cell were obtained by distributing the same number of infected cells as observed in the data randomly on a 10 × 10 grid of cells. The average distance to the kth-nearest infected neighbor for the actual data, δk (red solid line), was compared with the average distance obtained from simulated data, δksim (red dashed line) from 1000 replicates, and this was performed for each value of k. Significance was determined using an exact one-sided Wilcoxon signed rank test with a significance level of α = .05. The grey shaded area denotes the frequency of comparisons showing a significant lower value of δk in the data than in the simulations, hence indicating clustering of infected cells.
To understand further the nature of HCV clustering, the amount of vRNA in a given cluster and the breadth of the cluster (ie, the number of HCV-positive hepatocytes that comprised the cluster) were analyzed. The height of the peak of HCV vRNA in a given infected cluster, defined as a continuous block of infected hepatocytes (>1), was correlated with the number of infected hepatocytes that comprised the cluster when examined with a mixed-effects model across all grids (P < .0005; R2 = 0.43; Figure 6), although this relationship was found individually in only 2 of 4 subjects (subject 1: P = .01, R2 = 0.40; subject 3: P = .0001, R2 = 0.85).
Figure 6.

The breadth of HCV-positive clustering is associated with the amount of HCV vRNA. The amount of HCV vRNA in the highest-producing HCV-positive hepatocyte was compared with the total number of contiguous HCV-positive hepatocytes that comprised the same cluster, and the results from all subjects were analyzed using a mixed-effects model (P < .0005; R2 = 0.43).
Hepatocyte Innate Immune Signaling and HCV Clusters
Clustering of HCV-infected hepatocytes could be caused by local propagation of infection or caused by short-range immunologic control. To examine the latter hypothesis, ISGs were measured in the same hepatocytes that were used to generate the viroscapes. A series of relevant ISGs were tested for their abundance at the single-cell level, including IFITM3, ISG15, OASL, DDIT4, DDX60, MOV10, and viperin (Supplementary Table 2). IFITM3, an IFN-λ–induced ISG that has been identified as having direct antiviral effects against HCV in cell culture,12 was the only tested mRNA that was abundant enough to measure in single cells. The proportion of hepatocytes in which IFITM3 mRNA was detected varied from as low as 0.13 to as high as 0.54, and absolute amounts of IFITM3 mRNA ranged from 40 copies/cell (lower limit of detection) to more than 50,000 copies per cell. IFITM3 mRNA detection results were superimposed on the viroscapes (Figure 7, Supplementary Figure 7, and Supplementary Video). Neither the infected-neighbor analysis nor the distance to kth-nearest IFITM3-positive neighbor analysis revealed evidence of clustering of IFITM3-positive hepatocytes when considered across all tissues. Moreover, IFITM3-positive hepatocytes did not appear to cluster near HCV-positive hepatocytes.
Figure 7.

Simulated representation of IFITM3 expression in relation to the corresponding HCV viroscape for a representative grid. To visualize HCV vRNA and IFITM3 mRNA in the same grids, vRNA quantities from 10 × 5 grids were divided proportionally based on the 7SL amount in each hepatocyte to represent 10 × 10 grids of hepatocytes (left panel). IFITM3 was measured singly in the same hepatocytes (right panel).
HCV vRNA and IFITM3 mRNA data were available for each individual hepatocyte, and the numbers of single- and double-positive hepatocytes (HCV-negative/IFITM3-negative, HCV-negative/IFITM3-positive, HCV-positive/IFITM3-negative, and HCV-positive/IFITM3-positive) are shown in aggregate in Supplementary Table 4. Among all hepatocytes, HCV-positive/IFITM3-positive hepatocytes were a small minority of the total (2.7%), whereas HCV-negative/IFITM3-negative hepatocytes were the majority of cells (61%). These proportions did not show a significant association (P = .69) when analyzed by a mixed-effects model with random effects for grid and patient. Surprisingly, the majority of IFITM3-positive hepatocytes were HCV-negative; conversely, the majority of HCV-positive hepatocytes were IFITM3-negative. Taken together, these results suggest that IFITM3 expression is not directed specifically toward or away from infected hepatocytes, in contrast to HCV infection of hepatocytes, which appears to be nonrandom and clustered.
Discussion
In the present study, clusters of HCV-infected hepatocytes were identified in hepatic viroscapes using the scLCM, supporting the role of cell-to-cell propagation of infection. In addition, the spatial association between intrahepatic HCV replication and innate immune signaling was characterized, showing that although ISG expression was sporadic it was not specifically targeted toward or away from HCV-positive hepatocytes. We performed quantitative molecular studies of host and viral RNA in infected tissues at the single-cell level, and provide insights into the interplay of local viral infection and immune response as well as molecular estimates of the burden of HCV in the liver.
In situ molecular characterization of HCV-infected human hepatocytes from the liver was performed by Pal et al4 to identify hepatocytes with HCV vRNA; the above referred authors estimated the median proportion of HCV-infected hepatocytes as 40%. More recently, 2-photon excitation of Q-dot probes was used to detect hepatic HCV antigens and RNA and suggested that 1.7%–21.6% of hepatocytes are infected.5 Estimates of HCV vRNA per cell in earlier reports have been more than 10 copies/cell but have not been measured previously in human liver tissue using highly sensitive and quantitative methods.5,13 These estimates, and our own results of 2–94.6 copies/cell, are considerably lower than the 50–5000 HCV vRNA molecules/cell observed in productive cell cultures of HCV in vitro.14 Similarly, although prior studies have reported a proportion of infected hepatocytes from as low as 1.7% to almost 100%,4,5 we consistently found intermediate proportions of HCV-infected hepatocytes. An important distinction between the current and prior studies is the sensitivity of qPCR, although we set a threshold of infection of 1 IU/cell to avoid false detection in cell fragments. Based on the topology of the viroscape, it is tempting to speculate on how the viroscape determines the circulating HCV RNA in a given patient. The results of this cross-sectional study, however, do not clarify whether the circulating HCV-RNA level is the result of a smaller proportion of infected cells or a lower amount of vRNA per cell. A larger study sampling more hepatocytes from each individual and including individuals with distinct circulating HCV-RNA levels would be required to identify the determinants of the circulating HCV-RNA level adequately.
Clustering of HCV-infected hepatocytes is supportive, although not definitive, evidence of in vivo cell-to-cell propagation of infection, as has been shown in vitro.6,7 In addition, in some subjects there was evidence of an association between the peak of vRNA in a cluster and the number of cells that constitute the cluster, suggesting a dependence of adjacently infected hepatocytes on the robustness of viral replication in the hepatocyte that is most permissive to viral replication. Alternatively, the hepatocyte with the highest vRNA copy number may have been the earliest infected cell of a cluster. These results are consistent with those reported by Liang et al,5 showing clusters of HCV antigens in situ with tapered amounts of double-stranded viral RNA toward the periphery of the clusters. Cell-to-cell propagation could have important implications for vaccine design and for drug development because strategies that rely on inhibiting entry of extra-cellular virions may be insufficient for HCV control if cell-to-cell spread of infection is rampant. There is, however, a gap in understanding of the importance of cell-to-cell propagation because rapid HCV envelope evolution appears to be driven by potent humoral responses.15,16 Along these lines, noncontiguous spread of virus must play a role in intrahepatic HCV propagation, both during acute infection and chronically, because clustering was not uniform. Clustered infection is suggestive, although not conclusive, of short-range control of HCV replication, although we did not find evidence of antiviral molecules encircling HCV-infected hepatocytes. Indeed, the antiviral effect of IFITM3 is related to its role in preventing infecting viruses from escaping the host cell endosome to gain entry into the cytoplasm.17 Scattered ISG expression, rather than directed responses, may contribute to HCV persistence, although further research is required to establish causation. In this context, it is interesting to note that although we looked for a dozen different interferon-stimulated gene products with our technique, we could consistently detect only mRNA for IFITM3. Furthermore, the present study did not focus on resident plasmacytoid dendritic cells although these have been reported to robustly produce interferons in response to adjacent HCV-infected hepatocytes in vitro. Future research will use scLCM to study nonparenchymal hepatic cells and their role in local control of HCV in situ.18,19
The present study involved several challenges. Our measurements of HCV vRNA per hepatocyte are approximations and could include both intracellular and extra-cellular viral RNA, because scLCM does not discriminate between these two possibilities in principle. Given the low amount of HCV vRNA in the majority of HCV-positive hepatocytes, negative-strand detection is likely to be largely unrevealing. At the outset of the study, however, we established strict reporting criteria for HCV vRNA so that results were considered interpretable only if associated with adequate levels of 7SL that were predetermined to represent full hepatocytes. In addition, the estimates of HCV vRNA per hepatocytes are based on the measurement error of qPCR: it is likely that these estimates will be refined with improved technologies. Moreover, because tissues are fixed, the results represent a static view of intrahepatic HCV replication; it is likely that a dynamic view would show that hepatocytes with small amounts of HCV would later increase production of vRNA while other hepatocytes would decrease their production of vRNA. A second challenge was in the detection of ISGs: although a thorough search for abundant ISGs with single-cell resolution yielded only IFITM3, other ISGs such as ISG15, OAS, and Mx may be more representative of the hepatocyte innate response. Previous investigations in which these ISGs were detected used significantly larger amounts of starting material, often relying on bulk liver tissue13,20; therefore, the individual qPCR reactions for ISG15, OAS, and Mx were optimized for thousands of cells. Future studies will focus on comprehensively profiling the innate immune response in the context of the HCV viroscape using more sensitive detection methods for host mRNA. A third challenge was that 4 subjects were chosen for intensive study; hence, generalization of these results will require study of a larger number of samples.
The paradox of increased hepatic ISG expression in persons with chronic HCV who do not respond well to interferon has not been well explained; the inhibition of interferon production by the HCV NS3/4A protease in uncontrolled infection would be expected to result in worse outcomes.20 In that context, it is possible that HCV-negative/IFITM3-positive cells represent hepatocytes that already have cleared HCV vRNA, whereas HCV-positive/IFITM3-negative cells represent cells that will trigger innate immune responses but have not yet. Alternatively, the preponderance of HCV-positive cells that do not express IFITM3 may be evidence of inhibited ISG production by the viral protease. Although these distinctions are not readily de-convoluted with the current technology, chronic HCV infection is the result, by definition, of a failure of immune responses to control acute infection, and this may be why we only found a small proportion of HCV-positive/IFITM3-positive hepatocytes in all studied tissues. Hence, future scLCM studies will be focused on linking intrahepatic viroscapes with clinical observations and outcomes.
In conclusion, by using a multidisciplinary method for studying intrahepatic viral infections at single-cell resolution, we observed clustering of HCV infection; interferon responses in the same hepatocytes, in contrast, failed to show clustering. These results may have important implications in drug and vaccine design. Future studies will focus on expanded viroscapes that include other host genes responsible for the control or enhancement of HCV replication.
Supplementary Material
Acknowledgments
Funding
Supported by National Institutes of Health grants DA 016078 (D.T. and A.B.), AI 081544 (A.B.), and EY 001765 (Wilmer Core Grant). Portions of this work also were performed under the auspices of the US Department of Energy under contract DE-AC52-06NA25396 and supported by National Institutes of Health grants RR 018754 (R.M.R. and A.S.P.), AI 078881, OD 011095, AI 028433, and HL 109334 (A.S.P.). Partial funding also was provided by the European Union and by the Fundação para a Ciência e Tecnologia, Portugal (PCOFUND-GA-2009-246542 to R.M.R.).
Abbreviations used in this paper
- ALIVE
AIDS Linked to Intravenous Experience
- cDNA
complementary DNA
- HCV
hepatitis C virus
- HIV
human immunodeficiency virus
- IFITM3
interferon-induced trans-membrane protein 3
- ISG
interferon-stimulated gene
- LCM
laser-capture microdissection
- mRNA
messenger RNA
- PCR
polymerase chain reaction
- qPCR
quantitative polymerase chain reaction
- scLCM
single-cell laser-capture microdissection
- vRNA
viral RNA
Footnotes
Conflicts of interest
The authors disclose no conflicts.
Note: To access the supplementary material accompanying this article, visit the online version of Gastroenterology at www.gastrojournal.org, and at http://dx.doi.org/10.1053/j.gastro.2013.08.034.
References
- 1.Farci P, Alter HJ, Wong D, et al. A long-term study of hepatitis C virus replication in non-A, non- B hepatitis. N Engl J Med. 1991;325:98–104. doi: 10.1056/NEJM199107113250205. [DOI] [PubMed] [Google Scholar]
- 2.Thomas DL, Strathdee SA, Vlahov D. Long-term prognosis of hepatitis C virus infection. JAMA. 2000;284:2592. [PubMed] [Google Scholar]
- 3.Barrera JM, Bruguera M, Ercilla MG, et al. Persistent hepatitis C viremia after acute self-limiting posttransfusion hepatitis C. Hepatology. 1995;21:639–644. [PubMed] [Google Scholar]
- 4.Pal S, Shuhart MC, Thomassen L, et al. Intrahepatic hepatitis C virus replication correlates with chronic hepatitis C disease severity in vivo. J Virol. 2006;80:2280–2290. doi: 10.1128/JVI.80.5.2280-2290.2006. [DOI] [PMC free article] [PubMed] [Google Scholar]
- 5.Liang Y, Shilagard T, Xiao SY, et al. Visualizing hepatitis C virus infections in human liver by two-photon microscopy. Gastroenterology. 2009;137:1448–1458. doi: 10.1053/j.gastro.2009.07.050. [DOI] [PubMed] [Google Scholar]
- 6.Timpe JM, Stamataki Z, Jennings A, et al. Hepatitis C virus cell-cell transmission in hepatoma cells in the presence of neutralizing antibodies. Hepatology. 2008;47:17–24. doi: 10.1002/hep.21959. [DOI] [PubMed] [Google Scholar]
- 7.Brimacombe CL, Grove J, Meredith LW, et al. Neutralizing antibody-resistant hepatitis C virus cell-to-cell transmission. J Virol. 2011;85:596–605. doi: 10.1128/JVI.01592-10. [DOI] [PMC free article] [PubMed] [Google Scholar]
- 8.Munshaw S, Hwang HS, Torbenson M, et al. Laser captured hepatocytes show association of butyrylcholinesterase gene loss and fibrosis progression in hepatitis C-infected drug users. Hepatology. 2012;56:544–554. doi: 10.1002/hep.25655. [DOI] [PMC free article] [PubMed] [Google Scholar]
- 9.Rai R, Wilson LE, Astemborski J, et al. Severity and correlates of liver disease in hepatitis C virus-infected injection drug users. Hepatology. 2002;35:1247–1255. doi: 10.1053/jhep.2002.33151. [DOI] [PubMed] [Google Scholar]
- 10.Ullu E, Murphy S, Melli M. Human 7SL RNA consists of a 140 nucleotide middle-repetitive sequence inserted in an alu sequence. Cell. 1982;29:195–202. doi: 10.1016/0092-8674(82)90103-9. [DOI] [PubMed] [Google Scholar]
- 11.Dill KA, Bromberg S. Molecular driving forces statistical thermodynamics in chemistry and biology. New York: Garland Science; 2003. [Google Scholar]
- 12.Yao L, Dong H, Zhu H, et al. Identification of the IFITM3 gene as an inhibitor of hepatitis C viral translation in a stable STAT1 cell line. J Viral Hepat. 2011;18:e523–e529. doi: 10.1111/j.1365-2893.2011.01452.x. [DOI] [PMC free article] [PubMed] [Google Scholar]
- 13.Bigger CB, Guerra B, Brasky KM, et al. Intrahepatic gene expression during chronic hepatitis C virus infection in chimpanzees. J Virol. 2004;78:13779–13792. doi: 10.1128/JVI.78.24.13779-13792.2004. [DOI] [PMC free article] [PubMed] [Google Scholar]
- 14.Blight KJ, Kolykhalov AA, Rice CM. Efficient initiation of HCV RNA replication in cell culture. Science. 2000;290:1972–1974. doi: 10.1126/science.290.5498.1972. [DOI] [PubMed] [Google Scholar]
- 15.Dowd KA, Netski DM, Wang XH, et al. Selection pressure from neutralizing antibodies drives sequence evolution during acute infection with hepatitis C virus. Gastroenterology. 2009;136:2377–2386. doi: 10.1053/j.gastro.2009.02.080. [DOI] [PMC free article] [PubMed] [Google Scholar]
- 16.Liu L, Fisher BE, Dowd KA, et al. Acceleration of hepatitis C virus envelope evolution in humans is consistent with progressive humoral immune selection during the transition from acute to chronic infection. J Virol. 2010;84:5067–5077. doi: 10.1128/JVI.02265-09. [DOI] [PMC free article] [PubMed] [Google Scholar]
- 17.Feeley EM, Sims JS, John SP, et al. IFITM3 inhibits influenza A virus infection by preventing cytosolic entry. PLoS Pathog. 2011;7:e1002337. doi: 10.1371/journal.ppat.1002337. [DOI] [PMC free article] [PubMed] [Google Scholar]
- 18.Takahashi K, Asabe S, Wieland S, et al. Plasmacytoid dendritic cells sense hepatitis C virus-infected cells, produce interferon, and inhibit infection. Proc Natl Acad Sci U S A. 2010;107:7431–7436. doi: 10.1073/pnas.1002301107. [DOI] [PMC free article] [PubMed] [Google Scholar]
- 19.Dreux M, Garaigorta U, Boyd B, et al. Short-range exosomal transfer of viral RNA from infected cells to plasmacytoid dendritic cells triggers innate immunity. Cell Host Microbe. 2012;12:558–570. doi: 10.1016/j.chom.2012.08.010. [DOI] [PMC free article] [PubMed] [Google Scholar]
- 20.Sarasin-Filipowicz M, Oakeley EJ, Duong FH, et al. Interferon signaling and treatment outcome in chronic hepatitis C. Proc Natl Acad Sci U S A. 2008;105:7034–7039. doi: 10.1073/pnas.0707882105. [DOI] [PMC free article] [PubMed] [Google Scholar]
Associated Data
This section collects any data citations, data availability statements, or supplementary materials included in this article.