Abstract
Cardiovascular diseases rank as America’s primary killer, claiming the lives of over 41% of more than 2.4 million Americans. One of the main reasons for this high death toll is the severe lack of effective imaging techniques for screening, early detection and localization of an abnormality detected on the electrocardiogram (ECG). The two most widely used imaging techniques in the clinic are CT angiography and echocardiography with limitations in speed of application and reliability, respectively. It has been established that the mechanical and electrical properties of the myocardium change dramatically as a result of ischemia, infarction or arrhythmia; both at their onset and after survival. Despite these findings, no imaging technique currently exists that is routinely used in the clinic and can provide reliable, non-invasive, quantitative mapping of the regional, mechanical and electrical function of the myocardium. Electromechanical Wave Imaging (EWI) is an ultrasound-based technique that utilizes the electromechanical coupling and its associated resulting strain to infer to the underlying electrical function of the myocardium. The methodology of EWI is first described and its fundamental performance is presented. Subsequent in vivo canine and human applications are provided that demonstrate the applicability of Electromechanical Wave Imaging in differentiating between sinus rhythm and induced pacing schemes as well as mapping arrhythmias. Preliminary validation with catheter mapping is also provided and transthoracic electromechanical mapping in all four chambers of the human heart is also presented demonstrating the potential of this novel methodology to noninvasively infer to both the normal and pathological electrical conduction of the heart.
Keywords: Cardiac, Displacement, Echocardiography, Elasticity Imaging, Electromechanical, Ischemia, Myocardial, Radio-Frequency, Stiffness, Strain, Ultrasound, Wave
INTRODUCTION
Heart disease is the primary cause of death of both men and women in the U.S. According to the latest report on Heart Disease and Stroke Statistics (Lloyd-Jones et al., 2009), nearly 2,400 Americans die of cardiovascular disease each day, i.e., two Americans per minute. One of the main reasons for this high number of lives lost is the severe lack of an effective diagnostic imaging technique for early detection and localization of the abnormality when the patient exhibits a symptom or pathological function is detected on the electrocardiogram (ECG). It has been established that the mechanical and electrical properties of the myocardium change dramatically as a result of heart disease, both at its onset and beyond. Despite these findings, no imaging technique currently exists that is routinely used in the clinic and can simultaneously provide reliable, non-invasive, quantitative mapping of the regional, mechanical and electrical function of the myocardium.
Currently, there is no non-invasive electrical conduction mapping techniques of the heart used diagnostically in the clinic. Although non-invasive approaches under development such as electrocardiographic imaging have shown highly detailed three-dimensional images of the electrical activation sequence in humans (Ramanathan et al., 2004; Zhang et al., 2005), imaging cardiac electrophysiology remains a challenging problem. In the clinic, the available methods are catheter-based, costly, and time-consuming. Even though they can provide maps of activation, they also require involved catheterization procedures while being limited to the endocardium or the epicardium. Even in a laboratory setting, mapping the three-dimensional electrical activation sequence of the heart in vivo remains a challenging problem (Nash and Pullan, 2005). While activation of the epicardium (Faris et al., 2003), the endocardium (Schilling et al., 1998), or both (Derakhchan et al., 2001) has been studied in vivo using electrode arrays, studies of the transmural activation are limited to ex vivo applications (Durrer et al., 1970; Sutherland et al., 2008), to small regions of interest in vivo (Ashikaga et al., 2007), or to small animals, e.g. the rabbit (Zhang et al., 2005), or the mouse (Hillman et al., 2007).
Non-pharmacological cardiac treatments, such as catheter ablation and cardiac resynchronization therapy (CRT), have become more popular because antiarrhythmic drugs can be associated with high failure rate, common proarrhythmic actions and toxicity (The Cardiac Arrhythmia Suppression Trial (CAST) Investigators, 1989). As a result, clinicians are in need for accurate, albeit still non-existing, non-invasive and direct measurement and mapping of the cardiac electrical activation sequence. Imaging the electro-mechanics of the heart, i.e., imaging the mechanical response immediately following the heart’s electrical activation, can therefore become a valuable alternative. Studies involving MR Tagging (McVeigh et al., 2002; Faris et al., 2003) or beads (Badke et al. 1980) have reported a linear relationship between electrical and electromechanical activations.
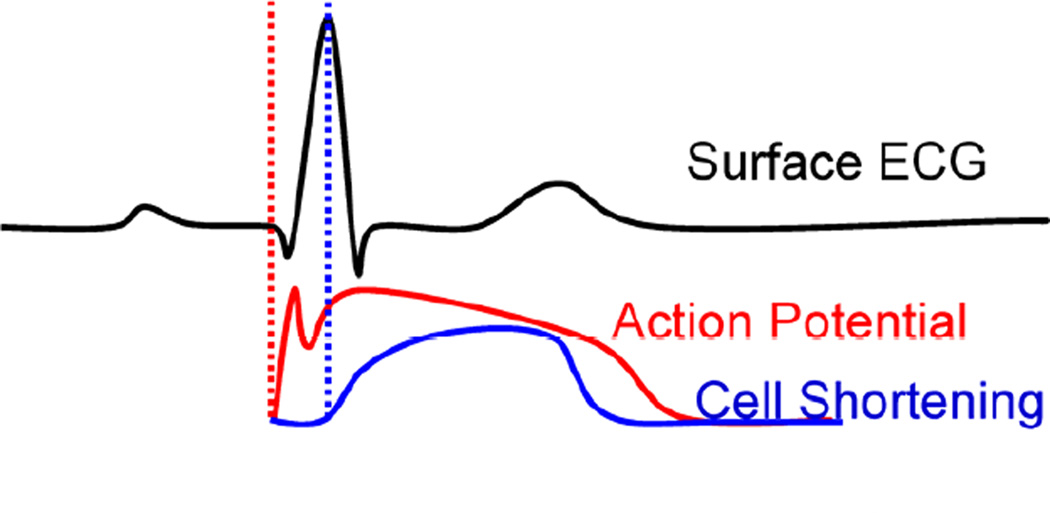
Electromechanical Wave Imaging (EWI) is an entirely non-invasive, non-ionizing, ultrasound-based imaging method capable of mapping the electro-mechanical activation (Fig. 1) sequence of the myocardium along various echocardiographic planes in vivo. EWI (Pernot and Konofagou, 2005; Konofagou et al., 2007, 2010; 2011; Pernot et al., 2007; Provost et al., 2010) is capable of detecting and mapping the electromechanical contraction wave. The direction of propagation of this wave has already been shown to be dependent on the pacing origin in mice and dogs (Provost et al., 2008, 2010), hence suggesting that the EWI technology could be used to assess conduction properties of the myocardium.
Figure 1.
Electromechanical Coupling (adapted from Cordeiro et al. 2004). The first vertical dotted line indicates the onset of electrical activation and the second one the onset of mechanical contraction. The phenomenon of excitation-contraction coupling is shown here on the level of the myocyte and how it is reflected on the ECG, where the electromechanical activation will be delayed by the ‘electromechanical delay’ relative to the onset of the QRS complex.
The heart will not adequately contract unless it is electrically activated via a very specific route. In sinus rhythm (or, natural contraction), the path of activation originates at the sinoatrial (SA) node (right before the ECG’s P-wave), from which the electrical signal in the form of an action potential spreads to both right and left atria causing their contraction (during the P-wave). The wave then propagates to the atrioventricular (AV) node (right after the P-wave), through the Bundle of His and along the left and right bundles on the interventricular septum to the Purkinje fibers finally causing both ventricles to synchronously contract (QRS complex) (Fig. 1). The heart is thus an electromechanical pump that requires to first be electrically activated in order to contract. Propagating electrical waves of excitation result into localized contractions. Each electrical activation in Fig. 1 is followed by an electromechanical one, i.e., the depolarization of a cardiac muscle cell, or, myocyte, is followed by an uptake of calcium, which triggers contraction (Bers, 2002) after a certain electromechanical delay of a few milliseconds (Ashikaga et al., 2007; Cordeiro et al., 2004). In the presence of arrhythmia, electrical and electromechanical patterns are disrupted.
By increasing the frame rate of standard echocardiography by up to twenty-fold, EWI can map the small, transient deformations following similar propagation patterns to the electrical activation, i.e. the Electro-mechanical Wave (EW). The EW is a direct, tissue-level result of the cardiac excitation-contraction coupling (Bers, 2002): the depolarization of a myocyte is followed by an uptake of calcium, which triggers contraction after the electro-mechanical delay. Since the deformations associated with the EW are small (<0.25% inter-frame at 481 fps) and their propagation is fast (0.5–2 m/s), they are not usually detected or mapped with existing imaging modalities in the clinic such as standard echocardiography or MRI. EWI relies on radio-frequency (RF)-based cross-correlation methods, which provide higher accuracy as the frame rate increases. Since the only required equipment to perform EWI is a clinical ultrasound scanner (Wang et al., 2008), the application of EWI can be flexible and with a broad range, as it can be used at the doctor's office, or the point of care, to identify patients at risk, inform on diseases in greater detail, or monitor and follow up therapeutic interventions such as CRT and ablation.
The EW onset in EWI is defined as the time at which the incremental strains, usually obtained by applying a gradient estimator to displacements estimated via RF-based cross-correlation, cross zero following the Q wave of the ECG. This definition can be interpreted as the time at which the heart muscle transitions from a relaxing state (e.g. radial thinning) to active contraction (e.g. radial thickening) and be used to generate isochronal maps of activation in any echocardiographic plane.
The objectives in this paper are to 1) describe the EWI methodology and assess its fundamental performance and 2) apply the optimized methodology in canine and human cases in both the absence and presence of arrhythmias. Validation with electrical mapping as well as EWI in both the atria and ventricles of a normal human subject are also demonstrated.
METHODS
1. The EWI methodologies and sequences
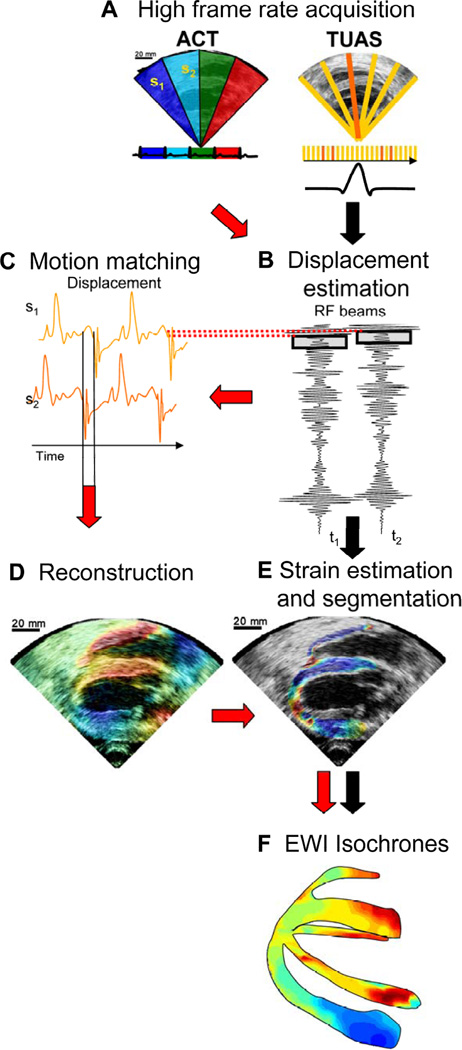
A block diagram of EWI is shown in Fig. 2. Two imaging sequences, the automated composite technique (ACT) (Wang et al., 2008) and the temporally-unequispaced acquisition sequences (TUAS) (Provost et al. 2011d) have been developed and implemented (Provost et al., 2008b, 2009, 2010b, 2011d).
Figure 2.
Block diagram of the EWI technique. (A) High frame-rate acquisition is first performed using either ACT (follow red arrows) or TUAS (black arrows). (B) High precision displacement estimation between two consecutively acquired RF beams (t1, t2) is then performed using very high frame rate RF speckle tracking. (C) In ACT only, a region of the heart muscle, common to two neighboring sectors, is then selected. By comparing the temporally varying displacements measured in neighboring sectors (s1, s2) via a cross-correlation technique, the delay between them is estimated. (D) In ACT only, a full-view ciné-loop of the displacement overlaid onto the B-mode can then be reconstructed with all the sectors in the composite image synchronized. (E) In ACT and TUAS, the heart walls are then segmented, and incremental strains are computed to depict the EW. (F) By tracking the onset of the EW, isochrones of the sequence of activation are generated.
1.1. The ACT method
An Ultrasonix (Ultrasonix, Inc., Burnaby, Canada) RP or MDP system with a 3.3 MHz phased array was used to acquire RF frames from 390 to 520 frames/s (fps) using an automated composite technique (ACT) (Wang et al., 2008). Briefly, to increase the resulting frame rate, the image is divided into partially overlapping sectors corresponding to separate cardiac cycles (Fig. 2A). The axial incremental displacements are obtained with a RF-based cross-correlation method (Fig. 2B) (window size: 4.6 mm, 80% overlap). Briefly, this method consists in dividing every ultrasound beam in a large number of overlapping, one-dimensional, 4.6-mm-long windows. Then, the following process is applied to each window and each sampled time t. A reference window at time t1 is compared with all the windows contained in the same beam at sampled time t2. The axial location of the window providing the highest correlation determines the axial displacement between two consecutive sampled times. After repeating this process for each window and each sampled time, we obtain axial displacements at multiple locations along the ultrasound beam for each sampled time. The full-view image is then reconstructed using the motion-matching technique (Fig. 2C) (Provost et al., 2010b). Briefly, this method consists of comparing, through a cross-correlation method, the incremental displacements measured in the overlapping line of two sectors obtained at different heartbeats to synchronize the sectors. More specifically, the acquisition sequence is designed such that each sector contains at least one ultrasound beam that is also part of the following sector. Therefore, this overlapping beam is expected to result in identical (or highly similar) axial displacements whether they corresponds to heartbeat h that occurred when sector s was acquired or to heartbeat h+1 that occurred when sector s+1 was acquired. By comparing, over time, the displacements obtained in the overlapping beams, the time delay corresponding to the maximum cross-correlation coefficient are obtained to synchronize each set of neighboring sectors. The procedure is repeated for each pair of sectors, allowing the reconstruction of the full-view of the heart, hence ensuring the continuity of the transition incremental displacements across sectors. This method does not rely on the ECG. Therefore, it is especially useful in cases where the ECG may be unavailable or too irregular to perform ECG gating (Provost et al., 2010b). The axial incremental strains were then obtained by calculating the spatial derivative of incremental strains in the axial direction using a least-squares estimator (Kallel and Ophir, 1997) (Fig. 2D). The myocardium was segmented using an automated contour tracking technique (Luo and Konofagou 2008) and displacement and strain maps were then overlaid onto the corresponding B-mode images (Fig. 2E). Isochrones were generated by mapping the first time occurrence at which the incremental strains crossed zero following the Q-wave. More specifically, the absolute value of the incremental strains was minimized in a temporal window following the Q-wave in up to a hundred manually-selected regions. Noisy data were excluded. Subsample resolution was obtained through spline interpolation and Delaunay interpolation was used to construct continuous isochronal maps. Two echocardiographic planes, identical to the planes imaged in the standard apical four- and two-chamber views, were imaged across the long axis of the heart. These two views were temporally co-registered using the ECG signals, spatially co-registered by an echocardiography expert, and displayed in a three-dimensional biplane view in Amira 4.1 (Visage Imaging, Chelmsford, MA) (Figs. 2F,2).
1.2. The TUAS method
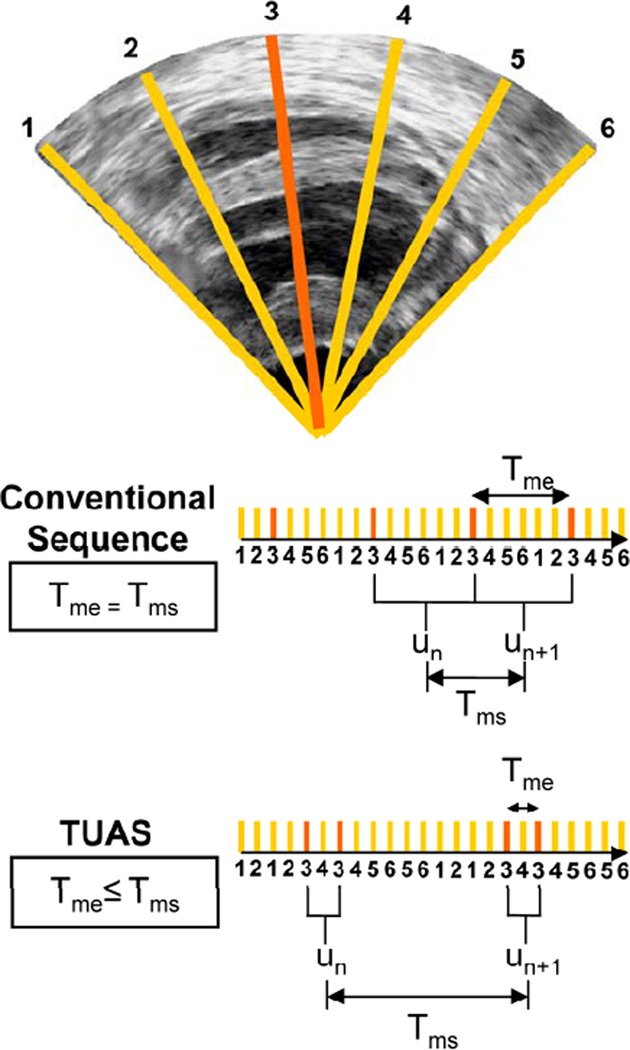
In order to overcome some of the limitations of the ACT method such as the multiple heartbeat gating, an alternative EWI method, the temporally-unequispaced acquisition sequence (TUAS) (Provost, Thiébaut, et al., 2011) that is geared towards optimally estimating cardiac deformations. In TUAS, it is possible to simultaneously achieve a wide range of frame rates for motion estimation, large beam density, and a large field of view in a single heartbeat, thus avoiding the motion-matching and reconstruction steps in the ACT method of EWI (Fig. 2), with little dependence on depth and beam density. Consequently, for a given set of imaging parameters, motion can be estimated at frame rates varying from a few Hz to kHz. The prior knowledge, in this case, is the minimum sampling rate, i.e., the Nyquist rate, of the motion over time at a given pixel. The conventional way to construct an ultrasound image using a phased array is to acquire a finite number of beams, typically 64 or 128, over a 90° angle. These beams are acquired sequentially, and the process is repeated for each frame. For example, a given beam, e.g., beam 3 (Fig. 3), will be acquired at a fixed rate (Fig. 3, conventional sequence). In TUAS, the beam acquisition sequence is reordered to provide two distinct rates, defined as follows (Fig. 3): the motion-estimation rate and the motion-sampling rate. The motion-estimation rate rme is defined as the inverse of the time, i.e., Tme, lapsing between the two RF frames used to estimate motion. The motion-sampling rate rms is defined as the inverse of the time, i.e., Tms, lapsing between two consecutive displacement maps. In conventional imaging sequences, these two rates are equal, because a given frame is typically used for two motion estimations (un and un+1 in Fig. 3). In TUAS, the operator can adjust the motion-estimation rate. As shown in Fig. 3, a frame in the TUAS case is used only once for motion estimation, thus halving the motion-sampling rate relative to the conventional method. For example, an acquisition performed at a 12-cm-depth with 64 beams with a conventional sequence will correspond to a frame rate of 100 Hz. However, while 100 Hz may suffice to satisfy the Nyquist sampling criterion of cardiac motion, it is usually insufficient for accurate motion tracking using RF cross-correlation. Therefore, to reach a higher frame rate of, e.g., 400 Hz typically used for EWI, the conventional sequence requires dividing the number of beams by four, and thus reduces either the beam density, the field of view, or both. At the same depth and beam density, TUAS provides a motion-sampling rate of 50 Hz and a motion-estimation rate that can be varied, as shown in the following section, within the following group: {6416, 3208, 1604, 802, 401, 201, 100} Hz. This has numerous advantages. For example, both the beam density and the field of view can be maintained while estimating the cardiac motion with an optimal frame rate, which could be, e.g., either 401 or 802 Hz, depending on the amplitude of the cardiac motion. This results into halving of the motion-sampling rate; however, the motion-sampling rate has only little effect on the motion estimation accuracy. Theoretically, if this rate remains above the Nyquist rate of the estimated cardiac motion, it will have no effect. We estimated that at a motion-sampling rate above 120 Hz, the effect of the motion-sampling rate became negligible compared to the effect of the motion-estimation rate (Provost, Thiébaut, et al., 2011).
Figure 3.
Illustration of an acquisition sequences in a simple case where only 6 lines form an image with each sector using two lines. In a conventional acquisition sequence, the time separating two acquisitions of the same line is the same. In TUAS, the time separating two acquisitions of the same line are modulated to optimize motion-estimation.
1.3. Optimal EWI strain estimation
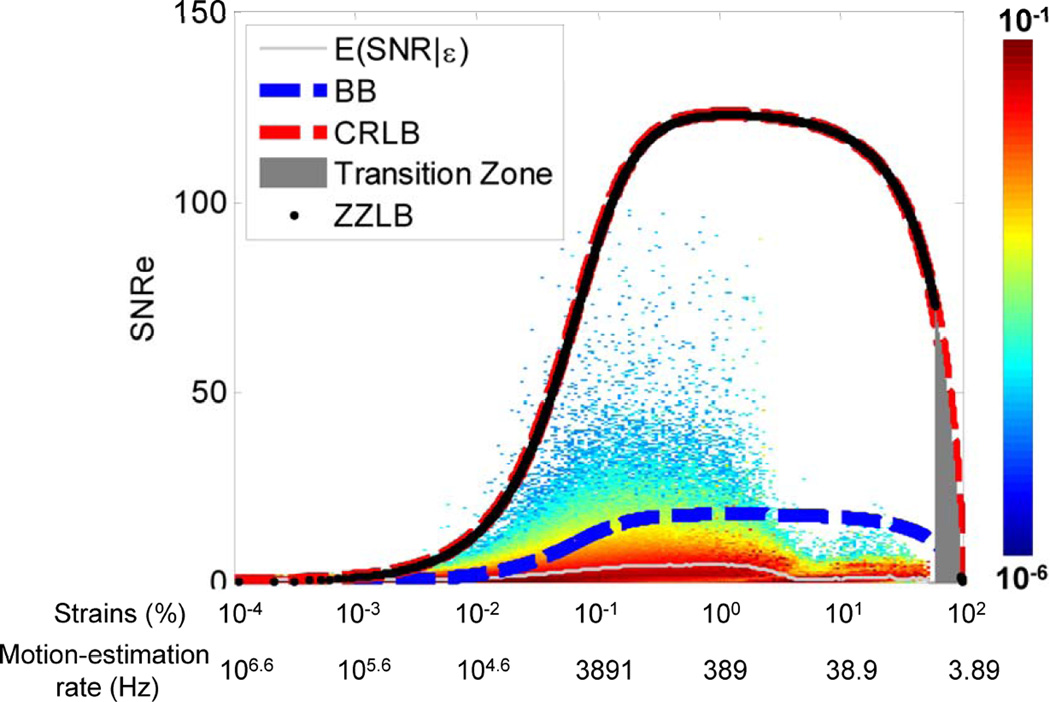
In TUAS, a wide range of frame rates can be achieved, including very high frame rates, independently of other imaging parameters. Therefore, by maintaining a set of imaging parameters (e.g., field of view, imaging depth), and varying the frame rate, it is possible to identify an optimal frame rate by studying the link between the strain signal-to-noise ratio (SNRe) and the EW. Based on previous frameworks reported (Varghese and Ophir 1997), we have developed a new probabilistic framework based on experimental strain estimations acquired in a paced canine in vivo to not only establish an upper bound on the SNRe, but also to estimate the probability of obtaining a given SNRe for a given strain amplitude (Provost, Thiébaut, et al., 2011). Since the motion-estimation rate can be used as a means to translate and narrow the strain distribution, the optimal motion-estimation rate can be found by studying the link between the strains and the SNRe. More specifically, a conditional probability density function spanning a large range of strains values was constructed (Fig. 4) and was found in agreement with the strain-filter theory, which provides a higher bound on the SNRe. The Ziv-Zakai Lower Bound (ZZLB) predicts a sharp transition between the Cramér-Rao Lower Bound (CRLB) and Barankin Bound (BB) when decorrelation becomes important to the point that the phase of the signal does not contain information about motion. Figure 4 shows that the conditional probability density function is comprised within the CRLB up to approximately 4% before it becomes comprised within the BB. A sharp decrease in the expected value of the SNRe is also observed at 4% strain, underlining the importance of using the phase information of the RF signal for accurate strain measurements. A distortion in the strain distribution may indicate that while a high SNRe can be maintained, the accuracy of the strain estimator is strongly impaired at low motion-estimation rates, i.e., less than 350 Hz in this case (Fig 4). Finally, we showed that TUAS is capable of accurately depicting non-periodic events at high temporal resolution. Therefore, the optimal frame rate will need to be between 389 and 3891 Hz according to the strains estimated (Fig. 4).
Figure 4.
Distribution of strains during the EW for different motion-estimation rates. B. Conditional probability density function of the SNRe knowing the strain value (and the corresponding motion-estimation rate). The conditional expectation value of SNRe, the ZZLB, BB and CRLB are also displayed.
1.4. New beam sequence for EWI
According to the previous section, the frame rate plays an important role in the EWI strain estimation. In conventional ultrasound imaging, the frame rate is low (50–100 Hz) so that dynamic focusing (i.e., focusing in multiple depths) and therefore high spatial resolution can be achieved. However, in EWI, the frame rate is more important than the spatial resolution and therefore no or less optimal focusing techniques can be used in order to increase the frame rate up to thousands of frames/s. To achieve this, a new type of transmit beam sequence was used, i.e., the wide beam on a customized Verasonics system (Verasonics, Redmond, WA) that sampled 64 elements at 2 MHz.
A wide beam can be generated by reducing the transmit aperture, i.e., the number of elements used in transmit, and using apodization, i.e., the modulation of the transmit amplitudes of elements. In that case, only a portion of the image is probed in each transmit sequence. This approach is also less prone to artifacts, as shown from its use in clinical systems to generate high quality 3D ultrasound images. Images were formed using a delay-and-sum technique to focus at individual pixels in reception, and multiple single-transmit images were coherently co-registered (Montaldo et al., 2009) whenever necessary to form an entire displacement map. The transmit strategies with wide beams were implemented within a TUAS strategy to account for longer transfer times and the resulting images will be used solely for motion estimation at high frame-rate. The ECG was also acquired simultaneously to co-register the B-mode ultrasound and displacement images.
2. Electromechanical Wave Imaging in canines in vivo
All studies performed were approved by the Institutional Animal Care and Use Committee of Columbia University. A Sonix RP (Ultrasonix, Burnaby, Canada) system using a 3.3 MHz phased array was used to acquire RF frames from 390 to 520 frames/s (fps) using the ACT method (Wang et al., 2008). Normal mongrel dogs were used after being anesthetized with an intravenous injection of Diazepam 0.5–1.0 mg/kg and Methohexital 4–11 mg/kg. The chest was opened by lateral thoracotomy. To minimize motion artifacts, the transducer was attached to a stabilizer (Medtronic Corp., Minneapolis, MN) and the respirator was interrupted for 6 to 20 seconds depending on the acquisition. The EWI strains were estimated using the same technique as described in section 1.1 and Fig. 2.
3. Electrical mapping in canines in vivo
In order to verify the correlation between the electromechanical and electrical activation, electrical mapping using a basket catheter were performed in the left ventricle of an open-chest canine during pacing. A pulmonary vein was canulated with a 9F sheath and guided, using ultrasound, to the left ventricle. A basket catheter was then introduced by aligning a marked spline of the basket catheter (Constellation, Boston Scientific, Natick, MA) along the anterior wall of the left ventricle. This basket catheter contains 64 electrodes that were used to generate 3D endocardial maps of the electrical activation. Four custom-built acquisition boards, each containing 64 channels, were used to measure 57 bipolar electrograms and three ECG leads. The multiplexed outputs of the individual boards were then sampled by a low-cost, USB data acquisition system (USB-6259, National Instruments, Austin, TX) controlled via a LabView interface. Pacing can also be performed from any electrode, thus allowing multiple, simultaneous (up to a 2-ms resolution) pacing sites. A separate, open-source Arduino Mega board (www.arduino.cc) containing a micro-controller was used to transmit pacing stimulus through transmit multiplexers and controlled by a C-based platform. Images in the four-chamber view were acquired using wide beams during pacing from the apical region of the lateral wall.
2) Electromechanical Wave Imaging in humans
In humans, the ACT acquisition sequence and methodson the Ultrasonix MDP system were used and longitudinal (instead of radial) strains were estimated in the four-chamber view to obtain the electromechanical activation in both the atria and ventricles. The least-square estimator kernel size was equal to 5.22 mm. To generate ciné-loops showing electromechanical activation only, the sign of the strains was inverted in the regions showing negative strains (compression) at the onset of the QRS complex. Following this operation, strains larger than −0.025% were not shown. When necessary to obtain a stable image, subjects were asked to hold their breath for up to 18 seconds. The human subject study protocol was approved by the Institutional Review Board of Columbia University, and informed consent was obtained from all human subjects prior to scanning. The EWI 4-chamber isochrone of a 23-year-old male was mapped.
RESULTS
1) Electromechanical Wave Imaging in canines in vivo
1.1 Normal sinus rhythm and pacing cases
During sinus rhythm, the natural pacemaker, the sino-atrial node, located in the right atrium, activates the heart. Action potentials are generated spontaneously from there (at the P-wave) and travel through the atrio-ventricular node, the bundle of His (during the P-R segment) and finally the Purkinje fiber network and the ventricular myocardium (at the QRS complex). Since activation will originate from multiple locations following the Purkinje fiber network, complex activation patterns are expected when imaging the ventricles.
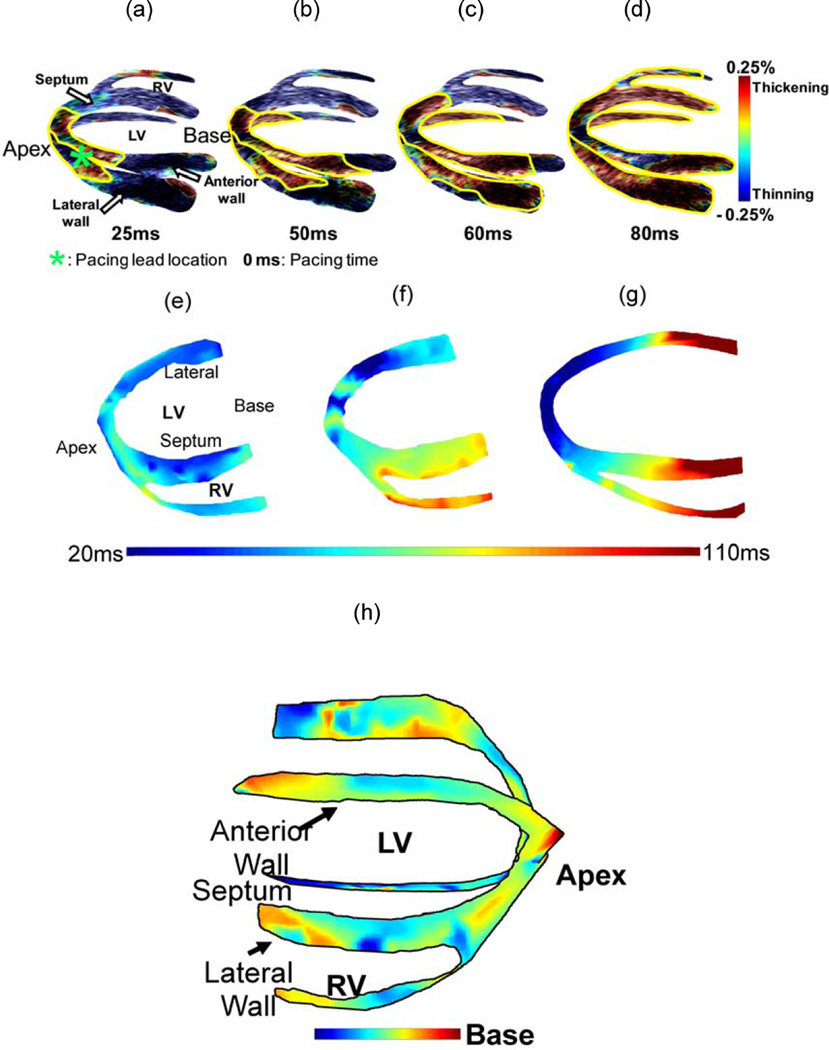
Figure 5 (h) shows the isochrones of the EW propagation in a normal dog during sinus rhythm (Provost et al., 2010). The EW was initiated at the mid-cavity segment in the septal and in the lateral walls, travelling towards the apex and base. In the right-ventricular wall, the EW appeared on the endocardium near the apex a few milliseconds later, and travelled towards the base.
Figure 5.
(a–d) Propagation of the EW (delineated in yellow) during pacing from the apical region of the antero-lateral wall in a normal canine heart. Propagation is initiated at the pacing lead location close to the apex and continues towards the base. Experimental canine heart EWI isochrones during (e) normal sinus rhythm and (f) apical pacing. (g) In the simulation model of apical pacing, the propagation pattern is qualitatively similar. In (e), 0 ms is the onset of the QRS complex, and in (f–g) is equivalent to the pacing stimulus application time; (h) EWI isochrone during sinus rhythm in a canine.
During pacing from the apical region of the anterior-lateral wall, the pattern of propagation of the EW was entirely different (Fig. 5 (a–d)). It was initiated from the pacing site and propagated towards the base. Contrary to sinus rhythm, where multiple, unconnected regions of early activation were observed, the EW originated from a single location.
The EW was also reproduced in the anatomically and biophysically accurate electro-mechanical simulation model (Gurev et al., 2008) during various pacing schemes and its isochrones were shown to be closely correlated with the electrical activation times (Gurev et al., 2009) (Fig.5 (e–g)).
EWI can image the electro-mechanical response of the muscle at high temporal resolution, thereby producing ciné-loops during the EW propagation. An example of such a sequence that corresponds to the isochrones in Fig. 5 (f) is shown in Fig. 5 (a–d).
1.2. Arrhythmic cases
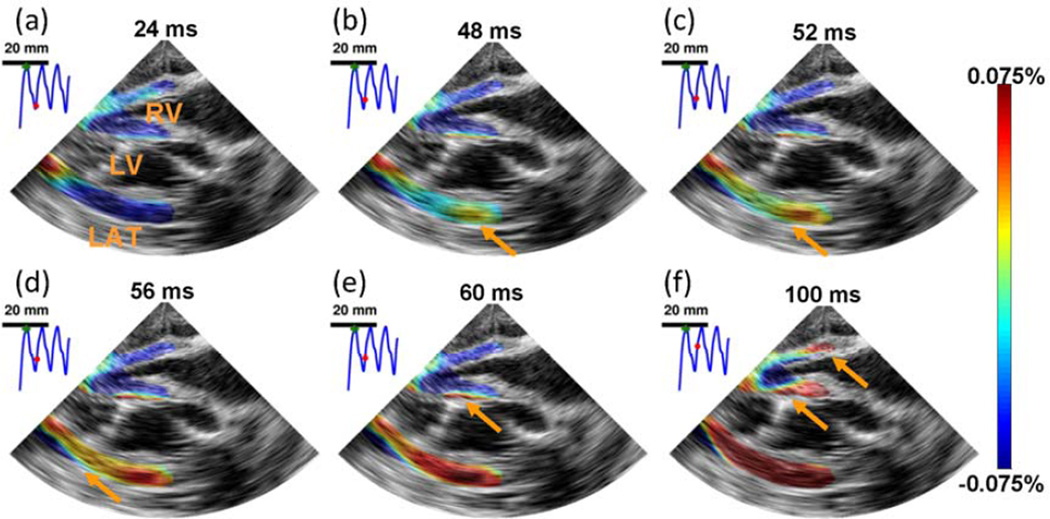
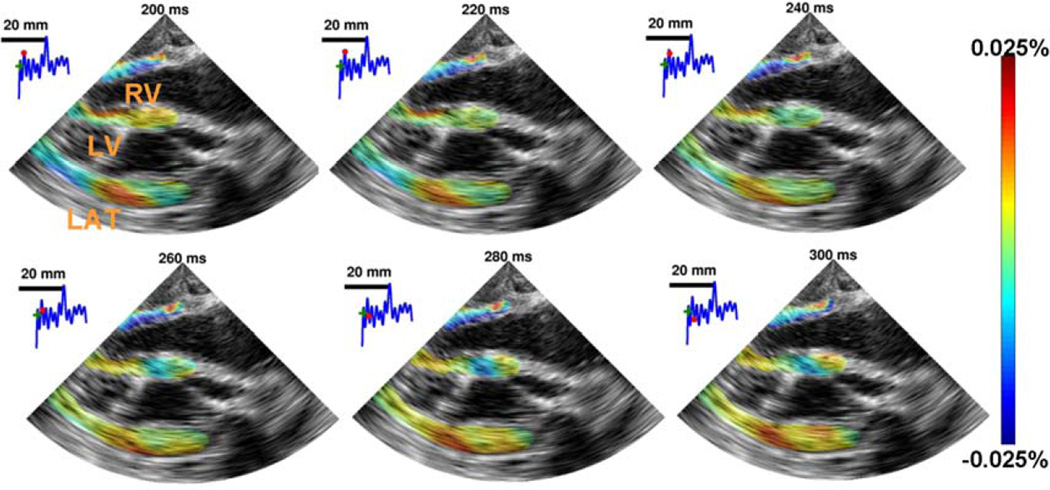
Using the TUAS sequence, single-heart-beat EWI in normal (Fig. 6 (i))) and fibrillating (Fig. 6 (ii)) canine ventricles was achieved, in a full-view and with high beam density. Strain patterns expected during such a scheme were depicted, such as a disorganized contraction, leading to little to no large scale motion of the heart. Regions of the myocardium were oscillating rapidly from thinning to thickening and thickening to thinning over time. Studying the frequencies of these oscillations could be useful in understanding the mechanisms of fibrillation (Chen et al., 2000).
Figure 6.
i) EWI during pacing in the four chamber apical view. RV, LV, and LAT, respectively, denote right ventricle, left ventricle and lateral wall. The Electromechanical Wave was initiated in the right part of the lateral wall (b) and propagated toward the apex, followed by the septum (b–e) and right-ventricular wall (f). 0 ms corresponds to the pacing time.EWI was performed with a 1100 Hz motion-estimation rate and a 137 Hz motion sampling rate. ii) EWI during fibrillation in the four chamber apical view over 100 ms. RV, LV, and LAT, respectively, denote right ventricle, left ventricle and lateral wall. No organized contraction can be observed. EWI was performed with a 2000 Hz motion-estimation rate and a 120 Hz motion sampling rate.
1.3 Validation with electrical mapping
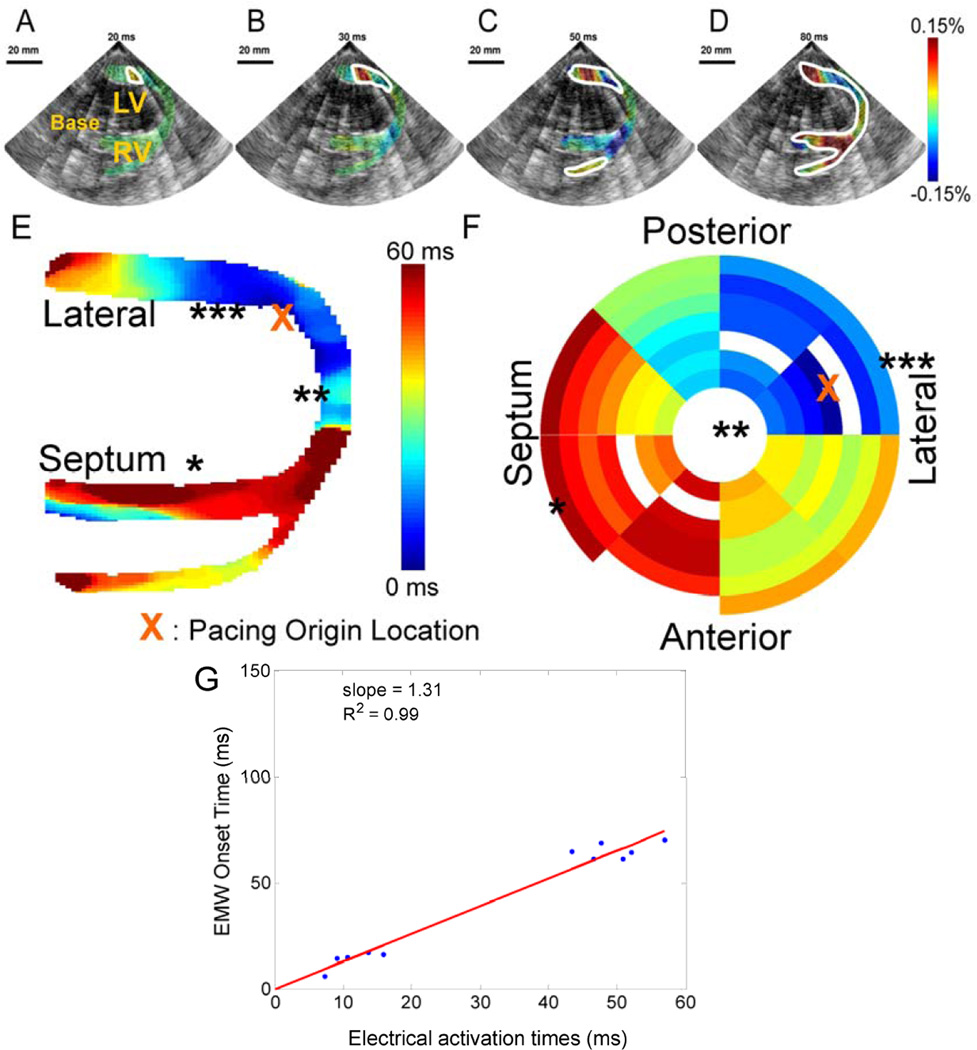
The wide beam sequence was used in the open-chest animal and correlated with the electrical activation sequence obtained by the basket catheter during pacing from the apical region of the lateral wall (Fig. 7). The heart was imaged in the four-chamber view, but with the ultrasound transducer positioned parasternally. In that view, activation results mostly in thickening of the tissue (since the ultrasound beam is aligned with the radial direction of the heart, (Provost et al., 2010)). EWI shows activation (red) originating from the apical region of the lateral wall (Fig. 7A, B), followed by the activation of the right-ventricular wall (Fig. 7C) and finally by the septum (Fig. 7D). The corresponding EWI isochrones reflects this behavior (Fig. 7E). The EW and the electrical activation mapped using the basket catheter (Fig. 7F) were highly correlated (Fig 7G). A slope of 1.31 (R2 = 0.99) was obtained between the electrical activation and the EW onset indicating that the electromechanical sequence is a delayed version of the electrical one with high correlation.
Figure 7.
The EW in a canine during pacing from the apical region of the lateral wall. A. Activation (red) originates from the endocardium and B. propagates both towards the apex (in blue, due to the orientation of the probe) and the base. C. The RV wall is then activated, D. followed by the septum. E. Corresponding EWI isochrones. F. Electrical isochrones, depicting the activation on the 3-D endocardial surface of the heart. The symbols *, ** and *** indicate corresponding regions between E and F. G. Using the electrical activation times measured using the basket catheter, the electrical activation times can be compared to the EW onset time. Since no ECG was acquired during this acquisition, the intercept was fixed to 0 ms.
2) Electromechanical Wave Imaging in humans in vivo
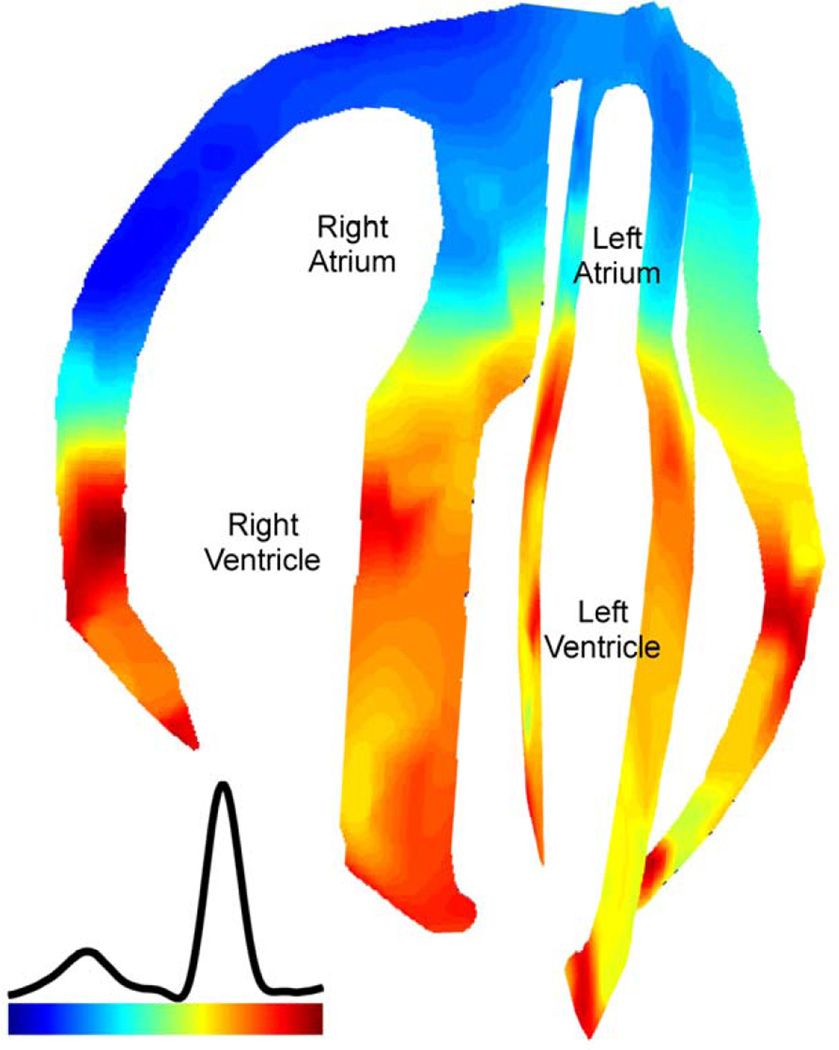
Since a standard clinical echocardiography system (Ultrasonix) was used, EWI is also directly applicable to human subjects. Figure 8 shows the EW isochrone during normal sinus rhythm in a healthy human subject. The EW propagation is initiated at the end of the P-wave at the atria and at the onset of the QRS complex at the mid-level of the interventricular septum. It then appears in the lateral wall, and then in the apical region of right-ventricular wall. Approximately 60 ms after the onset of the QRS complex, both ventricles were activated, with the exception of the basal region of the lateral wall.
Figure 8.
EWI isochrone in all four chambers in a healthy, 23-year-old male subject. Activation in this view corresponds to shortening of the tissue (blue). Activation is initiated in the right atrium and propagates in the left atrium. After the atrio-ventricular delay, activation is initiated in the ventricles from multiple origins, which are possibly correlated with the Purkinje terminals locations. Arrows (both white and black) indicate the direction of propagation.
DISCUSSION
In this paper, we described the EWI methodology and its fundamental performance together with preliminary validation with electrical mapping in vivo and depiction of ventricular fibrillation. Four-chamber EWI in a normal human heart was also shown.
EWI has been shown capable of non-invasively mapping the electrical wave during propagation. A high frame rate (~500–2000 fps) 2D imaging modality was specifically developed in different ultrasound systems and distinct beam sequences so that the transient cardiac motion resulting from the fast EW can be mapped in murine (Konofagou et al., 2010), canine (Pernot and Konofagou, 2005; Provost et al., 2010), and human (Wang et al., 2008) hearts in vivo. This is achieved through ECG gating (Fig. 2), or displacement matching, of small sectors on a clinically used, open-architecture ultrasound system for full view, high frame rate imaging. EWI may thus constitute a unique direct and non-invasive technique for electromechanical mapping that can closely infer to the underlying electrical activation. Electromechanical simulations confirmed the accuracy of the electromechanical isochrones in three pacing schemes and were used to demonstrate the equivalence the electrical isochrones. It is important to note that the EWI technique is fundamentally different from conventional ‘speckle tracking’ methods, i.e. it aims at identifying transient myocardial effects and unveiling the propagation of the resulting EW. Most of the existing, conventional speckle tracking techniques aim at determining the overall systolic and/or diastolic function of the myocardium (i.e. thickening or thinning) and assessing the total myocardial contraction. In those cases, B-mode tracking at relatively low frame rates (<100 fps) may be sufficient, precisely because transient events, such as the electromechanical activation, are not of interest in the conventional use. On the other hand, high precision and high frame rates are a requirement of EWI as was shown in Fig. 4. EWI aims thus at overcoming the current limitations of echocardiography, i.e. lack of depiction of cardiac activation, and going beyond its existing applications in the clinic of merely depicting the mechanical function of the heart.
The EW was compared to electrical activation patterns in the sinus rhythm case, by referring to the intramural electrical activation pathways previously described (Scher and Young, 1956; Durrer et al., 1970; Sengupta et al., 2008) for mammalian ventricles. According to Scher and Young (Scher and Young, 1956), the earliest activity in dogs occurs at the region of the terminations of the left bundle on the mid-left septal endocardium at the mid-basal level, a few milliseconds before the QRS deflection. Activity on the right side of the septum occurs slightly later, again at the Purkinje terminals. During the first quarter of the QRS, most of the endocardial layer of the apical and mid-cavity region of the myocardium is depolarized. The electrical activation then propagates from the endocardium to the epicardium, and towards both the apex and base. At the R-wave peak, only portions of the basal and lateral left-ventricular wall and of the basal septum remain to be activated. Other studies performed later in swine, rats and humans (Sengupta et al., 2008), identified three points of early activation: 1) an area high on the anterior paraseptal wall immediately below the mitral valve, 2) an area at half the distance from apex to base in the left side of the interventricular septum, and 3) the posterior paraseptal area at approximately one third of the distance from apex to base.
Those observations are in agreement with results obtained with EWI in both canines and humans, when considering that a delay of a few milliseconds (20–40 ms in vivo (Ashikaga et al., 2007)) exists between the electrical and mechanical activation of the myocardium. In both canines and humans, the EW was initiated in the mid-cavity segment on the left side of the septum, and from the endocardium of the lateral wall near the base. It was also initiated from the posterior and anterior mid-cavity segments in the two-chamber view. In the right-ventricular wall, the wave was initiated later and traveled towards the base. Moreover, the basal wall regions remained inactivated even 60 ms after the onset of the Q-wave. This is also in agreement with previous reports (Scher and Young, 1956) indicating that at the peak of the R-wave, basal regions are not electrically activated yet. Considering the electromechanical delay, it is then expected that the basal region will not contract before the onset of the isovolumic contraction phase occurs, in the vicinity of the R-wave peak, where the mechanical waves induced by the mitral valve closure do not allow a clear identification of the EW onset.
For the first time, the EW was observed in the normal human atria (Fig. 8) and, although no validation with electrodes was provided in the atria in the current study, followed the expected electrical activation sequence in five human subjects. The earliest activation region was located in the right atrium, where the sinus node is located. Activation propagated in the atria during the P-wave. Following the onset of the QRS complex, activation in the ventricles was observed in multiple regions near the mid-level, in agreement with previous ex vivo studies of the activation sequence in human hearts based on electrography (Durrer et al., 1970). To our knowledge, the normal transmural electrical activation sequence in normal human subjects is not available in the literature. Effectively, the normal electrical activation sequence in humans was obtained initially in isolated hearts (Durrer et al., 1970) or during intraoperative mapping studies under nonphysiological conditions. More recently, the epicardial electrical activation sequence was obtained in the normal human heart under complete physiological conditions (Ramanathan et al., 2006). However, such an approach is limited to the epicardium and thus cannot be used to map the endocardium, the septum, nor across the thickness of the heart walls. EWI might thus constitute an important complementary tool to the ECG to assess the normal electrical activation sequence in normal subjects or establish a baseline for pathological subjects.
Current limitations of the methodology include angle dependence and 2D imaging of a 3D propagation pattern. As a result, several EWI artifacts may result, especially at the level of the apex where the ultrasound beam is almost perpendicular to the direction of the myocardial motion. Those issues are expected to be resolved with the advent of 2D strain imaging (9) and 3D ultrasound RF signal availability at high frame rates. This will allow a full 3D depiction of the electromechanical function of the heart.
As a result, we expect that this technology will allow for the depiction of the electromechanical activation sequences in the heart in human subjects in order to detect disease at its early onset, i.e., ischemia at low coronary occlusion levels or arrhythmia with a single focus, in the ventricles or the atria. The advantages of this technique lie in the fact that it can provide such information regionally and noninvasively and that is currently severely lacking in the clinic. Even though the electromechanical activity in one part of the muscle may affect that of its neighboring regions, we believe that direct association between electrical and electromechanical patterns can be reliably made, especially based on what we have observed in simulations of the electromechanical wave (Provost, Gurev, et al., 2011). The main difference between the two would naturally be the delayed onset (by the electromechanical delay) of the electromechanical relative to the electrical patterns. Another cause for this difference may also be caused by the well-known early mechanical activation sites, e.g., pre-stretch, that occur before any electrical activation at that site. Removal of these after estimation in future studies may lead to a better correlation between the electromechanical and electrical activation, which has been reported to be equal to R2=0.88 (Provost et al. 2011b). Another focus in future studies will be the transmural activation or repolarization that went beyond the scope of this paper due to the lack of validating electrical mapping techniques of this kind of activation but has previously been shown to be feasible with EWI in mice (Konofagou et al. 2010).
ACKNOWLEDGEMENTS
This study was supported in part by the National Institutes of Health (R01EB006042, R21HL096094) and Wallace H. Coulter Foundation. J.P. was funded in part by the Natural Sciences and Engineering Research Council of Canada (NSERC) and by the Fonds Québécois de la Recherchesur la Nature et les Technologies (FQRNT). The authors also wish to thank VlatcheslavGurev, PhD and Natalia Trayanova, PhD, Biomedical Engineering Dept., Johns Hopkins University for the electromechanical simulation model results and Stanley J. Okrasinski, MS, Vu Thanh-Hieu Nguyen, MS, Diego Legrand, BS, Alok Gambhir, MD, PhD, Peter Danilo, PhD, Iryna N. Shlapakova, PhD and Gerard Boink, PhD for their help during the experimental procedures.
Footnotes
This is a PDF file of an unedited manuscript that has been accepted for publication. As a service to our customers we are providing this early version of the manuscript. The manuscript will undergo copyediting, typesetting, and review of the resulting proof before it is published in its final citable form. Please note that during the production process errors may be discovered which could affect the content, and all legal disclaimers that apply to the journal pertain.
REFERENCES
- Aletras AH, Ding S, Balaban RS, Wen H. DENSE: displacement encoding with stimulated echoes in cardiac functional MRI. J. Magn. Reson. 1999;137:247–252. doi: 10.1006/jmre.1998.1676. [DOI] [PMC free article] [PubMed] [Google Scholar]
- Ashikaga H, Coppola BA, Hopenfeld B, Leifer ES, McVeigh ER, Omens JH. Transmural Dispersion of Myofiber Mechanics: Implications for Electrical Heterogeneity In Vivo. Journal of the American College of Cardiology. 2007;49:909–916. doi: 10.1016/j.jacc.2006.07.074. [DOI] [PMC free article] [PubMed] [Google Scholar]
- Badke FR, Boinay P, Covell JW. Effects of ventricular pacing on regional left ventricular performance in the dog. Am J Physiol Heart Circ Physiol. 1980;238:H858–H867. doi: 10.1152/ajpheart.1980.238.6.H858. [DOI] [PubMed] [Google Scholar]
- Bax JJ, Poldermans D, Schuijf JD, Scholte AJHA, Elhendy A, van der Wall EE. Imaging to Differentiate Between Ischemic and Nonischemic Cardiomyopathy. Heart Failure Clinics. 2006;2:205–214. doi: 10.1016/j.hfc.2006.01.003. [DOI] [PubMed] [Google Scholar]
- Bers DM. Cardiac excitation-contraction coupling. Nature. 2002;415:198–205. doi: 10.1038/415198a. [DOI] [PubMed] [Google Scholar]
- Berger T, Fischer G, Pfeifer B, Modre R, Hanser F, Trieb T, Roithinger FX, Stuehlinger M, Pachinger O, Tilg B, et al. Single-Beat Noninvasive Imaging of Cardiac Electrophysiology of Ventricular Pre-Excitation. Journal of the American College of Cardiology. 2006;48:2045–2052. doi: 10.1016/j.jacc.2006.08.019. [DOI] [PubMed] [Google Scholar]
- Costa KD, Hunter PJ, Rogers JM, Guccione JM, Waldman LK, McCulloch AD. A Three-Dimensional Finite Element Method for Large Elastic Deformations of Ventricular Myocardium: I---Cylindrical and Spherical Polar Coordinates. J. Biomech. Eng. 1996;118:452–463. doi: 10.1115/1.2796031. [DOI] [PubMed] [Google Scholar]
- Derakhchan K, Li D, Courtemanche M, Smith B, Brouillette J, Pagé PL, Nattel S. Method for simultaneous epicardial and endocardial mapping of in vivo canine heart: application to atrial conduction properties and arrhythmia mechanisms. J. Cardiovasc. Electrophysiol. 2001;12:548–555. doi: 10.1046/j.1540-8167.2001.00548.x. [DOI] [PubMed] [Google Scholar]
- Durrer D, Van Dam RT, Freud GE, Janse MJ, Meijler FL, Arzbaecher RC. Total Excitation of the Isolated Human Heart. Circulation. 1970;41:899–912. doi: 10.1161/01.cir.41.6.899. [DOI] [PubMed] [Google Scholar]
- Faris OP, Evans FJ, Ennis DB, Helm PA, Taylor JL, Chesnick AS, Guttman MA, Ozturk C, Mcveigh ER. Novel Technique for Cardiac Electromechanical Mapping with Magnetic Resonance Imaging Tagging and an Epicardial Electrode Sock. Ann Biomed Eng. 2003;31:430–440. doi: 10.1114/1.1560618. [DOI] [PMC free article] [PubMed] [Google Scholar]
- Guccione JM, Costa KD, McCulloch AD. Finite element stress analysis of left ventricular mechanics in the beating dog heart. J Biomech. 1995;28:1167–1177. doi: 10.1016/0021-9290(94)00174-3. [DOI] [PubMed] [Google Scholar]
- Gurev V, Constantino J, Trayanova N. Transmural Dyssynchrony of Myofiber Shortening is Determined by Depolarization Sequence within Myocardial Layers. Presented at the AHA Scientific Sessions. 2008:S349–S350. [Google Scholar]
- Gurev V, Lee T, Constantino J, Arevalo H, Trayanova NA. Models of cardiac electromechanics based on individual hearts imaging data : Image-based electromechanical models of the heart. Biomech Model Mechanobiol. 2011;10(3):295–306. doi: 10.1007/s10237-010-0235-5. [DOI] [PMC free article] [PubMed] [Google Scholar]
- Gurev V, Provost J, Konofagou EE, Trayanova N. In silico characterization of ventricular activation pattern by electromechanical wave imaging. Supplement to Heart Rhythm. 2009;6:S357. [Google Scholar]
- Hillman EMC, Bernus O, Pease E, Bouchard MB, Pertsov A. Depth-resolved optical imaging of transmural electrical propagation in perfused heart. Opt Express. 2007;15:17827–17841. doi: 10.1364/oe.15.017827. [DOI] [PMC free article] [PubMed] [Google Scholar]
- Hunter PJ, Smaill BH. The analysis of cardiac function: A continuum approach. Progress in Biophysics and Molecular Biology. 1988;52:101–164. doi: 10.1016/0079-6107(88)90004-1. [DOI] [PubMed] [Google Scholar]
- Jie X, Gurev V, Trayanova N. Mechanisms of Mechanically Induced Spontaneous Arrhythmias in Acute Regional Ischemia. Circ Res. 2010;106:185–192. doi: 10.1161/CIRCRESAHA.109.210864. [DOI] [PMC free article] [PubMed] [Google Scholar]
- Kallel F, Ophir J. A least-squares strain estimator for elastography. Ultrason Imaging. 1997;19:195–208. doi: 10.1177/016173469701900303. [DOI] [PubMed] [Google Scholar]
- Konofagou EE, Luo J, Saluja D, Fujikura K, Cervantes D, Coromilas J. Noninvasive Electromechanical Wave Imaging and Conduction Velocity Estimation In Vivo. Ultrasonics Symposium, 2007. IEEE; Presented at the Ultrasonics Symposium; IEEE; 2007. pp. 969–972. [DOI] [PMC free article] [PubMed] [Google Scholar]
- Konofagou EE, Luo J, Saluja D, Cervantes DO, Coromilas J, Fujikura K. Noninvasive electromechanical wave imaging and conduction-relevant velocity estimation in vivo. Ultrasonics. 2010;50:208–215. doi: 10.1016/j.ultras.2009.09.026. [DOI] [PMC free article] [PubMed] [Google Scholar]
- Konofagou EE, Lee W-N, Luo J, Provost J, Vappou J. Physiologic Cardiovascular Strain and Intrinsic Wave Imaging. Annu. Rev. Biomed. Eng. 2011;13:477–505. doi: 10.1146/annurev-bioeng-071910-124721. [DOI] [PubMed] [Google Scholar]
- Lai WM, Rubin D, Krempl E. Introduction to Continuum Mechanics. 3rd ed. Pergamon Pr.; 1993. [Google Scholar]
- Lloyd-Jones D, Carnethon M, De Simone G, Ferguson TB, Flegal K, Ford E, Furie K, Go A, Greenlund K, Haase N, Hailpern S, Ho M, Howard V, Kissela B, Kittner S, Lackland D, Lisabeth L, Marelli A, McDermott M, Meigs J, Mozaffarian D, Nichol G, O’Donnell C, Roger V, Rosamond W, Sacco R, Sorlie P, Stafford R, Steinberger J, Thom T, Wasserthiel-Smoller S, Wong N, Wylie-Rosett J, Hong Y American Heart Association Statistics Committee and Stroke Statistics Subcommittee. Heart Disease and Stroke Statistics--2009 Update: A Report From the American Heart Association Statistics Committee and Stroke Statistics Subcommittee. Circulation. 2009;119:e21–e181. doi: 10.1161/CIRCULATIONAHA.108.191261. [DOI] [PubMed] [Google Scholar]
- Luo J, Konofagou EE. High-frame rate, full-view myocardial elastography with automated contour tracking in murine left ventricles in vivo. Ultrasonics, Ferroelectrics and Frequency Control, IEEE Transactions on. 2008;55:240–248. doi: 10.1109/TUFFC.2008.633. [DOI] [PubMed] [Google Scholar]
- McVeigh E, Faris O, Ennis D, Helm P, Evans F. Electromechanical Mapping With MRI Tagging and Epicardial Sock Electrodes. J Electrocardiol. 2002;35:61–64. doi: 10.1054/jelc.2002.37156. [DOI] [PMC free article] [PubMed] [Google Scholar]
- Nash MP, Pullan AJ. Challenges Facing Validation of Noninvasive Electrical Imaging of the Heart. The Annals of Noninvasive Electrocardiology. 2005;10:73–82. doi: 10.1111/j.1542-474X.2005.00608.x. [DOI] [PMC free article] [PubMed] [Google Scholar]
- Osman NF, Kerwin WS, McVeigh ER, Prince JL. Cardiac Motion Tracking Using CINE Harmonic Phase (HARP) Magnetic Resonance Imaging. Magn Reson Med. 1999;42:1048–1060. doi: 10.1002/(sici)1522-2594(199912)42:6<1048::aid-mrm9>3.0.co;2-m. [DOI] [PMC free article] [PubMed] [Google Scholar]
- Pai V, Axel L. Advances in MRI tagging techniques for determining regional myocardial strain. Current Cardiology Reports. 2006;8:53–58. doi: 10.1007/s11886-006-0011-4. [DOI] [PubMed] [Google Scholar]
- Pernot M, Konofagou EE. Electromechanical imaging of the myocardium at normal and pathological states. Ultrasonics Symposium, 2005 IEEE; Presented at the Ultrasonics Symposium; IEEE; 2005. pp. 1091–1094. [Google Scholar]
- Pernot M, Fujikura K, Fung-Kee-Fung SD, Konofagou EE. ECG-gated, Mechanical and Electromechanical Wave Imaging of Cardiovascular Tissues In Vivo. Ultrasound in Medicine & Biology. 2007;33:1075–1085. doi: 10.1016/j.ultrasmedbio.2007.02.003. [DOI] [PubMed] [Google Scholar]
- Plank G, Zhou L, Greenstein JL, Cortassa S, Winslow RL, O’Rourke B, Trayanova NA. From mitochondrial ion channels to arrhythmias in the heart: computational techniques to bridge the spatio-temporal scales. Philos Transact A Math Phys Eng Sci. 2008;366:3381–3409. doi: 10.1098/rsta.2008.0112. [DOI] [PMC free article] [PubMed] [Google Scholar]
- Provost J, Gurev V, Trayanova N, Konofagou EE. Mapping of cardiac electrical activation with electromechanical wave imaging: An in silico-in vivo reciprocity study. Heart Rhythm. 2011a;8:752–759. doi: 10.1016/j.hrthm.2010.12.034. [DOI] [PMC free article] [PubMed] [Google Scholar]
- Provost J, Gurev V, Trayanova N, Konofagou EE. Characterization of Wave Origins in Electromechanical Wave Imaging. 2008 IEEE International Ultrasonics Symposium; Presented at the 2008 IEEE International Ultrasonics Symposium; Beijing, China. 2008. [Google Scholar]
- Provost J, Lee W-N, Fujikura K, Konafagou E. Electromechanical Wave Imaging of Normal and Ischemic Hearts in Vivo. IEEE Trans. Med. Imaging. 2010;29:625–635. doi: 10.1109/TMI.2009.2030186. [DOI] [PMC free article] [PubMed] [Google Scholar]
- Provost J, Lee W-N, Fujikura K, Konofagou E. Imaging the Electromechanical Activity of the Heart. Proceedings of the National Academy of Sciences. 2011b;108(21):8565–8570. doi: 10.1073/pnas.1011688108. 2011.. [DOI] [PMC free article] [PubMed] [Google Scholar]
- Ramanathan C, Ghanem RN, Jia P, Ryu K, Rudy Y. Noninvasive electrocardiographic imaging for cardiac electrophysiology and arrhythmia. Nat Med. 2004;10:422–428. doi: 10.1038/nm1011. [DOI] [PMC free article] [PubMed] [Google Scholar]
- Rice JJ, Wang F, Bers DM, de Tombe PP. Approximate model of cooperative activation and crossbridge cycling in cardiac muscle using ordinary differential equations. Biophys. J. 2008;95:2368–2390. doi: 10.1529/biophysj.107.119487. [DOI] [PMC free article] [PubMed] [Google Scholar]
- Scher AM, Young AC. The pathway of ventricular depolarization in the dog. Circ Res. 1956;4:461–469. doi: 10.1161/01.res.4.4.461. [DOI] [PubMed] [Google Scholar]
- Schilling RJ, Peters NS, Davies DW. Simultaneous endocardial mapping in the human left ventricle using a noncontact catheter: comparison of contact and reconstructed electrograms during sinus rhythm. Circulation. 1998;98:887–898. doi: 10.1161/01.cir.98.9.887. [DOI] [PubMed] [Google Scholar]
- Sengupta PP, Tondato F, Khandheria BK, Belohlavek M, Jahangir A. Electromechanical activation sequence in normal heart. Heart Fail Clin. 2008;4:303–314. doi: 10.1016/j.hfc.2008.02.006. [DOI] [PubMed] [Google Scholar]
- Sutherland DR, Ni Q, MacLeod RS, Lux RL, Punske BB. Experimental measures of ventricular activation and synchrony. Pacing Clin Electrophysiol. 2008;31:1560–1570. doi: 10.1111/j.1540-8159.2008.01227.x. [DOI] [PMC free article] [PubMed] [Google Scholar]
- The Cardiac Arrhythmia Suppression Trial (CAST) Investigators. Preliminary report: effect of encainide and flecainide on mortality in a randomized trial of arrhythmia suppression after myocardial infarction. N. Engl. J. Med. 1989;321:406–412. doi: 10.1056/NEJM198908103210629. [DOI] [PubMed] [Google Scholar]
- Usyk TP, LeGrice IJ, McCulloch AD. Computational model of three-dimensional cardiac electromechanics. Computing and visualization in science. 2002;4:249–257. [Google Scholar]
- Wang S, Lee W-N, Provost J, Luo J, Konofagou EE. A composite high-frame-rate system for clinical cardiovascular imaging. Ultrasonics, Ferroelectrics and Frequency Control, IEEE Transactions on. 2008;55:2221–2233. doi: 10.1109/TUFFC.921. [DOI] [PubMed] [Google Scholar]
- Zhang X, Ramachandra I, Liu Z, Muneer B, Pogwizd SM, He B. Noninvasive three-dimensional electrocardiographic imaging of ventricular activation sequence. Am J Physiol Heart Circ Physiol. 2005;289:H2724–H2732. doi: 10.1152/ajpheart.00639.2005. [DOI] [PubMed] [Google Scholar]


