

Abstract
Preclinical, noninvasive imaging of tissue engineering polymeric scaffold structure and/or the physiological processes such as blood oxygenation remains a challenge. In vitro or ex vivo, the widely used scaffold characterization modalities such as porosimetry, electron or optical microscopy, and X-ray microcomputed tomography have limitations or disadvantages—some are invasive or destructive, others have limited tissue penetration (few hundred micrometers) and/or show poor contrast under physiological conditions. Postmortem histological analysis, the most robust technique for the evaluation of neovascularization is obviously not appropriate for acquiring physiological or longitudinal data. In this study, we have explored the potential of ultrasound (US)-coregistered photoacoustic (PA) imaging as a noninvasive multimodal imaging modality to overcome some of the above challenges and/or provide complementary information. US-PA imaging was employed to characterize poly(lactic-co-glycolic acid) (PLGA) polymer scaffolds or single-walled carbon nanotube (SWCNT)-incorporated PLGA (SWCNT-PLGA) polymer scaffolds as well as blood oxygen saturation within and around the scaffolds. Ex vivo, PLGA and SWCNT-PLGA scaffolds were placed at 0.5, 2, and 6 mm depths in chicken breast tissues. PLGA scaffolds could be localized with US imaging, but generate no PA signal (excitation wavelengths 680 and 780 nm). SWCNT-PLGA scaffolds generated strong PA signals at both wavelengths due to the presence of the SWCNTs and could be localized with both US and PA imaging depths between 0.5–6 mm (lateral resolution=90 μm, axial resolution=40 μm). In vivo, PLGA and SWCNT-PLGA scaffolds were implanted in subcutaneous pockets at 2 mm depth in rats, and imaged at 7 and 14 days postsurgery. The anatomical position of both the scaffolds could be determined from the US images. Only SWCNT-PLGA scaffolds could be easily detected in the US-PA images. SWCNT-PLGA scaffolds had significant four times higher PA signal intensity compared with the surrounding tissue and PLGA scaffolds. In vivo blood oxygen saturation maps around and within the PLGA scaffolds could be obtained by PA imaging. There was no significant difference in oxygen saturation for the PLGA scaffolds at the two time points. The blood oxygen saturation maps complemented the histological analysis of neovascularization of the PLGA scaffolds.
Introduction
A variety of synthetic biodegradable polymer-based scaffolds have thus far been developed for tissue engineering applications.1–7 Poly-lactic-co-glycolic acid (PLGA), an FDA-approved polymer, is widely used to fabricate scaffolds because of its mechanical properties, biocompatibility, and biodegradability.2,3,8,9 Recently, nanoparticle-incorporated PLGA nanocomposites have also been developed.1,10 The nanoparticles, apart from enhancing the mechanical properties of PLGA, have shown to affect the differentiation of progenitor cells.11
In vivo noninvasive imaging of polymeric scaffolds still remains a challenge. Even though, ex vivo, a large number of characterization techniques such as mercury porosimetry, scanning electron microscopy (SEM), laser scanning optical microscopy techniques (e.g., confocal and two-photon microscopy), and X-ray microcomputed tomography (μCT) are available to assess polymeric scaffold properties such as the structure, porosity, and pore size, in vivo, these techniques have significant limitations.12 The contrast of wet polymeric scaffolds such as PLGA immersed in blood or biological media using μCT is poor, while mercury porosimetry and SEM require sample preparation that is only possible ex vivo. Thus, for in vivo studies, invasive postmortem histology is considered as the gold standard to investigate the changes in the scaffold properties, degradation as well as tissue regeneration, and vascularization within the scaffolds.4 Especially, for longitudinal studies, a large number of animals implanted with scaffolds are sacrificed at various time points, the scaffold along with the surrounding tissue explanted, and micrometer thick sections are prepared for histological analysis. This procedure could cause scaffolds debris, small proteins, nucleic acids, extracellular complex carbohydrates, and other soluble metabolites to be washed away,13–15 and thus, affects and limits the analysis of the scaffold's physicochemical properties and deposited extracellular matrix. Additionally, porous scaffolds with lower mechanical properties compared with the tissue could crumble, fall out of the surrounding tissue, or get displaced during the histological specimen preparation making it challenging to characterize its structural properties and/or investigate tissue regeneration within these scaffolds. Furthermore, although blood vessel cross sections can be located in histological sections, the process of vasculogenesis16 cannot be characterized by histological analysis alone, and complementary physiological information such as blood oxygen saturation cannot be monitored. Monitoring oxygen saturation or oxygenation of tissue engineering scaffolds is very important during the process of tissue regeneration. Scaffolds with low oxygen penetration fail to support live cells and prevent tissue regeneration. It is important for aerobic metabolism, cell proliferation, and even differentiation of mesenchymal stem cells (MSCs). Upon implantation of the scaffolds in vivo, it takes about 8–12 days before neovascularization occurs.17 During this period, the cells in the scaffolds rely solely on blood perfusion for oxygen and nutrition. Oxygen saturation of tissue engineering scaffolds decreases exponentially with depth.18 As the interstitial fluid enters the scaffold, the cells on the outer layers of the scaffold use up the oxygen leaving hypoxic regions at the center of the scaffold. In these regions, MSCs fail to proliferate and differentiate into osteoblasts, delaying the process of tissue regeneration.19–21
To this end, various superficial and whole-body small animal imaging modalities have recently been explored for imaging tissue engineering scaffolds.22–28 Each modality has its advantages and limitations. Superficial optical imaging techniques, with excellent sub-μm resolutions, such as bioluminescence, fluorescence, optical coherence tomography (OCT), and two-photon imaging have various limitations such as low tissue penetration (tens to hundred of micrometers), optical scattering and attenuation, or interferences due to background tissue autofluorescence. Additionally, techniques such as bioluminescence imaging require genetically modified small animal models, and fluorescence or two-photon microscopy require the use of fluorophores that may photobleach or interfere with normal physiological processes.25 Deep tissue imaging modalities, such as X-ray CT, magnetic resonance imaging (MRI), or positron emission tomography (PET) allow whole body imaging. However, μCT of tissue engineering scaffolds, show poor contrast when perfused with body fluids.12 Additionally, imaging blood vessels is possible only after injection of contrast agents into the blood vessels postmortem, and thus, not appropriate to obtain longitudinal or real-time information on the process of neovascularization.27 Unlike CT that uses harmful x-ray radiation, MRI is considerably safer.26,29–34 However, the contrast of tissue engineering scaffolds monitored using MRI is poor until water can penetrate and perfuse the scaffold.33–35 This method also requires the use of contrast agents with high relaxivity values. In addition to contrast agents, the strong magnetic fields required for MRI might not be suitable for studying metallic (e.g., titanium) scaffolds. PET has also been proposed for imaging vasculature and although it can effectively target highly vascular tumors34,35 with a resolution of 1–2 mm, it is incapable of imaging neovasculature or micron-sized blood capillaries in tissue engineering scaffolds.
Recently, photoacoustic microscopy (PAM) imaging has shown promise to noninvasively characterize the porosity and pore size of tissue engineering scaffolds in vitro, and neovascularization within scaffolds in vivo.12,36 Additionally, the same technique could also be used for histological and histomorphometric analysis of scaffolds.12 Differential absorption by exogenous [e.g., single-walled carbon nanotubes (SWCNTs)] or endogenous (e.g., hemoglobin) materials, at a specific optical wavelength, is responsible for the contrast generated in PA imaging systems.12,28,36–38 Most biological molecules do not absorb at near infrared (NIR) wavelengths, and therefore do not generate robust PA signals. Oxyhemoglobin and hemoglobin are two of the relatively few endogenous molecules that absorb in this region, and due to their differential absorption spectra, allow mapping of in vivo oxygen saturation by PAM.36 SWCNTs absorb strongly at the near infrared region and generate PA signals stronger than endogenous absorbers such a hemoglobin and melanin.38,39
Pure PA imaging does not typically provide the appropriate contextual anatomic information for useful localization of the PA imaging signals within the animal.40 Although white light overlay methods are beneficial, due to difficulty in animal repositioning, repeated imaging of the same animal in different imaging sessions often results in misinterpretation of the signal localization.41 The white light reference image typically used in a pure PA imaging system may be suitable for localization of large objects such as tumor masses, but lacks the anatomical context required for repeatedly localizing smaller signals of interest and/or mapping the molecular signals to bones or other anatomical structures within the animal. Ultrasound (US)-based coregistration of the PA signal has been reported to allow suitable contextual anatomical information of generated PA signals.42 Using US-PA multimodal imaging, both anatomical and physiological data can be obtained. US-PA has thus far been investigated for various preclinical applications such as intravascular imaging of atherosclerotic plaques, tumor detection and staging, in vivo stem cell tracking.43–47 To the best of our knowledge, till date, the potential benefits of US-PA in the field of tissue engineering have not been explored. Therefore, in this study, we investigate the suitability of a multimodal US-PA system to image tissue engineering scaffolds and monitor oxygen saturation in vivo in a rat model.
Materials and Methods
SWCNT synthesis
SWCNTs were synthesized as described previously.12 The diblock copolymer templating method was used to coat Fe on Si wafers and placed in a 3-inch-diameter quartz reaction chamber (Easy Tube 2000; First Nano). The chamber was then filled with H2 for 2 min followed by CH4 as carbon feedstock for 20 min. The furnace was then switched off and cooled to room temperature.
Scaffold preparation
Porous polylactic-co-glycolic-acid (PLGA) scaffolds were prepared as previously described.12,48 PLGA scaffolds with single walled carbon nanotubes (SWCNT-PLGA) were made by uniformly dispersing the nanotubes in PLGA (Polysciences, Inc.) dissolved in chloroform at a 0.5 wt% concentration. The particulate leaching technique was used to make porous polymer composites using NaCl as a porogen (100–500 μm). The amount of NaCl required to achieve 90% porosity was calculated using the following equation:
 |
where VPLGA, VSWCNT, and VNaCl are the volumes of PLGA, SWNT, and NaCl, respectively. The mixture of PLGA or SWCNT-PLGA with NaCl was poured into cylindrical Teflon™ molds of 4 mm diameter and 1.5 mm in height. Uniform distribution of SWCNTs was obtained by stirring the mixture vigorously and vortexing before pouring it into the molds. After complete removal of chloroform, the scaffolds were removed from the molds and immersed in deionized water to leach NaCl. The vials containing scaffolds were placed on a shaker table (80 rpm) and the water was changed every 6 h. After 48 h, the scaffolds were removed from water, blotted dry, and air-dried at room temperature for 24 h.
Atomic force microscopy
The structure and dimensions of SWCNTs prepared by the method described above were determined with atomic force microscopy (AFM) as described previously.49 In short, SWCNTs in a 1:1 ethanol:water solution were dispersed by probe sonication (Cole-Parmer Ultrasonicator LPX 750) for 1 min using a 1 s on and 2 s off cycle. To prepare samples for AFM, we spin coated 50 μL of dispersed SWCNT solution onto silicon wafers (Ted Pella) at 300 rpm for 5 min. We used NanoSurf EasyScan 2 Flex AFM (NanoScience Instruments, Inc., Phoenix) in tapping mode with a V-shaped cantilever (APP Nano ACL−10, frequency fc=145–230 kHz, L=225 μm, W=40 μm, tip radius<10 nm, spring constant k=20–95 N/m) for the images.
Scanning electron microscopy
Scanning electron microscopy (SEM; Schottky Field Emission Scanning Electron Microscope, LEO Gemini 1550) was used to examine the structure of SWCNT-PLGA nanocomposites. The porous scaffolds were sliced, mounted on metal studs, and sputter coated with gold before imaging at an acceleration voltage of 20 KV with the Everhart-Thornley secondary electron detector.
Microcomputed tomography
μCT (Scanco Medical AG) was used to characterize the porosity and pore size of the scaffolds. Imaging was done with a resolution of 12 μm with 55 KV energy and intensity of 145 μA. Software provided by Scanco Medical AG was used for image reconstruction and analysis. A threshold of 41 was used to represent gray-scale tomograms of the scaffold. The pore sizes were determined from three-dimensional (3D) rendered images of the scaffold. For calculating the porosity, total volume (TV), scaffold volume (SV), and volume fraction (SV/TV) were determined. Three separate regions per scaffold were analyzed and the average was used to determine the porosity of the scaffolds using the following equation50:
 |
Animals and subcutaneous scaffold implants
Animal experiments were performed in compliance with the Institutional Animal Care and Use Committee (IACUC). Three male Sprague Dawley rats (12 weeks old) were obtained from Charles River Laboratories. Rats were individually housed, allowed free access to water, fed standard rat chow pellet, and kept on a 12-h light–12-h dark cycle. Before the experiments were conducted, the animals were acclimatized for a week at the above conditions. The scaffolds were implanted in subcutaneous pockets using a well-established animal surgical model for tissue engineering strategies, using preanesthesia by isoflurane (5%) in% O2 inhalation and maintained further by 1–2.5% isoflurane. To reduce preoperative infection risk and to minimize postoperative discomfort, antibiotic [enrofloxacin (Baytril), 2.5–5 mg/kg SQ for 5 days, s.c] and analgesic (ketorolac 2–4 mg/kg, s.c) were administered to the rats. For the installation of subcutaneous implants, the dorsum of rats was shaved, washed, and disinfected with povidone iodine. Four longitudinal incisions of ∼1 cm were made through the full thickness of the skin at both sides of the spinal column. Subsequently, lateral to the incisions, a subcutaneous pocket was created by blunt dissection and then the scaffolds were placed into these pockets. The skin was closed using a subcuticular vicryl suture. Postsurgery, the animals were housed singly and allowed full activity in their cages and monitored for any adverse effects.
US coregistered PA imaging
US and PA images of PLGA and SWCNT-PLGA scaffolds embedded in chicken breast tissue were taken using Visual Sonics Vevo LAZR PAs Imaging System (LZ550 imaging probe, 40 MHz center frequency, bandwidth 22–55 MHz). Scaffolds placed on chicken breast tissue were covered with layers of chicken breast of varying thickness (0.5, 2, and 6 mm). A thin layer of US gel was applied on the surface of the chicken breast to reduce attenuation due to air pockets between the skin and transducer. The transducer was placed in contact with the gel. Images were obtained using a 680 and 780 nm laser and analyzed using Vevo 2100 Workstation software (v1.4.0).
PA images of the scaffolds in vivo were taken at 7 and 14 days postsurgery at 680, 780, 880, and 970 nm wavelengths. The energies of the lasers used for imaging were all within the American National Standards Institute (ANSI) limitation (20 mJ/cm2). For PA imaging, the rats were preanesthetized with isoflurane (5%) in the O2 mixture and maintained under 1–2.5% isoflurane. Animals were placed on flat stationary surface designed for rats on the PA instrument and US gel was applied for imaging. PA signals were detected by placing the transducer on the gel applied portion to perform imaging. Two-dimensional (2D) and 3D images of scaffolds were taken and oxygen saturation levels within the scaffolds were determined using Vevo 2100 Workstation software (v1.4.0). Oxygen saturation (sO2) measurements were assessed using the Oxyhemo mode, an inbuilt software algorithm that uses a dual wavelength (750 and 850 nm) approach.51 A region of interest (ROI) was created to include the scaffold in the 2D acquired sO2 images.
Statistics
Data were analyzed as a ratio of average PA signal obtained from the scaffold with signal obtained from surrounding tissue. The one-sample t test was used to determine the significance of the difference of signals from the scaffold and surrounding tissue. Furthermore, the nonparametric Mann–Whitney U test was used to analyze the significance in the difference between PLGA and SWCNT-PLGA groups. Differences with p<0.05 are considered significant.
Histology
Subcutaneous tissue containing scaffolds were excised and fixed in 10% buffered formalin (pH 7.2), dehydrated through a series of ethanol solutions, embedded in paraffin, and routinely processed for histological analysis. Sections of 5 μm thickness were cut and stained with hematoxylin–eosin (H&E) for histological analysis. The stained tissues were observed through a microscope (Carl Zeiss), photographed by a charge couple device camera, and histopathological analysis was performed.
Results and Discussions
The studies reported in this article were performed to answer the following questions: (1) Can US-coregistered PA imaging noninvasively characterize PLGA and SWCNT-PLGA scaffolds, and monitor blood oxygen saturation levels in and around these scaffolds? (2) If yes, what are the strengths and weaknesses of this modality for applications mentioned above? PLGA and SWCNT-PLGA scaffolds were chosen since they have previously been used for in vitro PA imaging.12 Additionally, these scaffolds do not show adverse biological responses in vitro and in vivo.52,53 The NIR wavelengths used for PA imaging were selected to achieve optimal laser power and PA signal amplitude, as well as greater tissue penetration.
SWCNTs used for the study were characterized by AFM. SWCNT-PLGA scaffolds were characterized using optical microscopy, SEM, and microCT. The SWCNTs had a diameter of 1.0–1.5 nm, and had lengths ranging from 1–5 μm (Fig. 1A). Figure 1B shows a representative optical image of the PLGA and SWCNT-PLGA scaffold. SWCNT-PLGA scaffolds with SWCNTs incorporated throughout the polymer scaffolds appear gray in the optical images and are morphologically similar to PLGA scaffolds. Figure 1C shows a SEM image of the SWCNT-PLGA scaffold with SWCNTs embedded into the polymer matrix. SWCNTs within the polymer matrix are seen bridging the microcracks within the scaffold and protruding out from the polymer matrix.54,55 Furthermore, microCT image of the scaffold shows a porous structure with interconnecting pores. Analysis shows porosity of about 89% with 145 μm as the average size of the pores.12
FIG. 1.

(A) Representative atomic force microscopy image of a single-walled carbon nanotube (SWCNT). Inset is a cross-sectional topography plot of this nanotube that shows its diameter to be ∼ 1 nm. (B) Optical images of poly(lactic-co-glycolic acid) (PLGA) and SWCNT-PLGA (C) SEM images of the SWCNT-PLGA scaffold with scale bar showing 1 μm. The orange arrows point to SWCNTs and the green arrows point to the PLGA polymer matrix. (D) MicroCT image of the SWCNT-PLGA scaffold with scale bar of 5 μm. Color images available online at www.liebertpub.com/tec
US-PA imaging of PLGA and SWCNT-PLGA scaffolds was first performed ex vivo. Figure 2 shows representative US-coregistered PA images of PLGA and SWCNT-PLGA scaffolds embedded in chicken breast tissue at depths of 0.5, 2, and 6 mm. Regions pseudocolored in bright red are the PA signals overlaid on black and gray US images. Anatomical information obtained from US images was used to determine the position and depth of the scaffolds within the tissue. PLGA scaffolds generated no PA signal at all the depths, except in some regions (Fig. 2A–C). In these regions, the generated PA signals (colored in red) were due to trace amounts of SWCNTs used to indicate the distal lining of chicken breast tissue. SWCNT-PLGA scaffolds showed PA signal intensity up to four times higher than PLGA scaffolds and surrounding tissue and appear red in the images (Fig. 2D–F). PA images of the entire scaffold could be obtained at a depth of 0.5 and 2 mm. At 6 mm depth, PA images of only the top portion of the scaffold could be obtained, and the entire scaffold could not be imaged at depths below 6 mm. SWCNT-PLGA scaffolds generated strong PA signals at both 680 and 780 nm wavelengths, due to the presence of SWCNTs. The 680 nm wavelength laser had a higher power compared with the 780 nm wavelength laser, which resulted in higher fluence and thus, a stronger PA signal. Three-dimensional reconstruction of the 2D planar US-PA images allowed better registration of the location and dimensions of the scaffolds. Figure 2G displays a 3D reconstructed image of a representative scaffold embedded 0.5 mm deep in the tissue, which clearly shows the scaffold shape and dimensions (4×1.5 mm). The lateral resolution of the images was 90 μm and axial resolution was 40 μm. The porosity or the pore size of these scaffolds could not be measured from these images, since the pore sizes were ∼145 μm and pore interconnects were ∼40–100 μm.12
FIG. 2.

Ultrasound-photoacoustic (US-PA) images of PLGA (A–C) and SWCNT-PLGA (D–F) scaffolds imaged at 680 nm embedded into chicken breast tissue at depths of (A, D) 0.5 mm, (B, E) 2 mm, and (C, F) 6 mm. (G) Three-dimensional (3D) US-PA image rendition of SWCNT-PLGA scaffolds embedded 0.5 mm in chicken breast tissue. (H) US/PA amplitude scale is shown. Color images available online at www.liebertpub.com/tec
Figure 3 shows US-PA images of PLGA (Fig. 3A, B) and SWCNT-PLGA (Fig. 3C, D) scaffolds implanted subcutaneously in a rat. The scaffolds were imaged on days 7 (Fig. 3A, C) and 14 (Fig. 3B, D) postsurgery. US images obtained from the US-PA Imaging system were used to detect the scaffolds implanted 2 mm deep in subcutaneous pockets on the dorsal region of the rats. The full thickness and the cross section of the scaffold could be determined in the images. The PA signal from endogenous absorbers such as hemoglobin, from as deep as 8 mm were visible in the images. PLGA (Fig. 3A–D) scaffolds are indistinguishable in the US-PA images, and have poor contrast with respect to surrounding tissue. The PA signal obtained from the PLGA scaffold shows no significant difference compared with the signal obtained from surrounding tissue (one-sample t test, P>0.05). SWCNT-PLGA scaffolds, outlined in Figure 3C and D, have significantly higher PA intensity compared with surrounding tissue. Average PA intensity of SWCNT-PLGA scaffolds, normalized with PA intensity of surrounding tissue, is 4 times greater compared with PLGA scaffolds (Mann–Whitney U test, p<0.05). Images taken at day 7 and day 14 show no particular trends in signal distribution within the scaffold. Distribution of the PA signal within the scaffold varies based on the 2D slice chosen from the 3D images. Three-dimensional rendering of the 2D slices shows the morphology of the scaffold in vivo surrounded by endogenous absorbers oxy-and-deoxy hemoglobin (Fig. 3E). The epidermal layer produces PA signals due to the presence of melanin and appears as a continuous layer on the surface of the skin. A previous report on PA imaging of scaffolds have applied that spectral imaging would allow removal of signal from endogenous absorbers.56 Since SWCNT has characteristic absorption spectrum, it could easily be delineated from surrounding tissue with spectral imaging and also be quantified.56 Although NIR lasers with wavelengths between 700–1100 nm have low absorbance and better depth of penetration than visible lasers in biological tissue,57 biomolecules such as melanin and hemoglobin have significant absorbance at 780 nm wavelength used for in vivo PA imaging.35 In Figure 3E, the PA signal from melanin can be seen on the epidermal layer and the signal from hemoglobin can be detected in surrounding tissues in Figure 3A–D. Since the PA signal produced from SWCNTs is much stronger than the signal produced by these biomolecules,38,58 SWCNT-PLGA scaffolds have a very high contrast and can be easily distinguished from surrounding tissue.
FIG. 3.
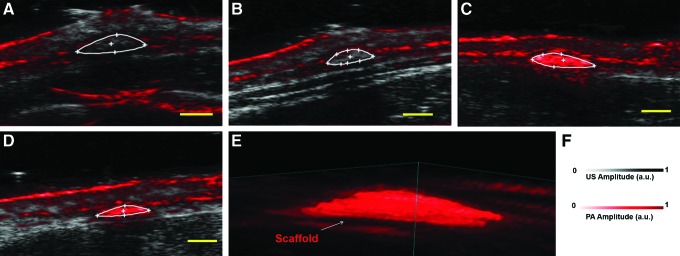
Representative US-PA images of PLGA (A, B) and SWCNT-PLGA (C, D) scaffolds in vivo. The scaffolds were implanted into subcutaneous pockets and imaged on day 7 (A, C) and day 14 (B, D) postsurgery. (E) Three-dimensional rendering of SWCNT-PLGA scaffolds under the skin at day 7 imaged at 780 nm. (F) US/PA amplitude scale is shown. Scale bar represents 2 mm. Color images available online at www.liebertpub.com/tec
Other PA imaging modalities, such as optical or acoustic resolution PAM, possess a better resolution and allow determination of porosity in vitro. Optical resolution PAM has a lateral resolution of 2.6 μm, axial resolution of 15 μm with penetration of 660 μm in vitro and 1 mm in vivo.12,37,59,60 Acoustic resolution PAM (AR-PAM) has a spatial resolution of 45 μm, axial resolution of 15 μm with penetration of 2 mm.12 Compared with PAM, US-PA imaging allows greater tissue penetration, making it more suitable for in vivo small animal studies that require deep tissue (>1 mm) monitoring of scaffolds for applications such as bone or cardiovascular tissue engineering. For these applications, the various PA imaging modalities should provide complementary information at multiple length scales using the same contrast mechanism.61 The US-PA imaging should provide anatomy of the tissue surrounding the scaffolds, as well as real-time longitudinal changes in the overall shape, and size of the scaffold. Once the scaffolds are explanted, PAM should provide immediate 3D information of changes in the pore size and porosity of the explanted scaffolds, and covalidate these scaffold properties in vitro during histological and histomorphometric analysis.12
Figure 4 shows the blood oxygen saturation maps, at day 7 and 14 postimplantation, in and around the PLGA and SWCNT scaffolds. PA signal obtained at 750 and 850 nm were used to obtain the blood oxygen saturation maps. Oxygen saturation or dissolved oxygen is the concentration of oxygen in a given media. In the case of blood vessels in biological tissues, it is determined as a ratio of oxy-hemoglobin and total hemoglobin in a given region. Due to the differential absorbance of NIR light by deoxyhemoglobin (Hb) and oxyhemoglobin (HbO) at different wavelengths,62 relative absorbance of Hb and HbO can be used to determine in vivo oxygen saturation with PA imaging.36 Figure 4A–D show oxygen saturation maps of the skin and underlying areas. There were regions of high saturation around the PLGA and SWCNT-PLGA scaffolds. PLGA scaffolds showed oxygen saturation on the edges of the scaffold on day 7 (Fig. 4A) and at day 14, the regions of high oxygen saturation, appearing red and white, are also seen within the scaffold (Fig. 4B). PLGA scaffolds had lower oxygen saturation of 12% on day 14 as compared with 16% on day 7. SWCNT-PLGA scaffolds, indistinguishable from surrounding tissue, appear to have high oxygen saturation throughout the scaffold (Fig. 4C, D). SWCNT-PLGA scaffolds had two- to threefold higher oxygen saturation values at both time points with an average oxygen saturation of 41% on day 7 and 36% on day 14. This is due to the additional optical absorbance by the SWCNTs in the scaffolds in the NIR. Unlike Hb and HbO, SWCNT absorbs equivalently at the two NIR wavelengths (750 and 850 nm) used for oxygen saturation measurements. SWCNT produces strong PA signals at both wavelengths giving rise to false-positive oxygen saturation signals in SWCNT-PLGA scaffolds. Spectroscopic PA imaging can be used to differentiate and quantify SWCNTs as well as Hb and HbO in a given region and eliminate SWCNT-generated false-positive signals in the scaffolds.28,63 This information can then be used to accurately map blood oxygen saturation of SWCNT-PLGA scaffolds without false-positive signals from SWCNTs. Since oxygen saturation is measured from relative concentrations of Hb and HbO, it is also a good surrogate indicator of vasculogenesis, and neovascularization.16 Upon vascularization of the scaffold, there would be an increase in PA signals due to the presence of Hb and HbO within the scaffold. Thus, in small animals, US-PA could provide not only longitudinal anatomical information about the scaffold, but also important physiological information such as Hb, HbO, and oxygen saturation during the process of tissue regeneration.
FIG. 4.

Representative blood oxygen saturation maps of PLGA (A, B) and SWCNT-PLGA (C, D) scaffolds taken day 7 (A, C) and 14 (B, D) postsurgery. (E) US/PA amplitude scale is shown. Scale bar represents 2 mm. Color images available online at www.liebertpub.com/tec
Hematoxylin–eosin-stained sections of tissue surrounding PLGA and SWCNT-PLGA scaffolds were examined under the microscope to investigate tissue regeneration and vascularization (Fig. 5). Surrounding tissue is seen to have penetrated the scaffold with evidence of vascularization around and within the scaffold. The morphology of the regenerated tissue (Fig. 5A) matches and validates the oxygen saturation maps obtained in vivo (Fig. 4B). Red blood cells can be seen in the newly formed capillaries in the regenerated tissue (yellow arrows, Fig. 5A–D). Small fragments of the scaffolds were surrounded by newly formed healthy tissue with no signs of fibrosis (red arrows, Fig. 5C, D). SWCNT aggregates can also be seen within the scaffold region surrounded by healthy tissue (green arrows, Fig. 5D). The histological results are similar to previous studies that show no adverse host response of highly porous scaffolds, which allow better oxygenation within the scaffolds, of these dimensions.1,2,9
FIG. 5.

Histology of tissue surrounding PLGA (A, B) and SWCNT-PLGA (C, D) scaffolds showing tissue regeneration and vascularization. Arrows point to scaffold fragments (red arrows), blood vessels (yellow arrows), and SWCNT aggregates (green arrows). Color images available online at www.liebertpub.com/tec
The above results indicate that US-PA imaging should allow longitudinal monitoring of scaffold architecture and oxygen saturation in and around the scaffolds. PLGA is a slowly degrading polymer and previous in vitro degradation studies show that scaffolds with similar porosity (89%) and pore size (145 μm) used in this study show negligible degradation.9 Furthermore, previous in vitro studies on similarly prepared scaffolds have shown negligible degradation within 2 weeks.12 Histological analysis shows intact PLGA scaffold structures within the regenerated tissue indicating that observed PA signals are mainly from SWCNTs incorporated in the scaffolds and not from any SWCNT released from the scaffold. To validate the utility and feasibility of this imaging technique in tissue engineering applications, further investigation is required. The effect of varying scaffold parameters such as size, porosity, pore size, degradation kinetics, and nanoparticle concentration on imaging tissue regeneration in vivo should be investigated. Compared with other multimodal small animal imaging systems that provide both anatomical and functional imaging, such as MRI-PET and PET-CT, US-PA has significant advantages. It has a higher spatial resolution compared with PET-CT, allowing imaging of vasculature possible, and does not use harmful radiation. Compared with MRI-PET, US-PA has a higher temporal resolution allowing real-time monitoring of oxygen saturation and does not require exogenous contrast agents for either anatomical or functional imaging.
Our in vitro and in vivo data provide proof-of-principle demonstration that US-PA imaging hold potential as a preclinical tool for spatial and temporal imaging and characterization of key anatomical and physiological information (structure, and oxygenation) in and around polymeric scaffolds, overcoming the limitations of current structural and histological techniques. Our study in conjunction with reports by others on PAM indicate that multiscale PA imaging enhanced with nanoparticle contrast agents has the potential to complement conventional diagnostic approaches for monitoring the scaffold structure and vasculogenesis in engineered tissue, while overcoming many limitations of existing imaging technologies for small animals. We expect that the complete development/adaption of this imaging technique will significantly impact translational research. Tissue engineering scaffolds are biomedical implants. Clinical development of any therapeutic biomedical implant technology is a long and expensive process involving extensive developmental research, animal model testing, and then clinical studies. Shortening this development process is critical for managing development-associated costs and timeframe. Preclinical noninvasive in vivo small animal imaging bridges the gap between in vitro exploratory and in vivo clinical research facilitating more direct and rapid transfer of preclinical studies in animal models to clinical investigation.56,64 Preclinical noninvasive imaging can dramatically increase the efficiency of lead candidate selection by providing earlier and more highly predictive data compared with traditional methods based on histology results alone. Longitudinal imaging of the same animal at multiple time points will result in more valuable information than would be obtained from multiple individual animals. In these systems, the animal acts as its own control and analysis of dynamic data charts progressive biological changes and therapeutic response without the need for a large number of animals. Multiscale PA imaging, as a noninvasive preclinical modality, shows promise to allow longitudinal monitoring and characterization of key structural and tissue regeneration parameters (i.e., size and porosity of scaffolds, neovascularization, and oxygen saturation), facilitating more rapid selection of candidate polymeric scaffolds for further development. It will also provide important insights into sequence of events that occur during in vivo regeneration within polymeric scaffolds, enabling more efficient translation from preclinical testing to clinical evaluation. In addition, low-power PA imaging is nonionizing, user-friendly, and less expensive than other 3D small animal imaging modalities used to monitor bone regeneration. Therefore, it is appropriate for use by researchers for rodent studies to improve understanding of the tissue development process, and could be widely adapted for other tissue engineering applications (e.g., skin, bone, and cardiovascular tissue regeneration).
Conclusion
We demonstrate that US-PA imaging allows deep tissue (up to 6 mm) imaging of SWCNT-PLGA scaffolds ex vivo with a lateral resolution of 90 μm and axial resolution of 40 μm. The modality also allows 2D and 3D noninvasive longitudinal imaging of SWCNT-PLGA scaffolds subcutaneously implanted into rats. Longitudinal oxygen saturation maps in and around subcutaneously implanted PLGA scaffolds can be obtained using US-PA imaging. Postmortem histological analysis qualitatively corroborates this result. The results suggest that US-PA imaging is a promising multimodal small animal imaging modality for noninvasive longitudinal monitoring of changes to polymeric tissue engineering scaffold architecture (size, shape, degradation) and key physiological indicators of tissue regeneration such as changes in oxygen saturation.
Acknowledgments
This work was supported by the National Institutes of Health (grants No. 1DP2OD007394-01). The authors thank Ms. Teri Conte Dr. Mina Lakhsman and Mr. Andrew Heinmiller at VisualSonics, Inc. for their technical assistance.
Disclosure Statement
No competing financial interests exist.
References
- 1.Choi S.W., Zhang Y., Thomopoulos S., and Xia Y.In vitro mineralization by preosteoblasts in poly(DL-lactide-co-glycolide) inverse opal scaffolds reinforced with hydroxyapatite nanoparticles. Langmuir 26,12126, 2010 [DOI] [PMC free article] [PubMed] [Google Scholar]
- 2.Kim S.S., Sun Park M., Jeon O., Yong Choi C., and Kim B.S.Poly (lactide-co-glycolide)/hydroxyapatite composite scaffolds for bone tissue engineering. Biomaterials 27,1399, 2006 [DOI] [PubMed] [Google Scholar]
- 3.Yoshimoto H., Shin Y., Terai H., and Vacanti J.A biodegradable nanofiber scaffold by electrospinning and its potential for bone tissue engineering. Biomaterials 24,2077, 2003 [DOI] [PubMed] [Google Scholar]
- 4.Ge Z., Baguenard S., Lim L.Y., Wee A., and Khor E.Hydroxyapatite-chitin materials as potential tissue engineered bone substitutes. Biomaterials 25,1049, 2004 [DOI] [PubMed] [Google Scholar]
- 5.O'Keefe R.J., and Mao J.Bone tissue engineering and regeneration: from discovery to the clinic,Äîan overview. Tissue Eng Part B Rev 17,389, 2011 [DOI] [PMC free article] [PubMed] [Google Scholar]
- 6.Muzzarelli R.A., Greco F., Busilacchi A., Sollazzo V., and Gigante A.Chitosan, hyaluronan and chondroitin sulfate in tissue engineering for cartilage regeneration: a review. Carbohydr Polymers 89,723, 2012 [DOI] [PubMed] [Google Scholar]
- 7.Atala A.Tissue engineering of human bladder. Br Med Bull 97,81, 2011 [DOI] [PubMed] [Google Scholar]
- 8.Burg KJL, Porter S., and Kellam J.F.Biomaterial developments for bone tissue engineering. Biomaterials 21,2347, 2000 [DOI] [PubMed] [Google Scholar]
- 9.Rezwan K., Chen Q., Blaker J., and Boccaccini A.R.Biodegradable and bioactive porous polymer/inorganic composite scaffolds for bone tissue engineering. Biomaterials 27,3413, 2006 [DOI] [PubMed] [Google Scholar]
- 10.Zhang P., Wu H., Lu Z., Deng C., Hong Z., Jing X., et al. RGD-conjugated copolymer incorporated into composite of poly(lactide-co-glycotide) and poly(L-lactide)-grafted nanohydroxyapatite for bone tissue engineering. Biomacromolecules, 12,2667, 2011 [DOI] [PubMed] [Google Scholar]
- 11.Sitharaman B., Avti P.K., Schaefer K., Talukdar Y., and Longtin J.P.A novel nanoparticle-enhanced photoacoustic stimulus for bone tissue engineering. Tissue Eng Part A 17,1851, 2011 [DOI] [PMC free article] [PubMed] [Google Scholar]
- 12.Cai X., Paratala B.S., Hu S., Sitharaman B., and Wang L.V.Multiscale photoacoustic microscopy of single-walled carbon nanotube-incorporated tissue engineering scaffolds. Tissue Eng Part C Methods 18,310, 2012 [DOI] [PMC free article] [PubMed] [Google Scholar]
- 13.Eltoum I., Fredenburgh J., Myers R.B., and Grizzle W.E.Introduction to the theory and practice of fixation of tissues. J Histotechnol 24,173, 2001 [Google Scholar]
- 14.Bancroft J.D., and Gamble M.Theory and Practice of Histological Techniques. Elsevier Health Sciences; London, UK: Churchill Livingstone, 2008 [Google Scholar]
- 15.Dapson R.Macromolecular changes caused by formalin fixation and antigen retrieval. Biotech Histochem 82,133, 2007 [DOI] [PubMed] [Google Scholar]
- 16.Risau W., and Flamme I.Vasculogenesis. Ann Rev Cell Dev Biol 11,73, 1995 [DOI] [PubMed] [Google Scholar]
- 17.Druecke D., Langer S., Lamme E., Pieper J., Ugarkovic M., Steinau H.U., et al. Neovascularization of poly(ether ester) block-copolymer scaffolds in vivo: long-term investigations using intravital fluorescent microscopy. J Biomed Mater Res Part A 68,10, 2004 [DOI] [PubMed] [Google Scholar]
- 18.Kellner K., Liebsch G., Klimant I., Wolfbeis O.S., Blunk T., Schulz M.B., et al. Determination of oxygen gradients in engineered tissue using a fluorescent sensor. Biotechnol Bioeng, 80,73, 2002 [DOI] [PubMed] [Google Scholar]
- 19.Barrilleaux B., Phinney D.G., Prockop D.J., and O'connor K.C.Review: ex vivo engineering of living tissues with adult stem cells. Tissue Eng 12,3007, 2006 [DOI] [PubMed] [Google Scholar]
- 20.D'Ippolito G., Diabira S., Howard G.A., Roos B.A., and Schiller P.C.Low oxygen tension inhibits osteogenic differentiation and enhances stemness of human MIAMI cells. Bone 39,513, 2006 [DOI] [PubMed] [Google Scholar]
- 21.Carrancio S., and López-Holgado. N, Sánchez-Guijo. FM, Villarón. E, Barbado. V, Tabera. S, et al. Optimization of mesenchymal stem cell expansion procedures by cell separation and culture conditions modification. Exp Hematol 36,1014, 2008 [DOI] [PubMed] [Google Scholar]
- 22.Schenke-Layland K., Riemann I., Damour O., Stock U.A., and Konig K.Two-photon microscopes and in vivo multiphoton tomographs - Powerful dicagnostic tools for tissue engineering and drug delivery. Adv Drug Deliv Rev 58,878, 2006 [DOI] [PubMed] [Google Scholar]
- 23.C. C-R, El Haj A.J., Yang X., and Yang Y.Fluorescent labeling of chitosan for use in non-invasive monitoring of degradation in tissue engineering. J Tissue Eng Regenerative Med 7,39, 2011 [DOI] [PubMed] [Google Scholar]
- 24.Georgakoudi I., Rice W.L., Hronik-Tupaj M., and Kaplan D.L.Optical spectroscopy and imaging for the noninvasive evaluation of engineered tissues. Tissue Eng Part B Rev 14,321, 2008 [DOI] [PMC free article] [PubMed] [Google Scholar]
- 25.Studwell A.J., and Kotton D.N.A Shift From Cell Cultures to Creatures: In vivo imaging of small animals in experimental regenerative medicine. Mol Ther 19,1933, 2011 [DOI] [PMC free article] [PubMed] [Google Scholar]
- 26.Wittenborn T., Nielsen T., Nygaard J.V., Larsen EKU, Thim T., Rydtoft L.M., et al. Ultrahigh-field DCE-MRI of angiogenesis in a novel angiogenesis mouse model. J Magn Reson Imaging 35,703, 2012 [DOI] [PubMed] [Google Scholar]
- 27.Young S., Kretlow J.D., Nguyen C., Bashoura A.G., Baggett L.S., Jansen J.A., et al. Microcomputed tomography characterization of neovascularization in bone tissue engineering applications. Tissue Eng Part B Rev 14,295, 2008 [DOI] [PMC free article] [PubMed] [Google Scholar]
- 28.Rao B., Maslov K., Danielli A., Chen R., Shung K.K., Zhou Q., et al. Real-time four-dimensional optical-resolution photoacoustic microscopy with Au nanoparticle-assisted subdiffraction-limit resolution. Opt Lett 36,1137, 2011 [DOI] [PMC free article] [PubMed] [Google Scholar]
- 29.Chen W.T., Ting Fang Shih T., Chen R.C., Tu S.Y., Wen-Yuen H., and Yang P.C.Integrin alphavbeta3-targeted dynamic contrast-enhanced magnetic resonance imaging using a gadolinium-loaded polyethylene gycol-dendrimer-cyclic rgd conjugate to evaluate tumor angiogenesis and to assess early antiangiogenic treatment response in a mouse xenograft tumor model. Mol Imaging 11,286, 2012 [PubMed] [Google Scholar]
- 30.Haney C.R., Fan X., Markiewicz E., Mustafi D., Karczmar G.S., and Stadler W.M.A shift from cell cultures to creatures: monitoring anti-angiogenic therapy in colorectal cancer murine model using dynamic contrast-enhanced MRI- comparing pixel-by-pixel with region of interest analysis. Technol Cancer Res Treat 12,7, 2012 [DOI] [PubMed] [Google Scholar]
- 31.Huang S.Y., Chen B.B., Lu H.Y., Lin H.H., Wei S.Y., Hsu S.C., et al. Correlation among DCE-MRI measurements of bone marrow angiogenesis, microvessel density, and extramedullary disease in patients with multiple myeloma. Am J Hematol 87,837, 2012 [DOI] [PubMed] [Google Scholar]
- 32.O'Connor JPB, Jackson A., Parker GJM, and Jayson G.C.DCE-MRI biomarkers in the clinical evaluation of antiangiogenic and vascular disrupting agents. Br J Cancer 96,189, 2007 [DOI] [PMC free article] [PubMed] [Google Scholar]
- 33.Van Der Zande M., Sitharaman B., Walboomers X.F., Tran L., Ananta J.S., Veltien A., et al. In vivo magnetic resonance imaging of the distribution pattern of gadonanotubes released from a degrading poly (lactic-co-glycolic acid) scaffold. Tissue Eng Part C Methods 17,19, 2010 [DOI] [PubMed] [Google Scholar]
- 34.Sitharaman B., Van Der Zande M., Ananta J.S., Shi X., Veltien A., Walboomers X.F., et al. Magnetic resonance imaging studies on gadonanotube, reinforced biodegradable polymer nanocomposites. J Biomed Mater Res Part A 93,1454, 2010 [DOI] [PubMed] [Google Scholar]
- 35.Viator J.A., Komadina J., Svaasand L.O., Aguilar G., Choi B., and Nelson J.S.A comparative study of photoacoustic and reflectance methods for determination of epidermal melanin content. J Invest Dermatol 122,1432, 2004 [DOI] [PubMed] [Google Scholar]
- 36.Zhang H.F., Maslov K., Sivaramakrishnan M., Stoica G., and Wang L.V.Imaging of hemoglobin oxygen saturation variations in single vessels in vivo using photoacoustic microscopy. Appl Phys Lett 90,053901, 2007 [Google Scholar]
- 37.Cai X., Hu S., Paratala B., Sitharaman B., and Wang L.V.Dual-mode photoacoustic microscopy of carbon nanotube incorporated scaffolds in blood and biological tissues. Photons Plus Ultrasound Imaging Sensing 7899,2I, 2011 [Google Scholar]
- 38.Pramanik M., Song K.H., Swierczewska M., Green D., Sitharaman B., and Wang L.V.In vivo carbon nanotube-enhanced non-invasive photoacoustic mapping of the sentinel lymph node. Phys Med Biol 54,3291, 2009 [DOI] [PMC free article] [PubMed] [Google Scholar]
- 39.Xiang L., Yuan Y., Xing D., Ou Z., Yang S., and Zhou F.Photoacoustic molecular imaging with antibody-functionalized single-walled carbon nanotubes for early diagnosis of tumor. J Biomed Opt 14,021007, 2009 [DOI] [PubMed] [Google Scholar]
- 40.Emelianov S.Y., Li P.C., and O'Donnell M.Photoacoustics for molecular imaging and therapy. Phys Today 62,34, 2009 [DOI] [PMC free article] [PubMed] [Google Scholar]
- 41.Hu S., Maslov K., and Wang L.V.Three-dimensional optical-resolution photoacoustic microscopy. J Vis Exp 3,55, 2011 [DOI] [PMC free article] [PubMed] [Google Scholar]
- 42.Aguirre A., Guo P., Gamelin J., Yan S., Sanders M.M., Brewer M., et al. Coregistered three-dimensional ultrasound and photoacoustic imaging system for ovarian tissue characterization. J Biomed Opt 14,054014, 2009 [DOI] [PMC free article] [PubMed] [Google Scholar]
- 43.Bayer C.L., Joshi P.P., and Emelianov S.Y.Photoacoustic imaging: a potential tool to detect early indicators of metastasis. Expert Rev Med Devices 10,125, 2013 [DOI] [PMC free article] [PubMed] [Google Scholar]
- 44.Emelianov S., Wang B., Su J., Karpiouk A., Yantsen E., Sokolov K., et al. Intravascular ultrasound and photoacoustic imaging. Conf Proc IEEE Eng Med Biol Soc 2008,2, 2008 [DOI] [PubMed] [Google Scholar]
- 45.Mehrmohammadi M., Yoon S.J., Yeager D., and Emelianov S.Y.Photoacoustic Imaging for Cancer Detection and Staging. Curr Mol Imaging 2, 89–105, 2013 [DOI] [PMC free article] [PubMed] [Google Scholar]
- 46.Nam S.Y., Ricles L.M., Suggs L.J., and Emelianov S.Y.In vivo ultrasound and photoacoustic monitoring of mesenchymal stem cells labeled with gold nanotracers. PLoS One 7,e37267, 2012 [DOI] [PMC free article] [PubMed] [Google Scholar]
- 47.Sethuraman S., Aglyamov S.R., Amirian J.H., Smalling R.W., and Emelianov S.Y.Intravascular photoacoustic imaging using an IVUS imaging catheter. IEEE Trans Ultrason Ferroelectr Freq Control 54,978, 2007 [DOI] [PubMed] [Google Scholar]
- 48.Shi X., Sitharaman B., Pham Q.P., Liang F., Wu K., Edward Billups W., et al. Fabrication of porous ultra-short single-walled carbon nanotube nanocomposite scaffolds for bone tissue engineering. Biomaterials 28,4078, 2007 [DOI] [PMC free article] [PubMed] [Google Scholar]
- 49.Lalwani G., Henslee A.M., Farshid B., Lin L., Kasper F.K., Qin Y-X, et al. Two-dimensional nanostructure-reinforced biodegradable polymeric nanocomposites for bone tissue engineering. Biomacromolecules 14,900, 2013 [DOI] [PMC free article] [PubMed] [Google Scholar]
- 50.Lalwani G., Kwaczala A.T., Kanakia S., Patel S.C., Judex S., and Sitharaman B.Fabrication and characterization of three-dimensional macroscopic all-carbon scaffolds. Carbon N Y 53,90, 2013 [DOI] [PMC free article] [PubMed] [Google Scholar]
- 51.Li C., Wang L.V.Photoacoustic tomography and sensing in biomedicine. Phys Med Biol 54,R59, 2009 [DOI] [PMC free article] [PubMed] [Google Scholar]
- 52.Shi X.F., Sitharaman B., Pham Q.P., Spicer P.P., Hudson J.L., Wilson L.J., et al. In vitro cytotoxicity of single-walled carbon nanotube/biodegradable polymer nanocomposites. J Biomed Mater Res Part A 86A,813, 2008 [DOI] [PubMed] [Google Scholar]
- 53.Sitharaman B., Shi X.F., Walboomers X.F., Liao H.B., Cuijpers V., Wilson L.J., et al. In vivo biocompatibility of ultra-short single-walled carbon nanotube/biodegradable polymer nanocomposites for, bone tissue engineering. Bone 43,362, 2008 [DOI] [PubMed] [Google Scholar]
- 54.Shi X., Hudson J.L., Spicer P.P., Tour J.M., Krishnamoorti R., and Mikos A.G.Injectable nanocomposites of single-walled carbon nanotubes and biodegradable polymers for bone tissue engineering. Biomacromolecules 7,2237, 2006 [DOI] [PubMed] [Google Scholar]
- 55.Sitharaman B., Shi X., Tran L.A., Spicer P.P., Rusakova I., Wilson L.J., et al. Injectable in situ cross-linkable nanocomposites of biodegradable polymers and carbon nanostructures for bone tissue engineering. J Biomater Sci Polymer Edition 18,655, 2007 [DOI] [PubMed] [Google Scholar]
- 56.Avti P.K., Hu S., Favazza C., Mikos A.G., Jansen J.A., Shroyer K.R., et al. Detection, mapping, and quantification of single walled carbon nanotubes in histological specimens with photoacoustic microscopy. PloS One 7,e35064, 2012 [DOI] [PMC free article] [PubMed] [Google Scholar]
- 57.König K.Multiphoton microscopy in life sciences. J Microsc 200,83, 2000 [DOI] [PubMed] [Google Scholar]
- 58.De La Zerda A., Zavaleta C., Keren S., Vaithilingam S., Bodapati S., Liu Z., et al. Carbon nanotubes as photoacoustic molecular imaging agents in living mice. Nat Nanotechnol 3,557, 2008 [DOI] [PMC free article] [PubMed] [Google Scholar]
- 59.Cai X., Zhang Y., Li L., Choi S.W., MacEwan M.R., Yao J., et al. Investigation of neovascularization in three-dimensional porous scaffolds in vivo by a combination of multiscale photoacoustic microscopy and optical coherence tomography. Tissue Eng Part C Methods 19,196, 2012 [DOI] [PMC free article] [PubMed] [Google Scholar]
- 60.Maslov K., Zhang H.F., Hu S., and Wang L.V.Optical-resolution photoacoustic microscopy for in vivo imaging of single capillaries. Opt Lett 33,929, 2008 [DOI] [PubMed] [Google Scholar]
- 61.Chen Q., Chen H., Zheng D., Kuang C., Fang H., Zou B., et al. Smad7 is required for the development and function of the heart. J Biol Chem 284,292, 2009 [DOI] [PMC free article] [PubMed] [Google Scholar]
- 62.Chance B., Borer E., Evans A., Holtom G., Kent J., Maris M., et al. Optical and Nuclear Magnetic Resonance Studies of Hypoxia in Human Tissue and Tumors. Ann N Y Acad Sci 551,1, 1988 [DOI] [PubMed] [Google Scholar]
- 63.Kim S., Chen Y.S., Luke G.P., and Emelianov S.Y.In vivo three-dimensional spectroscopic photoacoustic imaging for monitoring nanoparticle delivery. Biomed Opt Expr 2,2540, 2011 [DOI] [PMC free article] [PubMed] [Google Scholar]
- 64.Koo V., Hamilton P., and Williamson K.Non-invasive in vivo imaging in small animal research. Anal Cell Pathol 28,127, 2006 [DOI] [PMC free article] [PubMed] [Google Scholar]