

Abstract
Background
This study compared the effects of short-term titrated colestilan (a novel non-absorbable, non-calcium, phosphate binder) with placebo, and evaluated the safety and efficacy of colestilan over 1 year compared with sevelamer, in patients with chronic kidney disease (CKD) 5D.
Methods
This prospective multicentre study comprised a 4-week phosphate binder washout period, a 16-week short-term, flexible-dose, treatment period (including a 4-week placebo-controlled withdrawal period) and a 40-week extension treatment phase.
Results
At Week 16 (the end of the 4-week placebo-controlled withdrawal period), serum phosphorus level was 0.43 mmol/L (1.32 mg/dL) lower with colestilan than placebo (P < 0.001; primary end point). Serum LDL-C level was also lower with colestilan than with placebo (P < 0.001). Both colestilan and sevelamer produced significant reductions from baseline in serum phosphorus levels (P < 0.001), maintained for 1 year, and the proportion of patients achieving target levels of ≤1.78 mmol/L (5.5 mg/dL) or ≤1.95 mmol/L (6.0 mg/dL) at study end were similar (65.3 and 73.3%, respectively, for colestilan, and 66.9 and 77.4%, respectively, for sevelamer). Serum calcium level remained stable in the colestilan group but tended to increase slightly in the sevelamer group (end-of-study increase of 0.035 mmol/L over baseline). Both binders produced similar reductions from baseline in LDL-C level (P < 0.001), and responder rates after 1 year, using a target of <1.83 mmol/L (70 mg/dL) or <2.59 mmol/L (100 mg/dL) were similar in both groups (50.7 and 85.3% for colestilan and 54.0 and 80.6% for sevelamer). Colestilan was generally well tolerated.
Conclusions
Colestilan is effective and safe for the treatment of hyperphosphataemia in patients with CKD 5D, and affords similar long-term phosphorus and cholesterol reductions/responder rates to sevelamer.
Keywords: chronic kidney disease, colestilan, hyperphosphataemia, placebo, sevelamer
INTRODUCTION
In patients with chronic kidney disease (CKD), hyperphosphataemia plays a role in the development of secondary hyperparathyroidism, CKD-bone mineral disorder and soft tissue and vascular calcification [1–3], and is associated with an increased risk of cardiovascular disease and death [4, 5]. Treatment with oral phosphate binders, which act by binding dietary phosphate in the intestines to prevent its absorption, often forms part of the management strategy to reduce and control serum phosphorus levels in patients with advanced CKD [6]. Data from observational studies suggest that the use of phosphate binders prolongs survival in patients receiving haemodialysis [7–9].
Phosphate binders are theoretically all effective at lowering phosphorus levels. However, factors such as pill burden and compliance impact on the efficacy achieved in practice, and other characteristics, such as safety and tolerability, or additional beneficial effects, may help determine the choice of agent [10]. For example, it has been reported on many occasions that calcium-based phosphate binders can increase the risk of calcium overload and vascular calcification [2, 11, 12], whereas non-calcium-based phosphate binders such as sevelamer or lanthanum reduce the risk of hypercalcaemia [13], and potentially of vascular calcification [14–16].
Sevelamer has also been shown to improve the lipid profile in patients with CKD on dialysis (CKD 5D) compared with calcium-based binders [17, 18]. Dyslipidaemia is common in patients with CKD, and may contribute to the risk of cardiovascular disease in some patients [19]. Moreover, CKD is itself considered to be a coronary heart disease risk-equivalent, and it is recommended that lipid disorders are treated in such patients [20–22].
Colestilan is a new, non-absorbable, non-calcium, non-metal, anion-exchange resin that binds both phosphorus and bile acids in the gastrointestinal tract [23]. Short-term, fixed-dose, phase III clinical trials in dialysis patients have shown that colestilan is effective at lowering both serum phosphorus and low-density lipoprotein levels [24].
The current study was undertaken to evaluate the effects of short-term titrated colestilan versus placebo on serum phosphorus and lipid levels in patients with CKD 5D, and to evaluate the safety and efficacy of colestilan over a 1-year period with sevelamer as a comparator arm. The study comprised two main parts. The primary aim of the initial short-term phase (where, following a 12-week open-label titration period, patients were randomized in a double-blind manner to continue on colestilan treatment or swap to placebo) was to demonstrate that colestilan was superior to placebo in the control of serum phosphorus levels in patients with CKD 5D and hyperphosphataemia. The primary aim of the subsequent extension phase was to evaluate the long-term safety and tolerability of colestilan. Secondary aims included an assessment of the long-term efficacy of colestilan with regard to hyperphosphataemia and dyslipidaemia, and a comparison of the efficacy and safety of colestilan with that of sevelamer. The current report focuses on efficacy data; long-term safety and tolerability data will be presented in a separate paper.
MATERIALS AND METHODS
Study design and setting
This prospective, multicentre study comprised a 16-week short-term treatment phase (incorporating a 12-week flexible-dose treatment period followed by 4-week placebo-controlled withdrawal period) and a 40-week long-term extension treatment phase. The primary aim of the short-term phase was to compare colestilan with placebo during the placebo-controlled withdrawal period (Figure 1). The primary aim of the extension treatment phase was to evaluate the long-term safety of colestilan; efficacy was assessed as a secondary end point.
FIGURE 1:
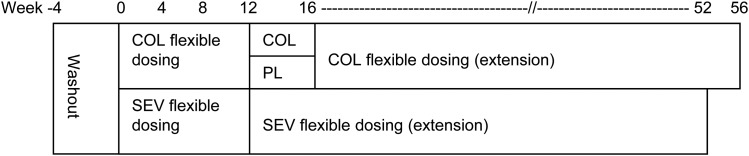
Study design (COL = colestilan, PL = placebo, SEV = sevelamer).
After a 4-week phosphate binder washout period, patients were randomized 1:1 to receive 12 weeks of open-label treatment with colestilan or sevelamer. Patients in the colestilan group who completed the open-label period were re-randomized to either continue on the same dose of colestilan or switch to placebo for a 4-week, double-blind, placebo-controlled withdrawal period. All patients who completed the short-term phase were eligible to enter the 40-week extension phase, meaning that patients were exposed to colestilan for up to either 52 or 56 weeks in total, or to sevelamer for up to 52 weeks.
During the initial titration period, the starting dose of colestilan was 6 g/day (i.e. 6 tablets, 2 tablets t.i.d.). Titration up or down was allowed every 3 weeks within the range 3–15 g/day (using 3 g increments) with the aim of achieving and maintaining serum phosphorus levels between 1.13 mmol/L (3.5 mg/dL) and 1.78 mmol/L (5.5 mg/dL). The starting dose of sevelamer was 2.4 g/day (i.e. 3 tablets) if serum phosphorus was ≤2.42 mmol/L (7.5 mg/dL) or 4.8 g/day (i.e. 6 tablets) if serum phosphorus was >2.42 mmol/L (7.5 mg/dL), with titration up or down between 2.4 and 12 g/day. During the extension phase, patients who had been on sevelamer in the short-term phase continued on the same dose, while patients who had originally been in the colestilan group started on colestilan 6 g/day. For both groups, dose titration was allowed every 2 weeks for the first 8 weeks of the extension and then 4-weekly, to maintain serum phosphorus levels ≤1.78 mmol/L (5.5 mg/dL).
The study was performed at 69 sites in Australia, Austria, the Czech Republic, France, Germany, Hungary, Italy, Poland, South Africa, Spain and the United Kingdom.
Patients were randomized according to a centrally generated randomization code, which was designed per centre to ensure each site enrolled approximately equal numbers to each treatment group.
The study was conducted in accordance with the principles of the Declaration of Helsinki, and the International Conference on Harmonisation (ICH) guidelines on Good Clinical Practice (GCP), and was approved by the relevant Independent Ethics Committee for each site. All patients provided their written informed consent before entering the study. The study was registered in the EudraCT database (2006-003323-37).
Patients
The study enrolled male or females aged ≥18 years of age with CKD 5D. Patients had to have stable phosphate control using phosphate-binding medication for at least 1 month prior to screening, and to have a serum phosphorus level <2.42 mmol/L (7.5 mg/dL) at screening. The calcium dialysate content had to be between 2 and 3.5 mEq/L and to remain constant throughout the study. Furthermore, to qualify for randomization serum phosphorus had to be ≥1.94 mmol/L (6.0 mg/dL) and at least 15% greater than at screening, after both 2 and 3 weeks of phosphate binder washout, or ≥2.58 mmol/L (8.0 mg/dL) and at least 15% greater than at screening after 1 week of washout.
The main exclusion criteria were: clinically significant medical comorbidities which could substantially compromise patient safety or interfere with study procedures, serum albumin level <30.0 g/L, intact parathyroid hormone (iPTH) levels consistently/frequently >1000 pg/mL, body mass index (BMI) ≤16.0 or ≥40.0 kg/m2, a history of significant gastrointestinal abnormalities including motility problems or major gastrointestinal surgery, biliary obstruction or proven liver dysfunction or liver function tests three times the upper limit of normal for at least two of alanine aminotransferase, aspartate aminotransferase and gamma-glutamyl transferase.
Study end points
The primary end point of the short-term phase was the change in serum phosphorus level in the colestilan and placebo groups during the placebo-controlled withdrawal period (Week 12 to Week 16). Secondary end points included changes in other efficacy parameters (including calcium, calcium × phosphorus ion product [Ca × P], iPTH, lipid parameters and uric acid) and safety parameters during the placebo-controlled withdrawal period, and changes in serum phosphorus level in the colestilan and sevelamer groups during the open-label titration period (baseline to Week 12). Glycosylated haemoglobin (HbA1c) was also evaluated.
The primary end point for the long-term extension was the incidence of adverse events (AEs) and changes in safety parameters with colestilan and sevelamer. Efficacy parameters were evaluated as secondary end points.
Sample size
For the primary end point (change in serum phosphorus level during the placebo-controlled withdrawal period), 22 subjects per group were required, assuming a difference between colestilan and placebo of ≥0.5 mmol/L (1.5 mg/dL) with a standard deviation (SD) of 0.5 mmol/L, a 10% dropout rate, a significance level set at 5% and statistical power of 80%. For the comparison of colestilan and sevelamer during the active comparator phase, 160 subjects per group were required, assuming the lower bound of the 90% confidence interval (CI) for the difference in change in serum phosphorus level was at least −0.15 mmol/L (−0.50 mg/dL) with a SD of 0.5 mmol/L, a significance level of 5%, a power of 80% and a 30% dropout rate.
Statistical analysis
For the short-term phase, the primary efficacy analysis was performed on the intent-to-treat population. Change in serum phosphorus from Week 12 to Week 16 (or last observation carried forward; LOCF) was analysed using analysis of covariance (ANCOVA), with treatment and centre as factors, and Week 12 serum phosphorus level as a covariate. Secondary end points were analysed using the same ANCOVA model. Tests of superiority were two-sided and at the 5% significance level; differences between groups were presented with 95% CI. During the short-term phase, a comparison of colestilan and sevelamer tested for non-inferiority as a secondary end point; if the upper limit of the 90% CI for the difference between the drugs for change in serum phosphorus from baseline to Week 12 (LOCF) was less than +0.15 mmol/L (0.5 mg/dL) then colestilan could be regarded as non-inferior to sevelamer. Responder analyses were also performed.
For the long-term extension, efficacy and safety variables were summarized using descriptive statistics. Changes from baseline of the short-term phase to the end of the extension phase were assessed for statistical significance (two-sided at 5% level) using a paired t-test. Responder analyses were also performed.
RESULTS
The disposition of the patients who participated in the study is shown in Figure 2. A total of 336 patients were randomized in the short-term phase, 244 of whom completed the open-label period. Among recipients of colestilan, 104 were re-randomized and 98 completed the placebo-controlled withdrawal period. Overall, 200 patients (124 from the sevelamer group and 76 from the colestilan group) entered the long-term extension and 136 completed this phase.
FIGURE 2:

Patient disposition.
Baseline characteristics at the start of the short-term phase were similar between the groups (Table 1). Overall, most patients were Caucasian, the mean age of the population was 58 years, and there was a higher proportion of males than females (61.9 versus 38.1%). Mean BMI was 27.1 kg/m2, and mean weight before and after dialysis were 77.0 and 74.4 kg, respectively. Characteristics were balanced between the treatment groups. The baseline characteristics of patients who entered the placebo-controlled period were consistent with the initial profile, as were the characteristics of those patients who entered the long-term extension. There were no notable changes in the adequacy of dialysis in any group during the study.
Table 1.
Baseline characteristics
| Parameter | Colestilan (n = 162) | Sevelamer (n = 169) |
|---|---|---|
| Age (years) | ||
| Mean (SD) | 56.4 (14.7) | 59.5 (13.8) |
| Median (range) | 57 (19–88) | 62 (22–89) |
| Age group, n (%) | ||
| <65 years | 118 (72.8) | 102 (60.4) |
| ≥65 years | 44 (27.2) | 67 (39.6) |
| Gender, n (%) | ||
| Male | 108 (66.7) | 97 (57.4) |
| Female | 54 (33.3) | 72 (42.6) |
| Race, n (%) | ||
| Caucasian | 142 (87.7) | 150 (88.8) |
| Black | 10 (6.2) | 10 (5.9) |
| Asian | 6 (3.7) | 2 (1.2) |
| Other | 4 (2.5) | 7 (4.1) |
| BMI (kg/m2) | ||
| Mean (SD) | 26.98 (4.44) | 27.24 (5.32) |
| Median (range) | 26.50 (15.2–37.4) | 26.30 (16.6–41.3) |
| Type of dialysis, n (%) | ||
| Haemodialysis | 151 (94.4) | 159 (95.2) |
| Peritoneal dialysis | 9 (5.6) | 8 (4.8) |
| Diabetic status, n (%) | ||
| Diabetes mellitus | 47 (29.0) | 51 (30.2) |
| No diabetes | 115 (71.0) | 118 (69.8) |
BMI, body mass index; SD, standard deviation.
All but one patient had been receiving phosphate binder therapy prior to the study; 67.6% had been taking one binder and 32.1% more than one binder. The most commonly used pre-study phosphate binders were calcium-based (71.3% of the colestilan group and 77.8% of the sevelamer group), followed by sevelamer (26.9% of the colestilan group and 32.3% of the sevelamer group). Pre-existing lipid-modifying therapy was continued by 41 and 49% of the colestilan and sevelamer groups during the short-term phase. At the start of the long-term extension, 24% of the colestilan group and 50% of the sevelamer group were taking lipid-modifying agents.
Phosphorus and calcium levels
At the end of the placebo-controlled withdrawal period (Week 16), the mean serum phosphorus level was significantly lower with colestilan than placebo (P < 0.001); Figure 3. Serum phosphorus increased in patients who switched to placebo for this period, whereas there was minimal change among those who remained on colestilan (mean between-group difference −1.32 mg/dL or 0.43 mmol/L; 95% CI −1.87, −0.78). Calcium level did not alter in the colestilan group and there was no significant difference compared with placebo for change in serum calcium at Week 16. Ca × P was lower by 0.9 mmol/L in the colestilan group compared with placebo (P < 0.001) and iPTH was lowered by 7.09 pmol/L compared with placebo (P < 0.03); Figure 3.
FIGURE 3:

Calcium–phosphorus metabolism: change in serum levels of key parameters with colestilan (n = 50) versus placebo (n = 53) at the end of the placebo-controlled withdrawal period (Week 12 to Week 16) [ITT].
The efficacy of colestilan and sevelamer were compared as a secondary end point. Both colestilan and sevelamer produced a significant reduction from baseline in mean serum phosphorus level, which was maintained for up to 1 year (P < 0.001); Figure 4. Colestilan reduced serum phosphorus from 2.22 mmol/L (6.9 mg/dL) to 1.73 mmol/L (5.37 mg/dL) and sevelamer from 2.36 mmol/L (7.32 mg/dL) to 1.61 mmol/L (5.0 mg/dL) by the end of the study, for the population that completed the study. The mean change from baseline for the two phosphate binders was −0.47 mmol/L (−1.47 mg/dL) and −0.73 mmol/L (−2.26 mg/dL) for colestilan and sevelamer, respectively: both reductions were highly significant changes from baseline (P < 0.001 in both cases). The responder rates achieved with colestilan were similar to those seen with sevelamer, whether using 1.78 or 1.95 mmol/L as cut-off points for responder analyses. Responder rates were 65.3% for colestilan versus 66.9% for sevelamer with a cut-off of 1.78 mmol/L, and 73.3% for colestilan and 77.4% for sevelamer with 1.95 mmol/L as the cut-off (Figure 5). However, due to the study design, in the initial short-term phase, the non-inferiority of colestilan to sevelamer could not be concluded according to the pre-specified criteria (mean change from baseline during the open-label period was −0.42 mmol/L (−1.30 mg/dL) for the colestilan group and −0.72 mmol/L (–2.22 mg/dL) for the sevelamer group).
FIGURE 4:

Mean serum phosphorus levels during 1 year of treatment with colestilan (n = 75) or sevelamer (n = 124) [ITT] (Error bars indicate standard deviation).
FIGURE 5:

Serum phosphorus responder rates after 1 year of treatment with colestilan versus sevelamer [ITT].
Baseline serum calcium levels were similar in the colestilan and sevelamer groups. During the study, calcium levels tended to be lower with colestilan than with sevelamer, largely because serum calcium tended to increase from baseline in the sevelamer group but not in the colestilan group (Figure 6). After 1 year, calcium had decreased by 0.02 mmol/L (from a baseline of 2.166 mmol/L) in the colestilan group but increased by 0.035 mmol/L (from baseline 2.190 mmol/L) in the sevelamer group.
FIGURE 6:

Mean serum calcium levels during 1 year of treatment with colestilan (n = 75) versus sevelamer (n = 124) [ITT].
Mean serum iPTH levels decreased from baseline to Week 12 in both colestilan and sevelamer groups. However, these reductions were not maintained with long-term colestilan or sevelamer treatment. There was an overall trend for mean serum iPTH to increase. At Week 40 (LOCF), small mean increases from baseline in serum iPTH were observed in both treatment groups; 7.1 pmol/L for the colestilan-treated group (P < 0.3 versus baseline) and 0.9 pmol/L for sevelamer (P = not significant). In the colestilan group, mean alkaline phosphatase increased from 77.9 U/L at baseline to 115.7 U/L at study end (mean change of +39.6 U/L). In the sevelamer group, mean alkaline phosphatase increased from 77.7 U/L at baseline to 115.5 U/L at study end (mean change +38.1 U/L).
Lipid levels
At the end of the placebo-controlled withdrawal period, the mean serum low-density lipoprotein cholesterol (LDL-C) level was significantly lower in the colestilan group than in the group that switched to placebo (P < 0.001). Serum LDL-C increased in the placebo group, whereas it remained relatively stable in the colestilan group, giving a difference in the per cent change in LDL-C level of −71.1%; Figure 7. Total cholesterol level was also lower with colestilan compared with placebo (difference of −35.1%; P < 0.001), but there were no significant differences in the levels of high-density lipoprotein cholesterol (HDL-C) or triglycerides between the groups; Figure 7.
FIGURE 7:

Serum lipid levels: mean % change with colestilan (n = 50) versus placebo (n = 53) at the end of the placebo-controlled withdrawal period (Week 12 to Week 16) [ITT].
Both colestilan and sevelamer produced reductions from baseline in serum LDL-C which were maintained for up to 1 year (P < 0.001; Figures 8 and 9). At Week 12 in the short-term phase, the decrease was greater with colestilan than sevelamer (P < 0.05), and the proportions of patients who achieved an LDL-C level <1.83 mmol/L (70 mg/dL) or <2.59 mmol/L (100 mg/dL) were 50.0 and 91.9% for colestilan versus 50.8 and 87.9% for sevelamer. The proportions of responders remained similar with colestilan (50.7 and 85.3%) and sevelamer (54.0 and 80.6%) during long-term treatment.
FIGURE 8:

Mean % change from baseline in serum LDL-C level during 1 year of treatment with colestilan (n = 75) versus sevelamer (n = 124) [ITT].
FIGURE 9:

Serum lipid levels: mean % change after 1 year of treatment with colestilan (n = 75) versus sevelamer (n = 124) [ITT].
Colestilan and sevelamer both reduced total cholesterol level; the change was greater with colestilan at Week 12 in the short-term phase study (difference between means −6.81%; P < 0.001), but was fairly similar in both groups after 1 year (Figure 9). Levels of HDL-C did not change significantly during the 12 weeks of treatment with colestilan or sevelamer, but increased slightly in both groups during long-term treatment (Figure 9). There were no clear changes in the level of triglycerides during the 12 weeks of treatment with either colestilan or sevelamer; after 1 year, triglycerides had decreased in the colestilan group compared with a minimal increase in the sevelamer group (Figure 9).
Other parameters
During the placebo-controlled withdrawal period there was no notable change in mean HbA1c with either colestilan or placebo (Table 2). During treatment with colestilan or sevelamer, mean HbA1c decreased slightly, and to a similar extent, in both groups after 12 weeks and after 1 year (Table 2). The decrease was observed primarily in those patients who had a baseline HbA1c of ≥7.0% (Table 3).
Table 2.
Changes in HbA1c and uric acid during the study
| Placebo-controlled period | Colestilan (n = 50) | Placebo (n = 53) | P (between-group) |
|---|---|---|---|
| HbA1c (%)a | |||
| Baseline (Week 12) | 5.58 | 5.79 | |
| Change at Week 16 | −0.01 | +0.05 | – |
| Uric acid (μmol/L) | |||
| Baseline (Week 12) | 359.4 | 347.3 | |
| Change at Week 16 | −8.72 | +46.26 | <0.001 |
| Active-controlled period | Colestilan (n = 160) | Sevelamer (n = 167) | |
| HbA1c (%)a | |||
| Baseline (Week 0) | 6.02bb/5.97c | 6.11b/6.12c | |
| Change at Week 12d | −0.24 | −0.32 | – |
| Change at Week 52–56e | −0.41 | −0.37 | – |
| Uric acid (μmol/L) | |||
| Baseline (Week 0) | 399.5b/413.0c | 385.2b/386.7c | |
| Change at Week 12d | −38.87 | −27.77 | 0.075 |
| Change at Week 52–56e | −66.68f | −26.59f | – |
aStatistical analysis was not performed for HbA1c.
bBaseline value for patients randomized into short-term phase (colestilan 160, sevelamer 167).
cBaseline for patients who participated in both the short-term and extension phases (colestilan 75, sevelamer 124).
dChange from baseline for patients randomized into the short-term phase.
eChange from baseline for patients who participated in both the short-term and extension phases.
fP < 0.001 versus baseline.
Table 3.
Mean change from baseline in HbA1c after 1 year by baseline HbA1c level
| Baseline HbA1c category | Mean (SD) serum HbA1c (mg/dL) |
|
|---|---|---|
| Colestilan (n = 76) | Sevelamer (n = 124) | |
| <7.0% total haemoglobin | ||
| n = 64 | n = 102 | |
| Baseline | 5.68 (0.58) | 5.74 (0.59) |
| End of study | 5.37 (0.53) | 5.54 (0.52) |
| Mean change | –0.30 (0.64) | –0.20 (0.53) |
| ≥7.0% total haemoglobin | ||
| n = 11 | n = 22 | |
| Baseline | 7.63 (0.59) | 7.87 (1.11) |
| End of study | 6.50 (0.71) | 6.73 (1.07) |
| Mean change | –1.08 (0.77) | –1.14 (1.13) |
SD, standard deviation.
At the end of the placebo-controlled withdrawal period, serum uric acid level had decreased in the colestilan group but not in the placebo group (difference −54.98 μmol/L; P < 0.001; Table 3). Uric acid levels decreased to a similar extent with colestilan and sevelamer after 12 weeks' treatment. After 1 year, the mean reduction from baseline in uric acid level was numerically greater with colestilan (−66.68 μmol/L; P < 0.001) than with sevelamer (−26.59 μmol/L; P < 0.001), although a between-group statistical comparison was not performed.
Tolerability and safety
There was no notable difference in the incidence of treatment-emergent AEs reported with colestilan and placebo (42.0 versus 45.3%). There were no notable differences between colestilan and sevelamer in terms of the overall incidence of treatment-emergent AEs during the titration period of the short-term phase (84.0 versus 77.5%) or during long-term treatment of up to 1 year (Table 4). AEs that led to discontinuation of either study medication were generally related to the gastrointestinal system, including diarrhoea, abdominal pain, vomiting and nausea.
Table 4.
Adverse events from baseline to end of extension
| Category | Colestilan (n = 76) | Sevelamer (n = 124) |
|---|---|---|
| At least one TEAE | ||
| Patients, n (%) | 76 (100.0) | 116 (93.5) |
| Events, n | 692 | 935 |
| At least one serious TEAE | ||
| Patients, n (%) | 31 (40.8) | 48 (38.7) |
| Events, n | 69 | 96 |
| At least one treatment-related TEAE | ||
| Patients, n (%) | 33 (43.4) | 40 (32.3) |
| Events, n | 68 | 72 |
| At least one severe TEAE | ||
| Patient, n (%) | 17 (22.4) | 22 (17.7) |
TEAE, treatment-emergent adverse event.
In terms of daily doses and number of tablets, from this long-term study, it is possible to quantitate, in an approximate way, the dosage of binders needed to produce an equivalent reduction in serum phosphate. At Week 16, when a virtually identical reduction in serum phosphate was produced, the doses of drugs used were 10.6 g/day for colestilan and 8.2 g/day for sevelamer. Owing to the two medications' differential quantity of drug per tablet, this effectively results in the same number of tablets/day. In the completer population at the end of the study, these figures were 11.6 and 8.4 g, respectively.
DISCUSSION
Hyperphosphataemia in patients with CKD 5D is associated with increased morbidity and mortality, and the reduction of an elevated serum phosphorus level is considered beneficial [6]. Furthermore, metabolic disturbances such as dyslipidaemia, impaired glucose control and hyperuricaemia may also be associated with an increased risk of cardiovascular morbidity in CKD patients, and correcting these abnormalities could be appropriate in some patients [19, 25–28]. Most patients with advanced CKD need medication, in the form of phosphate binders, to help control their phosphorus levels. However, hypercalcaemia can be a concern with calcium-based binders [2, 11]. Furthermore, some calcium-free phosphate binders, including sevelamer and the new binder colestilan, exert beneficial effects on other parameters, such as lipids [17, 24], which could be a useful additional therapeutic feature for some CKD patients.
The current study incorporated a short-term comparison of the efficacy of colestilan versus placebo and a long-term comparison with sevelamer (in which efficacy was a secondary end point). It showed that colestilan, a novel non-absorbable, calcium-free, anion-exchange resin phosphate binder, was superior to placebo at controlling serum phosphorus levels in patients receiving dialysis. Furthermore, the reductions in serum phosphorus seen with colestilan were maintained during 1 year of treatment, and the proportion of patients achieving target serum phosphorus levels at the end of the study was similar with colestilan and sevelamer.
During the placebo-withdrawal period, the reduction in mean serum phosphorus level that had been achieved during the preceding 12-week dose titration period was maintained in patients who continued to receive colestilan, whereas the phosphorus-lowering effect was lost in those who switched to placebo. There was no significant difference in serum calcium levels between the colestilan and placebo groups during the placebo-withdrawal period, confirming that colestilan did not alter serum calcium levels. In addition, serum total cholesterol and LDL-C levels, which had decreased during colestilan titration, were significantly lower among patients who continued on colestilan than among those who switched to placebo. These findings are consistent with the results from previous studies with colestilan [24, 29].
High serum levels of phosphorus are associated with an increased risk of morbidity and mortality in patients with CKD [4, 30–33]. Although there is a lack of data from large randomized trials to show that treating hyperphosphataemia reduces the risk of death in patients with kidney failure, observational data from DOPPS and the COSMOS study suggest that phosphate binder treatment is associated with a reduced risk of death in patients on dialysis [8, 9], as does a prospective cohort study of incident haemodialysis patients [7]. Furthermore, a small randomized study in non-dialysis patients found that sevelamer improved survival compared with calcium-based binders [34]. To achieve a noticeable benefit in major outcomes, reductions in serum phosphorus levels need to be sustained over the long-term. In the current study, both colestilan and sevelamer produced statistically and clinically significant reductions from baseline in serum phosphorus levels which were maintained during up to 1 year of treatment.
The optimal target level for serum phosphorus is not known, but it is recommended that serum phosphorus should be reduced ‘toward’ a level of 1.13–1.78 mmol/L (3.5–5.5 mg/dL) in dialysis patients [6, 35]. It is recognized that this target level may only be achieved in around 60% of patients [36]. After 1 year in the current study, just over 65% of patients in both the colestilan and the sevelamer groups had a phosphorus level ≤1.78 mmol/L (5.5 mg/dL). A level of ≤1.95 mmol/L (6.0 mg/dL) was achieved by more than 70% of both groups.
Calcium-based phosphate binders can be associated with hypercalcaemia and an increased risk of vascular calcification [2, 11]. Calcium-free binders, such as sevelamer and lanthanum, may reduce the risk of hypercalcaemia and the progression of vascular calcification [13–16]. The new calcium-free binder colestilan also reduces the risk of hypercalcaemia and thus possibly the progression of vascular calcifications. In the current study, serum calcium levels remained stable in the colestilan group throughout the 1-year study period. Interestingly, calcium levels tended to increase slightly in the sevelamer group during the same period. Both sevelamer and colestilan are non-absorbable, calcium-free, anion-exchange resins; nonetheless, there may be differences in the actions of these agents. Sevelamer is generally associated with a reduction in serum calcium levels and the risk of hypercalcaemia compared with calcium-based binders [13, 37], and some studies suggest it reduces vascular calcification [14, 15]. However, the differences seen in the present study could have a clinical impact, and further evaluation in controlled trials may be worthwhile.
Lipid profile is known to be altered in advanced CKD. CKD 5D patients usually display increased concentrations of intact or partially metabolized triglyceride-rich lipoproteins, reduced serum levels of HDL-cholesterol and elevated concentrations of Lp(a). The subfractionation of apolipoprotein B-containing lipoproteins usually reveals a predominance of small, dense LDL particles with a dysregulation of the synthesis and activity of HDL leading to decreased plasma levels [38]. In addition the anti-inflammatory functions of HDL (such as its ability to inhibit LDL oxidation) are defective in these patients [39]. More than half of dialysis patients have a level of LDL-C ≥2.59 mmol/L (100 mg/dL) [20]. Although several studies have failed to show a benefit for lowering LDL-C in haemodialysis patients in terms of major clinical outcomes, one study found that simvastatin/ezetimibe reduced major atherosclerotic events by 17% in CKD patients [19].
In the current study, both colestilan and sevelamer were associated with significant reductions in serum total cholesterol and LDL-C levels during long-term treatment, and after 1 year a serum LDL-C level <2.59 mmol/L (100 mg/dL) was achieved in more than 50% of patients and a level of <1.83 mmol/L (70 mg/dL) in more than 80%. The potential to reduce LDL-C levels without adding a separate medication which would increase the tablet burden could be of use in some CKD patients.
In addition to their lipid-lowering effect, bile acid sequestrants can also affect glycaemic control through their interactions with receptors involved in both lipid and glucose metabolic pathways [40]. In our study, colestilan lowered HbA1c in patients who had a baseline value ≥7.0%, as did sevelamer. Although the number of patients in each subgroup is relatively low (11 and 22) this finding has been noted previously with colestilan [24]. Levels of uric acid also decreased during treatment with colestilan. The mechanism by which colestilan reduces uric acid is not known, but a similar effect was seen with sevelamer in this study. An association between hyperuricaemia and cardiovascular disease has been noted [41, 42], and hyperuricaemia may also adversely affect renal function [43, 44]. Uric acid levels increase with declining renal function, and consequently hyperuricaemia is present in many patients with CKD [43]. However, it is not yet clear what effect reducing uric acid levels has in terms of preventing cardiovascular disease or the progression of renal disease in CKD patients [45].
Colestilan was generally well tolerated during 1 year of treatment, and the overall safety profile was similar for colestilan and sevelamer. AEs were commonly gastrointestinal in nature, which would be consistent with the mode of action of the drugs.
Study limitations
Although this study demonstrates for the first time a long-term reduction in serum phosphorus and LDL-C in CKD 5D patients with hyperphosphataemia treated with colestilan, and indicates no substantial difference in phosphate reduction between colestilan and sevelamer after 1 year, early timepoints did show some difference that could well have been due to the study design. In this study, almost one-third of randomized patients had previously been receiving sevelamer; and thus, it could be considered that the patient pool used was substantially ‘sevelamer-biased’, in that these patients were already known to tolerate sevelamer and were patients for whom sevelamer was an effective treatment. In addition, a substantial percentage of patients were taking multiple therapies for reducing serum phosphate, suggesting that one drug alone would not be sufficient to reduce phosphate to an acceptable level. One other limitation of this study that should be considered is that only part of the study was blinded—the 4-week placebo-withdrawal period. Although these study limitations should be considered alongside the results, it is unlikely that they would alter the overall conclusions, and may well suggest that the study underestimates the effect and the tolerability of colestilan in these patients in comparison to sevelamer.
CONCLUSION
In conclusion, after short-term titration, colestilan produced a significant reduction in serum phosphorus, LDL-C and uric acid levels compared to placebo, while long-term treatment maintained a clinically relevant reduction in serum phosphorus levels for 1 year, and was generally well tolerated. The results with colestilan were generally consistent with those seen with sevelamer. This long-term study indicates that colestilan is a safe and effective treatment for hyperphosphataemia in patients with CKD 5D.
FUNDING
The study was funded by Mitsubishi Pharma Europe Ltd. Editorial assistance was provided by K. Croom, with financial support from Mitsubishi Pharma Europe Ltd.
CONFLICT OF INTEREST STATEMENT
Francesco Locatelli is or was a member of advisory boards for Abbott, Amgen, Genzyme, Mitsubishi Pharma Europe Ltd and Shire.
Goce Spasovski was a member of advisory boards for Mitsubishi Pharma Europe Ltd, and has been supported as a lecturer by Genzyme, Abbott, Shire and Amgen.
Nada Dimkovic was a member of an advisory board for Mitsubishi Pharma Europe Ltd, and has been supported as a lecturer by Genzyme, Baxter, Roche, Fresenius, Cilag.
Christoph Wanner is or was a member of advisory boards or clinical trial steering/monitoring committees for AMAG, Baxter, Boehringer-Ingelheim, Genzyme, Mitsubishi Pharma Europe Ltd, Noxxon, Reata, Roche and Vifor; is or was a consultant to ISRNM, KDIGO, KFH, NKF, Baxter, Boehringer-Ingelheim and Reata; has been supported as a lecturer by Abbott, Amgen, Astellas, Astra-Zeneca, BMS, Fresenius, Genzyme, Mitsubishi Pharma Europe Ltd, MSD and Shire; and has received research grants from Genzyme. See http://www.era-edta.
Frank Dellanna was a member of advisory boards for Mitsubishi Pharma Europe Ltd and has been supported as a lecturer by Roche, Sandoz, FMC, Medice, Shire and Amgen.
Giuseppe Pontoriero None.
ACKNOWLEDGEMENTS
The authors thank all participants and contributors to the study, and in particular the investigators: Austria: Holzer H. (Graz); Australia: Johnson D. (Wooloongabba), Lim W. (Nedlands), Pollock C. (St Leonards), Lian M. (Parkville), Elder G. (Sydney); Czech Republic: Valkovsky I. (Ostrava), Bucek P. (Frydek-Mistek), Dusilova Sulková S. (Hradec Kralove), Suchanova J. (Tabor), Polakovic V. (Praha), Bitterova Z. (Usti nad Labem); France: Fessi H. (Paris), Combe C. (Bordeaux), Canaud B. (Montpellier); Germany: Muehlfeld A. (Aachen), Ketteler M. (Coburg), Dellanna F.H. (Düsseldorf), Schreiber R. (Coesfeld), Menzer T. (Holberg-Efze), Dragoun G.-P. (Ascaffenburg), Brueckner D. (Dortmund), Leistikow F. (Mannheim), Klingbeil A. (Darmstadt), Toussaint K. (Hamburg), Lutz J. (München), Ortwein-Horn N. (Dieburg), Fink H. (Langen); Hungary: Magyar K. (Baja), Zsom M. (Baja), Orosz A. (Budapest), Rozinka A. (Kisvárda), Vörös P. (Budapest), Benke A. (Veszprem); Italy: Locatelli F. (Lecco), Malberti F. (Cremona), Conte F. (Cernusco sul Naviglio), Villa G. (Pavia), Frascà G.M. (Torrette di Ancona), Bigazzi R. (Livorno), Minoretti C. (Como), Spotti D. (Milano), Volmer Bertoli S. (Sesto San Giovanni), Errico R. (Perugia); Poland: Sulowicz W. (Krakow), Nowicki M. (Lodz), Kuczera M. (Rybnik), Rutkowski P. (Gdansk), Lizakowski S. (Wejherowo), Sulowicz W. (Oswiecim), Felisiak J. (Zielona Gora), Rutkowski P. (Starogard Gdanski), Kopecka-Mechlińska L. (Gdańsk), Stryjewski D. (Pabianice), Szurkowski M. (Bialska), Książek A. (Lublin), Klatko W. (Ciechanów), Matuszkiewicz-Rowińska J. (Warszawa), Wyroślak J. (Zgierz), Papliński M. (Sokolów Podlaski); South Africa: Swanepol C. (Cape Town), Naicker S. (Gauteng), Khan A.A. (Durban), Biermann E. (Port Elizabeth), Gerntholz T. (Soweto Gauteng); Spain: Cannata-Andía J. (Oviedo), Hueso M. (L'Hospitalet de Llobregat), Moreso F. (L'Hospitalet de Llobregat), Ramos R. (Barcelona); United Kingdom: Farrington K. (Stevenage), Jardine A. (Glasgow).
REFERENCES
- 1.Slatopolsky E, Delmez JA. Pathogenesis of secondary hyperparathyroidism. Nephrol Dial Transplant. 1996;11(Suppl 3):130–135. doi: 10.1093/ndt/11.supp3.130. doi:10.1093/ndt/11.supp3.130. [DOI] [PubMed] [Google Scholar]
- 2.Goodman WG, Goldin J, Kuizon BD, et al. Coronary-artery calcification in young adults with end-stage renal disease who are undergoing dialysis. N Engl J Med. 2000;342:1478–1483. doi: 10.1056/NEJM200005183422003. doi:10.1056/NEJM200005183422003. [DOI] [PubMed] [Google Scholar]
- 3.Raggi P, Boulay A, Chasan-Taber S, et al. Cardiac calcification in adult hemodialysis patients. A link between end-stage renal disease and cardiovascular disease? J Am Coll Cardiol. 2002;39:695–701. doi: 10.1016/s0735-1097(01)01781-8. doi:10.1016/S0735-1097(01)01781-8. [DOI] [PubMed] [Google Scholar]
- 4.Block GA, Hulbert-Shearon TE, Levin NW, et al. Association of serum phosphorus and calcium x phosphate product with mortality risk in chronic hemodialysis patients: a national study. Am J Kidney Dis. 1998;31:607–617. doi: 10.1053/ajkd.1998.v31.pm9531176. doi:10.1053/ajkd.1998.v31.pm9531176. [DOI] [PubMed] [Google Scholar]
- 5.Block GA, Klassen PS, Lazarus JM, et al. Mineral metabolism, mortality, and morbidity in maintenance hemodialysis. J Am Soc Nephrol. 2004;15:2208–2218. doi: 10.1097/01.ASN.0000133041.27682.A2. doi:10.1097/01.ASN.0000133041.27682.A2. [DOI] [PubMed] [Google Scholar]
- 6.Kidney Disease: Improving Global Outcomes (KDIGO) CKD-MBD Work Group. KDIGO clinical practice guideline for the diagnosis, evaluation, prevention, and treatment of Chronic Kidney Disease-Mineral and Bone Disorder (CKD-MBD) Kidney Int. 2009;76(Suppl 113):S1–S130. doi: 10.1038/ki.2009.188. [DOI] [PubMed] [Google Scholar]
- 7.Isakova T, Gutiérrez OM, Chang Y, et al. Phosphorus binders and survival on hemodialysis. J Am Soc Nephrol. 2009;20:388–396. doi: 10.1681/ASN.2008060609. doi:10.1681/ASN.2008060609. [DOI] [PMC free article] [PubMed] [Google Scholar]
- 8.Lopes AA, Tong L, Thumma J, et al. Phosphate binder use and mortality among hemodialysis patients in the Dialysis Outcomes and Practice Patterns Study (DOPPS): evaluation of possible confounding by nutritional status. Am J Kidney Dis. 2012;60:90–101. doi: 10.1053/j.ajkd.2011.12.025. doi:10.1053/j.ajkd.2011.12.025. [DOI] [PMC free article] [PubMed] [Google Scholar]
- 9.Cannata-Andia JB COSMOS Investigators. The use of phosphate binding agents is associated with lower mortality: results from the COSMOS study. Presented at the 49th ERA-EDTA Congress, May 24-27 2012, Paris, France. Available from: http://www.eraedta2012.org/images/05_Cannata-Andia_Results_from_the_COSMOS_study.pdf .
- 10.Frazão JM, Adragão T. Non-calcium-containing phosphate binders: comparing efficacy, safety, and other clinical effects. Nephron Clin Pract. 2012;120:c108–c119. doi: 10.1159/000337087. doi:10.1159/000337087. [DOI] [PubMed] [Google Scholar]
- 11.Guérin AP, London GM, Marchais SJ, et al. Arterial stiffening and vascular calcifications in end-stage renal disease. Nephrol Dial Transplant. 2000;15:1014–1021. doi: 10.1093/ndt/15.7.1014. doi:10.1093/ndt/15.7.1014. [DOI] [PubMed] [Google Scholar]
- 12.Hill KM, Martin BR, Wastney ME, et al. Oral calcium carbonate affects calcium but not phosphorus balance in stage 3–4 chronic kidney disease. Kidney Int. 2013;83:959–966. doi: 10.1038/ki.2012.403. doi:10.1038/ki.2012.403. [DOI] [PMC free article] [PubMed] [Google Scholar]
- 13.Navaneethan SD, Palmer SC, Vecchio M, et al. Phosphate binders for preventing and treating bone disease in chronic kidney disease patients. Cochrane Database Syst Rev. 2011 doi: 10.1002/14651858.CD006023.pub2. CD006023. doi: 10.1002/14651858. [DOI] [PubMed] [Google Scholar]
- 14.Chertow GM, Burke SK, Raggi P Treat to Goal Working Group. Sevelamer attenuates the progression of coronary and aortic calcification in hemodialysis patients. Kidney Int. 2002;62:245–252. doi: 10.1046/j.1523-1755.2002.00434.x. doi:10.1046/j.1523-1755.2002.00434.x. [DOI] [PubMed] [Google Scholar]
- 15.Block GA, Spiegel DM, Ehrlich J, et al. Effects of sevelamer and calcium on coronary artery calcification in patients new to hemodialysis. Kidney Int. 2005;68:1815–1824. doi: 10.1111/j.1523-1755.2005.00600.x. doi:10.1111/j.1523-1755.2005.00600.x. [DOI] [PubMed] [Google Scholar]
- 16.Toussaint ND, Lau KK, Polkinghorne KR, et al. Attenuation of aortic calcification with lanthanum carbonate versus calcium-based phosphate binders in haemodialysis: a pilot randomized controlled trial. Nephrology (Carlton) 2011;16:290–298. doi: 10.1111/j.1440-1797.2010.01412.x. doi:10.1111/j.1440-1797.2010.01412.x. [DOI] [PubMed] [Google Scholar]
- 17.Suki WN, Zabaneh R, Cangiano JL, et al. Effects of sevelamer and calcium-based phosphate binders on mortality in hemodialysis patients. Kidney Int. 2007;72:1130–1137. doi: 10.1038/sj.ki.5002466. doi:10.1038/sj.ki.5002466. [DOI] [PubMed] [Google Scholar]
- 18.Shantouf R, Budoff MJ, Ahmadi N, et al. Effects of sevelamer and calcium-based phosphate binders on lipid and inflammatory markers in hemodialysis patients. Am J Nephrol. 2008;28:275–279. doi: 10.1159/000111061. doi:10.1159/000111061. [DOI] [PMC free article] [PubMed] [Google Scholar]
- 19.Baigent C, Landray MJ, Reith C SHARP Investigators. The effects of lowering LDL cholesterol with simvastatin plus ezetimibe in patients with chronic kidney disease (Study of Heart and Renal Protection): a randomised placebo-controlled trial. Lancet. 2011;377:2181–2192. doi: 10.1016/S0140-6736(11)60739-3. doi:10.1016/S0140-6736(11)60739-3. [DOI] [PMC free article] [PubMed] [Google Scholar]
- 20.Kidney Disease Outcomes Quality Initiative (K/DOQI) Group. K/DOQI clinical practice guidelines for management of dyslipidemias in patients with kidney disease. Am J Kidney Dis. 2003;41(4 Suppl 3):S1–S91. I–IV, –. [PubMed] [Google Scholar]
- 21.Grundy SM, Cleeman JI, Merz CN Coordinating Committee of the National Cholesterol Education Program. Implications of recent clinical trials for the National Cholesterol Education Program Adult Treatment Panel III Guidelines. J Am Coll Cardiol. 2004;44:720–732. doi: 10.1016/j.jacc.2004.07.001. doi:10.1016/j.jacc.2004.07.001. [DOI] [PubMed] [Google Scholar]
- 22.Reiner Z, Catapano AL, De Backer G European Association for Cardiovascular Prevention & Rehabilitation; ESC Committee for Practice Guidelines (CPG) 2008–2010 and 2010-2012 Committees. ESC/EAS Guidelines for the management of dyslipidaemias: the Task Force for the management of dyslipidaemias of the European Society of Cardiology (ESC) and the European Atherosclerosis Society (EAS) Eur Heart J. 2011;32:1769–1818. doi: 10.1093/eurheartj/ehr158. doi:10.1093/eurheartj/ehr158. [DOI] [PubMed] [Google Scholar]
- 23.Kurihara S, Tsuruta Y, Akizawa T. Effect of MCI-196 (colestilan) as a phosphate binder on hyperphosphataemia in haemodialysis patients: a double-blind, placebo-controlled, short-term trial. Nephrol Dial Transplant. 2005;20:424–430. doi: 10.1093/ndt/gfh632. doi:10.1093/ndt/gfh632. [DOI] [PubMed] [Google Scholar]
- 24.Locatelli F, Dimkovic N, Spasovski G. Evaluation of colestilan in chronic kidney disease dialysis patients with hyperphosphataemia and dyslipidaemia: a randomized, placebo-controlled, multiple fixed-dose trial. Nephrol Dial Transplant. 2013;28:1874–1888. doi: 10.1093/ndt/gft064. doi:10.1093/ndt/gft064. [DOI] [PubMed] [Google Scholar]
- 25.Heymann EP, Kassimatis TI, Goldsmith JA. Dyslipidaemia, statins, and CKD patients' outcomes – review of the evidence in the post-sharp era. J Nephrol. 2012;25:460–472. doi: 10.5301/jn.5000154. doi:10.5301/jn.5000154. [DOI] [PubMed] [Google Scholar]
- 26.Sturm G, Lamina C, Zitt E, et al. Association of HbA1c values with mortality and cardiovascular events in diabetic dialysis patients. The INVOR study and review of the literature. PLoS One. 2011;6:e20093. doi: 10.1371/journal.pone.0020093. doi:10.1371/journal.pone.0020093. [DOI] [PMC free article] [PubMed] [Google Scholar]
- 27.Neri L, Rocca Rey LA, Lentine KL, et al. Joint association of hyperuricemia and reduced GFR on cardiovascular morbidity: a historical cohort study based on laboratory and claims data from a national insurance provider. Am J Kidney Dis. 2011;58:398–408. doi: 10.1053/j.ajkd.2011.04.025. doi:10.1053/j.ajkd.2011.04.025. [DOI] [PubMed] [Google Scholar]
- 28.Suliman ME, Johnson RJ, García-López E, et al. J-shaped mortality relationship for uric acid in CKD. Am J Kidney Dis. 2006;48:761–771. doi: 10.1053/j.ajkd.2006.08.019. doi:10.1053/j.ajkd.2006.08.019. [DOI] [PubMed] [Google Scholar]
- 29.Locatelli F, Dimkovic N, Pontoriero G, et al. Effect of MCI-196 on serum phosphate and cholesterol levels in haemodialysis patients with hyperphosphataemia: a double-blind, randomized, placebo-controlled study. Nephrol Dial Transplant. 2010;25:574–581. doi: 10.1093/ndt/gfp445. doi:10.1093/ndt/gfp445. [DOI] [PubMed] [Google Scholar]
- 30.Young EW, Albert JM, Satayathum S, et al. Predictors and consequences of altered mineral metabolism: the Dialysis Outcomes and Practice Patterns Study. Kidney Int. 2005;67:1179–1187. doi: 10.1111/j.1523-1755.2005.00185.x. doi:10.1111/j.1523-1755.2005.00185.x. [DOI] [PubMed] [Google Scholar]
- 31.Kalantar-Zadeh K, Kuwae N, Regidor DL, et al. Survival predictability of time-varying indicators of bone disease in maintenance hemodialysis patients. Kidney Int. 2006;70:771–780. doi: 10.1038/sj.ki.5001514. doi:10.1038/sj.ki.5001514. [DOI] [PubMed] [Google Scholar]
- 32.Giachelli CM. The emerging role of phosphate in vascular calcification. Kidney Int. 2009;75:890–897. doi: 10.1038/ki.2008.644. doi:10.1038/ki.2008.644. [DOI] [PMC free article] [PubMed] [Google Scholar]
- 33.Moe S, Drüeke T, Cunningham J Kidney Disease: Improving Global Outcomes (KDIGO) Definition, evaluation, and classification of renal osteodystrophy: a position statement from Kidney Disease: Improving Global Outcomes (KDIGO) Kidney Int. 2006;69:1945–1953. doi: 10.1038/sj.ki.5000414. doi:10.1038/sj.ki.5000414. [DOI] [PubMed] [Google Scholar]
- 34.Di Iorio B, Bellasi A, Russo D INDEPENDENT Study Investigators. Mortality in kidney disease patients treated with phosphate binders: a randomized study. Clin J Am Soc Nephrol. 2012;7:487–493. doi: 10.2215/CJN.03820411. doi:10.2215/CJN.03820411. [DOI] [PubMed] [Google Scholar]
- 35.National Kidney Foundation. KDOQI US commentary on the 2009 KDIGO Clinical Practice Guideline for the Diagnosis, Evaluation, and Treatment of CKD–Mineral and Bone Disorder (CKD–MBD) Am J Kidney Dis. 2010;55:773–799. doi: 10.1053/j.ajkd.2010.02.340. doi:10.1053/j.ajkd.2010.02.340. [DOI] [PubMed] [Google Scholar]
- 36.Block GA, Port FK. Re-evaluation of risks associated with hyperphosphataemia and hyperparathyroidism in dialysis patients: recommendations for a change in management. Am J Kidney Dis. 2000;35:1226–1237. doi: 10.1016/s0272-6386(00)70064-3. doi:10.1016/S0272-6386(00)70064-3. [DOI] [PubMed] [Google Scholar]
- 37.Goldsmith DR, Scott LJ, Cvetković RS, et al. Sevelamer hydrochloride: a review of its use for hyperphosphataemia in patients with end-stage renal disease on haemodialysis. Drugs. 2008;68:85–104. doi: 10.2165/00003495-200868010-00006. doi:10.2165/00003495-200868010-00006. [DOI] [PubMed] [Google Scholar]
- 38.Tsimihodimos V, Dounousi E, Siamopoulos C. Dyslipidemia in chronic kidney disease: an approach to pathogenesis and treatment. Am J Nephrol. 2008;28:958–973. doi: 10.1159/000144024. doi:10.1159/000144024. [DOI] [PubMed] [Google Scholar]
- 39.Weichhart T, Kopecky C, Kubicek M, et al. Serum amyloid A in uremic HDL promotes inflammation. J Am Soc Nephrol. 2013;23:934–947. doi: 10.1681/ASN.2011070668. doi:10.1681/ASN.2011070668. [DOI] [PMC free article] [PubMed] [Google Scholar]
- 40.Reasner CA. Reducing cardiovascular complications of type 2 diabetes by targeting multiple risk factors. J Cardiovasc Pharmacol. 2008;52:136–144. doi: 10.1097/FJC.0b013e31817ffe5a. doi:10.1097/FJC.0b013e31817ffe5a. [DOI] [PubMed] [Google Scholar]
- 41.Feig DI, Kang DH, Johnson RJ. Uric acid and cardiovascular risk. N Engl J Med. 2008;359:1811–1821. doi: 10.1056/NEJMra0800885. doi:10.1056/NEJMra0800885. [DOI] [PMC free article] [PubMed] [Google Scholar]
- 42.Wen CP, David Cheng TY, Chan HT, et al. Is high serum uric acid a risk marker or a target for treatment? Examination of its independent effect in a large cohort with low cardiovascular risk. Am J Kidney Dis. 2010;56:273–288. doi: 10.1053/j.ajkd.2010.01.024. doi:10.1053/j.ajkd.2010.01.024. [DOI] [PubMed] [Google Scholar]
- 43.Jalal DI, Chonchol M, Chen W, et al. Uric acid as a target of therapy in CKD. Am J Kidney Dis. 2013;61:134–146. doi: 10.1053/j.ajkd.2012.07.021. doi:10.1053/j.ajkd.2012.07.021. [DOI] [PMC free article] [PubMed] [Google Scholar]
- 44.Hsu CY, Iribarren C, McCulloch CE, et al. Risk factors for end-stage renal disease: 25-year follow-up. Arch Intern Med. 2009;169:342–350. doi: 10.1001/archinternmed.2008.605. doi:10.1001/archinternmed.2008.605. [DOI] [PMC free article] [PubMed] [Google Scholar]
- 45.Tangri N, Weiner DE. Uric acid, CKD, and cardiovascular disease: confounders, culprits, and circles. Am J Kidney Dis. 2010;56:247–250. doi: 10.1053/j.ajkd.2010.06.004. doi:10.1053/j.ajkd.2010.06.004. [DOI] [PMC free article] [PubMed] [Google Scholar]