

Abstract
MicroRNAs (miRNAs) control gene expression at the post-transcriptional level. However, the identification of miRNAs regulating the fate of a specific messenger RNA remains limited due to the imperfect complementarity of miRNAs and targeted transcripts. Here, we describe miTRAP (miRNA trapping by RNA in vitro affinity purification), an advanced protocol of previously reported MS2-tethering approaches. MiTRAP allows the rapid identification of miRNAs targeting an in vitro transcribed RNA in cell lysates. Selective co-purification of regulatory miRNAs was confirmed for the MYC- as well as ZEB2-3′UTR, two well-established miRNA targets in vivo. Combined with miRNA-sequencing, miTRAP identified in addition to miRNAs reported to control MYC expression, 18 novel candidates including not in silico predictable miRNAs. The evaluation of 10 novel candidate miRNAs confirmed 3′UTR-dependent regulation of MYC expression as well as putative non-canonical targeting sites for the not in silico predictable candidates. In conclusion, miTRAP provides a rapid, cost-effective and easy-to-handle protocol allowing the identification of regulatory miRNAs for RNAs of choice in a cellular context of interest. Most notably, miTRAP not only identifies in silico predictable but also unpredictable miRNAs regulating the expression of a specific target RNA.
INTRODUCTION
MicroRNAs (miRNAs) are evolutionary conserved small non-coding RNAs (ncRNAs) that regulate gene expression at the post-transcriptional level by directing the miRISC (miRNA containing RNA-induced silencing complex) to specific messenger RNAs (mRNAs). In vertebrates, the minimal miRISC consists of a regulatory miRNA and members of the argonaute (AGO) as well as TNRC6 protein families comprising four or three paralogs, respectively (1). On miRNA processing by DICER, AGO facilitates RNA-induced silencing complex (RISC) assembly, whereas TNRC6 paralogs were proposed to mediate target mRNA decay and/or translational silencing (2). Although miRNA-dependent regulation of mRNA fate is largely facilitated in a 3′UTR-dependent manner, some mRNAs are also subjected to miRNA-dependent regulation via the coding sequence. However, miRNA targeting sites (MTSs) in the coding sequence were suggested to rather enhance 3′UTR-dependent regulation than acting in a 3′UTR-independent manner (3). In addition, more specialized mechanisms via which miRNAs control the fate of targeted (m)RNAs have been reported. For instance, miR-122 was shown to promote the hepatitis C virus life cycle by associating at the hepatitis C virus RNA’s 5′UTR (4).
Through evolution, the number of miRNAs increased with >2500 human miRNAs currently listed in miRBase (v20) (5–8). This suggests a pivotal role of miRNA-dependent control of gene expression during development, cell fate determination, and also the fine tuning of gene expression to maintain cellular homeostasis (9). However, the identification of miRNA-dependent regulation is largely limited by the imperfect complementarity of miRNAs and target transcripts. Canonical miRNA targeting is characterized by the perfect pairing of the miRNA’s seed sequence, typically comprising nucleotides 2–7 at the 5′-end of the miRNA, which is usually supplemented by base pairing at the miRNA’s 3′-end (10). In contrast, non-canonical targeting lacks continuous seed pairing, but relies on increased complementarity toward the miRNA’s center and/or 3′-end (2). However, to our knowledge, only a few non-canonical miRNA-target interactions have been validated experimentally (11–13). Notably, only canonical targeting of miRNAs can be predicted by available in silico tools. Although these algorithms provide useful insights in some cases, they are limited by various means (14). Some key aspects in silico analyses cannot account for are (i) structural constrains of cis-acting MTSs (10), (ii) relative abundance of miRNAs and targeted transcripts and (iii) the modulation of miRNA-dependent regulation by trans-acting factors like RNA-binding protein (RBPs) (15). Moreover, distinct algorithms substantially vary with respect to regulatory candidate miRNAs suggested for a target transcript of interest (14).
In view of these substantial limitations, technically challenging strategies have been established to gain insights into miRNA-dependent regulation at a ‘genome-wide’ scale. Studies focusing on the regulatory potency of an individual miRNA were mostly based on the ectopic expression of the miRNA followed by the analysis of altered total (16) and/or polysomal mRNA (17), or protein abundance (18). However, these studies failed to discriminate between primary and secondary miRNA targets, and the physiological relevance remains biased by the usually exceeding upregulation of an individual miRNA. To identify the direct association of miRNAs with specific mRNAs, various pull-down strategies were established, including the immunopurification of ectopically expressed RISC components or the affinity purification of synthetic miRNAs transfected into cells (19–23). Although some of these analyses were combined with the stabilization of protein–RNA complexes by ultraviolet (UV)-induced cross-linking, the physiological relevance of most identified miRNA-target associations remain yet to be determined. This also holds for the recently reported CLASH approach, which combined an AGO1-CLIP with the ligation and sequencing of miRNA–mRNA hybrids (13). Although CLASH may provide valuable insights, it remains to be addressed whether it is biased by target mRNA abundance. The CLASH study suggested a significant portion of miRNAs expressed in HEK293 cells to target highly abundant mRNAs. These included the exogenously expressed AGO1, and GAPDH or ACTB mRNAs, which have not been reported as striking examples of miRNA-targeted transcripts.
In contrast to the aforementioned analyses that aim at a rather ‘holistic view’ of the miRNAome, many researchers focus on identifying and characterizing miRNA-dependent regulation of specific target mRNAs in a cellular or tissue context of interest. For this purpose, high-throughput methods based on reporter assays combined with miRNA gain-of-function studies have been explored (24,25). These, for instance, identified regulation of p21 (CDKN1A) by 28 distinct miRNAs (24). Although providing valuable information, such studies are limited due to not taking into account (i) endogenous miRNA expression signatures, (ii) target mRNA abundance or processing and (iii) the potential bias of exceedingly upregulated miRNA levels. Other approaches aiming at the target-specific identification of regulatory miRNAs are based on the co-purification of miRNAs with either endogenous or exogenously expressed mRNAs (26–28). The affinity purification of endogenous alpha-1 antitrypsin (AAT) mRNA using biotinylated antisense DNA oligonucleotides combined with formaldehyde-facilitated stabilization of complexes identified 140 co-purifying miRNAs based on the nanostring technology (28). This finding is consistent with the view that mRNAs are regulated by multiple miRNAs (10). However, only four of the novel miRNA candidates were evaluated by gain-of-function analyses. Although these confirmed a moderate control of AAT expression in liver cancer-derived tumor cell lines, the false-positive rate of this approach remains to be addressed in further detail with >130 candidates remaining to be evaluated. In contrast, the co-purification of miRNAs with ectopically expressed mRNAs using MS2-tethering identified only one regulatory miRNA family per analyzed bait RNA (26,27). In cardiomyocytes, miR-133a was identified to associate with the HAND2 mRNA, whereas let-7 family members were co-purified with the MS2-tagged lincRNA p21 from fibroblasts. Notably, both these miRNAs are among, if not the most, abundant miRNAs in the respective cell types (26,29). This suggests that the used MS2-tethering technologies largely missed regulatory miRNAs expressed at moderate or low levels, presumably due to exceedingly low-affinity purification yields of exogenously expressed bait transcripts.
Despite these reported limitations, the presented MS2-tethering-based studies prompted us to speculate that regulatory miRNAs can be co-purified with bait RNAs from cell lysates. Aiming to increase signal-to-noise ratios, enhance purification yields, allow the probing of any given RNA sequence and simplify the procedure by discarding the need of genetic manipulation, we set out to establish a protocol based on the MS2-facilitated affinity purification of in vitro transcribed RNAs. We expected this approach to be successful, as previous studies revealed that (i) RBPs, spliceosomal proteins or small nuclear RNAs were co-purified with in vitro transcribed bait transcripts at high specificity (30,31); (ii) miRNA–AGO complexes were observed after cell lysis even without precedent chemical or UV-based stabilization of protein–RNA complexes (32); and (iii) the regulatory role of small RNAs was successfully recapitulated in vitro, for instance, in Krebs-2 ascites cell extracts (33). Together, these findings suggested that the targeting of miRNAs is preserved in cell lysates and might even be induced by adding in vitro transcribed RNAs lacking 5′- or 3′-end modifications like a cap or poly(A)-tail. This hypothesis was evaluated by using the MYC-3′UTR as the main test bait.
The oncogenic transcription factor MYC controls the expression of thousands of genes and thus modulates various cell properties including proliferation, metabolism and motility (34,35). Although elevated levels of MYC protein promote uncontrolled proliferation in cancer cells, its overexpression can as well induce apoptosis (34). In accord with its broad potency, MYC expression is controlled by a multilayered regulatory network including transcriptional as well as post-transcriptional regulation (34,36,37). Next to RBPs, the post-transcriptional control of MYC expression was reported to involve regulation by the following miRNA families acting via the MYC-3′UTR: let-7-5p (38–40), miR-34-5p (41), -33-5p (42), -92-3p (40), miR-331-3p (40), miR-24-3p (43), miR-145-5p (44) and miR-185-3p (37). This suggested the MYC-3′UTR as a bona fide bait transcript for establishing miTRAP (miRNA trapping by in vitro RNA affinity purification).
The miTRAP protocol reported here confirmed the target site-specific association of reported MYC-regulatory miRNAs of the let-7-5p and miR-34-5p families. Moreover, miRNAs of the pro-epithelial miR-200 and miR-30 families, previously shown to control ZEB2 expression, were selectively co-purified with the in vitro-transcribed ZEB2-3′UTR. Combined with next-generation sequencing of miRNAs, miTRAP identified nearly all miRNAs reported to control the expression of MYC. In addition, 18 novel MYC-regulatory miRNAs including 10 not in silico predictable miRNAs could be identified and validated by gain- as well as loss-of-function studies. In conclusion, miTRAP provides a substantially advanced RNA affinity purification protocol for the rapid and comprehensive identification of regulatory miRNAs for an in vitro transcribed RNA bait of interest in a cellular context of choice.
MATERIALS AND METHODS
Plasmids
Two MS2 repeats were generated by the annealing of MS2sense and MS2antisense oligonucleotides and subsequent subcloning in pcDNA3.1 via XhoI/NheI in XhoI/XbaI. Four MS2 repeats were generated by repetitive cloning as outlined above. MYC- and ZEB2-3′UTRs were cloned as described previously (45,46) and subcloned in the pmiR-GLO vector (Promega) via EcoRI/XhoI. MYC- and ZEB2-3′UTRs or MYC-3′UTR fragments used for miTRAP studies lack a sequence starting from the last reported poly(A)-signal and were polymerase chain reaction (PCR)-amplified from pmiR-GLO vectors before subcloning in pcDNA3.1-4MS2 via EcoRI/XhoI. MiRNA antisense, miR-125a-3p or miR-455-3p MTS encoding oligonucleotides were annealed and subcloned in the pcDNA3.1-4MS2 vector via EcoRI/XhoI, or NheI/XhoI, respectively. MTS-mutations in the full-length MYC-3′UTR fused to the 3′-end of a Firefly luciferase open reading frame were generated either by site-directed mutagenesis using the QuikChange site-directed mutagenesis kit or by ligation of PCR-amplified MTS upstream and downstream sequences resulting in a novel NdeI or Xma1 restriction site (see Supplementary Material for further information). MiRNA-encoding small hairpin RNA (shRNA) vectors were generated by subcloning of annealed oligonucleotides in pLVTHM [Addgene plasmid 12247, (47)] via MluI/ClaI. Decoy RNA encoding vectors were generated by subcloning of annealed and PCR-amplified oligonucleotides according to (48) in pLVX-shRNA2 (Clonetech, catalog number 632179) via EcoRI/BamHI. Oligonucleotides used for cloning are summarized in Supplementary Table S3. The expression plasmid for maltose-binding protein (MBP)-MS2BP was obtained from Addgene [plasmid 11246 (49)].
Protein purification
MBP-MS2BP was purified as previously described by Köhn et al. (50).
In vitro transcription
DNA templates for in vitro transcription of MS2-control, MYC, ZEB2, miRNA antisense or miR-125a-3p/-455-3p MTS bait RNAs were generated by linearization of pcDNA3.1 vectors with PspOMI. After purification of linearized vectors (Wizard SV Kit, Promega), RNAs were in vitro transcribed using the RiboMAX Large Scale RNA Production System-T7 (Promega) according to the manufacturer’s protocol. Generated RNAs were purified by the MEGAclear kit (Invitrogen).
MiTRAP
Thirty microliters amylose resin (New England Biolabs) was washed four times with binding buffer (BB: 20 mM Tris, pH 7.5, 150 mM NaCl, 1.5 mM MgCl2, 8.6% glycerol and 0.05% NP40) and incubated with 100 pmol recombinant MBP-MS2BP in 1 ml BB for 30 min. On blocking with bovine serum albumin (25 µg/ml) and yeast tRNA (20 µg/ml) for 30 min in 1 ml BB buffer, resin was washed three times with BB. Afterward, in vitro transcribed bait RNA was immobilized to the resin by 1h incubation of 20 pmol RNA with the resin in 1 ml BB supplemented with 11µg/ml heparin (Sigma Aldrich). In the meanwhile, 5 × 10⁶ cells were lysed on ice for 10 min with 1 ml BB supplemented with protease inhibitor cocktail (1:200; Sigma Aldrich) and cleared by centrifugation (10 min; 12 000g). Resin with immobilized bait RNA was washed one time with BB supplemented with 11 µg/ml heparin. Next, the resin was incubated with 500 µl cell extract supplemented with 500 µl BB, 11 µg/ml heparin, 1 mM dithiothreitol and 400 U/ml RNasin (Promega) for 30 min. After incubation, the amylose resin was washed four times with heparin-supplemented BB. All steps, except cell lysis, were performed at room temperature under constant agitation. For miRNA analysis, protein–RNA complexes were eluted twice in 150 µl BB supplemented with 15 mM maltose. Afterward, miRNAs were purified from maltose solution by phenol–chloroform extraction. For protein analysis, amylose resins were incubated with 25 µl of SDS-sample buffer supplemented with 10% beta-mercaptoethanol.
RNA purification and quantitative real-time PCR
280 µl maltose solution (miTRAP eluates) was mixed with 80 µl of nuclease-free water, 80 µl ammonium acetate solution (5 M; Sigma-Aldrich) and 400 µl phenol/chloroform (5:1, pH 4.5; Sigma-Aldrich). On centrifugation at 15 000g for 10 min, 370 µl of upper phase was transferred to new tube and precipitated with 1 ml ethanol and 2 µg glycogen (Roche). RNA pellets were dissolved in 24 µl of nuclease-free water. Input RNA was phenol–chloroform extracted from 200 µl cell extract upon Proteinase K treatment (20 mg/ml; Life Technologies). Input RNA was dissolved in 30 µl of nuclease-free water.
For the quantitative assessment of miRNA abundance, complementary DNA (cDNA) was generated by priming 4 μl of miTRAP RNA or 1 μl of input-RNA with miRNA-specific RT-primers (TaqMan MicroRNA Assays, Applied Biosystems) using TaqMan MicroRNA Reverse Transcription Kit (Applied Biosystems). Quantitative real-time PCR (qRT-PCR) was performed based on TaqMan technology using TaqMan MicroRNA Assays and TaqMan Universal PCR Master Mix, No AmpErase UNG (Applied Biosystems) in a 7900HT-cycler (Applied Biosystems). Co-purification of miRNAs was determined as ‘miTRAP ratio’, which indicates the ratio of miRNA abundance in the miTRAP eluate versus the input determined by the ΔCt-method. Dilution factors of the individual fractions were considered.
Total RNA was extracted using Trizol (Invitrogen), according to the manufacturer’s instructions. For mRNA analysis, cDNA was generated by random priming of 2 μg total RNA using MLV-reverse transcriptase (Promega). qRT-PCR was performed based on SYBRgreen technology using SYBR Select Master Mix (Invitrogen) in a 7900HT-cycler (Applied Biosystems). For all primer pairs, an annealing temperature of 60°C was used. Relative changes of mRNA amounts were determined by the ΔΔCt method using TUBA4A, RPLP0 and VCL for cross-normalization, as previously described in (46). For primer sequences, see Supplementary Table S3.
Library preparation and deep sequencing
RNA prepared from total miTRAP eluates and 8% input RNA (500 ng) was used in the small RNA protocol with the TruSeq™ Small RNA Sample Prep Kit v2 (Illumina, San Diego, CA, USA) according to the instructions of the manufacturer. The barcoded libraries were size restricted between 140 and 165 bp, purified and quantified using the Library Quantification Kit-Illumina/Universal (KAPA Biosystems, Woburn, MA, USA) according to the instructions of the manufacturer. A pool of up to 10 libraries was used for cluster generation per lane. Library DNA at a concentration of 10 pM was clustered using an Illumina cBot according to the SR_Amp_Lin_Block_Hybv8.0 protocol of the manufacturer. Sequencing of 50 bp was performed with an Illumina HighScan-SQ sequencer using version 3 chemistry and the version 3 flowcell according to the instructions of the manufacturer.
Analysis of deep sequencing data
After demultiplexing all 50-bp reads from each lane using the CASAVA v1.8.2 software (Illumina), adaptor sequences were trimmed from raw sequences using cutadapt software (51). Cutadapt removes adapter sequences from high-throughput sequencing reads. From the remaining sequences, only reads 15–27 bases long were kept for further analysis because they most likely contain mature miRNA sequences. Alignment of these reads to human (hsa-only) mature sequences of miRBase (5–8) v17 was done using the bowtie aligner (52). Data were compressed with Samtools (53) to bam format. For each mature miRNA, mapped reads were counted with R/Bioconductor programming environment (54) by application of the ShortRead library (55). An error rate of 1 nt per mature miRNA sequence was allowed.
Identification of selectively co-purified miRNAs
MiRNAs selectively co-purified with the MYC bait RNA were identified based on miRNA sequencing by using the edgeR software package (56) of the R software environment for statistical computing. EdgeR analyzes gene expression data arising from RNA sequencing by testing for differential abundance. Deep sequencing data were normalized by the weighted trimmed mean of M-values method (TMM) (57). This method proved suitable to normalize RNA-Seq data sets containing or comparing libraries with substantial distinct sizes or depth, respectively. The original library sizes were scaled to ‘effective’ library sizes by multiplying scaling factors for each library. Using these effective library sizes, ‘pseudo’ CPMs (counts per million) were calculated based on TMM-normalized miRNA counts, which were used in all further downstream analyses. Selective co-purification of miRNA candidates was tested by applying the Poisson exact test proposed by Robinson and Smyth (58). Significant enrichment or depletion of miRNAs was determined by a significance level of 0.05. MiRNAs with <20 reads in the MYC-3′UTR library were not considered.
R software script
The R software script to identify selectively co-purified miRNAs was used with the edgeR package (56) in Bioconductor version 2.13 (54). The complete script can be executed in R or parts of it can easily be used to analyze and explore miRNA-Seq data from miTRAP experiments. More details and how to run the script are explained within the software script.
Cell culture, transfection and LNA treatment
U2OS and HEK293 cells were cultured in Dulbecco’s modified Eagle’s medium supplemented with 10% fetal bovine serum. HEK293 and U2OS were transfected with shRNA or decoy vectors using TransIT-LT1 (Mirus Bio) according to the manufacturer’s instructions. Cells transfected with decoy plasmids were harvested 4 days post-transfection. Antisense cholesterol-tagged LNAs (1000 nM; Exiqon) were added to the cell culture medium right after seeding in 12-well plates. Twenty-four hours after seeding, cells were harvested to analyze protein.
Western blotting
Western blots were analyzed by an Odyssey Infrared Imaging System (LI-COR Biosciences). Changes in MYC protein levels were determined by internal normalization to TUBA4A protein levels. Antibodies used included anti-AGO2 (Abcam, ab156870), anti-ELAVL1 (Santa Cruz, sc-5261), anti-MBP (Abcam, ab21144), anti-MYC (Millipore, 06-340), anti-TUBA4A (Sigma Aldrich, 9026) and IRDye 680/800CW-labeled mouse or rabbit secondary antibodies (LI-COR Biosciences).
Luciferase reporter assays
U2OS cells were co-transfected with 0.5 ng pmiR-GLO and 0.5 µg decoy encoding pLVX-shRNA2 in 24-well plates by using TransIT-LT1 (Mirus Bio). HEK293 cells were co-transfected with 0.2 ng pmiR-GLO-MYC-3′UTR [wild-type (WT) or mutant] and 1 µg of shRNA encoding pLVTHM plasmid in 24-well plates using TransIT-LT1 (Mirus Bio). Luciferase activities were determined 48 h post-transfection, essentially as described previously (46).
RESULTS
MiTRAP identifies regulatory miRNAs at high selectivity
The aim of this study was to establish an affinity purification protocol for in vitro transcribed RNAs from cell lysates to identify miRNAs controlling the fate of bait mRNAs in vivo. To set up the protocol, we used the in vitro transcribed MYC-3′UTR fused to four 3′-located MS2 aptamers. For affinity purification, bait RNAs were immobilized on an amylose resin via recombinant MS2 coat protein (MS2-CP) fused to the maltose-binding protein (MBP) (Figure 1A). Initial analyses focused on the well-studied MYC-regulatory miRNAs of the let-7-5p (38–40) and miR-34-5p families (59,60) that control MYC expression for instance in U2OS cells, which were used for lysate preparation (Supplementary Figure S1A). These miRNAs target the MYC-3′UTR at an overlapping MTS (38,41). Next to the wild type MYC-3′UTR (WT), a MYC-3′UTR transcript comprising two point mutations in the overlapping miR-34-5p/let-7-5p MTS (MUT) as well as the MS2 aptamers fused to the multiple cloning site of the used template vector (MS2) were used as controls (Figure 1B).
Figure 1.

MiTRAP allows the selective co-purification of miRNAs with in vitro transcribed bait RNAs. (A) Scheme of the miTRAP procedure. In vitro transcribed bait RNAs comprising four MS2 stem-loops fused to the 3′end of bait transcripts were immobilized on amylose resin (light gray) via recombinant MBP-fused (dark gray) MS2-CP (white) protein. (B) Scheme of the used bait RNAs (upper panel). MS2: 120-nt-long control RNA encoded by the template vector; WT: wild type 3′UTR of the MYC mRNA; MUT: MYC-3′UTR with indicated point mutations (lower panel) in the overlapping MTS of the let-7-5p/miR-34-5p families. (C) Co-purification of miRNAs was determined by qRT-PCR and assessed by the miTRAP ratio that indicates the input normalized abundance of miRNAs in the miTRAP eluates (upper panel). MiTRAP ratios of indicated miRNAs were determined on co-purification with depicted RNA baits (B) from U2OS cell lysates. Ratios were determined by qRT-PCR using miRNA-specific TaqMan probes. Note that MYC-regulatory miRNAs of the let-7-5p and miR-34-5p families are selectively co-purified with the MYC-3′UTR bait RNA, but not the mutant 3′UTR or MS2 control transcript. MiTRAP ratios for the WT 3′UTR bait are two orders of magnitude (note logarithmic scale) above controls. Error bars indicate standard deviation (s.d.) of at least three independent analyses. Statistical significance was determined by Student’s t-test: * P ≤ 0.05. (D) Western blot analysis of indicated proteins isolated from U2OS input fractions or co-purified with MBP–MS2BP-coated amylose resin (BC), the MS2 control transcript (MS2), the WT or point mutated (MUT) MYC-3′UTR, respectively. TUBA4A served as negative control for unspecific binding, whereas MBP–MS2BP indicates equal loading of the resin. Retrieval of bait RNAs was monitored by urea PAGE and Syto60-staining of nucleic acids (lower panel). (E, F) Co-purification of the indicated miRNAs with the WT ZEB2-3′UTR or the MS2 control bait (MS2) from MCF7 cell lysates (E) or short let-7d-5p or miR-34a-5p antisense (as) bait transcripts from U2OS cell lysates (F) was monitored as described in (C). Error bars indicate s.d. of at least three independent analyses. Statistical significance was determined by Student’s t-test: * P < 0.05.
The co-purification of miRNAs with bait transcripts was monitored by quantitative RT-PCR using TaqMan® technology. Co-purification was assessed by the ratio of miRNA abundance in the miTRAP eluate fraction versus the input, termed miTRAP ratio (Figure 1C, upper panel). Strikingly, all analyzed members of the let-7-5p as well as miR-34-5p families co-purified with the WT MYC-3′UTR at miTRAP ratios, which were two orders of magnitude higher than observed for the MTS-mutated MYC-3′UTR (MUT) or the MS2 control transcript (Figure 1C, lower panel). In contrast, miTRAP ratios determined for five miRNAs not reported to target the MYC-3′UTR, including the highly abundant miR-21-5p (Supplementary Figure S1B), remained at 102–103 lower levels and were indistinguishable for all three baits. Selective co-purification of let-7-5p as well as miR-34-5p members was also observed from HEK293A cell lysates (Supplementary Figure S2A). In agreement with selective miRNA-association, the RISC component AGO2 associated with the WT MYC-3′UTR baits in U2OS as well as HEK293A cell lysates (Figure 1D; Supplementary Figure S2B). However, in both lysates, the co-purification of AGO2 was markedly reduced for the let-7-5p/miR-34-5p MTS-mutant (MUT), suggesting this modification to substantially impair miRNA-dependent control via the MYC-3′UTR. In contrast, co-purification of the reported MYC-3′UTR-binding protein ELAVL1 (HUR) remained largely unaffected by the point mutations in the overlapping MTS (61). Although all bait RNAs were affinity-purified at similar efficiency (Figure 1D, lower panel), none of the analyzed endogenous proteins co-purified with the MS2 control bait, nor was α-tubulin (TUBA4A) co-purified with any of the analyzed bait transcripts.
The MYC-3′UTR is rather short, with a length of ∼0.4 kb. Aiming to evaluate how miTRAP performs with significantly longer bait RNAs, the association of miRNAs with ∼1.4-kb-long ZEB2-3′UTR was analyzed. The expression of ZEB2 is controlled by pro-epithelial miRNAs, in particular the miR-200-5p/miR-30-5p families (46,62). Consistently, miRNAs of both families selectively co-purified with the ZEB2-3′UTR in cell lysates derived from epithelial MCF-7 cells (Figure 1E). MiTRAP ratios determined for the co-purification of pro-epithelial miRNA families with the ZEB2-3′UTR bait were approximately two orders of magnitude above control levels, as determined for the MYC-3′UTR bait transcript, (Figure 1E). Notably, miRNAs not reported to regulate the expression of ZEB2, including MYC-regulatory miRNAs of the let-7-5p family as well as the highly abundant miR-21-5p, were not co-purified with the ZEB2-3′UTR bait RNA. Finally, we addressed whether miTRAP is also suitable to identify miRNAs targeting RNAs of perfect complementarity using antisense transcripts of the miRNAs let-7d-5p or miR-34a-5p. Selective co-purification was observed with the respective antisense-reporters for both miRNAs but not the control, miR-16-5p (Figure 1F). As for longer bait transcripts, the respective miRNAs were co-purified at miTRAP ratios, which were at least two orders of magnitude above controls. Taken together, these findings indicated that the established miTRAP protocol allowed the highly selective and MTS-dependent co-purification of regulatory miRNAs with in vitro transcribed bait transcripts.
MiTRAP identifies novel MYC-3′UTR targeting miRNAs
MiTRAP confirmed the selective association of reported MYC- as well as ZEB2-regulatory miRNAs with respective bait transcripts in vitro. To test whether the protocol is hence also suitable to identify novel MYC-targeting miRNAs, three independent miTRAP analyses were conducted in U2OS cell lysates using the MYC-3′UTR as the bait. The co-purification of miRNAs was assessed by next-generation sequencing of short RNAs (miRNA-Seq). Libraries for miRNA-Seq were generated from total RNA (inputs) and MYC-3′UTR (MYC) or MS2 (MS2) control miTRAP eluates. In contrast to the first and second experiments, libraries of the third experiment were run at a higher multiplex per sequencing lane. Accordingly, miRNA reads were approximately 3-fold reduced in the respective input or MYC libraries (Figure 2A). However, miRNA reads of the MS2 library remained largely unaffected by the reduced sequencing depth. Thus, the expected increase of miRNA abundance in the MYC samples was observed only for the first two experiments, as indicated by the total miRNA count ratio of the MYC versus MS2 samples of each analysis (Figure 2A, ratio). To allow the comparison of libraries at a minimized bias due to varying library sizes, miRNA reads were internally normalized by the TMM method for all libraries (57). Using TMM-normalized miRNA reads, we next evaluated selective co-purification of miRNAs reported to control MYC expression (let-7a-i-5p, miR-98-5p, miR-34a/c-5p). Consistent with the initial qRT-PCR analysis (see Figure 1C), miTRAP ratios for the MYC libraries were significantly higher than for the MS2 libraries in all three analyses (Figure 2B). However, miTRAP ratios determined for the MYC library of the third study were markedly reduced. Therefore, we analyzed the variation of individual samples by applying the biological coefficient of variation (BCV) method (56,63). As expected by differences in library size and miTRAP ratios, the BCV analysis revealed a significant variation between the first two experiments versus the third (Figure 2C). Accordingly, data of the third analyses were not further considered. Candidate miRNAs selectively co-purifying with the MYC-3′UTR were identified based on TMM-normalized miRNA reads obtained from the first two analyses. Significant differential enrichment of miRNAs in the MYC or MS2 libraries was determined by the Poisson exact test (Figure 2D) (58). Of 900 miRNAs expressed in U2OS cells, only 36 were selectively enriched with the MYC-3′UTR in both experiments (Figure 2D, red), whereas four were selectively co-purified with the MS2 control bait (Figure 2D, black). The 36 miRNA candidates enriched in the MYC libraries comprised 18 previously reported MYC-regulatory miRNAs or additional members of the respective miRNA seed-families, respectively (Figure 2E, F; Supplementary Tables S1, S2). For an additional eight candidate miRNAs, MTSs could be in silico predicted by TargetScan, miRANDA and/or miRNAmap. However, the most interesting finding was that miTRAP identified 10 not in silico predictable and thus likely non-canonical miRNAs among the 36 MYC-regulatory candidates.
Figure 2.

Identification of novel MYC-3′UTR-associating miRNAs by miTRAP. (A) Summary of miRBase-mapped miRNA reads determined from indicated libraries of three independent miTRAP experiments using the MYC-3′UTR as bait RNA. Ratio in lower panel represents the ratio of total miRNA counts of the MYC to the MS2 libraries. (B) Box plots show miTRAP ratios determined for reported MYC-regulatory miRNAs (let-7a-i/98-5p, miR-34a/c-5p) co-purifying with the MS2 control (MS2) or WT MYC-3′UTR in three independent analyses. MiTRAP ratios were determined by TMM-normalized CPM values (counts per million) of indicated miRNAs in the MS2 or WT libraries versus the TMM-normalized CPM values of the respective miRNAs in the input libraries. Statistical significance was determined by Student’s t-test: * P < 0.05. (C) The distance of the biological coefficient of variation (BCV) is shown as a 2D scaling plot for indicated miTRAP libraries of three independent analyses. TMM-normalized miRNA reads were used to determine the BCV. The BCV analyses suggested little variation between the MYC or MS2 libraries of the first two studies, whereas libraries of the third experiment vary substantially. (D) Scatter plot depicts the log fold change (FC) between the MYC and MS2 libraries over the averaged TMM-normalized logCPM of miRNAs for the first two analyses (experiments 1 and 2). MiRNAs significantly enriched in the MYC libraries (red, 36 miRNAs) or MS2 libraries (black, 4 miRNAs) were determined by a Poisson exact test (see ‘Materials and Methods’ section). (E) The table summarizes all miRNAs selectively co-purified (red in D; 36 miRNAs) with the MYC-3′UTR in the first two experiments (experiments 1 and 2). MiRNAs were sorted in reported MYC-regulatory miRNAs (orange), in silico predictable miRNAs (green) and not in silico predictable (blue). The TargetScan, miRANDA and/or miRNAmap databases were used for in silico prediction. Note that miRNAs are sorted according to their seed families. Where indicated by numbers, more than one miRNA of one seed family was significantly enriched in the MYC-3′UTR libraries of the first two studies. (F) Summary of miRNAs identified by miRNA-seq in the first two analyses. Of 900 miRNAs detected in the input fractions, 36 were selectively co-purified (dark blue; red in D). 18 of these were reported MYC-regulatory miRNAs (orange). Eight candidate miRNAs were among the MYC-targeting miRNAs predicted by TargetScan, miRANDA or miRNAmap (green, 214 miRNAs). Ten candidate miRNAs were not in silico predicted by either of the used databases. Five reported but not in silico predicted miRNAs were not selectively co-purified. Two reported and in silico predicted MYC-regulatory miRNAs were not co-purified and one was not expressed. 112 of 214 in silico predicted MYC-targeting miRNAs were expressed but not selectively co-purified. (G) Scatter plot showing the averaged (first two analyses) abundance in percentage of all miRNAs (coverage) of indicated miRNA candidates in the MYC-miTRAP library over the abundance of the respective miRNAs in the input fraction. Color-coding depicts members of the let-7-5p family (red, let-7 fam), miR-34-5p family (blue, miR-34 fam), miR-92-3p family (black, miR-92 fam) and other candidate miRNAs (gray, other).
The miRNA-Seq analyses strongly suggested that the co-purification of miRNAs with the MYC-3′UTR was not biased by miRNA levels, as highly abundant miRNAs like miR-21-5p (see Supplementary Figure S1B) were not selectively co-purified. Although the relative abundance of candidate miRNAs in the respective MYC libraries increased with their input levels, miTRAP identified MYC-targeting candidate miRNAs were expressed at levels ranging over four orders of magnitude (Figure 2G). This suggested that the protocol also identifies low abundant miRNAs and presumably allows a quantitative assessment of miRNA co-purification. The latter notion is supported by the finding that members of the let-7-5p (red) and miR-34-5p (blue) families together summed up to >60% of all miRNA counts determined in the evaluated MYC libraries [Figure 2G; let-7a-5p (36.5%) and let-7e-5p (13.2%)]. In agreement, the inactivation of the overlapping MTS for these two miRNA families substantially reduced the co-purification of AGO2 (Figure 1D).
Taken together, miTRAP allowed the selective and quantitative co-purification of miRNAs with in vitro transcribed bait RNAs from cell lysates. Co-purification appeared largely unbiased by miRNA abundance and allowed the identification of non-canonical miRNA candidates.
MiTRAP identifies novel and non-canonical MYC-regulatory miRNAs
To evaluate the potency of miTRAP-identified miRNAs to control the expression of MYC, 10 novel candidate miRNAs were transiently silenced by miRNA decoys in U2OS cells. In addition, two decoys directed against members of miRNA seed families previously reported to control MYC expression, miR-34c-5p (59) and miR-92a-3p (40), were included as positive controls. Regulation of MYC expression was analyzed by monitoring how miRNA silencing affected the abundance of MYC mRNA and/or protein (Figure 3A, B). With the exception of miR-1294, the silencing of all miTRAP-identified or previously reported miRNAs resulted in a significant upregulation of MYC protein and mRNA abundance. Although these findings provided strong evidence for a direct regulation of MYC expression by the respective miRNA candidates, it remained to be determined whether they facilitated regulation in a 3′UTR-dependent manner.
Figure 3.
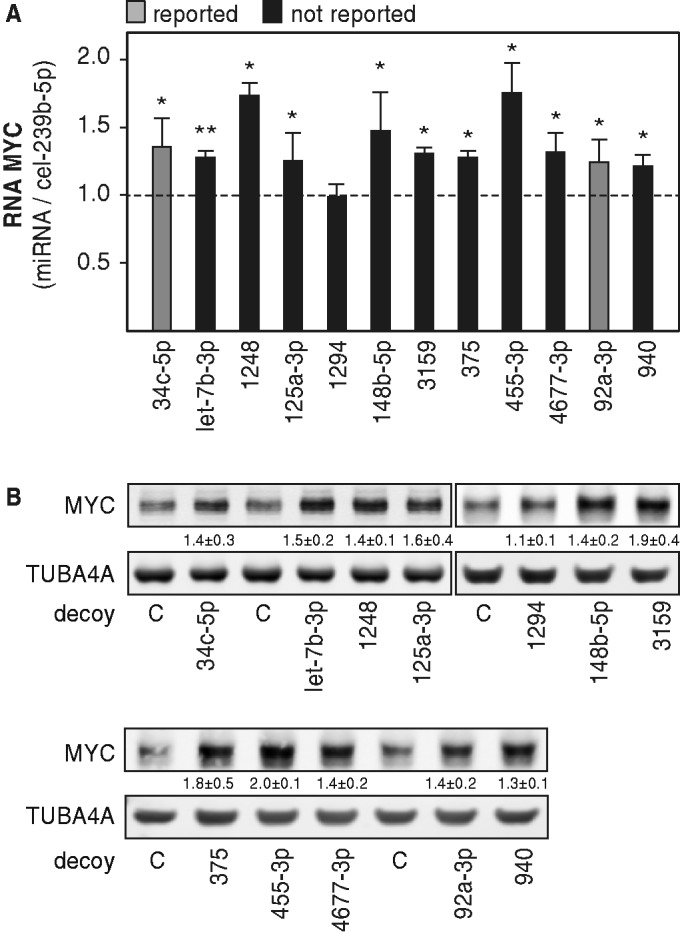
Regulation of MYC expression by miTRAP-identified miRNAs. (A) MYC mRNA abundance in U2OS cells transfected with indicated decoy vectors was analyzed by qRT-PCR using RPLP0, TUBA4A and VCL transcript levels for cross-normalization by the ΔΔCt-method. The change in MYC mRNA abundance was determined relative to controls transfected with decoys directed against the cel-239b-5p miRNA. Color-coding depicts reported (gray) versus non-reported (black) MYC-regulatory miRNAs. Error bars indicate s.d. of at least three independent analyses. Statistical significance was determined by Student’s t-test: * P ≤ 0.05 and ** P ≤ 0.005. (B) Representative Western blots of U2OS cells transfected with indicated decoy vectors. The change in MYC protein abundance was determined relative to controls transfected with the cel-miR-239b-5p (cel-239b-5p)-directed decoy vector by internal normalization to TUBA4A. Numbers beneath panels indicate the change in MYC protein levels as determined in three independent analyses.
Aiming to identify MTSs in the MYC-3′UTR, targeting sites for the let-7b-3p, miR-1294, miR-148-5p, miR-3159 and miR-940 were determined by in silico prediction using TargetScan, miRANDA and/or miRNAmap (Figure 4A, gray bars and lower left panel). For not in silico predictable candidate miRNAs (miRs: -1248, -125a-3p, -375, -455-3p, -4677-3p), putative MTSs were identified by RNAhybrid (43) based on the lowest hybridization energy predicted for suggested miRNA-3′UTR hybrids (Figure 4A, black bars and lower right panel). The only exception to this rule was allowed for miR-375, as a potential seed match was identified for a putative MTS with the second lowest hybridization energy predicted. The candidate MTSs either contained offset 6-mer seed-pairing, in the case of miR-455-3p and -375, or a partial loss of seed-pairing supplemented by 3′-end or centered pairing. On the in silico identification of putative MTSs, 3′UTR-dependent regulation of MYC expression was evaluated by luciferase reporter analyses (Figure 4B). Reporters comprised either the full-length WT (Figure 4B, gray bars) or respective MTS-mutated full-length MYC-3′UTRs (see Supplementary Material) fused to the Firefly luciferase open reading frame (Figure 4B, black bars). In accord with 3′UTR-dependent regulation of MYC expression, the activity of the MYC-3′UTR WT reporter (gray bars) was significantly upregulated by the transient silencing of all candidate miRNAs. Notably, reporter activity was also increased by the miR-1294-directed decoy that failed to significantly shift the expression of endogenous MYC (Figure 3). This could indicate that miR-1294-facilitated regulation of MYC expression is antagonized by other cis- or trans-acting regulatory determinants, or is simply irrelevant in the cellular context analyzed. However, the miRNA is likely to be capable of facilitating regulation via the MYC-3′UTR, potentially in another cellular context.
Figure 4.

Identification and validation of non-canonical MTSs. (A) Scheme of a luciferase reporter comprising the firefly luciferase open reading frame fused to the MYC-3′UTR. The latter comprises reported (gray bars, black letters), in silico predicted (gray bars, white letters) and RNAhybrid selected (black bars, white letters) MTSs of indicated miRNAs. Note, although an MTS for the miR-92-3p seed family was suggested at the 5′-end of the MYC-3′UTR, the exact sequence was not published and is thus not depicted. The lower panel depicts miRANDA, TargetScan or miRNAmap predicted MTSs (lower left panel) as suggested hybrids of miRNAs and MTSs. Putative MTSs (lower right panel) of not in silico predictable miRNAs were identified by RNAhybrid and are shown as suggested hybrids between miRNAs (middle panel) and putative MTSs (WT). In addition, mutations of candidate MTSs (MUT) in the MYC-3′UTR used in reporter analyses are indicated in gray. Mutated nucleotides are indicated in red. Note that the depicted miRNA hybrids with mutant MTSs are solely based on in silico evidence. (B, C) The activity of luciferase reporters comprising the full-length WT MYC-3′UTR (gray bars) or MTS-mutated full-length MYC-3′UTR (black bars; mutations are indicated in A) was determined in U2OS cells co-transfected with indicated miRNA decoy vectors (B) or HEK293 cells co-transfected with indicated miRNA-encoding shRNAs (C). The Renilla luciferase-normalized activity of reporters was determined relative to controls co-transfected with a cel-miR-239b-5p (cel-239b-5p)-directed decoy vector. Error bars indicate s.d. of at least three independent analyses. Statistical significance was determined by Student’s t-test: * P < 0.05; ** P < 0.005; and *** P < 0.0005. (D) The co-purification of indicated miRNAs with the full-length MYC-3′UTR (dark gray) or isolated candidate MTSs of miR-125a-3p (black) or miR-455-3p (light gray) was analyzed by miTRAP. Co-purification was monitored by qRT-PCR and assessed by the miTRAP ratio, essentially as described in Figure 1C. MiR-16-5p or -21-5p served as negative controls. (E) The activity of the luciferase reporter comprising the WT MYC-3′UTR was analyzed in cells co-transfected with indicated individual decoys (gray bars) or a combination of three decoy vectors (black bars). Relative reporter activity was determined as in (B). To allow transfection of the same total amount of decoy vectors, individual miRNA-directed decoy samples (gray bars) were co-transfected with indicated decoy and the control decoy (cel-239b-5p). Error bars indicate s.d. of three independent analyses. Statistical significance was determined by Student’s t-test: * P < 0.05.
To evaluate targeting by non-canonical miRNAs, we next investigated how the silencing of candidate miRNAs affected the activity of reporters comprising mutations in the putative MTSs (Figure 4B, black bars). Although the activity of the WT reporter (gray bars) was significantly increased on miRNA silencing, the activity of the respective mutant reporters (black bars) remained largely unaffected. This was supported by gain-of-function studies using transient miRNA overexpression by shRNA-encoding vectors (Figure 4C). In agreement with the loss-of-function analysis, the activity of the WT luciferase reporter was significantly decreased by all miRNAs analyzed (gray bars). Likewise, miRNA-dependent regulation was abolished for the mutant reporters when co-transfected with vectors encoding the respective candidate miRNAs (black bars). These results provided strong evidence for miRNA-directed regulation via the RNAhybrid-identified MTSs. However, these studies could not clarify base pairing at putative MTSs, as depicted schematically (Figure 4A), nor exclude bias by structural constraints due to inserted mutations. To further support targeting via the identified non-canonical MTSs, co-purification of miR-125-3p and -455-3p was explored in further detail by miTRAP. For these analyses, the isolated candidate MTSs of the MYC-3′UTR fused to four MS2 repeats were used as baits in U2OS lysates (Figure 4D). Consistent with the reporter studies and the regulation of endogenous MYC expression, selective co-purification for both miRNAs was observed with the respective MTS-baits as well as with the MYC-3′UTR. Notably, the regulatory miRNAs co-purified at miTRAP ratios similar to ratios observed for the full-length MYC-3′UTR bait. Hence, although the presented studies cannot exclude targeting of non-canonical miRNAs via additional sites or identify structural constraints of non-canonical miRNA-targeting, the analyses provide strong evidence that miTRAP identifies non-canonical miRNAs regulating the expression of MYC.
The identification of several miRNAs regulating the expression of MYC is in line with the assumption that most target mRNAs are subjected to the regulation by multiple miRNAs, which presumably act in an additive manner (64,65). To test this for the novel MYC-regulatory miRNAs identified here, the activity of the WT MYC-3′UTR luciferase reporter was analyzed in response to the concurrent silencing of miRNAs with non-overlapping MTSs (Figure 4E). In contrast to the silencing of individual miRNAs (gray bars), the observed upregulation of reporter activity was significantly increased by their combined inactivation (black bars) indicating additive repression of reporter activity. This suggested that MYC expression is subjected to 3′UTR-dependent control by multiple miRNAs.
In summary, these findings indicated that miTRAP allowed the rapid and comprehensive identification of MYC-regulatory miRNAs. Notably, miTRAP also identified miRNAs acting via non-canonical MTSs and in an additive manner.
DISCUSSION
One of the key limitations in deciphering the role of miRNA-dependent regulation of gene expression is the reliable identification of physiological relevant miRNA–target interactions. Although in silico prediction tools suggest a variety of canonical miRNA candidates for a given target gene, the output of distinct databases varies substantially, and all databases miss miRNAs regulating via non-canonical targeting sites. Moreover, in silico predictions at present do not account for the cell context-dependent abundance of miRNAs or the modulation of miRNA-targeting by trans-acting regulators like RBPs. Hence, experimental approaches are required to accelerate the identification and, in particular, the evaluation of physiologically relevant miRNA–target interactions in a cellular or tissue context of interest. However, reported experimental approaches are limited by various means and either remain labor intense (24,25) or suggest an unreasonable high (28) or low number of regulatory miRNAs (26,27), respectively. Moreover, all of these approaches require transient or stable genetic manipulation. Although this is feasible in various tissue-cultured cells, genetic manipulations constitute an essential limitation in various primary samples, in particular post-mitotic cells like neurons. Therefore, it was the aim of this study to evaluate the suitability of an evolved in vitro RNA affinity purification to identify regulatory miRNAs co-purifying with in vitro transcribed bait RNAs from cell lysates. Combined with next-generation sequencing, the elaborated miTRAP (miRNA trapping by in vitro RNA affinity purification) protocol allowed the rapid and comprehensive identification of canonical but more importantly also of non-canonical miRNAs controlling the expression of MYC in tumor-derived cells.
Although miTRAP cannot be combined with the chemical or UV-based stabilization of protein–RNA complexes before cell lysis, the study presented here once again provides strong evidence that the selectivity of miRNA–target transcript association is preserved in cell lysates. Moreover, the developed miTRAP protocol demonstrates that miRNAs selectively associate with in vitro transcribed RNA baits lacking 5′- or 3′-modifications like a poly(A)-tail. This suggests that miRNA targeting is facilitated by RISC components in a largely cell compartment or transcript-modification independent manner and is thus predominantly directed by the capability of miRNAs to target a specific transcript via the RISC. For some miRNAs, this targeting was shown to depend on cross-regulation by additional trans-acting factors, in particular RBPs (15). As demonstrated for the ARE-binding protein ELAVL1 (HUR) (61), such trans-acting RBPs can be identified by miTRAP as well. Nonetheless, it remains to be determined by future studies whether miTRAP is also suitable for analyzing how trans-acting RBPs or other long ncRNAs affect miRNA targeting. In this respect, it has to be considered that miTRAP relies on a significant excess of bait RNAs over endogenous target (m)RNAs. For the MYC-3′UTR analyses, the bait transcript was used in an estimated 103–104-fold molar excess. Although this may bias analyses of how trans-acting factors like RBPs modulate miRNA-targeting, this excess apparently does not bias the selectivity of miRNA-targeting. This conclusion is supported by the observation that two point mutations in the context of the full-length MYC-3′UTR abolished targeting of let-7-5p as well as miR-34-5p family members. The initially unexpected high specificity of miRNA-targeting was moreover not biased by the length of used RNA baits. Although more than three times longer than the MYC-3′UTR (∼0.4 kb), selective miRNA co-purification was also observed for the ZEB2-3′UTR (∼1.4 kb). Preliminary studies even indicate that selective miRNA-targeting is observed for 3′UTRs with a length of up to ∼7 kb (data not shown). Moreover, miTRAP appears largely unbiased by the abundance of endogenous miRNAs. Although co-purification was increased for highly abundant miRNAs, miTRAP also identified selective co-purification of low abundant miRNAs. Most notably, however, the selectivity of miTRAP remained unaffected by miRNA levels, as the highly abundant miR-21-5p (>20% of all miRNAs in U2OS cells) was not selectively co-purified with either the MYC- or ZEB2-3′UTRs. The quantitative assessment of miRNAs co-purified with the MYC-3′UTR identified the let-7-5p and miR-34-5p families to sum up to >80% of all candidate miRNAs (>60% of all miRNAs in MYC libraries). This was consistent with the observation that inactivation of the overlapping let-7-5p/miR-34-5p MTS substantially reduced AGO2 association with MYC-3′UTR bait transcripts. Whether this indicates the let-7-5p/miR-34-5p families, as the main regulatory miRNAs controlling MYC expression requires further in-depth analyses, which may suggest miTRAP allows evaluating the regulatory potency of miRNAs and MTSs.
In accord with a high selectivity, miTRAP identified MYC-regulatory miRNAs at a surprisingly low false-positive rate. The method allowed the identification of 10 novel MYC-regulatory miRNAs, although one of the analyzed candidates, miR-1294, only modulated the fate of a MYC-3′UTR comprising luciferase reporter, whereas the expression of endogenous MYC appeared largely unaffected by this miRNA. Notably, however, 9 of the 10 not previously reported candidates also controlled MYC expression at the endogenous level. Among these, five miRNAs regulated MYC mRNA fate via putative non-canonical targeting sites indicating that miTRAP provides a powerful tool to identify both, canonical and non-canonical miRNAs controlling target mRNA fate in vivo.
MiTRAP confirmed 18 previously reported MYC-regulatory miRNAs, whereas it missed 7 miRNAs previously suggested to control the expression of MYC and expressed in U2OS cells: 145-5p (44), 24-3p (43), 185-3p (37), 34b-5p (59), 33b-5p (42), 331-3p and 363-3p (40). For three of these miRNAs (miR-34b-5p, -33b-5p, and -363-3p), other members of the respective seed families, which were expressed at higher abundance, were identified by miTRAP. This suggests that low abundant family members cannot be identified in a reliable manner by miTRAP. Note that miRNAs <20 reads in the MYC-3′UTR libraries were discarded (see ‘Materials and Methods’ section). For the other non-identified, but previously suggested, MYC-regulatory miRNAs [miR-24-3p, (43), -145-5p (44), -185-3p (37)], it remains to be determined why they were not co-purified by miTRAP. However, it has to be noted that one of the respective miRNAs, miR-24-3p, was validated on the basis of luciferase reporters comprising an isolated MTS. The other two were validated on the basis of MTS-deleted reporters by gain-of-function analyses exclusively. Hence, it remains to be addressed whether these miRNAs are capable to control the expression of MYC via the suggested MTSs when embedded in the context of the native MYC-3′UTR. Moreover, it has to be analyzed whether regulation can be confirmed by loss-of-function studies, which are less biased than gain-of-function studies. Despite these missed putative miRNAs, it appears reasonable to conclude that miTRAP identified MYC-regulatory miRNAs at low false-positive and presumably also false-negative rates. Future studies will now have to reveal whether this is also observed for other bait transcripts and whether the method can be adapted to primary tissue samples. With respect to the suitability of miTRAP for other bait transcripts, our studies suggest that the method can be applied to 3′UTR-baits of varying length, as demonstrated by the selective co-purification of pro-epithelial miRNAs with the ZEB2-3′UTR. Preliminary studies also suggest that miTRAP can be used in tissue lysates, although nuclease activity remains a challenging limitation in various tissues so far.
Most of the MYC-regulatory miRNAs analyzed here apparently act via the 5′-end of the MYC-3′UTR. However, a conserved pattern of such an enrichment of miRNA-targeting in proximity to the stop codon was not confirmed by in silico analyses of other mRNAs containing AREs (AU-rich elements) in their 3′UTRs (data not shown). More strikingly, however, the findings presented here support the view that target gene expression is usually subjected to the control by multiple miRNAs. As determined by miRNA silencing, an additive increase in the activity of luciferase reporters comprising the MYC-3′UTR was observed when three miRNAs were silenced simultaneously. This is in accord with the view that the levels of MYC are tightly regulated by multiple layers and presumably multiple miRNAs (36,37). In this respect, it is also important to note that miTRAP suggests an additional negative feedback control of MYC expression, which could be facilitated via the miR-17/92 cluster. MiTRAP identified members of the miR-92-3p seed family (miRs: -92a-3p, -92b-3p and -25-3p) to inhibit MYC expression. Notably, miR-92a-3p is expressed from the miR-17/92 genomic cluster, which is activated by MYC (66). This suggests another negative feedback mechanism limiting the expression of factors essential to balance proliferation and apoptosis. Hence, as shown for E2F1 and other transcriptional regulators, negative feedback regulation via miRNAs likely also limits exceeding MYC activation (67). Notably, the ectopic expression of the fourth miR-92-3p family member, miR-363-3p, which is not expressed from the miR-17/92 cluster, was reported to interfere with the expression of MYC in Burkitt’s lymphoma cells (40).
In conclusion, the combination of miTRAP and miRNA-Seq provides an experimental screening approach suitable to identify regulatory miRNAs for an RNA bait of interest in a cellular context of choice. In contrast to previously reported technologies, miTRAP is advantageous by various means: (i) the technology allows the rapid and comprehensive identification of miRNAs at low false-positive and presumably low false-negative rates; (ii) miTRAP is independent of genetic manipulation of biological samples and may thus be advanced to allow analyses in samples barely or not accessible for these manipulations, e.g. primary tumor samples; (iii) the protocol is based on non-modified in vitro transcribed bait transcripts allowing the analysis of various, for instance, also non-coding or viral RNA baits; and (iv) miTRAP provides a potent approach for the identification of regulatory yet non-canonical and thus unpredictable miRNAs. Accordingly, miTRAP is a powerful tool for the identification of regulatory miRNAs in a broad variety of biological samples. This will substantially promote research aiming at the analysis of miRNA-dependent regulation in development and diseases.
SUPPLEMENTARY DATA
Supplementary Data are available at NAR Online.
FUNDING
Deutsche Forschungsgemeinschaft (DFG) funding [GRK1591 to S.H.]. Funding for open access charge: DFG funding [GRK1591].
Conflict of interest statement. None declared.
Supplementary Material
ACKNOWLEDGEMENTS
The authors thank Anne Baude and Kristin Wächter for advice in RNA affinity purification and purification of recombinant MBP-MS2BP. PLVTHM and an expression plasmid encoding MBP-MS2CP were obtained from Addgene. J.B. and S.H. conceived and designed the experiments. J.B. carried out and interpreted the experiments, with help from B.B. (Figure 4B). K.K. performed deep sequencing and mapped miRNAs. J.B. and D.M. analyzed miRNA-Seq data. D.M. created the R software-script. J.B. and S.H. wrote the manuscript.
REFERENCES
- 1.Tritschler F, Huntzinger E, Izaurralde E. Role of GW182 proteins and PABPC1 in the miRNA pathway: a sense of deja vu. Nat. Rev. Mol. Cell Biol. 2010;11:379–384. doi: 10.1038/nrm2885. [DOI] [PubMed] [Google Scholar]
- 2.Pasquinelli AE. MicroRNAs and their targets: recognition, regulation and an emerging reciprocal relationship. Nat. Rev. Genet. 2012;13:271–282. doi: 10.1038/nrg3162. [DOI] [PubMed] [Google Scholar]
- 3.Fang Z, Rajewsky N. The impact of miRNA target sites in coding sequences and in 3′UTRs. PLoS One. 2011;6:e18067. doi: 10.1371/journal.pone.0018067. [DOI] [PMC free article] [PubMed] [Google Scholar]
- 4.Wilson JA, Huys A. miR-122 Promotion of the hepatitis C virus life cycle: sound in the silence. Wiley Interdiscip. Rev. RNA. 2013;4:665–676. doi: 10.1002/wrna.1186. [DOI] [PubMed] [Google Scholar]
- 5.Griffiths-Jones S. The microRNA Registry. Nucleic Acids Res. 2004;32:D109–D111. doi: 10.1093/nar/gkh023. [DOI] [PMC free article] [PubMed] [Google Scholar]
- 6.Griffiths-Jones S, Grocock RJ, van Dongen S, Bateman A, Enright AJ. miRBase: microRNA sequences, targets and gene nomenclature. Nucleic Acids Res. 2006;34:D140–D144. doi: 10.1093/nar/gkj112. [DOI] [PMC free article] [PubMed] [Google Scholar]
- 7.Griffiths-Jones S, Saini HK, van Dongen S, Enright AJ. miRBase: tools for microRNA genomics. Nucleic Acids Res. 2008;36:D154–D158. doi: 10.1093/nar/gkm952. [DOI] [PMC free article] [PubMed] [Google Scholar]
- 8.Kozomara A, Griffiths-Jones S. miRBase: integrating microRNA annotation and deep-sequencing data. Nucleic Acids Res. 2011;39:D152–D157. doi: 10.1093/nar/gkq1027. [DOI] [PMC free article] [PubMed] [Google Scholar]
- 9.De Mulder K, Berezikov E. Tracing the evolution of tissue identity with microRNAs. Genome Biol. 2010;11:111. doi: 10.1186/gb-2010-11-3-111. [DOI] [PMC free article] [PubMed] [Google Scholar]
- 10.Bartel DP. MicroRNAs: target recognition and regulatory functions. Cell. 2009;136:215–233. doi: 10.1016/j.cell.2009.01.002. [DOI] [PMC free article] [PubMed] [Google Scholar]
- 11.Reinhart BJ, Slack FJ, Basson M, Pasquinelli AE, Bettinger JC, Rougvie AE, Horvitz HR, Ruvkun G. The 21-nucleotide let-7 RNA regulates developmental timing in Caenorhabditis elegans. Nature. 2000;403:901–906. doi: 10.1038/35002607. [DOI] [PubMed] [Google Scholar]
- 12.Shin C, Nam JW, Farh KK, Chiang HR, Shkumatava A, Bartel DP. Expanding the microRNA targeting code: functional sites with centered pairing. Mol. Cell. 2010;38:789–802. doi: 10.1016/j.molcel.2010.06.005. [DOI] [PMC free article] [PubMed] [Google Scholar]
- 13.Helwak A, Kudla G, Dudnakova T, Tollervey D. Mapping the human miRNA interactome by CLASH reveals frequent noncanonical binding. Cell. 2013;153:654–665. doi: 10.1016/j.cell.2013.03.043. [DOI] [PMC free article] [PubMed] [Google Scholar]
- 14.Thomson DW, Bracken CP, Goodall GJ. Experimental strategies for microRNA target identification. Nucleic Acids Res. 2011;39:6845–6853. doi: 10.1093/nar/gkr330. [DOI] [PMC free article] [PubMed] [Google Scholar]
- 15.van Kouwenhove M, Kedde M, Agami R. MicroRNA regulation by RNA-binding proteins and its implications for cancer. Nat. Rev. Cancer. 2011;11:644–656. doi: 10.1038/nrc3107. [DOI] [PubMed] [Google Scholar]
- 16.Lim LP, Lau NC, Garrett-Engele P, Grimson A, Schelter JM, Castle J, Bartel DP, Linsley PS, Johnson JM. Microarray analysis shows that some microRNAs downregulate large numbers of target mRNAs. Nature. 2005;433:769–773. doi: 10.1038/nature03315. [DOI] [PubMed] [Google Scholar]
- 17.Selbach M, Schwanhausser B, Thierfelder N, Fang Z, Khanin R, Rajewsky N. Widespread changes in protein synthesis induced by microRNAs. Nature. 2008;455:58–63. doi: 10.1038/nature07228. [DOI] [PubMed] [Google Scholar]
- 18.Hendrickson DG, Hogan DJ, McCullough HL, Myers JW, Herschlag D, Ferrell JE, Brown PO. Concordant regulation of translation and mRNA abundance for hundreds of targets of a human microRNA. PLoS Biol. 2009;7:e1000238. doi: 10.1371/journal.pbio.1000238. [DOI] [PMC free article] [PubMed] [Google Scholar]
- 19.Easow G, Teleman AA, Cohen SM. Isolation of microRNA targets by miRNP immunopurification. RNA. 2007;13:1198–1204. doi: 10.1261/rna.563707. [DOI] [PMC free article] [PubMed] [Google Scholar]
- 20.Chi SW, Zang JB, Mele A, Darnell RB. Argonaute HITS-CLIP decodes microRNA-mRNA interaction maps. Nature. 2009;460:479–486. doi: 10.1038/nature08170. [DOI] [PMC free article] [PubMed] [Google Scholar]
- 21.Cambronne XA, Shen R, Auer PL, Goodman RH. Capturing microRNA targets using an RNA-induced silencing complex (RISC)-trap approach. Proc. Natl Acad. Sci. USA. 2012;109:20473–20478. doi: 10.1073/pnas.1218887109. [DOI] [PMC free article] [PubMed] [Google Scholar]
- 22.Orom UA, Lund AH. Isolation of microRNA targets using biotinylated synthetic microRNAs. Methods. 2007;43:162–165. doi: 10.1016/j.ymeth.2007.04.007. [DOI] [PubMed] [Google Scholar]
- 23.Hafner M, Landthaler M, Burger L, Khorshid M, Hausser J, Berninger P, Rothballer A, Ascano M, Jr, Jungkamp AC, Munschauer M, et al. Transcriptome-wide identification of RNA-binding protein and microRNA target sites by PAR-CLIP. Cell. 2010;141:129–141. doi: 10.1016/j.cell.2010.03.009. [DOI] [PMC free article] [PubMed] [Google Scholar]
- 24.Wu S, Huang S, Ding J, Zhao Y, Liang L, Liu T, Zhan R, He X. Multiple microRNAs modulate p21Cip1/Waf1 expression by directly targeting its 3′ untranslated region. Oncogene. 2010;29:2302–2308. doi: 10.1038/onc.2010.34. [DOI] [PubMed] [Google Scholar]
- 25.Gaken J, Mohamedali AM, Jiang J, Malik F, Stangl D, Smith AE, Chronis C, Kulasekararaj AG, Thomas NS, Farzaneh F, et al. A functional assay for microRNA target identification and validation. Nucleic Acids Res. 2012;40:e75. doi: 10.1093/nar/gks145. [DOI] [PMC free article] [PubMed] [Google Scholar]
- 26.Vo NK, Dalton RP, Liu N, Olson EN, Goodman RH. Affinity purification of microRNA-133a with the cardiac transcription factor, Hand2. Proc. Natl Acad. Sci. USA. 2010;107:19231–19236. doi: 10.1073/pnas.1013162107. [DOI] [PMC free article] [PubMed] [Google Scholar]
- 27.Yoon JH, Srikantan S, Gorospe M. MS2-TRAP (MS2-tagged RNA affinity purification): tagging RNA to identify associated miRNAs. Methods. 2012;58:81–87. doi: 10.1016/j.ymeth.2012.07.004. [DOI] [PMC free article] [PubMed] [Google Scholar]
- 28.Hassan T, Smith SG, Gaughan K, Oglesby IK, O'Neill S, McElvaney NG, Greene CM. Isolation and identification of cell-specific microRNAs targeting a messenger RNA using a biotinylated anti-sense oligonucleotide capture affinity technique. Nucleic Acids Res. 2013;41:e71. doi: 10.1093/nar/gks1466. [DOI] [PMC free article] [PubMed] [Google Scholar]
- 29.Schulman BR, Esquela-Kerscher A, Slack FJ. Reciprocal expression of lin-41 and the microRNAs let-7 and mir-125 during mouse embryogenesis. Dev. Dyn. 2005;234:1046–1054. doi: 10.1002/dvdy.20599. [DOI] [PMC free article] [PubMed] [Google Scholar]
- 30.Czaplinski K, Kocher T, Schelder M, Segref A, Wilm M, Mattaj IW. Identification of 40LoVe, a Xenopus hnRNP D family protein involved in localizing a TGF-beta-related mRNA during oogenesis. Dev. Cell. 2005;8:505–515. doi: 10.1016/j.devcel.2005.01.012. [DOI] [PubMed] [Google Scholar]
- 31.Zhou Z, Licklider LJ, Gygi SP, Reed R. Comprehensive proteomic analysis of the human spliceosome. Nature. 2002;419:182–185. doi: 10.1038/nature01031. [DOI] [PubMed] [Google Scholar]
- 32.Riley KJ, Yario TA, Steitz JA. Association of Argonaute proteins and microRNAs can occur after cell lysis. RNA. 2012;18:1581–1585. doi: 10.1261/rna.034934.112. [DOI] [PMC free article] [PubMed] [Google Scholar]
- 33.Mathonnet G, Fabian MR, Svitkin YV, Parsyan A, Huck L, Murata T, Biffo S, Merrick WC, Darzynkiewicz E, Pillai RS, et al. MicroRNA inhibition of translation initiation in vitro by targeting the cap-binding complex eIF4F. Science. 2007;317:1764–1767. doi: 10.1126/science.1146067. [DOI] [PubMed] [Google Scholar]
- 34.Meyer N, Penn LZ. Reflecting on 25 years with MYC. Nat. Rev. Cancer. 2008;8:976–990. doi: 10.1038/nrc2231. [DOI] [PubMed] [Google Scholar]
- 35.Eilers M, Eisenman RN. Myc's broad reach. Genes Dev. 2008;22:2755–2766. doi: 10.1101/gad.1712408. [DOI] [PMC free article] [PubMed] [Google Scholar]
- 36.Facchini LM, Chen S, Marhin WW, Lear JN, Penn LZ. The Myc negative autoregulation mechanism requires Myc-Max association and involves the c-myc P2 minimal promoter. Mol. Cell Biol. 1997;17:100–114. doi: 10.1128/mcb.17.1.100. [DOI] [PMC free article] [PubMed] [Google Scholar]
- 37.Liao JM, Lu H. Autoregulatory suppression of c-Myc by miR-185-3p. J. Biol. Chem. 2011;286:33901–33909. doi: 10.1074/jbc.M111.262030. [DOI] [PMC free article] [PubMed] [Google Scholar]
- 38.Shah YM, Morimura K, Yang Q, Tanabe T, Takagi M, Gonzalez FJ. Peroxisome proliferator-activated receptor alpha regulates a microRNA-mediated signaling cascade responsible for hepatocellular proliferation. Mol. Cell Biol. 2007;27:4238–4247. doi: 10.1128/MCB.00317-07. [DOI] [PMC free article] [PubMed] [Google Scholar]
- 39.Sampson VB, Rong NH, Han J, Yang Q, Aris V, Soteropoulos P, Petrelli NJ, Dunn SP, Krueger LJ. MicroRNA let-7a down-regulates MYC and reverts MYC-induced growth in Burkitt lymphoma cells. Cancer Res. 2007;67:9762–9770. doi: 10.1158/0008-5472.CAN-07-2462. [DOI] [PubMed] [Google Scholar]
- 40.Bueno MJ, Gomez de Cedron M, Gomez-Lopez G, Perez de Castro I, Di Lisio L, Montes-Moreno S, Martinez N, Guerrero M, Sanchez-Martinez R, Santos J, et al. Combinatorial effects of microRNAs to suppress the Myc oncogenic pathway. Blood. 2011;117:6255–6266. doi: 10.1182/blood-2010-10-315432. [DOI] [PubMed] [Google Scholar]
- 41.Kong YW, Cannell IG, de Moor CH, Hill K, Garside PG, Hamilton TL, Meijer HA, Dobbyn HC, Stoneley M, Spriggs KA, et al. The mechanism of micro-RNA-mediated translation repression is determined by the promoter of the target gene. Proc. Natl Acad. Sci. USA. 2008;105:8866–8871. doi: 10.1073/pnas.0800650105. [DOI] [PMC free article] [PubMed] [Google Scholar]
- 42.Takwi AA, Li Y, Becker Buscaglia LE, Zhang J, Choudhury S, Park AK, Liu M, Young KH, Park WY, Martin RC, et al. A statin-regulated microRNA represses human c-Myc expression and function. EMBO Mol. Med. 2012;4:896–909. doi: 10.1002/emmm.201101045. [DOI] [PMC free article] [PubMed] [Google Scholar]
- 43.Lal A, Navarro F, Maher CA, Maliszewski LE, Yan N, O'Day E, Chowdhury D, Dykxhoorn DM, Tsai P, Hofmann O, et al. miR-24 Inhibits cell proliferation by targeting E2F2, MYC, and other cell-cycle genes via binding to “seedless” 3′UTR microRNA recognition elements. Mol. Cell. 2009;35:610–625. doi: 10.1016/j.molcel.2009.08.020. [DOI] [PMC free article] [PubMed] [Google Scholar]
- 44.Sachdeva M, Zhu S, Wu F, Wu H, Walia V, Kumar S, Elble R, Watabe K, Mo YY. p53 represses c-Myc through induction of the tumor suppressor miR-145. Proc. Natl Acad. Sci. USA. 2009;106:3207–3212. doi: 10.1073/pnas.0808042106. [DOI] [PMC free article] [PubMed] [Google Scholar]
- 45.Weidensdorfer D, Stohr N, Baude A, Lederer M, Kohn M, Schierhorn A, Buchmeier S, Wahle E, Huttelmaier S. Control of c-myc mRNA stability by IGF2BP1-associated cytoplasmic RNPs. RNA. 2009;15:104–115. doi: 10.1261/rna.1175909. [DOI] [PMC free article] [PubMed] [Google Scholar]
- 46.Braun J, Hoang-Vu C, Dralle H, Huttelmaier S. Downregulation of microRNAs directs the EMT and invasive potential of anaplastic thyroid carcinomas. Oncogene. 2010;29:4237–4244. doi: 10.1038/onc.2010.169. [DOI] [PubMed] [Google Scholar]
- 47.Wiznerowicz M, Trono D. Conditional suppression of cellular genes: lentivirus vector-mediated drug-inducible RNA interference. J. Virol. 2003;77:8957–8961. doi: 10.1128/JVI.77.16.8957-8961.2003. [DOI] [PMC free article] [PubMed] [Google Scholar]
- 48.Haraguchi T, Ozaki Y, Iba H. Vectors expressing efficient RNA decoys achieve the long-term suppression of specific microRNA activity in mammalian cells. Nucleic Acids Res. 2009;37:e43. doi: 10.1093/nar/gkp040. [DOI] [PMC free article] [PubMed] [Google Scholar]
- 49.Zhou Z, Reed R. Purification of functional RNA-protein complexes using MS2-MBP. Curr. Protoc. Mol. Biol. 2003 doi: 10.1002/0471142727.mb2703s63. Chapter 27, Unit 27.23. [DOI] [PubMed] [Google Scholar]
- 50.Kohn M, Lederer M, Wachter K, Huttelmaier S. Near-infrared (NIR) dye-labeled RNAs identify binding of ZBP1 to the noncoding Y3-RNA. RNA. 2010;16:1420–1428. doi: 10.1261/rna.2152710. [DOI] [PMC free article] [PubMed] [Google Scholar]
- 51.Martin M. Cutadapt removes adapter sequences from high-throughput sequencing reads. EMBnet J. 2011;17:1. [Google Scholar]
- 52.Langmead B, Trapnell C, Pop M, Salzberg SL. Ultrafast and memory-efficient alignment of short DNA sequences to the human genome. Genome Biol. 2009;10:R25. doi: 10.1186/gb-2009-10-3-r25. [DOI] [PMC free article] [PubMed] [Google Scholar]
- 53.Li H, Handsaker B, Wysoker A, Fennell T, Ruan J, Homer N, Marth G, Abecasis G, Durbin R. The Sequence Alignment/Map format and SAMtools. Bioinformatics. 2009;25:2078–2079. doi: 10.1093/bioinformatics/btp352. [DOI] [PMC free article] [PubMed] [Google Scholar]
- 54.Gentleman RC, Carey VJ, Bates DM, Bolstad B, Dettling M, Dudoit S, Ellis B, Gautier L, Ge Y, Gentry J, et al. Bioconductor: open software development for computational biology and bioinformatics. Genome Biol. 2004;5:R80. doi: 10.1186/gb-2004-5-10-r80. [DOI] [PMC free article] [PubMed] [Google Scholar]
- 55.Morgan M, Anders S, Lawrence M, Aboyoun P, Pages H, Gentleman R. ShortRead: a bioconductor package for input, quality assessment and exploration of high-throughput sequence data. Bioinformatics. 2009;25:2607–2608. doi: 10.1093/bioinformatics/btp450. [DOI] [PMC free article] [PubMed] [Google Scholar]
- 56.Robinson MD, McCarthy DJ, Smyth GK. edgeR: a Bioconductor package for differential expression analysis of digital gene expression data. Bioinformatics. 2010;26:139–140. doi: 10.1093/bioinformatics/btp616. [DOI] [PMC free article] [PubMed] [Google Scholar]
- 57.Robinson MD, Oshlack A. A scaling normalization method for differential expression analysis of RNA-seq data. Genome Biol. 2010;11:R25. doi: 10.1186/gb-2010-11-3-r25. [DOI] [PMC free article] [PubMed] [Google Scholar]
- 58.Robinson MD, Smyth GK. Small-sample estimation of negative binomial dispersion, with applications to SAGE data. Biostatistics. 2008;9:321–332. doi: 10.1093/biostatistics/kxm030. [DOI] [PubMed] [Google Scholar]
- 59.Kress TR, Cannell IG, Brenkman AB, Samans B, Gaestel M, Roepman P, Burgering BM, Bushell M, Rosenwald A, Eilers M. The MK5/PRAK kinase and Myc form a negative feedback loop that is disrupted during colorectal tumorigenesis. Mol. Cell. 2011;41:445–457. doi: 10.1016/j.molcel.2011.01.023. [DOI] [PubMed] [Google Scholar]
- 60.Cannell IG, Kong YW, Johnston SJ, Chen ML, Collins HM, Dobbyn HC, Elia A, Kress TR, Dickens M, Clemens MJ, et al. p38 MAPK/MK2-mediated induction of miR-34c following DNA damage prevents Myc-dependent DNA replication. Proc. Natl Acad. Sci. USA. 2010;107:5375–5380. doi: 10.1073/pnas.0910015107. [DOI] [PMC free article] [PubMed] [Google Scholar]
- 61.Kim HH, Kuwano Y, Srikantan S, Lee EK, Martindale JL, Gorospe M. HuR recruits let-7/RISC to repress c-Myc expression. Genes Dev. 2009;23:1743–1748. doi: 10.1101/gad.1812509. [DOI] [PMC free article] [PubMed] [Google Scholar]
- 62.Gregory PA, Bert AG, Paterson EL, Barry SC, Tsykin A, Farshid G, Vadas MA, Khew-Goodall Y, Goodall GJ. The miR-200 family and miR-205 regulate epithelial to mesenchymal transition by targeting ZEB1 and SIP1. Nat. Cell Biol. 2008;10:593–601. doi: 10.1038/ncb1722. [DOI] [PubMed] [Google Scholar]
- 63.McCarthy DJ, Chen Y, Smyth GK. Differential expression analysis of multifactor RNA-Seq experiments with respect to biological variation. Nucleic Acids Res. 2012;40:4288–4297. doi: 10.1093/nar/gks042. [DOI] [PMC free article] [PubMed] [Google Scholar]
- 64.Doench JG, Sharp PA. Specificity of microRNA target selection in translational repression. Genes Dev. 2004;18:504–511. doi: 10.1101/gad.1184404. [DOI] [PMC free article] [PubMed] [Google Scholar]
- 65.Didiano D, Hobert O. Molecular architecture of a miRNA-regulated 3′ UTR. RNA. 2008;14:1297–1317. doi: 10.1261/rna.1082708. [DOI] [PMC free article] [PubMed] [Google Scholar]
- 66.O'Donnell KA, Wentzel EA, Zeller KI, Dang CV, Mendell JT. c-Myc-regulated microRNAs modulate E2F1 expression. Nature. 2005;435:839–843. doi: 10.1038/nature03677. [DOI] [PubMed] [Google Scholar]
- 67.Sylvestre Y, De Guire V, Querido E, Mukhopadhyay UK, Bourdeau V, Major F, Ferbeyre G, Chartrand P. An E2F/miR-20a autoregulatory feedback loop. J. Biol. Chem. 2007;282:2135–2143. doi: 10.1074/jbc.M608939200. [DOI] [PubMed] [Google Scholar]
Associated Data
This section collects any data citations, data availability statements, or supplementary materials included in this article.