


Abstract
DNA methylation is an important epigenetic modification that has essential roles in cellular processes including gene regulation, development and disease and is widely dysregulated in most types of cancer. Recent advances in sequencing technology have enabled the measurement of DNA methylation at single nucleotide resolution through methods such as whole-genome bisulfite sequencing and reduced representation bisulfite sequencing. In DNA methylation studies, a key task is to identify differences under distinct biological contexts, for example, between tumor and normal tissue. A challenge in sequencing studies is that the number of biological replicates is often limited by the costs of sequencing. The small number of replicates leads to unstable variance estimation, which can reduce accuracy to detect differentially methylated loci (DML). Here we propose a novel statistical method to detect DML when comparing two treatment groups. The sequencing counts are described by a lognormal-beta-binomial hierarchical model, which provides a basis for information sharing across different CpG sites. A Wald test is developed for hypothesis testing at each CpG site. Simulation results show that the proposed method yields improved DML detection compared to existing methods, particularly when the number of replicates is low. The proposed method is implemented in the Bioconductor package DSS.
INTRODUCTION
DNA methylation is an epigenetic modification that plays an important role in normal development and gene regulation (1–3). It involves the addition of a methyl group to the 5-position of a cytosine of CpG dinucleotides, with very rare cases that happen in CHG and CHH (H = A, T or C) (4). Methylation of a cytosine within a gene promoter region can repress gene expression by interfering with the binding of transcription factors or by binding proteins that inhibit transcription (5,6), while methylation within gene bodies has a heterogeneous relationship with gene expression (7–9). Given its influence on gene expression, both the biological consequences and causes of changes in DNA methylation are of great interest, and a common goal of DNA methylation studies is to identify differentially methylated loci (DML) across different biological conditions.
Comparisons of DNA methylation across different conditions have traditionally been performed at the candidate gene level. However, methods for assessing whole-genome methylation have recently improved substantially in terms of accuracy, genomic coverage, resolution and affordability. Current sequencing-based methods for methylation analysis can be classified into two categories: enrichment- (10) and bisulfite-conversion-based methods (11). Enrichment-based methods such as MeDIP-seq (10), MBD-seq (12,13) and methylCap-seq use different methyl-binding proteins or antibodies to enrich for methylated DNA fragments, followed by the application of next-generation sequencing of the fragments and alignment to a reference genome to estimate methylation levels at a 100–200-bp resolution. In contrast, bisulfite-conversion-based methods such as whole-genome bisulfite sequencing (BS-seq or MethylC-seq) (8,14) and reduced representation bisulfite sequencing (RRBS) (15,16) allow estimation of methylation proportions at a single-nucleotide resolution. Treatment of DNA with sodium bisulfite induces deamination and conversion of unmethylated cytosines to uracil, which will be amplified as thymine, while methylated cytosines are protected by the methyl group and remain unchanged. Bisulfite sequencing data can be analyzed by counting the number of sequencing reads for each CpG site where either a thymine or a cytosine is observed. The count of thymine represents the number of sequenced DNA strands that are unmethylated (U) and the count of cytosine represents the number of DNA strands that are methylated (M) at this CpG site. By taking the ratio of methylated number (M) to the total number of reads (M + U), the proportion of methylated DNA can be calculated as M/(M + U). By this process, DNA methylation proportions can be estimated at single-nucleotide resolution with genome-wide coverage via BS-seq, or with limited coverage (5–10% of all CpG sites genome-wide) via RRBS.
Because BS-seq has become available only recently, there is not yet a consensus on statistical approaches for analyzing these data. In simple two-group comparisons, existing methods such as Fisher’s exact tests [e.g. (4,17–19)] or t-tests [e.g. (17,20)] are often applied to detect DML. However, the use of Fisher’s exact test is problematic in that it is typically carried out by summing read counts across replicates in each group, a strategy which implicitly assumes that the data are from the identical distribution and thus ignores variation among biological replicates. This problem can be avoided by using a t-test to compare the methylation proportions [estimated as M/(M + U) for each replicate] across the two groups, but this approach does not account for the variance of the point estimates M/(M + U) and thus ignores information on coverage depth. Moreover, given the prohibitive costs of BS-seq experiments, there may not be sufficient observations for the asymptotic assumption of a t-distribution to hold. For example, a recent RRBS study of DNA methylation in the early mammalian embryo included only 2–5 replicates per condition (21). The small sample size also leads to unstable estimation of within-group variance, and subsequently undesirable test results. Recently several methods have been proposed for detecting differentially methylated regions (DMRs) from whole-genome BS-seq data (20,22,23). These methods first estimate the mean methylation levels through smoothing, and compare methylation across conditions via either a t-test (BSmooth) (20) or a Wald test based on a generalized linear-model framework (BiSeq) (22). Another recently proposed method uses an adjusted χ2-test (23) in which a design effect parameter is calculated based on clustering information and then used to adjust the methylation counts and coverage. However, these methods face the same problems described above in that the within-group variance cannot be stably estimated when sample size is small.
In this article, we present a novel statistical method for DML detection that addresses the different sources of variation and the small-sample problem. There are two potential sources of variation in BS-seq data: technical variation that reflects the measurement error resulting from the sampling of DNA segments during sequencing, and biological variation among replicates that reflects the heterogeneity among samples in the same treatment group (24,25). Our method is based on a Bayesian hierarchical model that accounts for this hierarchy of variation between and within replicates by employing a beta-binomial model. Similar hierarchical models have been proposed to analyze gene expression data, including a gamma-Poisson distribution to model RNA-seq count data (24,26–31), and recently, a beta-binomial distribution to model differential gene expression in paired high-throughput sequencing samples (32). To improve the performance of our method when the number of replicates is low, we employ a shrinkage approach; this strategy has previously been shown to improve detection of differential expression in microarray and RNA-seq studies (24,28,30,31). With this approach, we borrow information from CpG sites across the genome to stabilize the estimation of the dispersion parameters. We then derive a computationally efficient Wald test based on our model and the shrunk dispersion parameter estimates. Our simulation results show that by appropriately modeling the sources of variation and borrowing information across the genome to obtain stabilized dispersion parameter estimates, our method leads to better performance to identify true DML compared to existing methods, particularly when the number of replicates is low.
MATERIALS AND METHODS
The Bayesian hierarchical model
To characterize the data, we propose the following Bayesian hierarchical model, based on the beta-binomial distribution. Notation for our model is as follows: at the i-th CpG site, j-th group and k-th replicate,  is the number of reads that show methylation,
  is the total number of reads that cover this position and
  is the underlying ‘true’ methylation proportion. Since the process of sequencing involves the random sampling of two kinds of reads—methylated or unmethylated,
  will follow a binomial distribution:
Since the true methylation proportions among replicates can be anywhere between 0 and 1, we assume that the proportions for each CpG site within each group of replicates follow a beta distribution. The beta distribution has long been a natural choice to model binomial proportions as it is a conjugate distribution of the binomial distribution and is the most flexible distribution with a support interval of [0,1].
Here the beta distribution is parameterized by mean (denoted by  ) and dispersion (denoted by
  ). Compared with the traditional parameterization of the Beta (
 ) distribution, the parameters have the following relationship:
In this hierarchical model, the biological variation among replicates is captured by the beta distribution and the variation due to the random sampling of DNA segments during sequencing is captured by the binomial distribution. The dispersion parameter  captures the variation of a CpG site’s methylation proportion relative to the group mean. We allow each CpG site within a single condition (e.g. within cases, or controls) to have its own dispersion. This is a flexible assumption because it allows either different or common dispersions for both conditions; however, our software also includes an option to assume a common dispersion for cases and controls.
To combine information across all CpG sites, based on the observed distribution of dispersion from a publicly available RRBS dataset on mouse embryogenesis (21), we assumed the following prior on  :
:
where  and
and  are mean and variance parameters that can be estimated from the data. For each CpG site in this dataset, we applied a method of moments (MOM) estimator to estimate the dispersion parameters. As shown in Figure 1, the genome-wide distribution of logarithm dispersion parameter estimates is approximately Gaussian with mean = –3.39 and SD = 1.08, suggesting that the dispersion parameters can be well-described by a log-normal distribution. However, simulations using dispersions from different distributions also show that our proposed method is robust to violations of this log-normal assumption (Supplementary Figure S1).
Figure 1.

Histogram of the logarithm of estimated CpG-specific dispersion ( , estimated by MOM) from mouse embryogenesis data (21) for one chromosome. The solid line is the theoretical density curve for a normal distribution with parameters estimated from
  This demonstrates that
  can be approximately modeled as a log-normal distribution.
Parameter estimation
To estimate the parameters of the prior distribution in a general setting, we first use the MOM to estimate the dispersion parameters for all CpG sites, and then estimate  and
and  as the mean and variance of the logarithm of the dispersion estimates. The mean methylation levels are estimated as
 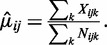 Under the hierarchical model, the conditional posterior distribution of
  satisfies:
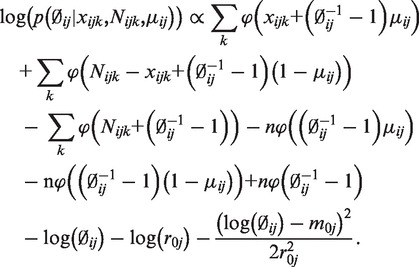 |
A point estimate of  can be obtained by maximizing this conditional posterior likelihood. In practice, we use the Newton–Raphson method after plugging in the estimates of
  ,
,  and
and  . Because we estimate
  and
and  from the data, the estimated
  is therefore an empirical Bayes estimate, which shrinks toward the common prior mean. Also notable is that the last line of the above equation includes the penalty function
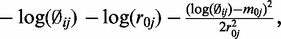 which will penalize extremely large
  in our estimation.
Statistical test procedure
After estimating the parameters for each group as described above, hypothesis tests can be performed at each CpG site to compare mean methylation levels between two groups, e.g. test 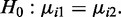 We propose to use a Wald test. The variance of
  is derived as follows. First, the variance of
  is (based on beta-binomial distribution):
So,
 |
(1.1) |
The estimated variance of  can be obtained by plugging in estimated values of
  and
and  to Equation (1.1). For two-group comparisons, a Wald test of the i-th CpG site is:
| (1.2) |
where 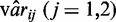 is the estimated variance for group 1 or 2. It is not trivial to derive the null distribution of the test statistics. However, based on simulation results which suggest that the empirical null distribution of the test statistics is approximately normal (Figure 5), it is possible to calculate approximate P-values based on the normal distribution.
Figure 5.
Histogram (left) and normal QQ plot (right) of Wald test statistics from the simulated data.
Defining DMRs
Based on the calculated P-value at each CpG site, we implemented a simple procedure in DSS for calling DMRs based on the approximate Wald test P-values described above. To call DMRs, the user needs to specify a P-value threshold and a few other parameters. Called DMRs must exceed a minimum length (100 bp by default) and cover more than a minimum number of CpG sites (three by default), and the percentage of CpG sites in the DMR with P-values less than the threshold must exceed a user-specified value (80% by default). Regions satisfying the above criteria will be reported as DMRs. Note that in this procedure, the correlation of the P-values for proximal sites is not considered; incorporation of this information into the DMR detection method is a direction of future research.
Simulations
We used simulation data to test the proposed method and compare the results with existing methods. Simulations are based on mouse embryogenesis data (Gene Expression Omnibus accession GSE34864) from RRBS experiments in a study on mouse embryogenesis (21). For each simulation, we simulated 20 000 CpG sites for replicates from two groups, where the number of replicates per group is taken as 2, 3 or 5. We first computed  for each of the CpG sites based on the average methylation proportions from a set of 20 000 contiguous CpG sites in the mouse embryogenesis data. For Type I error simulations, we let
  for all CpG sites; for simulations that included DML, we allowed
  to vary between groups for a randomly selected 5% of CpG sites in each simulation. We next simulated the dispersion parameter
  for each CpG site from a log-normal distribution with parameters estimated from the data (mean = –3.39, var = 1.08) as described above. To check the robustness of our model to departures from this distributional assumption, we also performed simulations with
  drawn from a Gamma distribution (with parameters estimated from the data, shape = 1.5, scale = 0.02) and empirically sampled from real data estimates. For coverage, we simulated coverage depth (
 ) for each CpG site and replicate by sampling the coverage depth from real RRBS data. Finally, for each replicate at each CpG site, we then used
  ,
,  and
and  to simulate methylated counts for each CpG site based on the beta-binomial distribution.
For additional simulations based on a different genome, parameters were estimated from a publicly available whole genome Arabidopsis dataset (Gene Expression Omnibus accession GSE38991). In this situation, a similar approach was used for generating simulation data. Again, we used log-normal (mean = –4.3, var = 1.7), Gamma (shape = 0.43, scale = 0.06) and empirical distributions to generate dispersion parameter  .
.
We also performed additional simulations using a distribution other than the assumed beta distribution to generate methylation levels. In these simulations, methylation levels of biological replicates within each treatment group and CpG site were generated from a truncated normal distribution. Each CpG site and group had its own truncated normal distribution, with the parameters estimated from the mouse embryogenesis data. Since methylation levels range from 0 to 1, the boundaries of each truncated normal distribution were set to be 0 and 1.
RESULTS
Simulations
Because true differential methylation status of CpG sites is unknown in real data, simulation is needed to evaluate the performance of different methods in a situation where the true DML are known. For all simulations presented below, we define our parameters to mimic the genomic structure of real data (based on publically available data from the mouse (21) or Arabidopsis genome), as described in Materials and methods section.
We first assessed the estimation of dispersion parameters ( ) in simulated data based on RBBS data from the mouse genome (21). Plots of estimated dispersions demonstrated reduced bias and avoidance of extreme values compared to a naïve MOM estimator, leading to improved precision when shrinkage was used (Supplementary Figure S2). Figure 2 shows that the proposed method has much lower MSE than the naïve method, and additional simulations demonstrate that the proposed method is able to achieve lower MSE even if the model is misspecified (Supplementary Figure S3).
Figure 2.

Boxplots comparing the distribution of mean squared error (MSE) for dispersion estimates from the proposed shrinkage method and naïve MOM estimators on 100 simulations of 20 000 CpG sites, where dispersion  is randomly generated from the log-normal distribution. Each group contains two replicates (left) or five replicates (right).
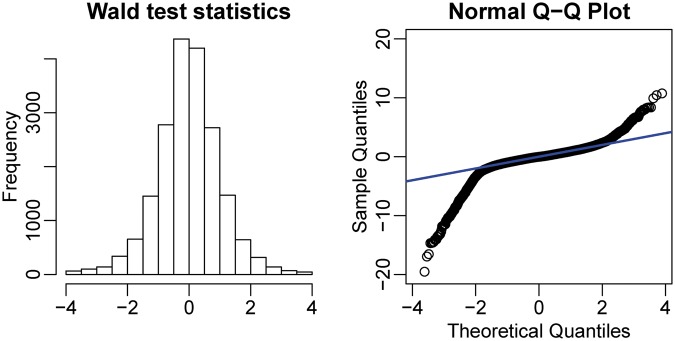
We next applied our proposed Wald test procedure to identify DML in a two-group comparison using simulated data. For comparison, we used both the shrunk and the naïve dispersion estimates to compute the Wald test statistics. This is a well-controlled comparison, since the only difference between the two tests is the method of dispersion estimation. In addition, we included the following methods in our comparison: (i) a two-group t-test based on the point estimates M/(M + U), (ii) Fisher’s exact test with data collapsed across biological replicates and (iii) a newly developed adjusted χ2-based method (23). Each method produces a P-value for each CpG site, which can be used to for ranking potential DML—an important aspect of DML detection. Since DML detection is often used as a hypothesis-generating tool, the goal is to have as many true positives as possible in the top-ranked CpG sites. Thus, we used the proportion of true DML among top ranked loci (true discovery rate, or TDR) as a performance measure in our simulations. As shown in Figure 3 and Supplementary Figure S1, our proposed method (Wald test with shrunk dispersion) has the highest proportion of true positives among the top-ranked CpG sites across simulation conditions that varied the number of replicates (2, 3 or 5) and the true underlying distribution of dispersion parameters (log-normal, Gamma or empirical). When there are only two replicates in each group, the proposed method significantly out-performs all other methods. With five replicates per group, the proposed method still provides the best results, although the improvement is smaller since all methods perform reasonably well in this case. These results make sense because the benefit of borrowing information across CpG sites is greater when there is less information for each CpG site. The comparison between the results from Wald tests with different dispersion estimates (shrunk versus naïve) demonstrates that the shrinkage procedure improves DML detection, especially when the replicate number is small. It also shows that with larger replicate numbers, the Wald test with naïve dispersion estimation may be a good choice since it is computationally less intensive. In addition, we note that the TDR curve is equivalent to an ROC curve magnified to focus on the region of highest specificity. A traditional ROC curve analysis is provided in Supplementary Figure S4, where our proposed method also consistently shows the best performance. Finally, to show the overlap of the detected DML from different methods with the ‘true DML’ in simulation study, a Venn Diagram generated from the R package ‘VennDiagram’ (33) is shown in Figure 4. The numbers in the method-specific areas of the plot show that the other methods have relatively large proportions of false positives among their sets of identified DML compared to our proposed method. The Wald test successfully avoids method-specific false positives, which indicates better detection accuracy.
Figure 3.
Comparison of TDR for different methods based on 100 simulations of 20 000 CpG sites. The proportion of true discovery among top ranked loci (y-axis) is plotted against the number of top ranked loci (x-axis). The dispersion  is randomly generated from the log-normal distribution. Each group contains two replicates (left) or five replicates (right).
Figure 4.
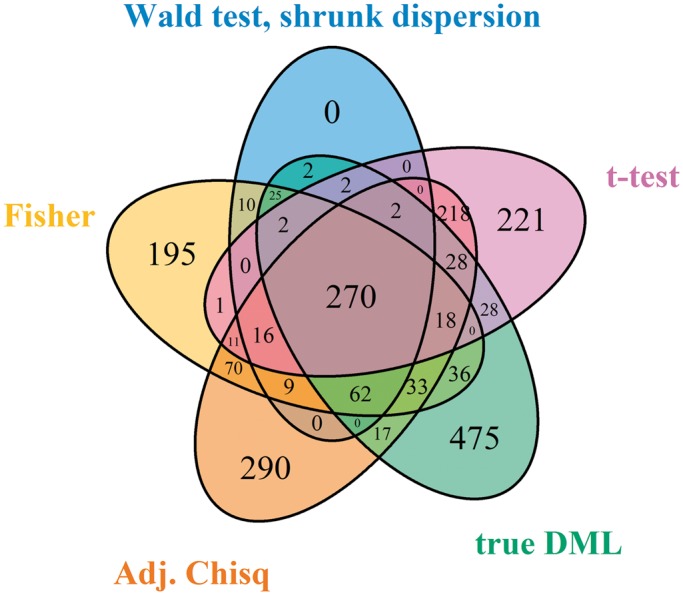
Venn diagram of detected DML and true DML in simulation study. Bonferroni-corrected P-value is applied as the cutoff to call DML.
The consistent improvement of our method over others across different dispersion distributions in Figure 3 and Supplementary Figure S1 demonstrates that our method is robust to departures from the assumed log-normal distribution of dispersion parameters. To further investigate robustness, we performed additional simulations where simulation parameters were estimated from a publicly available Arabidopsis genome instead of the mouse genome. Based on several different distributions of dispersion parameters, our proposed method again achieves the highest proportion of true positives among the top ranked CpG sites (Supplementary Figure S5). We also performed simulations that used a different generating distribution for methylation proportions than the beta distribution assumed by our model. In these simulations, methylation levels of different replicates within each group and CpG site were generated from a truncated normal distribution. Our proposed method continues to show the best performance in DML detection (Supplementary Figure S6), verifying the robustness of our model to misspecified distributional assumptions.
Statistical inference is another essential part of the DML analysis. We propose to use the normal distribution to derive P-values for the Wald test statistics. The histogram and normal quantile–quantile (QQ) plot of Wald test statistics (Figure 5) show that the statistics follow a normal distribution very well in the middle of the distribution, while the heavier tails correspond to the DML. These results support the validity of using normal P-values. Table 1 demonstrates that with two replicates in each group, our method achieves appropriate rates of Type I error for data simulated under the null hypothesis  while the Wald test with naïve dispersion estimates is overly conservative and the other methods considered here are anti-conservative when the number of replicates is low. Supplementary Figure S7 shows the distributions of P-values for data simulated under the null hypothesis. Since the P-values should be uniformly distributed under the null hypothesis, a χ2 goodness-of-fit test for uniformity of the P-values was performed (Table 1, right column). Although all distributions deviated significantly from uniformity, the results in Table 1 and Supplementary Figure S7 demonstrate that the P-values from the proposed method achieve the closest fit to a uniform distribution while the naive Wald test shows a strong depletion of P-values near 0 (conservative bias) and the other methods yield an excess of P-values near 0 (anti-conservative bias) and 1.
Table 1.
Type I error simulation results
| Method used | Proportion of sites with P < 0.05 | Uniformity χ2 statistics |
|---|---|---|
| Wald test with shrinkage | 0.0546 | 695.45 |
| Wald test with no shrinkage | 0.0367 | 1944.81 |
| T-test | 0.0922 | 6909.86 |
| Fisher’s exact test | 0.1588 | 47 260.71 |
| Adjusted χ2 test | 0.1734 | 6602.28 |
Based on 100 simulations of 20 000 CpG sites under the null hypothesis  with two replicates in each group. Under the null hypothesis, ∼5% of CG sites should be detected as DML if we use a significance level of .05. To a uniform distribution, χ2 statistics for goodness-of-fit of P-values are also presented for each method.
Real data analysis
We next applied our method to a publicly available dataset from a study of mouse embryogenesis (21), referred to as ‘mouse embryogenesis data’ hereafter. We first focused on methylation differences between oocyte and zygote cells (two replicates each) for 15 180 CpG sites spanning ∼87 Mb across a chromosome. Although here we focus on a single chromosome from mouse embryogenesis data for illustrative purposes, we have also applied our method to perform this analysis for the mouse whole genome (Supplementary Material 2) and a whole-genome bisulfite sequencing study of Alzheimer’s disease (AD) in humans (34) (Supplementary Material 3). In the mouse embryogenesis data, we applied our method to test for DML between oocyte and zygote cells and found that a majority of the CpG sites (57.4%) were hypermethylated in oocytes (Figure 6), which is consistent with the original findings (21). Manhattan-style plots (Figure 7) show the distribution of –log10 P-values from different methods across an arbitrarily chosen 14-Mb region. The plots based on Fisher’s exact test and the adjusted χ2 test show a pattern that is consistent with the anti-conservative bias demonstrated in Table 1 and Supplementary Figure S7. Similarly, the Wald test with naïve dispersion estimates is consistent with the demonstrated conservative bias. The proposed method, shown in Table 1 to be unbiased, identified a number of CpG sites associated with development stage at a very stringent significance threshold that corresponds to genome-wide significance after Bonferroni adjustment for a million tests (P < 5 × 10⁻⁸). Further simulations based on the same data also confirm these anti-conservative and conservative biases. We used the mean and dispersion from the same 15 180 sites to simulate methylation replicates under the null hypothesis ( for all i). Since these data were simulated under the null hypothesis, all detected DML can be considered false positives. The Wald test framework appears to control the false positive rate appropriately, while the Fisher’s exact test and adjusted χ2 test yield relatively high proportions of false positives (Supplementary Figure S8). Thus, it can be assumed that the majority of the CpG sites identified as significant via the Wald test are true positives, with a notable improvement in the number of true positives obtained using the Wald test with shrinkage compared to the naive Wald test.
Figure 6.

Histogram of differences in methylation proportion from mouse embryogenesis data (21) (oocyte–zygote). In accordance with the previous finding, a majority of CpG sites (57.4%) were hypermethylated in oocyte samples.
Figure 7.

DML detection along the genome from mouse embryogenesis data (21). Negative logarithm of P-values for each tested CpG site, from five different methods, is plotted against genomic coordinates for a 14-Mb region.
Overall distributions of P-values for the analyses in Figure 7 is shown in Supplementary Figure S9. If the test statistics are compared to the appropriate distribution, P-values should follow a uniform distribution between 0 and 1 when the null hypothesis is true. Thus, the distribution of P-values in a typical DML study should be a mixture of the uniform distribution (reflecting null results) and a peak near 0 (reflecting true DML). Supplementary Figure S9 shows that our proposed method yields an appropriate mixture of uniformly distributed P-values and P-values near 0. In contrast, the Fisher’s exact test and adjusted χ2 test yield an excess of P-values near 1 and a large pile-up of P-values near 0 that is consistent with the anti-conservative bias shown in Table 1 and Supplementary Figure S7. This pattern is also supported by a Venn diagram showing large numbers of method-specific DML (Supplementary Figure S10).
For the comparison of DNA methylation levels between oocyte and zygote, we find that the methylation levels are higher in oocyte compared with zygote in most of the DML. This is supported by the idea that active demethylation is expected to occur before pronuclear fusion or the completion of DNA synthesis. Moreover, in the DML, methylation levels from oocyte are very high (close to 100%). This is consistent with the original findings by Smith et al. (21), who observed the same pattern of methylation level distribution among the identified DMR (Figure 2D in Smith et. al.). For comparison purpose, we applied all five methods to analyze the same oocyte versus zygote data, and compared the oocyte methylation levels from top DML called from all methods. Supplementary Figure S11 shows that the DML detected from our proposed method have the highest oocyte methylation levels, indicating that the proposed method has the best concordance with previous findings.
For the Alzheimer’s disease data, we also applied all five methods to analyze the whole genome. Manhattan-style plots (Supplementary Material 3) show the distribution of –log10 P-values from different methods across each chromosome. The result is consistent with our findings for the mouse embryogenesis data in that the noisy backgrounds from t-test, Fisher’s exact test and the adjusted χ2 test suggest an anti-conservative bias similar to that demonstrated in Table 1. The Venn diagram (Supplementary Figure S12) suggests that the t-test, Fisher’s exact test, and the adjusted χ2 test have many method-specific false positives, as oppose to our proposed methods. Compared with the Wald test with naïve dispersion estimation, more significant results are observed for the Wald test with shrunk dispersion. Overall, the proposed Wald test with shrunk dispersion shows the best balance of sensitivity and specificity. Using the genome-wide test results for each CpG site, we detected DMRs as described in Materials and methods section. With computed DMRs, we identified nine genes whose transcriptional start site (TSS) overlapped with one or more DMRs. A list of all nine genes and their biological relevance is provided in Supplementary Table S1. Further investigation of these nine genes indicates that three have been previously reported to be associated with AD or brain functions. For example, FAM90A1 interacts with Amyloid Precursor Protein (APP) gene (35); APP forms the protein basis of the amyloid plaques found in the brains of patients with Alzheimer disease. Mutations in the APP gene have been associated with Alzheimer disease (36). Other examples are PAX8 and PAX8-AS1, whose gene family typically encode proteins involved in thyroid follicular cell development and expression of thyroid-specific genes (37). Thyroid hormone has been shown to be involved in adult cognitive functions (38).
Finally, the proposed method is computationally efficient. It takes ∼25 s to process a genomic region containing ∼50 000 CpG sites, in a 2.80 GHz 4-core CPU, 12 GB RAM PC environment. Run times for additional scenarios are shown in Table 2. The computational time is almost linear to the number of CpG sites being tested, and is only slightly longer when there are more replicates. Hence, for a typical RRBS dataset with 2 million CpGs, the proposed method will take around 16 min. For whole genome BS-seq data that covers 30 million CpGs, the method will take around 4 h on a single core, which is still very reasonable.
Table 2.
Runtime of DML detection software package
| Two replicates | Three replicates | Five replicates | |
|---|---|---|---|
| 20 000 CpG sites | 9.57 | 9.76 | 10.29 |
| 50 000 CpG sites | 23.58 | 24.51 | 25.73 |
| 100 000 CpG sites | 47.02 | 48.61 | 51.01 |
Processing times in seconds for methylation data in a 2.80-GHz 4-core CPU, 12 GB RAM PC environment.
DISCUSSION
In this article, we present a novel statistical method to detect DML from single nucleotide resolution DNA-methylation data for comparisons of two treatment groups. The major contributions of this work are twofold. First we propose a shrinkage procedure that improves estimation of the dispersion parameters. Second, we develop a Wald test procedure to account for the coverage depth and within-group variance.
The crucial step in DML detection methods is the estimation of within-group variance. Variance shrinkage has been widely applied since the microarray days (39) and has been shown to improve differential expression detection. The data from sequencing experiments, however, are commonly modeled using discrete distributions where the variance is dependent on the mean. For these data, shrinkage cannot be applied directly to the variance parameters. Because our method assumes that the dispersion at each CpG site is independent of the mean [as opposed to some RNA-seq differential expression detection methods which model the dispersion-mean relationship (26,30)], we checked whether this assumption appears to hold in the data. Supplementary Figure S12 shows that there is no apparent trend in the relationship between the dispersion and mean, suggesting that we can appropriately apply shrinkage to the dispersion parameter. Previous work focused on RNA-seq data has shown that the true biological variance among replicates in these data can be captured by the dispersion parameter, and several algorithms were developed to shrink the estimated dispersion parameters (24,26,27,30). This work adopts similar ideas. The data are described by a hierarchical model in which the observed counts are modeled with a beta-binomial distribution, and a log-normal prior is imposed on the dispersion parameters. Such a model allows information sharing across different CpG sites and provides shrinkage estimation of the dispersion parameters. Simulation results demonstrate the improved estimation of dispersion parameters, which subsequently leads to more accurate DML detection.
In this article, tests are performed for each CpG site independently. It has been reported that DNA-methylation levels are spatially correlated along the genome (40,41). Using smoothing techniques that were developed to borrow information from nearby CpG sites can improve the estimation of mean methylation levels  (20,22). Although our tests did not incorporate smoothing, the method developed in this work can be used in conjunction with smoothing. In the proposed Wald test (Equation 1.2), the shrinkage procedure improves the estimation of the denominator. Smoothing could complement this strategy by improving the estimation of the numerator, and we thus plan to integrate smoothing with shrinkage estimation in future work. However, we note that smoothing should only be applied when the data are ‘dense’, e.g. when data are available for many nearby CpG sites. When the CpG sites are sparse, which is common with RRBS or hydroxyl-methylation (5hmC) experiments (where the CpG sites showing 5hmC are sparse) (42), smoothing could lead to bias in point estimation and subsequently hurt DML detection.
The method proposed in this work focuses on differential methylation at individual CpG sites, but the improved DML detection provided by our proposed method has the potential to lead to improved DMR detection as well, and a function for DMR detection based on the P-values computed for each CpG site is also provided in the DSS software package.
In conclusion, we have provided a useful framework, approach and software for analysis of both genome-wide and reduced representation bisulfite sequencing data. In our simulations, this approach outperforms several other commonly used approaches, especially when the number of biological replicates is low. This improvement likely occurs because our Bayesian approach fully utilizes the hierarchical structure of read count data, in which multiple reads are sequenced for each replicate and multiple replicates are contained in each biological condition. The framework proposed here also has the potential to be useful for more complex study designs; in future work we plan to extend our model for two treatment groups to multifactor experimental designs and studies with continuous outcome variables.
SUPPLEMENTARY DATA
Supplementary Data are available at NAR Online.
ACKNOWLEDGEMENTS
We thank Dr Allan Levey for helpful discussions of the identified AD-associated genes.
FUNDING
Funding for open access charges: Emory University Department of Human Genetics.
Conflict of interest statement. None declared.
REFERENCES
- 1.Bestor TH. The DNA methyltransferases of mammals. Hum. Mol. Genet. 2000;9:2395–2402. doi: 10.1093/hmg/9.16.2395. [DOI] [PubMed] [Google Scholar]
- 2.Bird A. DNA methylation patterns and epigenetic memory. Genes Dev. 2002;16:6–21. doi: 10.1101/gad.947102. [DOI] [PubMed] [Google Scholar]
- 3.Reik W. Stability and flexibility of epigenetic gene regulation in mammalian development. Nature. 2007;447:425–432. doi: 10.1038/nature05918. [DOI] [PubMed] [Google Scholar]
- 4.Lister R, Pelizzola M, Dowen RH, Hawkins RD, Hon G, Tonti-Filippini J, Nery JR, Lee L, Ye Z, Ngo QM, et al. Human DNA methylomes at base resolution show widespread epigenomic differences. Nature. 2009;462:315–322. doi: 10.1038/nature08514. [DOI] [PMC free article] [PubMed] [Google Scholar]
- 5.Bird AP, Wolffe AP. Methylation-induced repression - Belts, braces, and chromatin. Cell. 1999;99:451–454. doi: 10.1016/s0092-8674(00)81532-9. [DOI] [PubMed] [Google Scholar]
- 6.Hendrich B, Bird A. Identification and characterization of a family of mammalian methyl-CpG binding proteins. Mol. Cell. Biol. 1998;18:6538–6547. doi: 10.1128/mcb.18.11.6538. [DOI] [PMC free article] [PubMed] [Google Scholar]
- 7.Cokus SJ, Feng SH, Zhang XY, Chen ZG, Merriman B, Haudenschild CD, Pradhan S, Nelson SF, Pellegrini M, Jacobsen SE. Shotgun bisulphite sequencing of the Arabidopsis genome reveals DNA methylation patterning. Nature. 2008;452:215–219. doi: 10.1038/nature06745. [DOI] [PMC free article] [PubMed] [Google Scholar]
- 8.Lister R, O’Malley RC, Tonti-Filippini J, Gregory BD, Berry CC, Millar AH, Ecker JR. Highly integrated single-base resolution maps of the epigenome in Arabidopsis. Cell. 2008;133:523–536. doi: 10.1016/j.cell.2008.03.029. [DOI] [PMC free article] [PubMed] [Google Scholar]
- 9.Wang YP, Wang XY, Lee TH, Mansoor S, Paterson AH. Gene body methylation shows distinct patterns associated with different gene origins and duplication modes and has a heterogeneous relationship with gene expression in Oryza sativa (rice) New Phytol. 2013;198:274–283. doi: 10.1111/nph.12137. [DOI] [PubMed] [Google Scholar]
- 10.Taiwo O, Wilson GA, Morris T, Seisenberger S, Reik W, Pearce D, Beck S, Butcher LM. Methylome analysis using MeDIP-seq with low DNA concentrations. Nat. Protoc. 2012;7:617–636. doi: 10.1038/nprot.2012.012. [DOI] [PubMed] [Google Scholar]
- 11.Harris RA, Wang T, Coarfa C, Nagarajan RP, Hong CB, Downey SL, Johnson BE, Fouse SD, Delaney A, Zhao YJ, et al. Comparison of sequencing-based methods to profile DNA methylation and identification of monoallelic epigenetic modifications. Nat. Biotechnol. 2010;28:U1097–U1194. doi: 10.1038/nbt.1682. [DOI] [PMC free article] [PubMed] [Google Scholar]
- 12.Serre D, Lee BH, Ting AH. MBD-isolated Genome Sequencing provides a high-throughput and comprehensive survey of DNA methylation in the human genome. Nucleic Acids Res. 2010;38:391–399. doi: 10.1093/nar/gkp992. [DOI] [PMC free article] [PubMed] [Google Scholar]
- 13.Rauch TA, Pfeifer GP. DNA methylation profiling using the methylated-CpG island recovery assay (MIRA) Methods. 2010;52:213–217. doi: 10.1016/j.ymeth.2010.03.004. [DOI] [PMC free article] [PubMed] [Google Scholar]
- 14.Frommer M, Mcdonald LE, Millar DS, Collis CM, Watt F, Grigg GW, Molloy PL, Paul CL. A Genomic Sequencing Protocol That Yields a Positive Display of 5-Methylcytosine Residues in Individual DNA Strands. Proc. Natl Acad. Sci. USA. 1992;89:1827–1831. doi: 10.1073/pnas.89.5.1827. [DOI] [PMC free article] [PubMed] [Google Scholar]
- 15.Meissner A, Mikkelsen TS, Gu H, Wernig M, Hanna J, Sivachenko A, Zhang X, Bernstein BE, Nusbaum C, Jaffe DB, et al. Genome-scale DNA methylation maps of pluripotent and differentiated cells. Nature. 2008;454:766–770. doi: 10.1038/nature07107. [DOI] [PMC free article] [PubMed] [Google Scholar]
- 16.Smith ZD, Gu HC, Bock C, Gnirke A, Meissner A. High-throughput bisulfite sequencing in mammalian genomes. Methods. 2009;48:226–232. doi: 10.1016/j.ymeth.2009.05.003. [DOI] [PMC free article] [PubMed] [Google Scholar]
- 17.Akalin A, Kormaksson M, Li S, Garrett-Bakelman FE, Figueroa ME, Melnick A, Mason CE. methylKit: a comprehensive R package for the analysis of genome-wide DNA methylation profiles. Genome Biol. 2012;13:R87. doi: 10.1186/gb-2012-13-10-r87. [DOI] [PMC free article] [PubMed] [Google Scholar]
- 18.Akalin A, Garrett-Bakelman FE, Kormaksson M, Busuttil J, Zhang L, Khrebtukova I, Milne TA, Huang Y, Biswas D, Hess JL, et al. Base-pair resolution DNA methylation sequencing reveals profoundly divergent epigenetic landscapes in acute myeloid leukemia. PLoS Genet. 2012;8:e1002781. doi: 10.1371/journal.pgen.1002781. [DOI] [PMC free article] [PubMed] [Google Scholar]
- 19.Li S, Garrett-Bakelman FE, Akalin A, Zumbo P, Levine R, To BL, Lewis ID, Brown AL, D’Andrea RJ, Melnick A, et al. An optimized algorithm for detecting and annotating regional differential methylation. BMC Bioinform. 2013;14(Suppl. 5):S10. doi: 10.1186/1471-2105-14-S5-S10. [DOI] [PMC free article] [PubMed] [Google Scholar]
- 20.Hansen KD, Langmead B, Irizarry RA. BSmooth: from whole genome bisulfite sequencing reads to differentially methylated regions. Genome Biol. 2012;13:R83. doi: 10.1186/gb-2012-13-10-r83. [DOI] [PMC free article] [PubMed] [Google Scholar]
- 21.Smith ZD, Chan MM, Mikkelsen TS, Gu H, Gnirke A, Regev A, Meissner A. A unique regulatory phase of DNA methylation in the early mammalian embryo. Nature. 2012;484:339–344. doi: 10.1038/nature10960. [DOI] [PMC free article] [PubMed] [Google Scholar]
- 22.Hebestreit K, Dugas M, Klein HU. Detection of significantly differentially methylated regions in targeted bisulfite sequencing data. Bioinformatics. 2013;29:1647–1653. doi: 10.1093/bioinformatics/btt263. [DOI] [PubMed] [Google Scholar]
- 23.Xu H, Podolsky RH, Ryu D, Wang X, Su S, Shi H, George V. A method to detect differentially methylated Loci with next-generation sequencing. Genet. Epidemiol. 2013;37:377–382. doi: 10.1002/gepi.21726. [DOI] [PMC free article] [PubMed] [Google Scholar]
- 24.Wu H, Wang C, Wu Z. A new shrinkage estimator for dispersion improves differential expression detection in RNA-seq data. Biostatistics. 2012;14:232–243. doi: 10.1093/biostatistics/kxs033. [DOI] [PMC free article] [PubMed] [Google Scholar]
- 25.Jaffe AE, Feinberg AP, Irizarry RA, Leek JT. Significance analysis and statistical dissection of variably methylated regions. Biostatistics. 2012;13:166–178. doi: 10.1093/biostatistics/kxr013. [DOI] [PMC free article] [PubMed] [Google Scholar]
- 26.Anders S, Huber W. Differential expression analysis for sequence count data. Genome Biol. 2010;11:R106. doi: 10.1186/gb-2010-11-10-r106. [DOI] [PMC free article] [PubMed] [Google Scholar]
- 27.Hardcastle TJ, Kelly KA. baySeq: empirical Bayesian methods for identifying differential expression in sequence count data. BMC Bioinfor. 2010;11:422. doi: 10.1186/1471-2105-11-422. [DOI] [PMC free article] [PubMed] [Google Scholar]
- 28.Robinson MD, Smyth GK. Moderated statistical tests for assessing differences in tag abundance. Bioinformatics. 2007;23:2881–2887. doi: 10.1093/bioinformatics/btm453. [DOI] [PubMed] [Google Scholar]
- 29.Sun W. A Statistical Framework for eQTL Mapping Using RNA-seq Data. Biometrics. 2012;68:1–11. doi: 10.1111/j.1541-0420.2011.01654.x. [DOI] [PMC free article] [PubMed] [Google Scholar]
- 30.Robinson MD, McCarthy DJ, Smyth GK. edgeR: a Bioconductor package for differential expression analysis of digital gene expression data. Bioinformatics. 2010;26:139–140. doi: 10.1093/bioinformatics/btp616. [DOI] [PMC free article] [PubMed] [Google Scholar]
- 31.McCarthy DJ, Chen YS, Smyth GK. Differential expression analysis of multifactor RNA-Seq experiments with respect to biological variation. Nucleic Acids Res. 2012;40:4288–4297. doi: 10.1093/nar/gks042. [DOI] [PMC free article] [PubMed] [Google Scholar]
- 32.Hardcastle TJ, Kelly KA. Empirical Bayesian analysis of paired high-throughput sequencing data with a beta-binomial distribution. BMC Bioinform. 2013;14:135. doi: 10.1186/1471-2105-14-135. [DOI] [PMC free article] [PubMed] [Google Scholar]
- 33.Chen H, Boutros PC. VennDiagram: a package for the generation of highly-customizable Venn and Euler diagrams in R. BMC Bioinform. 2011;12:35. doi: 10.1186/1471-2105-12-35. [DOI] [PMC free article] [PubMed] [Google Scholar]
- 34.Ziller MJ, Gu HC, Muller F, Donaghey J, Tsai LTY, Kohlbacher O, De Jager PL, Rosen ED, Bennett DA, Bernstein BE, et al. Charting a dynamic DNA methylation landscape of the human genome. Nature. 2013;500:477–481. doi: 10.1038/nature12433. [DOI] [PMC free article] [PubMed] [Google Scholar]
- 35.Olah J, Vincze O, Virok D, Simon D, Bozso Z, Tokesi N, Horvath I, Hlavanda E, Kovacs J, Magyar A, et al. Interactions of pathological hallmark proteins: tubulin polymerization promoting protein/p25, beta-amyloid, and alpha-synuclein. J. Biol. Chem. 2011;286:34088–34100. doi: 10.1074/jbc.M111.243907. [DOI] [PMC free article] [PubMed] [Google Scholar]
- 36.Matsui T, Ingelsson M, Fukumoto H, Ramasamy K, Kowa H, Frosch MP, Irizarry MC, Hyman BT. Expression of APP pathway mRNAs and proteins in Alzheimer’s disease. Brain Res. 2007;1161:116–123. doi: 10.1016/j.brainres.2007.05.050. [DOI] [PubMed] [Google Scholar]
- 37.Mansouri A, Chowdhury K, Gruss P. Follicular cells of the thyroid gland require Pax8 gene function. Nat. Genet. 1998;19:87–90. doi: 10.1038/ng0598-87. [DOI] [PubMed] [Google Scholar]
- 38.Beydoun MA, Beydoun HA, Kitner-Triolo MH, Kaufman JS, Evans MK, Zonderman AB. Thyroid hormones are associated with cognitive function: moderation by sex, race, and depressive symptoms. J. Clin. Endocrinol. Metab. 2013;98:3470–3481. doi: 10.1210/jc.2013-1813. [DOI] [PMC free article] [PubMed] [Google Scholar]
- 39.Smyth GK. Linear models and empirical bayes methods for assessing differential expression in microarray experiments. Stat. Appl. Genet. Mol. Biol. 2004;3 doi: 10.2202/1544-6115.1027. [DOI] [PubMed] [Google Scholar]
- 40.Eckhardt F, Lewin J, Cortese R, Rakyan VK, Attwood J, Burger M, Burton J, Cox TV, Davies R, Down TA, et al. DNA methylation profiling of human chromosomes 6, 20 and 22. Nat. Genet. 2006;38:1378–1385. doi: 10.1038/ng1909. [DOI] [PMC free article] [PubMed] [Google Scholar]
- 41.Irizarry RA, Ladd-Acosta C, Carvalho B, Wu H, Brandenburg SA, Jeddeloh JA, Wen B, Feinberg AP. Comprehensive high-throughput arrays for relative methylation (CHARM) Genome Res. 2008;18:780–790. doi: 10.1101/gr.7301508. [DOI] [PMC free article] [PubMed] [Google Scholar]
- 42.Song CX, Szulwach KE, Fu Y, Dai Q, Yi C, Li X, Li Y, Chen CH, Zhang W, Jian X, et al. Selective chemical labeling reveals the genome-wide distribution of 5-hydroxymethylcytosine. Nat. Biotechnol. 2011;29:68–72. doi: 10.1038/nbt.1732. [DOI] [PMC free article] [PubMed] [Google Scholar]
Associated Data
This section collects any data citations, data availability statements, or supplementary materials included in this article.