


Abstract
Molecular stratification of tumors is essential for developing personalized therapies. Although patient stratification strategies have been successful; computational methods to accurately translate the gene-signature from high-throughput platform to a clinically adaptable low-dimensional platform are currently lacking. Here, we describe PIGExClass (platform-independent isoform-level gene-expression based classification-system), a novel computational approach to derive and then transfer gene-signatures from one analytical platform to another. We applied PIGExClass to design a reverse transcriptase-quantitative polymerase chain reaction (RT-qPCR) based molecular-subtyping assay for glioblastoma multiforme (GBM), the most aggressive primary brain tumors. Unsupervised clustering of TCGA (the Cancer Genome Altas Consortium) GBM samples, based on isoform-level gene-expression profiles, recaptured the four known molecular subgroups but switched the subtype for 19% of the samples, resulting in significant (P = 0.0103) survival differences among the refined subgroups. PIGExClass derived four-class classifier, which requires only 121 transcript-variants, assigns GBM patients’ molecular subtype with 92% accuracy. This classifier was translated to an RT-qPCR assay and validated in an independent cohort of 206 GBM samples. Our results demonstrate the efficacy of PIGExClass in the design of clinically adaptable molecular subtyping assay and have implications for developing robust diagnostic assays for cancer patient stratification.
INTRODUCTION
Molecular understanding of tumor heterogeneity is key to personalized medicine and effective cancer treatment. Numerous studies have identified molecularly distinct cancer subtypes among individual patients of the same histopathological type by performing high-throughput gene-expression analysis of the patient tumor samples (1). Despite numerous studies on gene-expression-based tumor subgrouping, only few of the gene signatures derived from high-throughput platforms (e.g. microarrays) were successfully transitioned to low-content clinically useful platforms (e.g. reverse transcriptase-quantitative polymerase chain reaction [RT-qPCR]). Although the assessment of molecular subtyping accuracy based on data from a specific analytical platform (e.g. microarray) has received much attention in cancer research, extent of variability in classification accuracy based on gene-expression estimates of same gene-set from different platforms (e.g. microarray and RT-qPCR) remains poorly understood. Moreover, most of the tumor subtyping studies have ignored the complexity of human transcriptome and focused the analyses mainly on gene-level expression profiles.
Recent genome-wide studies have discovered that majority of human genes produce multiple transcript-variants/protein-isoforms, which could be involved in different functional pathways (2). Moreover, altered expression of specific isoforms for numerous genes is linked with cancer and its prognosis, as cancer cells manipulate regulatory mechanisms to express specific isoforms that confer drug resistance and survival advantages (3). For example, cancer-associated alterations in alternative exons and splicing machinery have been identified in cancer samples (4–6), suggesting that specific transcript-variants could be more effective as diagnostic and prognostic markers than corresponding genes. In a recent study, we discovered that majority of genes associated with neurological diseases expressed multiple transcripts through alternative promoters by using integrative NextGen sequencing based experimental approaches and bioinformatics analysis. We also observed aberrant use of alternative promoters in medulloblastoma, a cancer arising in cerebellum (7). Subsequently, we have demonstrated that cancer cell-lines regardless of their tissue of origin can be effectively discriminated from non-cancer cell-lines at isoform-level, but not at gene-level (8). We, therefore, hypothesize that isoform-level expression profile analysis would lead to better cancer patient stratification with prognostic significance. Moreover, an isoform-level signature would allow us to identify novel molecular markers and generate a more robust and clinically translatable assay for cancer patient stratification.
To address these problems, we designed a platform-independent isoform-level gene-expression based classification system (PIGExClass) that would allow us transfer the gene-signature developed on a high-dimensional platform to a clinically adaptable low-dimensional platform. Here, we applied this novel system to Glioblastoma multiforme (GBM) subtyping. GBM or grade IV gliomas are molecularly heterogeneous and most lethal of the malignant adult brain tumors. Even with aggressive combination therapies, the prognosis remains dismal, with median survival of 15 months after diagnosis (9). The systematic generation of high throughput molecular profiling data, by the Cancer Genome Atlas (TCGA) consortium, has led to the identification of molecular subgroups for primary GBM (10–12). TCGA study proposed a GBM classification scheme, based on gene-level expression profiles of 200 GBM samples, which identified four molecular subgroups (namely, neural—N, proneural—PN, mesenchymal—M and classical—CL), but the derived subgroups did not show any significant survival and prognostic stratification unless lower histopathological grade glioma patients were included (10). The current notion in GBM field is that younger patients have a good prognosis and mostly carry G-CIMP phenotype, IDH1 mutation and a gene expression profile of proneural subgroup. As GBM occurs mostly in elderly population (median age ∼60 years) and only a small percentage of primary GBM patients carry the IDH1 mutation (∼10%) and/or G-CIMP methylation (∼9%), these signatures are good prognostic markers for only a small percentage of primary GBM patients. Therefore, a more widely applicable molecular subtyping with improved prognostic significance would be extremely useful for guiding treatment. Our subtyping with an isoform-level gene-signature now reveals a classification of subtypes with accurate prognostic significance. We translated this isoform-based classifier to an RT-qPCR based assay for molecular classification of GBM patients and further validated the signature on 206 independent samples from University of Pennsylvania Brian Tumor Tissue Bank.
MATERIALS AND METHODS
Preprocessing of TCGA exon-array Data
We downloaded the unprocessed Affymetrix Exon-array datasets for 419 GBM samples and 10 normal brain samples (control samples) from the TCGA data portal (https://tcga-data.nci.nih.gov/tcga). The transcript (isoform)-level and gene-level expression estimates were obtained by the Multi-Mapping Bayesian Gene eXpression algorithm (13) for Affymetrix whole-transcript arrays, based on Ensemble database (version 56). The estimated expression values were then normalized across the samples, using the locally weighted scatter plot smoothing (loess) algorithm (14).
Data filtering (selection of most variable isoforms/transcript variants for sample clustering)
Two filters were applied here. The first filter was applied to retain only one isoform among highly correlated isoforms of same gene. Two isoforms of a gene are considered highly correlated if the Pearson’s correlation coefficient of isoform-level expressions across the samples is higher than 0.8. The isoform with highest coefficient of variation (CV), highest variability across patients, was retained among the correlated isoforms of a gene. The second filter was applied to eliminate low-variable isoforms across the patients. We selected 1600 isoforms with the highest variability across patients, using CV. Unlike standard deviation, which is heavily affected by the mean value of the dataset, CV is a dimensionless number and a way to penalize the expressions with overall high expression values.
Identification of GBM subgroups based on isoform-level expression using consensus non-negative matrix factorization clustering
We applied consensus non-negative matrix factorization (NMF) clustering approach to group the samples (15). NMF analysis was performed on expression matrix of 1600 transcripts and 419 samples using R package ‘NMF’. For rank k = 2–7, consensus matrices were obtained by taking the average of over 50 connectivity matrices. The stability of the decompositions was evaluated using a cophenetic correlation coefficient and visualization of the heat map plot of the consensus clustering matrix as shown in Supplementary Figure S2. As the NMF finds different solutions for different initial conditions, the factorizations were repeated 100 times using the previously determined rank and evaluated according to their factorization approximation error. The factorization with the lowest approximation error was retained. The silhouette width (16) was computed to filter out expression profiles that were included in a subclass, but that were not a robust representative of the subclass.
Survival difference between subtypes
Kaplan–Meier survival curves for the four GBM subtypes are plotted. Log-rank test is applied to test if there is a difference between the survival curves. The R package ‘survival’ (http://cran.r-project.org/web/packages/survival/index.html) was used to do the analysis (17).
Isoform-based signature identification
Differentially expressed transcript-variants and genes between normal brain and GBM samples were determined by using the limma method (18).
Basic steps in PIGExClass algorithm
To derive numerically comparable measures of gene expression between different platforms, and translate the gene-panel (from the classifier) across platforms, we developed PIGExClass by combining a novel data-discretization (19) procedure with ‘variable selection’ step, a randomForest-based variable selection algorithm (20). The PIGExClass algorithm is available as a set of scripts at http://bioinformatics.wistar.upenn.edu/PIGExClass.
Step 1: Data-discretization step (Normalization procedure for cross-platform transformation of fold-change data): We applied data discretization for converting continuous data values into categorical data (19). Basically, we discretized the fold-change levels (GBM over normal brain) of each transcript expression from each platform based on equal frequency or equal width binning (19) and converted the continuous fold change data to categorical values (FCCVs [Fold Change Categorical Values]), using the following procedure.
For each transcript/gene, sort the samples based on fold changes (FCs) in ascending order.
Divide sorted vector into a predetermined number of bins, so that the width of all bins is equal (equal-width binning) or number of samples in each bin is equal (equal-frequency binning). The number of categories (bins) was determined whether finer or coarser discretization improves the accuracy of the classification model. Similarly, the choice between equal-frequency binning or equal-width binning was made depending on the accuracy of the derived classification model.
Each fold change value is replaced by an integer value corresponding to the rank of the bin it falls into.
Step 2: Variable Selection and Classification Steps: Prior to building the classification model, we applied a randomForest-based variable selection algorithm (20) to select a small set of non-redundant genes or isoforms, using FCCVs. The variable selection was performed separately on gene-level or transcript-level fold changes. By selecting 213 transcripts/isoforms as the most discriminative variables between the four GBM subgroups, we created a randomForest classifier for subtype prediction (21,22). The cross-validation analysis of the final selected classifier was done by out-of-bag [OOB] approach. We further tested the classifier by dividing the isoform-based core samples into 3/4th as training-set and 1/4th as test-set. The classification model generated from the training set was applied to the test set.
RNA-seq data analysis
The TCGA GBM paired-end RNA-seq aligned bam files, for a total of 155 patient samples, were downloaded from https://cghub.ucsc.edu/cghub/data/analysis/download. A subset (76 datasets) of GBM samples have expression profiles from both RNA-seq and exon-array platforms. The RNA-seq bam files were converted to raw fastq files by Picard tools (http://picard.sourceforge.net/). The isoform level expression estimates were obtained by Tophat/Cufflinks pipeline using Ensembl 66 as reference (23) and expression estimates were normalized by upper quartile normalization. Two normal brain RNA-seq samples (used as controls to calculate expression fold-changes and FCCVs–GBM over normal brain) were downloaded from SRA archive (ERR030882 and SRR309262) and analyzed using the same pipeline as the GBM samples.
Evaluation of the data-mining algorithm on RNA-seq data
We evaluated the transition of the PIGExClass from exon-array to an independent platform by applying the classifier (trained on exon-array data) on GBM RNA-seq samples. Misclassification rate was computed based on 76 GBM samples overlapped with the isoform-level core samples and profiled by both exon-array and RNA-seq methods. We have calculated the Pearson correlation between each pair of expression signatures (fold changes), before and after data discretization, for the 76 GBM samples that were profiled by both exon-array and RNA-seq platforms.
GBM Tissue Specimens
The GBM samples processed for RNA isolation were obtained from the Human Brain Tumor Tissue bank (HBTTB) at the University of Pennsylvania. Collection of brain tumor tissue was approved by the Hospital of the University of Pennsylvania Institutional Review Board, with wavier of informed consent for retrospective review of medical records. Procurement and processing of GBM tumor tissues from HBTTB was approved by the Wistar Institute’s Institutional Review Board.
Open array design
To measure the expression of transcripts selected in the classifier, we designed RT-qPCR assays to be performed on the high throughput OpenArray platform (Life Technologies Inc.). Details are provided in the Supplementary Materials and Methods.
RNA isolation and RT-qPCR analysis
RNA was isolated using Tri Reagent (Sigma Inc.) and cDNA was synthesized using the high capacity cDNA reverse transcriptase kit (Applied Biosystems Inc.) according to manufacturer’s instructions. Normal brain RNA was purchased from Agilent Inc. Further details are provided in Supplementary Materials and Methods.
RESULTS
Extensive isoform-level changes occur in the GBM transcriptome
Unprocessed exon-array and clinical data for 419 GBM and 10 normal brain samples were downloaded from the TCGA data portal. A subset of 173 samples, marked as ‘core samples’ has been further stratified into four molecular subgroups (namely, neural—N, proneural—PN, mesenchymal—M and classical—CL) (Supplementary Table S1) by a TCGA network study (10). We analyzed the exon-array data and estimated the transcript (isoform)-level and gene-level expression values for a total of 114 930 different transcript-variants that correspond to 35 612 different gene models (Ensembl database, version 56). Although the comparative statistical analysis between GBM and normal brain at the gene-level produced 2834 genes as differentially expressed, similar analysis at the isoform-level revealed that a total of 7313 transcript-variants that correspond to 4215 genes were significantly altered in GBMs (q ≤ 0.001 and fold-change ≥2.0) (Figure 1A).
Figure 1.

Transcriptome analysis at the isoform-level and proposed plan to build an isoform-based GBM subtyping assay. (A) The table shows the number of up- and down-regulated genes or transcripts identified in the TCGA cohort’s exon-array data. The Venn diagram shows the number of genes that are misregulated at either the gene-level (yellow) or the isoform-level (blue) alone, and at both levels (green, overlapping region). (B) The proposed scheme to build a classifier for GBM patient subtyping and translate it to a clinically applicable diagnostic assay.
We observed that the transcript-variants of 44 genes, primarily associated with cellular assembly and organization, frequently showed disjoint patterns of isoform-expression in GBMs compared with normal brain, with one isoform being up-regulated and another isoform of the same gene down-regulated. We compared the isoform-level exon array expression changes with changes found by RT-qPCR in GBM samples from Penn-cohort for 16 different transcripts (Supplementary Table S2). We found the direction of change to be the same for 15 of the 16 transcripts, although the magnitude of the change found by PCR could be either higher or lower than that found by exon-array. This shows that the isoform-level expression patterns obtained by analyzing TCGA exon-array datasets can be validated across an independent patient-cohort using a different and less-expensive PCR assay.
Unsupervised clustering of TCGA GBM samples using isoform-level gene expression profiles recaptured the TCGA molecular subgroups with improved prognostic stratification
As we observed significant expression differences for numerous genes at the isoform-level but not at the overall gene-level, we investigated whether the isoform-level transcriptome changes can provide better patient stratification in terms of overall prognosis and classification accuracy, by an integrative computational modeling and experimental validation approach as outlined in Figure 1B. Although the TCGA core samples were divided into one of four subtypes—N, PN, M, and CL—based on the gene-level expression signature of 840 genes, no statistically significant survival differences were observed between the subtypes (Supplementary Figure S1) (10). Unsupervised clustering of 419 GBM samples identified four major clusters, hereafter called ‘isoform-based groups’, using the expression of 1600 most variable transcripts (Supplementary Figure S2). We identified the four groups as ‘proneural’, ‘mesenchymal’, ‘classical’ and ‘neural’, based on the concordance in cluster membership calls between our isoform-based groups and TCGA core sample grouping (10) (Figure 2A). To prepare homogeneous, isoform-based groups, we filtered out samples that were not good representatives of a subgroup by employing the silhouette width method (see Materials and Methods). This resulted in the removal of 77 samples, leading to a final set of 75 neural, 95 proneural, 85 mesenchymal, and 87 classical GBM samples—for a total of 342 as most representative of the four groups, hereafter called ‘isoform-based core samples’. Among the 169 patients common to both TCGA and isoform-based core samples (Figure 2B), 32 samples were assigned to a different subgroup by our isoform-based signature. The switching of 19% of the core GBM samples into a different subgroup resulted in the PN group with statistically significant better survival (Figure 2C and D). For example, 1 year survival rate for isoform-based PN subgroup is 7% greater than that of gene-based PN subgroup; demonstrating better prognostic grouping by isoform-based clustering than gene-based clustering.
Figure 2.

Isoform-level expression-based clustering of GBM patients from the TCGA cohort shows prognostic differences. (A) NMF-method-based clustering of 419 GBM patient samples based on the expression of 1,600 of the most variable transcripts/isoforms across the patients. Four clusters were formed, and on top, the distribution of 173 TCGA core samples in each cluster is shown. The subtypes of the TCGA core samples are color-coded as proneural (PN) (blue), mesenchymal (M) (red), neural (N) (purple) and classical (CL) (black). (B) The concordance table shows the comparison of TCGA’s core sample assignment to four subtypes based on gene-level (10) and isoform-level expression (isoform-based clustering). (C–D) Kaplan–Meier survival curve for the overlapping TCGA study core samples and isoform-based core samples (169 GBM patients) (C) and the isoform-based core samples from TCGA (342 GBM patients) (D) belonging to the four subtypes identified above in (A). The statistical significance of the overall plot and that of one-to-one comparison for each subtype is shown. The P-values have been calculated using the log-rank test.
The PIGExClass algorithm
Having established a prognostic stratification of GBM samples based on isoform-level gene expression clustering, we sought to (i) design a universal classification model that will be independent of the gene expression measuring platform, and (ii) identify a small subset of genes or isoforms that are discriminatory between the four subgroups. To determine the type of the classification variable (genes vs. isoforms), we compared the prediction accuracy of a gene-based versus an isoform-based classifier to correctly call the subtype of a GBM sample, and found that the isoform-based classifier is better both in terms of numbers of variables (genes/isoforms) required and prediction accuracy (Figure 3A). For example, while the isoform-based randomForest model achieved 90% accuracy with as few as 50 isoforms as feature variables, the gene-based model required more than 100 genes as feature variables for comparable accuracy to the isoform-based model. We also evaluated the performance of gene-based classifier vs. isoform-based classifier when the initial NMF cluster identification was performed using the gene-level expression (Supplementary Figure S3). Even in this scenario, an isoform-based classifier had a better performance than the gene-based classifier. In the final ‘classification’ step, by selecting 213 transcripts/isoforms as the most discriminative variables between the four GBM subgroups, a randomForest classifier is built for subtype prediction.
Figure 3.

Development of an isoform/transcript-based classifier and its validation. (A) The OOB error rate was plotted for a gene-based (left) and isoform-based (right) classifier model, where the x-axis denotes the number of variables or features and the y-axis represents the OOB error rate. The blue line shows the OOB error rate for 50 features in each model, and the red line depicts the lowest error rate achievable by the two models. (B) Box-plots of the Pearson correlation coefficients were plotted before and after data discretization using FCCV for sample to sample correlation based on 76 TCGA GBM samples with both exon-array and RNA-seq expression profiles. (C) The correlation of expression estimates obtained on two different cohorts of GBM patients on two different platforms. The x-axis represents the mean fold change for 121 transcripts/isoforms based on exon-array data for isoform-based core samples from TCGA, and the y-axis shows the mean fold change for the same transcripts/isoforms for Penn-cohort of GBM patients based on RT-qPCR analysis. The equation for the linear relationship and the R2 were calculated after removing the outliers. (D) Boxplot represents the expression of marker genes for the four different subtypes in Penn-cohort of GBM patients identified by our PIGExClass based classifier. All fold changes were calculated relative to normal brain tissue and statistical significance was determined by two sample t-test.
The accuracy of the final selected classifier based on cross-validation analysis (OOB approach) is 93.6%. The classifier was further tested by dividing the isoform-based core samples into 3/4th as training-set and 1/4th as test-set. The classification model generated from the training set was applied to the test set. The results of this additional testing agreed with those of the OOB approach in 99% of the sample calls in the test set, confirming that the algorithm effectively distinguishes the four subgroups. We also compared the error rate with and without discretization on the training data set and find that the OOB error rate decreases from 8.6% to 6.4% after discretization, suggesting that data discretization is not only critical for platform transition but also important for classifier’s accuracy within the same platform. Genes that reflect molecular differences between the subgroups were selected among the 213 isoforms, for example, EGFR, known to be highly amplified in the CL subgroup (10,24), and MET, a gene associated with epithelial to mesenchymal transition (25).
Translation of isoform-level gene panel to clinically translatable platform and validation of the classifier
As the isoform-based classifier from PIGExClass has achieved a prediction accuracy of >90% with fewer numbers of transcripts than the gene-based classifier, we decided to translate the classifier’s isoform-level gene-panel (213 transcripts) to an RT-qPCR-based assay. Because we observed that the accuracy of the randomForest classifier did not vary significantly whether we chose as few as 100 isoforms or as many as 213 isoforms in the classification model (Figure 3A, ∼3% decrease in accuracy), we selected the 121 most reliable commercially available TaqMan chemistry-based qPCR assays, and translated these transcript assays to RT-qPCR platform (Supplementary Table S3). We retrained the classifier with 121 transcripts on isoform-based core samples from TCGA and found a prediction accuracy loss of only 1.5%.
As a first step, we evaluated the transition of the classifier from exon-array to an independent platform by applying on 155 RNA-seq TCGA samples. We found that the data discretization with equal-frequency binning gave better classification accuracy than that based on equal-width binning. We, therefore adopted the data-discretization with equal frequency binning for data transition across platforms. Based on 76 GBM samples that overlapped with the isoform-level core samples and were profiled by both exon-array and RNA-seq methods, we found that the classifier made 90% similar sub-type calls between the two platforms, and achieved 93% prediction accuracy when compared with the true-class labels (Supplementary Tables S4 and S5). However, the classifier’s accuracy was only 66% on these 76 GBM samples if data discretization step was omitted. The stability in the classification accuracy across the two platforms is primarily due to reduced variability in FCCVs and increased correlation across platforms (Figure 3B). Therefore, the classifier trained on discretized fold-change data provided a platform independent isoform-level gene signature with a high degree of concordance and prediction accuracy.
Next, we tested the classifier on the Penn-cohort of 206 samples, by using the RT-qPCR-based assay designed earlier. First, we analyzed the concordance between the expression estimates, in terms of fold change relative to normal, obtained from exon-array and RT-qPCR assays. We observed similar expression patterns for 14 of the 15 control transcripts between RT-qPCR and exon-array data analysis (Supplementary Table S6). To evaluate the data correlation between the two platforms, mean fold changes of 121 transcripts between the TCGA and Penn-cohorts were plotted and compared (Figure 3C). The strong linear relationship between the two datasets indicates that the classifier built on expression data from the exon-array platform can be translated to RT-qPCR platform, and isoform-level expression patterns for GBM patients is comparable across independent cohorts of patients.
We applied the retrained classifier on the Penn-cohort to identify each patient’s subtype. Our results indicate that 52 (25.2%), 41 (19.9%), 50 (24.2%) and 63 (30.5%) of patients belong to PN, N, M and CL groups, respectively (Supplementary Table S7). We also observed that for 16 (∼8%) samples, the difference in the top two probabilities for subtype assignment is less than 0.05%, which we defined as ‘low-confidence’. However, for these samples our classifier can confidently eliminate the assignment to the other two subtypes. To address the issue of reproducibility, we independently re-isolated RNA and performed the RT-qPCR analysis on three patient samples and found good correlation (r ∼ 0.9) between the two datasets. Moreover, our PIGExClass based classification algorithm assigned the samples to the same subtype as before (Supplementary Table S7). To further validate the assignment of subtypes, we looked at the expression of known markers for each subtype (26). As expected, we observed higher expression of the neural marker-GABRA1, proneural marker-DCX, mesenchymal markers-CHI3L1 and MET, and classical marker-NES in samples belonging to the N, PN, M and CL subtypes, respectively (Figure 3D). Similar marker expression pattern was observed for the 155 GBM samples from TCGA that were subtyped based on RNA–seq data (Supplementary Figure S4). In conclusion, we have developed an RT-qPCR-based assay that can reproducibly predict the molecular subtype of GBM patients based on the relative expression of only 121 transcripts/isoforms in the tumor tissue.
Prognostic significance of the stratification in younger and older GBM patients
The molecular stratification of the TCGA-cohort’s isoform based core samples by the isoform-based signature showed that the PN subgroup has significantly better overall survival than the other three groups (Figure 2D). We plotted the survival curves for the four predicted groups of the whole TCGA-cohort (both exon array and RNA-seq samples) and Penn-cohort after removing the samples with low confidence calls (Figure 4A). To our surprise, we did not observe a better overall survival for the PN group in the Penn-cohort. Instead, we found that the neural group had a significantly better survival rate compared with the classical and mesenchymal subtypes (Figure 4A). This result prompted us to investigate the characteristic differences between the two cohorts (Table 1). One striking difference was in the representation of younger patients (age < 40 years at diagnosis) between the two cohorts (27); while 12.1% in TCGA-cohort were younger, only 5.8% were younger in the Penn-cohort. We found that most of the younger patients in the TCGA-cohort were classified as PN (35/57), and these patients had a much longer survival compared with the older PN patients (Table 1 and Figure 4B). Hence, we decided to re-plot the survival curves for the TCGA and Penn cohorts separately for younger (<40 years) and older patients (≥40 years) (Figure 4B and C). Our results clearly demonstrate that the prognostic significance of the PN group in terms of survival is valid only for the younger patients, and among the older patients, the PN group has the poorest 6-month survival rate in both the TCGA and Penn cohorts (Table 1).
Figure 4.

Kaplan–Meier survival plots for TCGA and Penn cohort of GBM patients. The overall survival curve for (A) TCGA and Penn-cohort of GBM patients who were classified into four subtypes by our classifier with high confidence, (B–C) TCGA-cohort of GBM patients (B), and Penn-cohort (C) divided by age as <40 years and ≥40 years at time of diagnosis. The statistical significance of each plot is indicated and the P values were determined by applying the log-rank test.
Table 1.
Distribution of GBM patients in TCGA and Penn cohorts based on age and molecular subtype
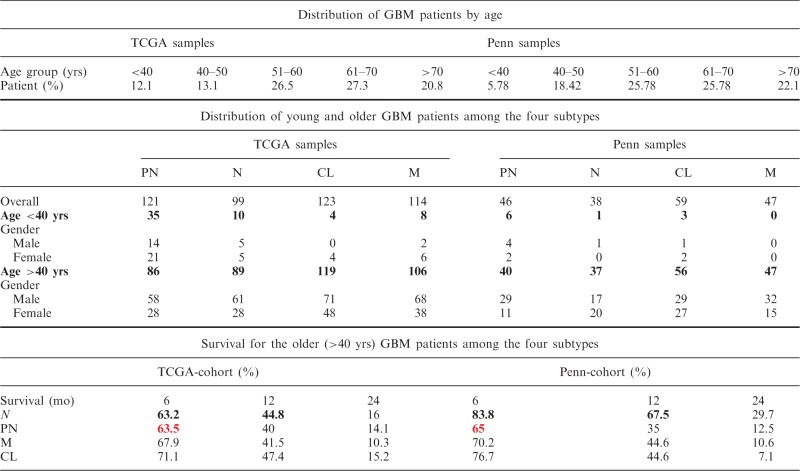 |
Based on the results described earlier, our study agrees with the general consensus that patients who are young and have a PN subtype tend to have better prognoses (28). We also found that among the older patients, the PN subtype confers a poorer prognosis.
DISCUSSION
The complexity of the gene structure in the human genome and the importance of using alternative splice variants as molecular signatures towards genomic medicine are being increasingly appreciated (29–31). Although alternative-splicing has long been implicated in cancer, the diagnostic and prognostic significance of gene-isoforms has not been systematically evaluated in any cancer. Although glioblastomas have been classified into four molecular subgroups based on gene-level expression profiling, the prognostic value of this stratification is weak. The application of our PIGExClass algorithm on the TCGA data shows that isoform-level gene signature can accurately classify GBM patients into the four molecular subtypes, using transcript-level gene-expression estimates either from exon-array or RNA-seq. To the best of our knowledge, this is the first isoform-level assay for efficient molecular stratification of cancer. Our isoform-level analysis leads to a substantially better subtype prediction model than the models based on gene-level analysis (10,28,32–36) not only in terms of improved classification accuracy but also because fewer variables (isoforms) are required in the final classification model. Because the clinical value of a laboratory test depends directly on its reproducibility and comparability, we translated the classification model (121 transcripts), from high-dimensional exon-array platform to a highly robust RT-qPCR-based assay platform, without loss of analytical precision.
One major advantage of our isoform-based subtyping of the TCGA GBM samples was in survival stratification. Unlike previous studies (10,32,33), we found statistically significant better survival for the PN subgroup in the TCGA-cohort of primary GBM patients without inclusion of lower grade III glioma patients. We also found that the prognosis of the molecular subgroups varied with patient’s age. For younger (<40 years) patients, the survival advantage is for the PN subgroup and this can be concluded from various studies that report the presence of G-CIMP phenotype and IDH1 mutation, two prognostic markers of glioma, in a subset of primary GBM patients who are young and exhibit proneural subtype gene expression profile. Moreover, this difference in the PN prognostic value between isoform- and gene-based classification is not due to unequal representation of younger patients in the two studies (∼16% patients are <40 years in both studies). However, the lack of a better surviving PN subgroup among the Penn-cohort is explained by the underrepresentation of younger patients.
The robustness and accuracy of our classifier is supported not only by the expression of marker genes for each subtype but also by the prevalence of various mutations among the patients of subgroups defined by isoform-based grouping (Supplementary Table S8). It is worth noting that though certain mutations tend to be associated with specific subtypes, only a fraction of GBM patients within each group harbor these mutations, indicating that mutational analysis is not an effective tool for accurately classifying GBM subtypes. In agreement with the previous reports, we found that NF1 mutations are present primarily in the M and N subtypes, and majority of the IDH1-mutated patients are young (<40 years) and belong to PN subtype. Similarly, the observation that EGFR mutations, including the EGFRvIII variant, occurred mostly in the CL and N subtypes further support our classifier’s accuracy to identify GBM subtypes.
Though we have developed a robust assay and algorithm for patient stratification, it has few limitations. One of the major limitations is in the reliability of the predicted subtype call for low-confidence predictions (8% of the predictions by PIGExClass are low-confidence). In case of low-confidence predictions, PIGExClass assigns the patient sample to two or more sub-types depending on the closeness of the predicted probabilities for different sub-types. Another hurdle we face is in the application of our algorithm on existing gene expression data for GBM patients. Our approach requires isoform level expression and most available gene expression datasets provide gene-level expression estimates. Furthermore, the accuracy of our method in predicting the subtype based on RNA-seq data is highly influenced by the RNA-seq isoform level expression estimation programs.
More importantly, in addition to our classifier’s prognostic value, this diagnostic assay will play an important role in selecting treatment strategies for glioblastoma patients. For example, the signal transducer and activator of transcription 3 (STAT3) has been linked to the mesenchymal subtype (10,37). Findings such as these have generated interest in the development of targeted inhibitors, in this case for STAT3 (38). However, the eventual use of such therapies would necessitate knowledge of the tumor subtype. Additionally, this novel classification scheme and diagnostic assay can be used for designing clinical trials to identify targeted therapies for GBM patients (39,40)
In summary, the isoform-level classifier derived from PIGExClass provides a quantitative and reproducible stratification of GBM patients with prognostic significance, with the potential to improve precision therapy and the selection of drugs with subtype-specific efficacy (41,42). Additionally, this approach can be applied to other cancer types for molecular classification and identification of subgroups with better prognostic and diagnostic value.
SUPPLEMENTARY DATA
Supplementary Data are available at NAR Online.
ACKNOWLEDGEMENTS
The authors thank Drs. Michael Showe and Nadia Dahmane for many helpful suggestions in editing of the manuscript. The use of resources in the Genomics Shared Facility of Wistar Cancer Centre [P30 CA010815] is gratefully acknowledged. The content is solely the responsibility of the authors and does not necessarily represent the official views of the National Institutes of Health. R.D. holds a Philadelphia Healthcare Trust Endowed Chair Position; research in his laboratory is partially supported by the Philadelphia Healthcare Trust.
FUNDING
This work is partially supported by the National Library of Medicine of the National Institutes of Health [Award Number R01LM011297]. Funding for open access charge: National Library of Medicine of the National Institutes of Health [Award Number R01LM011297].
Conflict of interest statement. None declared.
REFERENCES
- 1.Levy MA, Lovly CM, Pao W. Translating genomic information into clinical medicine: lung cancer as a paradigm. Genome Res. 2012;22:2101–2108. doi: 10.1101/gr.131128.111. [DOI] [PMC free article] [PubMed] [Google Scholar]
- 2.Grabowski P. Alternative splicing takes shape during neuronal development. Curr. Opin. Genet. Dev. 2011;21:388–394. doi: 10.1016/j.gde.2011.03.005. [DOI] [PubMed] [Google Scholar]
- 3.Pal S, Gupta R, Davuluri RV. Alternative transcription and alternative splicing in cancer. Pharmacol. Ther. 2012;136:283–294. doi: 10.1016/j.pharmthera.2012.08.005. [DOI] [PubMed] [Google Scholar]
- 4.Lapuk A, Marr H, Jakkula L, Pedro H, Bhattacharya S, Purdom E, Hu Z, Simpson K, Pachter L, Durinck S, et al. Exon-level microarray analyses identify alternative splicing programs in breast cancer. Mol. Cancer Res. 2010;8:961–974. doi: 10.1158/1541-7786.MCR-09-0528. [DOI] [PMC free article] [PubMed] [Google Scholar]
- 5.Misquitta-Ali CM, Cheng E, O’Hanlon D, Liu N, McGlade CJ, Tsao MS, Blencowe BJ. Global profiling and molecular characterization of alternative splicing events misregulated in lung cancer. Mol. Cell Biol. 2011;31:138–150. doi: 10.1128/MCB.00709-10. [DOI] [PMC free article] [PubMed] [Google Scholar]
- 6.Ebert B, Bernard OA. Mutations in RNA splicing machinery in human cancers. N. Engl. J. Med. 2011;365:2534–2535. doi: 10.1056/NEJMe1111584. [DOI] [PubMed] [Google Scholar]
- 7.Pal S, Gupta R, Kim H, Wickramasinghe P, Baubet V, Showe LC, Dahmane N, Davuluri RV. Alternative transcription exceeds alternative splicing in generating the transcriptome diversity of cerebellar development. Genome Res. 2011;21:1260–1272. doi: 10.1101/gr.120535.111. [DOI] [PMC free article] [PubMed] [Google Scholar]
- 8.Zhang Z, Pal S, Bi Y, Tchou J, Davuluri RV. Isoform-level expression profiles provide better cancer signatures than gene-level expression profiles. Genome Med. 2013;5:33. doi: 10.1186/gm437. [DOI] [PMC free article] [PubMed] [Google Scholar]
- 9.Dunn GP, Rinne ML, Wykosky J, Genovese G, Quayle SN, Dunn IF, Agarwalla PK, Chheda MG, Campos B, Wang A, et al. Emerging insights into the molecular and cellular basis of glioblastoma. Genes Dev. 2012;26:756–784. doi: 10.1101/gad.187922.112. [DOI] [PMC free article] [PubMed] [Google Scholar]
- 10.Verhaak RG, Hoadley KA, Purdom E, Wang V, Qi Y, Wilkerson MD, Miller CR, Ding L, Golub T, Mesirov JP, et al. Integrated genomic analysis identifies clinically relevant subtypes of glioblastoma characterized by abnormalities in PDGFRA, IDH1, EGFR, and NF1. Cancer Cell. 2010;17:98–110. doi: 10.1016/j.ccr.2009.12.020. [DOI] [PMC free article] [PubMed] [Google Scholar]
- 11.Noushmehr H, Weisenberger DJ, Diefes K, Phillips HS, Pujara K, Berman BP, Pan F, Pelloski CE, Sulman EP, Bhat KP, et al. Identification of a CpG island methylator phenotype that defines a distinct subgroup of glioma. Cancer Cell. 2010;17:510–522. doi: 10.1016/j.ccr.2010.03.017. [DOI] [PMC free article] [PubMed] [Google Scholar]
- 12.Li B, Senbabaoglu Y, Peng W, Yang ML, Xu J, Li JZ. Genomic estimates of aneuploid content in glioblastoma multiforme and improved classification. Clin Cancer Res. 2012;18:5595–5605. doi: 10.1158/1078-0432.CCR-12-1427. [DOI] [PMC free article] [PubMed] [Google Scholar]
- 13.Turro E, Lewin A, Rose A, Dallman MJ, Richardson S. MMBGX: a method for estimating expression at the isoform level and detecting differential splicing using whole-transcript Affymetrix arrays. Nucleic Acids Res. 2010;38:e4. doi: 10.1093/nar/gkp853. [DOI] [PMC free article] [PubMed] [Google Scholar]
- 14.Workman C, Jensen LJ, Jarmer H, Berka R, Gautier L, Nielser HB, Saxild HH, Nielsen C, Brunak S, Knudsen S. A new non-linear normalization method for reducing variability in DNA microarray experiments. Genome Biol. 2002;3:research0048. doi: 10.1186/gb-2002-3-9-research0048. [DOI] [PMC free article] [PubMed] [Google Scholar]
- 15.Brunet JP, Tamayo P, Golub TR, Mesirov JP. Metagenes and molecular pattern discovery using matrix factorization. Proc. Natl Acad. Sci. USA. 2004;101:4164–4169. doi: 10.1073/pnas.0308531101. [DOI] [PMC free article] [PubMed] [Google Scholar]
- 16.Rousseeuw PJ. Silhouettes—a graphical aid to the interpretation and validation of cluster-analysis. J. Comput. Appl. Math. 1987;20:53–65. [Google Scholar]
- 17.Therneau TM, Grambsch PM. Modeling Survival Data: Extending the Cox Model. New York: Springer; 2000. [Google Scholar]
- 18.Smyth GK. Linear models and empirical bayes methods for assessing differential expression in microarray experiments. Stat. Appl. Genet. Mol. Biol. 2004;3:Article3. doi: 10.2202/1544-6115.1027. [DOI] [PubMed] [Google Scholar]
- 19.Liu H, Hussain F, Tan CL, Dash M. Discretization: an enabling technique. Data Min. Knowl. Disc. 2002;6:393–423. [Google Scholar]
- 20.Diaz-Uriarte R, Alvarez de Andres S. Gene selection and classification of microarray data using random forest. BMC Bioinformatics. 2006;7:3. doi: 10.1186/1471-2105-7-3. [DOI] [PMC free article] [PubMed] [Google Scholar]
- 21.Manilich EA, Ozsoyoglu ZM, Trubachev V, Radivoyevitch T. Classification of large microarray datasets using fast random forest construction. J Bioinformatics Comput. Biol. 2011;9:251–267. doi: 10.1142/s021972001100546x. [DOI] [PubMed] [Google Scholar]
- 22.Datta S. Classification of breast cancer versus normal samples from mass spectrometry profiles using linear discriminant analysis of important features selected by random forest. Stat. Appl. Genet. Mol. Biol. 2008;7:Article 7. doi: 10.2202/1544-6115.1345. [DOI] [PubMed] [Google Scholar]
- 23.Trapnell C, Roberts A, Goff L, Pertea G, Kim D, Kelley DR, Pimentel H, Salzberg SL, Rinn JL, Pachter L. Differential gene and transcript expression analysis of RNA-seq experiments with TopHat and Cufflinks. Nat. Protocols. 2012;7:562–578. doi: 10.1038/nprot.2012.016. [DOI] [PMC free article] [PubMed] [Google Scholar]
- 24.Brennan C, Momota H, Hambardzumyan D, Ozawa T, Tandon A, Pedraza A, Holland E. Glioblastoma subclasses can be defined by activity among signal transduction pathways and associated genomic alterations. PLoS One. 2009;4:e7752. doi: 10.1371/journal.pone.0007752. [DOI] [PMC free article] [PubMed] [Google Scholar]
- 25.Lu KV, Chang JP, Parachoniak CA, Pandika MM, Aghi MK, Meyronet D, Isachenko N, Fouse SD, Phillips JJ, Cheresh DA, et al. VEGF inhibits tumor cell invasion and mesenchymal transition through a MET/VEGFR2 complex. Cancer Cell. 2012;22:21–35. doi: 10.1016/j.ccr.2012.05.037. [DOI] [PMC free article] [PubMed] [Google Scholar]
- 26.Riddick G, Fine HA. Integration and analysis of genome-scale data from gliomas. Nat. Rev. Neurol. 2011;7:439–450. doi: 10.1038/nrneurol.2011.100. [DOI] [PMC free article] [PubMed] [Google Scholar]
- 27.Siker ML, Wang M, Porter K, Nelson DF, Curran WJ, Michalski JM, Souhami L, Chakravarti A, Yung WK, Delrowe J, et al. Age as an independent prognostic factor in patients with glioblastoma: a Radiation Therapy Oncology Group and American College of Surgeons National Cancer Data Base comparison. J. Neuro-oncol. 2011;104:351–356. doi: 10.1007/s11060-010-0500-6. [DOI] [PubMed] [Google Scholar]
- 28.Lee Y, Scheck AC, Cloughesy TF, Lai A, Dong J, Farooqi HK, Liau LM, Horvath S, Mischel PS, Nelson SF. Gene expression analysis of glioblastomas identifies the major molecular basis for the prognostic benefit of younger age. BMC Med. Genomics. 2008;1:52. doi: 10.1186/1755-8794-1-52. [DOI] [PMC free article] [PubMed] [Google Scholar]
- 29.Poulikakos PI, Persaud Y, Janakiraman M, Kong X, Ng C, Moriceau G, Shi H, Atefi M, Titz B, Gabay MT, et al. RAF inhibitor resistance is mediated by dimerization of aberrantly spliced BRAF(V600E) Nature. 2011;480:387–390. doi: 10.1038/nature10662. [DOI] [PMC free article] [PubMed] [Google Scholar]
- 30.McDermott U, Downing JR, Stratton MR. Genomics and the continuum of cancer care. N. Engl. J. Med. 2011;364:340–350. doi: 10.1056/NEJMra0907178. [DOI] [PubMed] [Google Scholar]
- 31.Pal S, Gupta R, Davuluri RV. Alternative transcription and alternative splicing in cancer. Pharmacol Ther. 2012;136:283–294. doi: 10.1016/j.pharmthera.2012.08.005. [DOI] [PubMed] [Google Scholar]
- 32.Phillips HS, Kharbanda S, Chen R, Forrest WF, Soriano RH, Wu TD, Misra A, Nigro JM, Colman H, Soroceanu L, et al. Molecular subclasses of high-grade glioma predict prognosis, delineate a pattern of disease progression, and resemble stages in neurogenesis. Cancer Cell. 2006;9:157–173. doi: 10.1016/j.ccr.2006.02.019. [DOI] [PubMed] [Google Scholar]
- 33.Li A, Walling J, Ahn S, Kotliarov Y, Su Q, Quezado M, Oberholtzer JC, Park J, Zenklusen JC, Fine HA. Unsupervised analysis of transcriptomic profiles reveals six glioma subtypes. Cancer Res. 2009;69:2091–2099. doi: 10.1158/0008-5472.CAN-08-2100. [DOI] [PMC free article] [PubMed] [Google Scholar]
- 34.Shen R, Mo Q, Schultz N, Seshan VE, Olshen AB, Huse J, Ladanyi M, Sander C. Integrative subtype discovery in glioblastoma using iCluster. PLoS One. 2012;7:e35236. doi: 10.1371/journal.pone.0035236. [DOI] [PMC free article] [PubMed] [Google Scholar]
- 35.Sturm D, Witt H, Hovestadt V, Khuong-Quang DA, Jones DT, Konermann C, Pfaff E, Tonjes M, Sill M, Bender S, et al. Hotspot mutations in H3F3A and IDH1 define distinct epigenetic and biological subgroups of glioblastoma. Cancer Cell. 2012;22:425–437. doi: 10.1016/j.ccr.2012.08.024. [DOI] [PubMed] [Google Scholar]
- 36.Liang Y, Diehn M, Watson N, Bollen AW, Aldape KD, Nicholas MK, Lamborn KR, Berger MS, Botstein D, Brown PO, et al. Gene expression profiling reveals molecularly and clinically distinct subtypes of glioblastoma multiforme. Proc. Natl Acad. Sci. USA. 2005;102:5814–5819. doi: 10.1073/pnas.0402870102. [DOI] [PMC free article] [PubMed] [Google Scholar]
- 37.Carro MS, Lim WK, Alvarez MJ, Bollo RJ, Zhao X, Snyder EY, Sulman EP, Anne SL, Doetsch F, Colman H, et al. The transcriptional network for mesenchymal transformation of brain tumours. Nature. 2010;463:318–325. doi: 10.1038/nature08712. [DOI] [PMC free article] [PubMed] [Google Scholar]
- 38.McFarland BC, Gray GK, Nozell SE, Hong SW, Benveniste EN. Activation of the NF-kappaB pathway by the STAT3 inhibitor JSI-124 in human glioblastoma cells. Mol. Cancer Res. 2013;11:494–505. doi: 10.1158/1541-7786.MCR-12-0528. [DOI] [PMC free article] [PubMed] [Google Scholar]
- 39.Ohka F, Natsume A, Wakabayashi T. Current trends in targeted therapies for glioblastoma multiforme. Neurol. Res. Int. 2012;2012:878425. doi: 10.1155/2012/878425. [DOI] [PMC free article] [PubMed] [Google Scholar]
- 40.Gao Q, Lei T, Ye F. Therapeutic targeting of EGFR-activated metabolic pathways in glioblastoma. Expert Opin. Investig. Drugs. 2013;22:1023–1040. doi: 10.1517/13543784.2013.806484. [DOI] [PubMed] [Google Scholar]
- 41.Tanaka S, Louis DN, Curry WT, Batchelor TT, Dietrich J. Diagnostic and therapeutic avenues for glioblastoma: no longer a dead end? Nat. Rev. Clin. Oncol. 2013;10:14–26. doi: 10.1038/nrclinonc.2012.204. [DOI] [PubMed] [Google Scholar]
- 42.Huse JT, Holland E, DeAngelis LM. Glioblastoma: molecular analysis and clinical implications. Annu. Rev. Med. 2013;64:59–70. doi: 10.1146/annurev-med-100711-143028. [DOI] [PubMed] [Google Scholar]
Associated Data
This section collects any data citations, data availability statements, or supplementary materials included in this article.