

Abstract
Focused ultrasound (FUS) in conjunction with microbubbles has been shown to successfully open the blood–brain barrier (BBB) in the mouse brain. In this study, we compute the BBB permeability after opening in vivo. The spatial permeability of the BBB-opened region was assessed using dynamic contrast-enhanced MRI (DCE-MRI). The DCE-MR images were post-processed using the general kinetic model (GKM) and the reference region model (RRM). Permeability maps were generated and the Ktrans values were calculated for a predefined volume of interest in the sonicated and the control area for each mouse. The results demonstrated that Ktrans in the BBB-opened region (0.02 ± 0.0123 for GKM and 0.03 ± 0.0167 min−1 for RRM) was at least two orders of magnitude higher when compared to the contra-lateral (control) side (0 and 8.5 × 10⁻⁴ ± 12 × 10−4 min−1, respectively). The permeability values obtained with the two models showed statistically significant agreement and excellent correlation (R2 = 0.97). At histological examination, it was concluded that no macroscopic damage was induced. This study thus constitutes the first permeability assessment of FUS-induced BBB opening using DCE-MRI, supporting the fact that the aforementioned technique may constitute a safe, non-invasive and efficacious drug delivery method.
1. Introduction
The blood–brain barrier (BBB) serves as the regulator between brain cells and blood vessels that impedes the diffusion of large compounds from the intravascular system to the interstitial space (Abbott et al 2006, Kim et al 2006). Specifically, molecules of sizes larger than 400 Da are prevented from penetrating the parenchyma, thus protecting the normal neuronal functionality (Pardridge 2005). On the other hand, the presence of the barrier precludes the delivery of large-sized molecules (>1 kDa) used therapeutically for diseases such as Alzheimer’s and Parkinson’s (Deane and Zlokovic 2007, De Boer and Gaillard 2007). A controlled and safe opening of the BBB would enable the passage of pharmacological agents across the interstitial space that could enhance the neuronal activity in the aforementioned brain diseases, without causing permanent physiologic or anatomical damage.
The technique of focused ultrasound (FUS) constitutes a non-invasive, highly localized method for opening the BBB (Hynynen et al 2001, Choi et al 2007), compared to other techniques, such as intracranial or chemical agent administration (i.e., mannitol or adjuvants), which lasts for a relatively narrower time window and can induce side-effects (Brown et al 2004, Rapoport 2000). Several studies have investigated the cellular mechanisms that occur in the capillaries after FUS, in order to understand the physiological aspects of the phenomenon and assess the safety of the method (Sheikov et al 2004, 2008, Raymond et al 2008). More specifically, Sheikov et al (2004) have identified four mechanisms of transcapillary passages during FUS using immunoelectron microscopy: the transcytosis, the endothelial cytoplasmic opening, the opening of the tight junctions and the endothelial micro-rupture. These mechanisms can form the basis of a model that will be able to mathematically express the endothelial permeability of the vessels in the brain after BBB opening since the level of drug uptake in the FUS-induced BBB-opened region remains unknown.
Dynamic contrast-enhanced MRI (DCE-MRI) has been thoroughly used in past studies to compute the permeability in such applications as embolic stroke, various types of cancer and injuries, both in humans (Roberts et al 2000, Turnbull 2009, Li et al 2009) and animals (Jiang et al 2005, Knight et al 2005, Cohen et al 2009). The pharmacokinetic models are often adjustable to the type of disease under study. In most cancer research and clinical studies, two-compartment models with flow-limited, permeability-limited or mixed-flow characteristics are used, each one fitting a specific tumor type, according to its vasculature behavior following tracer administration (Tofts et al 1999, Rebeles et al 2006). In the general kinetic two-compartment model, the tissue is assumed to consist of the blood plasma and extracellular extravascular space (EES), and the tracer exchange between these two body compartments is defined by two transfer rate constants, Ktrans and Kep (Tofts et al 1999). This model requires a reliable arterial input function (AIF), which defines the temporal concentration behavior of the tracer in the blood plasma. Hence, a corresponding artery is usually selected from the field of view of the MR acquisitions and the concentration changes are fitted to an exponentially decaying model (Pickup et al 2003). More recently, the use of population averages has been accepted as a reliable AIF determination method, which overcomes the difficulty in obtaining an AIF from an artery in the field of view of the DCE-MR images (Parker et al 2006). McGrath et al (2009) have investigated a number of different AIF models in tumor-bearing rats and the results indicated that a simple bi-exponential fitting model (Demsar et al 1998) is the most suitable choice in the case of dynamic images with a low signal-to-noise ratio or low temporal resolution.
While most kinetic models are dependent on the AIF determination, Yankeelov et al (2005) have developed a method of modeling DCE-MRI data without an AIF, relating permeability to a reference region. Comparisons between the general kinetic model (GKM) and the reference region model (RRM) have shown promising results with good correlation between the two models, though it has been reported that RRM is less precise than GKM (Yankeelov et al 2007, Hsiao et al 2010), leading to higher standard deviations. However, the main advantage of RRM is that it allows us to process low temporal resolution DCE-MR images for the quantitative assessment of permeability.
In this study, we use both of these models to measure the permeability of the vessels in the murine hippocampus after FUS-induced BBB opening. A gradient echo pulse sequence was used in the temporal DCE-MR images before and after intraperitoneal (IP) administration of gadodiamide (Gd-DTPA). The extracted Ktrans values demonstrated the permeability differences among the BBB-opened hippocampal region and the contra-lateral BBB-intact side of the brain, which served as the control. Histology was used to detect any macroscopic effects of BBB opening and T2 images assessed the possibility of hemorrhage in the sonicated area. The performances of GKM and RRM were also compared by measuring the correlation coefficient between the GKM- and RRM-derived Ktrans values.
2. Methods
2.1. Ultrasound setup
A single-element, spherical-segment FUS transducer (center frequency: 1.5 MHz; focal depth: 60 mm; outer radius: 30 mm; model: cdc7411–3, Imasonic, Besançon, France) was used with a central void (radius: 11.2 mm) that held a pulse-echo diagnostic ultrasound transducer (center frequency: 10 MHz, focal length: 60 mm, Olympus NDT, Waltham, MA, USA). The transducer assembly was positioned so that the two foci fully overlapped. A cone filled with degassed and distilled water was mounted onto the transducer system and a fitted polyurethane membrane (Trojan; Church & Dwight Co., Inc., Princeton, NJ, USA) held the water in the cone. The system was attached to a computer-controlled, three-dimensional system (Velmex Inc., Lachine, QC, Canada). The FUS transducer was connected to a matching circuit and was driven by a computer-controlled function generator (Agilent, Palo Alto, CA, USA) and a 50-dB power amplifier (ENI Inc., Rochester, NY, USA). The pulse-echo transducer was driven by a pulser–receiver system (Panametrics, Waltham, MA) connected to a digitizer (Gage Applied Technologies, Inc., Lachine, QC, Canada) in a personal computer (figure 1).
Figure 1.
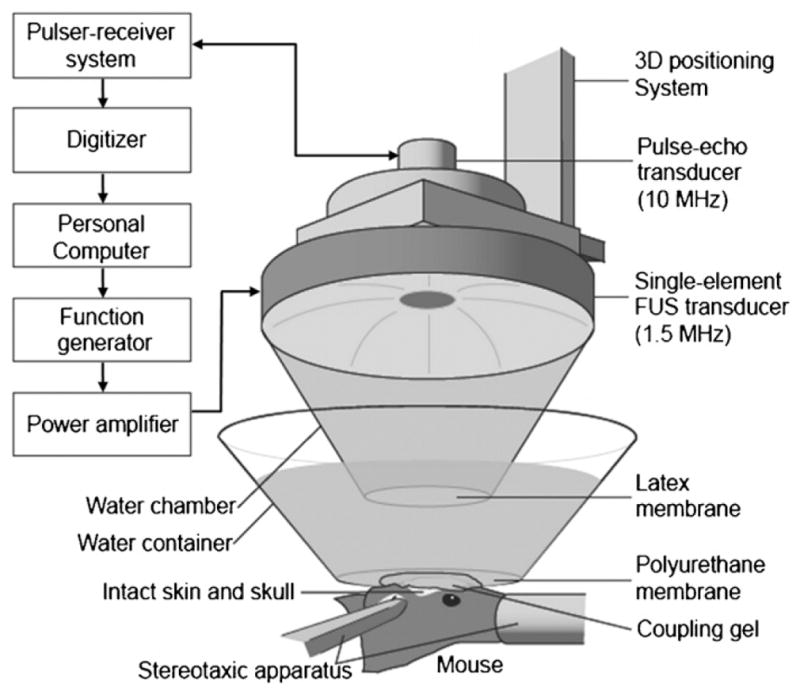
The FUS experimental setup. The shaved head of the mouse was placed with its right hippocampus at the FUS focus using a computer-driven grid positioning system.
A needle hydrophone (Precision Acoustics Ltd, Dorchester, Dorset, UK, needle diameter: 0.2 mm) was used to measure the three-dimensional pressure field in a degassed water-tank prior to the in vivo experiments. The calculated peak-negative and peak-positive pressure values were attenuated by 18% to correct for the murine skull attenuation, while the lateral and axial full-width-at-half-maximum intensity area dimensions of the beam were 7.5 and 1 mm, respectively.
2.2. Focused ultrasound sonication protocol
All procedures performed were approved by the Columbia University Institutional Animal Care and Use Committee. Six wild-type male mice (C57BL/6) of either age (7 weeks old) and of mass equal to 22.84 ± 1.12 g were sonicated for this study. The mice were anesthetized using a mixture of oxygen (0.8 L min−1 at 1.0 Bar, 21 °C) with 1–3% isoflurane (SurgiVet, Smiths Medical PM, Inc., Wisconsin, USA) and were placed under the transducer assembly as shown in figure 1. The scalp fur was shaved and a stereotactic apparatus (David Kopf Instruments, Tujunga, CA) maintained the mice in the same position during the entire experiment. A container filled with degassed water and sealed at the bottom with an acoustically and optically transparent plastic surface (Saran, SC Johnson, Racine, WI, USA) was placed on the mouse head. The focus of the transducer was positioned inside each mouse brain to overlap with the hippocampus and the posterior cerebral artery (PCA) using a grid-positioning method and a pulse-echo transducer as reported in our previous studies (Choi et al 2007). The left hippocampus was not sonicated and served as control.
A concentration of 1 μL g−1 of microbubbles with a mean diameter of 4–5 μm, diluted to 1:20 using phosphate-buffered saline (PBS) was prepared for the sonication. The microbubbles consisted of a 1,2-distearoyl-sn-glycero-3-phosphocholine (DSPC) and polyoxyethylene-40 stearate (PEG40S) lipid-shell with a perfluorobutane (PFB) gas core and were manufactured in-house, using a method developed by Feshitan et al (2009). These microbubbles have been shown to open the blood–brain barrier in previous FUS-induced BBB opening studies, employing fluorescence imaging after the administration of fluorescent-tagged 3-kDa dextran (Choi et al 2010). A bolus of 107 microbubbles mL−1 was administered intravenously (IV) through the tail vein using a 30-G needle syringe, following immediate sonication of the targeted right hippocampus at the peak-rarefactional acoustic pressure of 0.30 MPa (pulse rate: 10 Hz; duty cycle: 0.067%). The microbubble dosage was five times higher than the dosage used in clinical echocardiography because it was assumed that a higher concentration would result in a more efficacious BBB opening. Also, the larger dosage can be justified by the fact that a therapeutic application was investigated as opposed to a diagnostic method. The total duration of the pulsed wave FUS sequence lasted 60 s (table 1).
Table 1.
Focused ultrasound parameters.
| Sonicated region | Right hippocampus |
|---|---|
| Acoustic pressure | 0.30 MPa |
| Microbubbles concentration | 107 mL−1, 1 μL g−1 (with dilution) |
| Burst cycles | 100 |
| Pulse rate | 10 Hz |
| Duty cycle | 0.067% |
| Total duration | 60 s |
2.3. Dynamic contrast-enhanced MRI protocol
Upon completion of the FUS sonication, the mice were imaged in a 9.4 T MRI system (DRX400, Bruker Biospin, Billerica, MA, USA). Each mouse was inserted in a 30 mm diameter single resonator, while anesthetized orally with isoflurane (1–2%). Transverse images were acquired with a T1-weighted 2D FLASH sequence of a 192 × 128 matrix size (reconstructed to 256 × 128), a resolution of 130 × 130 μm2 (reconstructed to 98 × 130 μm2), a flip angle of 70°, TR/TE = 230/2.9 ms and a slice thickness of 0.6 mm without any interslice gap. The number of excitations (NEX) was equal to four and the acquisition time was 88 s. An intraperitoneal (IP) catheterization of the mouse allowed us to collect DCE-MR images before and after administration of 0.3 mL non-diluted gadodiamide (Omniscan®, GE Healthcare, Princeton, NJ, USA) without changing the initial position of the animal. The gadodiamide bolus was manually injected at a rate of approximately 10 μL s−1. The relatively large dosage was preferred in order to secure the presence of a bolus peak in the vascular system, which is essential for the AIF determination, but also to allow DCE-MRI to obtain accurate tissue concentrations. Gadodiamide (Gd-DTPA) has been shown to reduce the longitudinal relaxation rate when it diffuses to the extravascular extracellular region, thus enhancing the T1 signal intensity in the region, where the BBB opening has occurred. Gd-DTPA was injected approximately 30–60 min after sonication and the respiration of the mouse was monitored throughout the entire procedure. Forty sequential images were acquired over a time window of approximately 55 min after Gd-DTPA injection, which depicted the diffusion of the contrast agent into the targeted hippocampus and the surrounding area. Higher spatial resolution, transverse T1- and T2-weighted images were acquired after the DCE-MRI acquisition with 2D FLASH (TR/TE = 230/3.3 ms; flip angle: 70°; NEX = 18; scan time: 9 min 56 s; matrix size: 256 × 192; spatial resolution: 86 × 86 μm2; slice thickness: 500 μm, no interslice gap) and 2D RARE (TR/TE = 3300/43.8 ms; echo train: 8; NEX = 10; scan time: 9 min 54 s; matrix size: 256 × 192; spatial resolution: 86 × 86 μm2; slice thickness: 500 μm, no interslice gap) sequences, respectively.
2.4. Kinetic models
The change in signal intensity before and after tracer administration corresponds to the changes in Gd-DTPA concentration, CGd, in the EES, where BBB opening was generated. Assuming a linear relationship between the signal intensity and the Gd-DTPA concentration, the formula that relates the two quantities can be expressed as follows (Bilgen and Narayana 2001):
| (1) |
where T10 is the T1 relaxation time of the arterial blood or the brain tissue before the Gd-DTPA administration, r1 is the T1 relaxivity of the contrast agent and Spre and Spost are the signal intensities of the pixels before and after administration of the contrast agent, respectively. The r1 of gadodiamide in the 9.4T MRI system was measured experimentally with phantom tests and was found to be equal to 2.6 mM−1 s−1. The T10 relaxation times of the arterial blood and the brain tissue in mice have been measured in the past using a pulsed arterial spin labeling approach and were found to be 1.5 s and 0.9 s, respectively (Thomas et al 2006). However, Bilgen and Narayana (2001) have reported the difficulty in obtaining accurate measurements of T1 in vivo since T1 varies spatially, temporally and among different animals of the same strain. Moreover, it has been reported that deviations in T10 and r1 influence insignificantly the transfer rate constants (Cohen et al 2009) since it is not the actual Gd-DTPA concentration that defines Ktrans but its rate of change.
The dynamic images were processed using two kinetic models. The first model was the generalized form of the Tofts and Kermode bi-directional model (Tofts and Kermode 1991) or general kinetic model (GKM). This model is described by the following general expression
| (2) |
where Ct is the tracer concentration in the EES, t is the time, Cp is the tracer concentration in the blood plasma and Ktrans and Kep are the transfer rate constants from the intravascular system to the EES and from the EES to the intravascular system, respectively. The plasma concentration takes a specific quantity of the blood volume, which is defined by the hematocrit level, Hct. In wild-type mouse models, the Hct is approximately 0.45, indicating that the plasma concentration can be calculated as a fraction of the blood concentration, Cp = (1 − Hct)Cb = 0.55Cb. An adequately large arterial vessel, from which the contrast agent bolus peak can be easily detected in the dynamic MR images, is selected to assess the Cb value. The specific vessel provides the AIF, which is model fitted to a bi-exponential model:
| (3) |
where t denotes the time, and Ai and mi (i = 1, 2) are the amplitude and decay rates, respectively. In the past, the difficulty in obtaining an accurate AIF from a detectable vessel in the dynamic images has been reported and assessed with various models (McGrath et al 2009). However, recent studies have demonstrated that selecting a population average from a sufficient number of the same type of animals in order to determine the AIF can be both accurate and robust (McGrath et al 2009). After computation of the amplitude and decay rates using the Levenberg–Marquardt fitting algorithm (Matlab R2008b, MathWorks, Inc., Natick, MA, USA), we substitute (3) into (2) and establish the mathematical expression of the EES concentration over time:
| (4) |
The temporal Gd-DTPA concentration Ct (t) measurements, derived experimentally from (1) can then be fitted to (4), in order to estimate the variables Ktrans and Kep. The Levenberg–Marquardt algorithm is again used to calculate those variables for every pixel or a selected region of interest.
The second model used for this study was the reference region model (RRM) (Yankeelov et al 2005), which calculates the permeability relative to a reference region with known Ktrans. To this purpose, the model introduces a third compartment (reference region), which is characterized by two separate transfer rate constants ( ), as follows:
| (5) |
where Cref and Cp are the Gd-DTPA concentrations in the reference region and the blood plasma, respectively. By combining equations (2) and (5) and eliminating Cp, the following expressions are obtained:
| (6) |
where is the relative transfer rate parameter from the blood plasma to the EES, the relative transfer rate parameter from the EES to the blood plasma and the transfer rate parameter from the EES to the blood plasma of the reference region, respectively. The temporal concentrations Ct and Cref are then fitted to (6), using the Levenberg–Marquardt algorithm, yielding the relative permeability values. The Ktrans value is finally calculated using the product of the relative permeability and the corresponding reference region permeability as calculated by GKM. The use of the GKM-derived reference region permeability values in the calculation of Ktrans draws more solid conclusions in the comparison of the two kinetic models since the reference region’s Ktrans is used as a cross-model ‘normalizer’. Besides, it is shown that by allowing the reference region’s Ktrans to vary instead of assuming a fixed value, the number of assumptions is reduced, leading to more accurate estimations (Yankeelov et al 2007).
2.5. Image processing
To determine a population-averaged AIF for GKM, 22 wild-type (C57BL/6) mice were first dynamically imaged using the same experimental parameters. The internal carotid arteries (ICA) were selected for the determination of the Gd-DTPA concentration in the blood plasma and, subsequently, the amplitude and decay rates of the AIF. The ICA diameter in mice typically spans from 200 to 400 μm. The acquired 2D FLASH dynamic images displayed a coronal view of the ICA with an in-plane resolution of 130 μm. The temporal AIF concentrations were acquired by carefully selecting a region of interest within the boundaries of the ICA that afforded the highest contrast resolution (figure 2(a)). Approximately 20 pixels were selected in each mouse case and the mean spatial amplitude was averaged across the entire group of mice. The averaged concentration curve was fitted to the bi-exponential model of (3), yielding the amplitude and decay rates (figure 2(b)). On the other hand, the reference region for RRM was not averaged across mice. Instead, each region was selected from the epicranial muscle in the same mouse and same MR image (figure 2(c)). The epicranial muscle was selected as the reference region because of its intrinsic homogeneity in their anatomic structure and its similar longitudinal relaxation time to the gray matter. Also, the permeability of the epicranial muscle differed insignificantly across the population of mice and the Gd-DTPA concentration increase rate was relatively similar to the one detected in the BBB-opened region (figure 2(d)).
Figure 2.
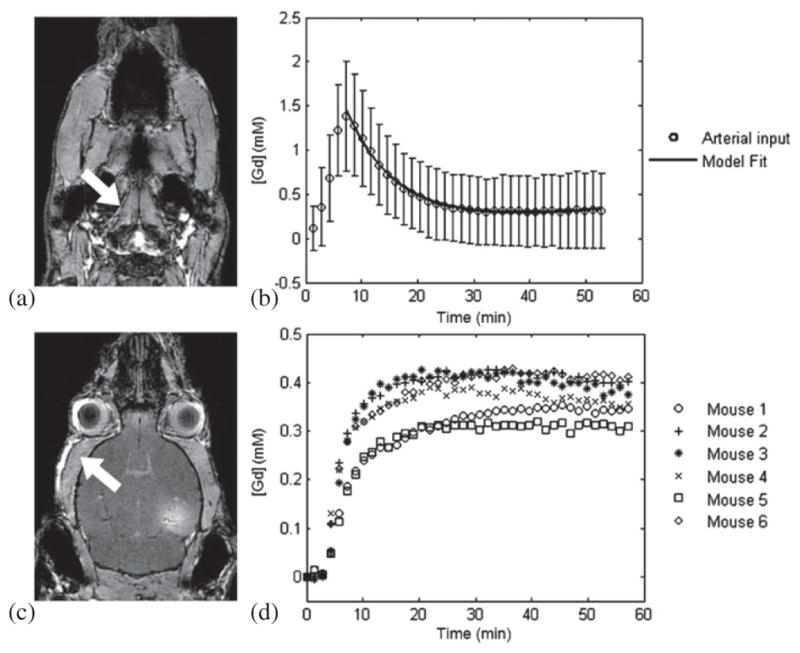
GKM and RRM inputs. The (a) internal carotid artery (indicated by the arrow) was selected for the concentration measurement and the AIF was averaged from a population of 22 mice. The concentration curve was fitted to the bi-exponential model yielding the (b) amplitude and decay rates for GKM. The reference region for RRM was selected from the (c) epicranial muscle (indicated by the arrow) because its (d) temporal Gd-DTPA concentration profile was similar to the concentration profile of the BBB-opened region.
All the images were filtered prior to the concentration fitting, using the N-D filtering function of the Image Processing Toolbox™ in Matlab R2008b (MathWorks, Inc., Natick, MA, USA). Major vessels were not taken into account in the fitting wherever possible, by avoiding the corresponding regions, where the concentration followed an exponential decaying pattern, similar to the one recorded for the AIF. Moreover, whenever GKM converged to negative or very high (>30 min) estimated Gd-DTPA injection times, the permeability values were discarded since the IP injection always started at approximately t = 3 min after the DCE-MRI acquisition. The permeability results were presented both qualitatively (with Ktrans maps) and quantitatively for pre-defined volumes of interest (VOI). The VOI corresponded to a region in the peri-hippocampal area and provided a global estimate of the permeability value. Two VOIs were selected in each case on the left and right side of the brain, in order to calculate and compare the permeability in the sonicated region and the corresponding contra-lateral side, which served as the control. More specifically, a circular-shaped region of interest (0.5 × 0.5 mm2) was first selected on the slice with the maximum T1 signal enhancement in the targeted region (figure 2(d)). The region of interest was then extended to the two neighboring transverse slices, generating a cylindrically-shaped VOI with a dimension of 0.5 × 0.5 × 1.8 mm3. Ktrans for each VOI was measured by averaging the Gd-DTPA concentrations and fitting the mean value to (4) for GKM and (6) for RRM. Following the quantitative permeability measurements, a comparison between the two kinetic models was performed using a linear regression analysis, which calculated the correlation coefficient of the GKM- and RRM-derived Ktrans values and the slope of the regression fit.
2.6. T2 imaging
The post-contrast T2 images were used to detect hemorrhagic effects, usually depicted as dark areas in the sonicated region. The dark areas are the result of the transverse relaxation time shortening after the Gd-DTPA administration, indicating the presence of blood in the EES. The targeted area was compared to the left hippocampal area, which was used as control, in order to quantify the possibility of any macroscopic damage.
2.7. Histology and microscopy
The mice were sacrificed 7 days after sonication and prepared for histology, in order to assess macroscopic structural damage. The animals were anesthetized with a mixture of oxygen (0.8 L min−1 at 1.0 Bar, 21 °C) and 1.5–2.0% vaporized isoflurane (Aerrane, Baxter Healthcare Corporation, Deerfield, IL, USA) using an anesthesia vaporizer (Model 100 Vaporizer, SurgiVet, Inc., Waukesha, WI, USA). The animals were subsequently transcardially perfused with phosphate-buffered saline (5 min) and 4% paraformaldehyde (8 min) at a flow rate of 6.8 mL min−1. After soaking the brain in paraformaldehyde for 24 h, the skull was removed and the brain was fixed again in 4% paraformaldehyde for 6 days. The brain was embedded in paraffin, serially sectioned into 6 μm thick transverse sections, and then stained with hematoxylin and eosin (H&E). The evaluator searched for any erythrocyte extravasations in the proximity of the sonicated capillaries using microscopy and was blinded with respect to each mouse. The microscopic examination was also performed on the left hippocampal area, which was used as the control.
3. Results
The T1-weighted images acquired after DCE-MRI are shown in figures 3(a)–(c), in coronal, sagittal and transverse views. The longitudinal signal enhancement corresponds to the diffused contrast agent in the interstitial space of the right hippocampus, induced by BBB opening. The AIF, acquired from the temporal concentration changes in the ICA, was accurately fitted to the bi-exponential equation, yielding the amplitude and decay rates: (A1, m1, A2, m2) = (0.15, −0.03, 1.53, 0.17). Some variations in the Gd-DTPA concentration amplitude across different mice were detected, but the decay rates remained consistent, indicating that volume averaging within the 0.6 mm thick transverse slice was mainly the cause of the amplitude variation. This is represented in the standard deviation of the concentrations of figure 2(b). The resulting fitting curve (figure 2(b)) indicated that the Gd-DTPA concentration reached its peak 5–6 min after IP injection, decayed exponentially for 25 min and reached a steady-state circulation in the ICA onward.
Figure 3.
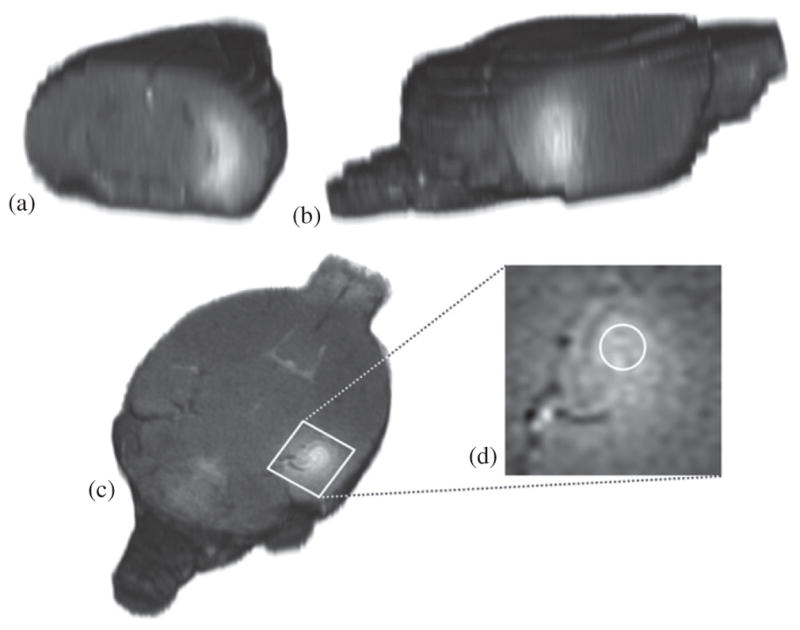
3D reconstructed T1 images of the mouse brain acquired 65 min after contrast agent injection. The signal-enhanced areas in the (a) coronal, (b) sagittal and (c) transverse view of the mouse brain correspond to the BBB-opening and EES diffusion mechanism in the right hippocampus. Ktrans was calculated for a cylindrical VOI, by selecting (d) three identical circular ROI in the presented, its preceding and its succeeding transverse slices.
The pixel-by-pixel fitting of the models produced the permeability maps of figure 4, where we illustrate the Ktrans measurements for the slice with maximum contrast enhancement in the targeted region for all six mice and for both kinetic models. The permeability maps showed that Ktrans varies across mice, although the sonication and MR imaging parameters remained the same, leading to the conclusion that BBB opening depends on the physiological condition of the mouse, apart from the sonication parameters. The maps also indicated that RRM overestimated Ktrans in the sonicated region, which is the direct result of inaccurate concentration fits, as shown in figure 5(b) and the increased Ktrans of the reference region compared to the Ktrans of the BBB-opened region (table 2).
Figure 4.
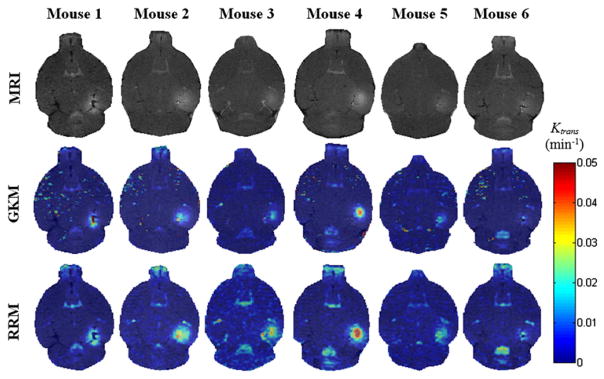
T1 images (first row) and their corresponding permeability maps generated from GKM (second row) and RRM (third row) for all mice. The transverse slice with maximum T1 signal enhancement is selected. The Ktrans values are indicated in the colorbar. The maps have been superimposed over the corresponding DCE-MR images. In the case of mouse 1, the last acquired DCE-MR image is presented instead of a regular T1.
Figure 5.
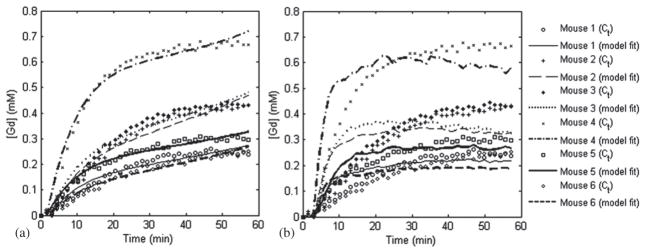
Gd-DTPA concentration fits for the selected VOI in the sonicated side of the mice brain using the (a) GKM and the (b) RRM.
Table 2.
Calculated Ktrans and Kep values for the selected VOI for each sonicated mouse.
| Mouse | GKM Ktrans of reference region (min−1) | VOI | GKM Ktrans of sonicated region (min−1) | GKM Kep of sonicated region (min−1) | RRM Ktrans of sonicated region (min−1) | RRM Kep of sonicated region (min−1) |
|---|---|---|---|---|---|---|
| 1 | 0.02599 | Left | 0 | 0 | 0 | 0 |
| Right | 0.01197 | 0.0045 | 0.01661 | 0 | ||
| 2 | 0.03823 | Left | 0 | 0 | 0.001 | 0 |
| Right | 0.01814 | 0.0009 | 0.03037 | 0 | ||
| 3 | 0.04039 | Left | 0 | 0 | 0.00307 | 0 |
| Right | 0.02075 | 0.0043 | 0.03441 | 0 | ||
| 4 | 0.03805 | Left | 0 | 0 | 0 | 0 |
| Right | 0.04369 | 0.0151 | 0.06056 | 0 | ||
| 5 | 0.02590 | Left | 0 | 0 | 0.00169 | 0 |
| Right | 0.01646 | 0.0094 | 0.02121 | 0 | ||
| 6 | 0.03397 | Left | 0 | 0 | 0 | 0 |
| Right | 0.00951 | 0 | 0.01598 | 0 |
The Ktrans values for the reference region, the selected VOI from both models and for each mouse are summarized in table 2, while figures 5(a) and (b) show the corresponding concentration fits for GKM and RRM, respectively. As expected, the control hippocampi showed negligible Ktrans values in both models since no BBB opening was applied in the left side of the brain. GKM results demonstrated that the mean in the targeted region (0.02 ± 0.0123 min−1) is significantly higher than in the contra-lateral control region, which presented zero Ktrans values (P = 0.005, Student’s t-test, one-tailed with unequal variances). The permeability in the reference region was also measured with GKM (table 2) and the mean value was found to be 0.0337 ± 0.0064 min−1, which is higher than the mean Ktrans calculated in the BBB-opened region. The RRM-derived permeability, , was extracted from the product of the relative permeability of each mouse and the corresponding reference region permeability as calculated using GKM for reasons explained in section 2. The results demonstrated that the mean in the targeted region (0.03 ± 0.0167 min−1) is higher than the mean , as noted above, but not statistically significant (P = 0.134). Nevertheless, the comparison to the contra-lateral (left) control region (8.5 × 10⁻⁴ ± 12 × 10−4 min−1) verified the statistically significant difference between the permeability in the left and the right hippocampal area (P = 0.005) that GKM also indicated (figure 6(a)). Linear regression analysis showed that, although the slope was not unity (0.73), the correlation coefficient between and was significantly high (R2 = 0.9733) (figure 6(b)). The Kep values are also reported in table 2.
Figure 6.
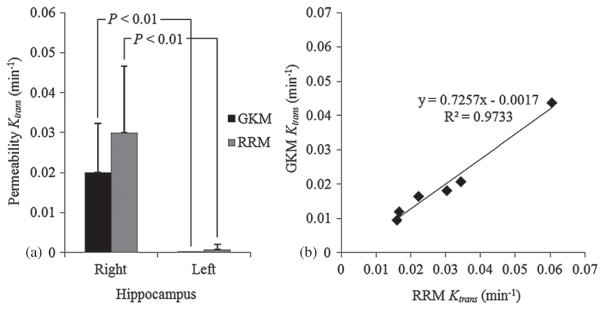
(a) Mean permeability for GKM and RRM algorithms from VOI calculations and (b) linear regression of the Ktrans variation with both kinetic models in all six mice.
The T2 images (figures 7(a)–(e)) of all mice, acquired 75 min after Gd-DTPA injection showed no dark areas in the targeted hippocampal region in comparison with the control side of the mouse brain. H&E histology (figures 7(f)–(i)) also demonstrated that no red blood cell extravasations or any other macroscopic structural damage occurred in the sonicated regions in all six mice.
Figure 7.
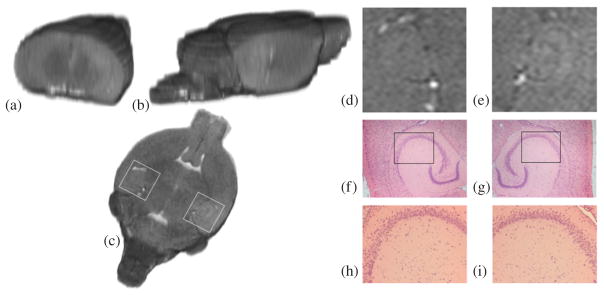
3D reconstructed (a) coronal, (b) sagittal and (c) transverse T2 images of the brain of mouse 4, acquired approximately 2 h after BBB opening. A detectable T2 signal enhancement in the (e) right sonicated hippocampal region compared to the (d) contra-lateral (control) region could be an indication of edema, but no hemorrhage (dark areas) was detected. H&E sections of the (g), (i) sonicated region and the (f), (h) control reveal no macroscopic damage. The white boxes in (c) refer to the regions of interest depicted in (d) and (e). The black boxes in (f) and (g) refer to the regions of interest depicted in (h) and (i), respectively.
4. Discussion
In this paper, the results of a preliminary study for quantifying the spatio-temporal changes in the Gd-DTPA diffusion of the mouse hippocampal area after BBB opening were presented. More specifically, we used two kinetic models to determine the permeability of Gd-DTPA in six mice, sonicated at the peak-rarefactional pressure of 0.30 MPa, after intravenous injection of 1 μL g−1 diluted microbubbles (4–5 μm). A population average of 22 mice was used to determine the AIF for the general kinetic model, by measuring the tracer concentration in the internal carotid artery. Correspondingly, the epicranial muscle was used as the reference region for the reference region model. The permeability map showed the spatial extent of Gd-DTPA uptake in the targeted region, while the Ktrans values were calculated in selected volumes of interest within the targeted area and were used for the side-by-side comparison across all six mice and between the sonicated and non-sonicated hemispheres in each mouse. Our findings showed that equals 0.02 ± 0.0123 min−1 in the targeted hippocampal region, while in the same region yielded statistically insignificantly higher values (0.03 ± 0.0167 min−1).
The peak standard deviations in the and outputs were approximately equal to 50% of the mean value in both models, but the increased correlation coefficient (R2 = 0.9733) confirms the hypothesis that the permeability values reflect the sonication performance and not a modeling error. However, certain limitations need to be considered before extracting any solid conclusions from the permeability values obtained. Although standing waves have been reported not to interfere with BBB opening at lower pressures (Deffieux and Konofagou 2010), variations in the positioning of the mouse and the targeting of the focal beam can lead to discrepancies in the magnitude of Ktrans. Changes in the density and the thickness of the skull bone across different animals may also lead to the attenuation of the focal intensity, while the total volume of microbubbles injected through the tail vein can also affect the extent of the BBB opening. However, the consistency of the experiments in terms of the age (7-weeks old), gender (male), positioning of the mice on the stereotactic frame as well as injection of the microbubbles helped minimize any Ktrans variations that could be derived from these limitations.
The permeability estimates are highly dependent on the timing of the DCE-MRI acquisition after FUS. MR-guided studies (Hynynen et al 2001) have shown that BBB opening may last a short time period of a few hours after sonication, during which permeability is expected to change. The preservation of an accurate experimental timeline should be ensured before Ktrans comparisons are carried out among different mice. However, the experimental timeline of this study was as consistent as possible, maintaining all the dynamic acquisitions within the first 1.5–2 h after sonication. Future studies will investigate the time dependence of permeability, by estimating the Ktrans values on multiple time points until BBB closing occurs.
The small slope of the linear regression (0.73) between GKM and RRM highlights the disagreement in Ktrans across the two kinetic models. This disagreement is the result of the indirect permeability measurements of RRM. RRM requires a reference region concentration profile, similar to the examined region, in order to be fitted optimally and estimate the Ktrans values correctly. The concentration curve of the epicranial muscle was found to be the most suitable for the BBB-opened region, because of its consistency across different animals and the similar longitudinal relaxation time of the muscle and the gray matter. However, the capillaries of the epicranial muscle are more permeable than in the BBB-opened region, due to the lack of a similar barrier. Consequently, the relatively faster Gd-DTPA uptake in the reference region is projected onto the fitting solutions of figure 5(b), where the fitted reference region curves (lines) appear steeper than the actual VOI concentrations (circles), leading to an overestimation of the BBB-opened region permeability. The converging errors of RRM can also be demonstrated in the values of table 2, where the Levenberg–Marquardt algorithm estimated zero efflux constants in the sonicated regions. In addition, RRM requires minimal variability in T10 and across different mice, in order to accurately relate to . The relationship indicates that any significant variation in would eliminate the proportionality between and and add another source of error in the permeability estimation. However, the standard deviation of the GKM-derived values measured in the epicranial muscle was considered low enough (0.0337 ± 0.0064 min−1) to support this requirement for the purpose for this study. On the other hand, RRM appears to generate smoother maps, whereas GKM has miscalculations mostly on the striatum, but also in the posterior thalamic region (seen on the maps of mouse 1, 2, 4, 5 and 6). However, it should be noted that, overall, the GKM was considered to be the most suitable in permeability estimation.
Further modifications could be made in the pharmacokinetic model in order to include all different cellular mechanisms that occur during BBB opening. The GKM and RRM models do not include the endothelial compartment between the intravascular space and the brain parenchyma and assume equal permeability through the paracellular and transcellular pathways. In order for a model to be capable of differentiating between and estimating the transfer rate constants of each of the BBB opening transport mechanisms, two major adjustments would have to be performed in the DCE-MRI protocol. First, higher spatial resolution dynamic MR images can be acquired, which could provide additional information about the tracer kinetics close to the capillaries. However, the cost of increasing spatial resolution is the decrease of the signal-to-noise ratio or temporal resolution, which could lead to variations in the calculation of permeability changes. Secondly, the mathematical model would need to be modified, in order to include more than two compartments and, hence, additional transfer rate constants to be computed. Specifically, Ktrans could be divided into three independent transfer rate constants: the paracellular permeability of the tight junctions, the transcellular permeability through the endothelial cells and the disruptive permeability of the ruptured vessel wall. However, fitting a complex kinetic model with multiple parameters to the dynamic images may incur the risk of not converging to the optimum solution, but to local minima that do not represent the actual permeability values (Kelm et al 2009).
A physiological mechanism of BBB opening that was clearly visible in the dynamic MR images is the tracer diffusion after exiting the bloodstream. The Ktrans maps indicate that Gd-DTPA spreads outside the boundaries of the targeted region, leading to the conclusion that, apart from the plasma-EES interaction, there is a second interaction inside the EES, the EES diffusion. GKM, contrary to RRM, accounts partially for the EES diffusion by assessing the onset of signal enhancement on every pixel. Thus, regions that do not increase their signal intensity in the first 30 min after the contrast agent administration are not taken into account in the algorithm. This is clearly depicted in the permeability maps of mouse 1 (figure 4), where RRM shows increased permeability in the thalamus, in the proximity of the right hippocampus, while GKM does not. Therefore, Ktrans in the FUS-induced BBB opening can only be accurately estimated within the focal spot of the transducer, assuming that the effect of EES diffusion within that diameter is negligible compared to the permeability effect of BBB opening.
Based on the T2-weighted images, no sign of hemorrhage in the targeted region was detected (figures 7(d) and (e)). However, MRI alone cannot constitute a safety assessment method of the FUS-induced BBB opening since the MR image resolution is not adequate to depict extravasated erythrocytes. In addition, no red blood cell extravasations were found near or far from the targeted vessels of the hippocampal area in all six mice (figures 7(f)–(i), indicating that no macroscopic anatomical damage occurred during FUS.
Lastly, in this study intraperitoneal (IP) Gd-DTPA administration was used due to its associated longer persistence times affording dynamic acquisitions at critically higher image quality and lower temporal resolution. However, when large tracer volumes are absorbed by the intravascular space, blood increases significantly its T1 and T2 relaxivity, which results in vessel darkening (T2*effect). These changes may affect the Gd-DTPA concentration measurements and consequently, the Ktrans estimation. Intravenous (IV) administration may lead to more accurate Gd-DTPA concentration measurements from the signal intensity changes since the smaller tracer boluses do not massively affect the relaxation properties of the intravascular space. However, IV catheterization is notoriously difficult in mice and requires very high temporal resolution. Several attempts to use heparinized and non-heparinized MR-compatible catheters in the tail or femoral vein resulted in the creation of clots, scars or excessive bleeding especially after the vertical positioning of the mouse inside the MRI bore. An optimization of the catheterization technique will be carried out in future studies, which will allow the quantitative permeability comparison of the FUS-induced BBB opening with other BBB opening techniques.
In order to investigate the permeability changes after BBB opening at different acoustic pressures and microbubble sizes (Choi et al 2010), a more extensive study is ongoing in a series of mice sonicated at different FUS parameters so as to assess the effect of our BBB opening technique on its permeability and efficacy in drug delivery. In addition, simulations and ex vivo experiments with primate and human skulls are ongoing, in order to assess the feasibility of our technique in larger sized brains and thicker skulls (Deffieux and Konofagou 2010).
5. Conclusion
In this study, we investigated the effect of FUS-induced BBB opening on the microvascular permeability of the mouse hippocampus. Sequential DCE-MR images were processed using two pharmacokinetic models in order to determine the transfer rate constants in six mice. The parametric maps showed that the Ktrans in the proximity of the targeted region reached 0.02 min−1 for GKM and 0.03 min−1 for RRM, at least two orders of magnitude higher than that in the contra-lateral, non-sonicated region of the mouse brain (0 and 8.5 × 10⁻⁴ min−1 respectively). Localized measurements of permeability were obtained in specified volumes of interest within the hippocampus, showing that Ktrans in the EES varied between 0.01–0.044 min−1 (GKM) and 0.016–0.061 min−1 (RRM). The results using the two kinetic models showed excellent correlation (R2 = 0.97) but poorer agreement. However, the poor concentration fits of RRM suggest that it may be less accurate than GKM, making GKM more suitable for permeability estimation. The Ktrans values were found to depend upon a series of parameters including those of the DCE-MRI timing, the tracer kinetic model, but also the FUS target, the skull attenuation and the microbubble administration. Nevertheless, the comparison of the Ktrans measurements between the sonicated and non-sonicated hippocampal regions displayed significant differences, which may support the assumption that the FUS technique holds great promise as a non-invasive, safe and efficacious drug delivery method for the treatment of Alzheimer’s, or other undertreated neurological diseases, by transiently and significantly increasing the BBB permeability.
Acknowledgments
This study was sponsored by NIH (EB009041). The authors wish to thank Jameel Feshitan, MS (Chemical Engineering) for manufacturing the microbubbles, Kirsten Selert, BS (Biomedical Engineering) for the histological specimen preparation and analysis and James Masciotti, MS (Biomedical Engineering), Ana Pereira, MD and Scott Small, MD (Neurology) at Columbia University for their ideas and preliminary studies.
References
- Abbott NJ, Rönnbäck L, Hansson E. Astrocyte-endothelial interactions at the blood–brain barrier. Nat Rev Neurosci. 2006;7:41–53. doi: 10.1038/nrn1824. [DOI] [PubMed] [Google Scholar]
- Bilgen M, Narayana PA. A pharmacokinetic model for quantitative evaluation of spinal cord injury with dynamic contrast-enhanced magnetic resonance imaging. Magn Res Med. 2001;46:1099–106. doi: 10.1002/mrm.1305. [DOI] [PubMed] [Google Scholar]
- Brown RC, Egleton RD, Davis TP. Mannitol opening of the blood–brain barrier: regional variation in the permeability of sucrose, but not 86Rb +or albumin. Brain Res. 2004;1014:221–7. doi: 10.1016/j.brainres.2004.04.034. [DOI] [PubMed] [Google Scholar]
- Choi JJ, Feshitan JA, Baseri B, Wang S, Tung YS, Borden MA, Konofagou EE. Microbubble-size dependence on focused ultrasound-induced blood–brain barrier opening in mice. IEEE Trans Biomed Eng. 2010;57:145–54. doi: 10.1109/TBME.2009.2034533. [DOI] [PMC free article] [PubMed] [Google Scholar]
- Choi JJ, Pernot M, Small SA, Konofagou EE. Non-invasive, transcranial and localized opening of the blood–brain barrier using focused ultrasound in mice. Ultrasound Med Biol. 2007;33:95–104. doi: 10.1016/j.ultrasmedbio.2006.07.018. [DOI] [PubMed] [Google Scholar]
- Cohen DM, Patel CB, Ahobila-Vajjula P, Sundberg LM, Chacko T, Liu SJ, Narayana PA. Blood-spinal cord barrier permeability in experimental spinal cord injury: dynamic contrast-enhanced MRI. NMR Biomed. 2009;22:332–41. doi: 10.1002/nbm.1343. [DOI] [PMC free article] [PubMed] [Google Scholar]
- Deane R, Zlokovic BV. Role of the blood–brain barrier in the pathogenesis of Alzheimer’s disease. Curr Alzheimer Res. 2007;4:191–7. doi: 10.2174/156720507780362245. [DOI] [PubMed] [Google Scholar]
- De Boer AG, Gaillard PJ. Drug targeting to the brain. Annu Rev Pharmacol Toxicol. 2007;47:323–55. doi: 10.1146/annurev.pharmtox.47.120505.105237. [DOI] [PubMed] [Google Scholar]
- Deffieux T, Konofagou EE. Numerical study and experimental validation of a simple transcranial focused ultrasound system applied to blood–brain barrier opening. IEEE Trans Ultras Ferroel Freq Control. 2010 doi: 10.1109/TUFFC.2010.1738. (in review) [DOI] [PMC free article] [PubMed] [Google Scholar]
- Demsar F, Shames DM, Roberts TPL, Stiskal M, Roberts HC, Brasch RC. Kinetics of MRI contrast agents with a size ranging between Gd-DTPA and albumin-Gd-DTPA: use of cascade-Gd-DTPA-24 polymer. Electro-Magn Biol Med. 1998;17:283–97. [Google Scholar]
- Feshitan JA, Chen CC, Kwan JJ, Borden MA. Microbubble size isolation by differential centrifugation. J Colloid Interface Sci. 2009;329:316–24. doi: 10.1016/j.jcis.2008.09.066. [DOI] [PubMed] [Google Scholar]
- Hsiao IT, Liao YP, Liu HL. Study of onset time-shift and injection duration in DCE-MRI: a comparison of a reference region model with the general kinetic model. NMR Biomed. 2010;23:375–81. doi: 10.1002/nbm.1473. [DOI] [PubMed] [Google Scholar]
- Hynynen K, McDannold N, Vykhodtseva N, Jolesz FA. Noninvasive MR imaging-guided focal opening of the blood–brain barrier in rabbits. Radiology. 2001;220:640–6. doi: 10.1148/radiol.2202001804. [DOI] [PubMed] [Google Scholar]
- Jiang Q, et al. Quantitative evaluation of BBB permeability after embolic stroke in rat using MRI. J Cereb Blood Flow Metab. 2005;25:583–92. doi: 10.1038/sj.jcbfm.9600053. [DOI] [PubMed] [Google Scholar]
- Kelm BM, Menze BH, Nix O, Zechmann CM, Hamprecht FA. Estimating kinetic parameter maps from dynamic contrast-enhanced MRI using spatial prior knowledge. IEEE Trans Med Imaging. 2009;28:1534–47. doi: 10.1109/TMI.2009.2019957. [DOI] [PubMed] [Google Scholar]
- Kim JH, Kim JH, Park JA, Lee SW, Kim WJ, Yu YS, Kim KW. Blood–neural barrier: intercellular communication at glio-vascular interface. J Biochem Mol Biol. 2006;39:339–45. doi: 10.5483/bmbrep.2006.39.4.339. [DOI] [PubMed] [Google Scholar]
- Knight RA, Nagaraja TN, Ewing JR, Nagesh V, Whitton PA, Bershad E, Fagan SC, Fenstermacher JD. Quantitation and localization of blood-to-brain influx by magnetic resonance imaging and quantitative autoradiography in a model of transient focal ischemia. Magn Res Med. 2005;54:813–21. doi: 10.1002/mrm.20629. [DOI] [PubMed] [Google Scholar]
- Li LZ, et al. Quantitative magnetic resonance and optical imaging biomarkers of melanoma metastatic potential. Proc Natl Acad Sci. 2009;106:6608–13. doi: 10.1073/pnas.0901807106. [DOI] [PMC free article] [PubMed] [Google Scholar]
- McGrath DM, Bradley DP, Tessier JL, Lacey T, Taylor CJ, Parker GJM. Comparison of model-based arterial input functions for dynamic contrast-enhanced MRI in tumor bearing rats. Magn Res Med. 2009;61:1173–84. doi: 10.1002/mrm.21959. [DOI] [PubMed] [Google Scholar]
- Pardridge WM. The blood–brain barrier: bottleneck in brain drug development. NeuroRx. 2005;2:3–14. doi: 10.1602/neurorx.2.1.3. [DOI] [PMC free article] [PubMed] [Google Scholar]
- Parker GJM, Roberts C, Macdonald A, Buonaccorsi GA, Cheung S, Buckley DL, Jackson A, Watson Y, Davies K, Jayson GC. Experimentally-derived functional form for a population-averaged high-temporal-resolution arterial input function for dynamic contrast-enhanced MRI. Magn Res Med. 2006;56:993–1000. doi: 10.1002/mrm.21066. [DOI] [PubMed] [Google Scholar]
- Pickup S, Zhou R, Glickson J. MRI estimation of the arterial input function in mice. Acad Rad. 2003;10:963–8. doi: 10.1016/s1076-6332(03)00291-5. [DOI] [PubMed] [Google Scholar]
- Rapoport SI. Osmotic opening of the blood–brain barrier: principles, mechanism, and therapeutic applications. J Cell Mol Neurobiol. 2000;20:217–30. doi: 10.1023/A:1007049806660. [DOI] [PMC free article] [PubMed] [Google Scholar]
- Raymond SB, Treat LH, Dewey JD, McDannold NJ, Hynynen K, Bacskai BJ. Ultrasound enhanced delivery of molecular imaging and therapeutic agents in Alzheimer’s disease mouse models. PLoS ONE. 2008;3:e2175. doi: 10.1371/journal.pone.0002175. [DOI] [PMC free article] [PubMed] [Google Scholar]
- Rebeles F, Fink J, Anzai Y, Maravilla KR. Blood–brain barrier imaging and therapeutic potentials. Top Magn Reson Imaging. 2006;17:107–16. doi: 10.1097/RMR.0b013e31802f5df9. [DOI] [PubMed] [Google Scholar]
- Roberts HC, Roberts TPL, Brasch RC, Dillon WP. Quantitative measurement of microvascular permeability in human brain tumors achieved using dynamic contrast-enhanced MR imaging: correlation with histologic grade. AJNR Am J Neuroradiol. 2000;21:891–9. [PMC free article] [PubMed] [Google Scholar]
- Sheikov N, McDannold N, Sharma S, Hynynen K. Effect of focused ultrasound applied with an ultrasound contrast agent on the tight junctional integrity of the brain microvascular endothelium. Ultrasound Med Biol. 2008;34:1093–104. doi: 10.1016/j.ultrasmedbio.2007.12.015. [DOI] [PMC free article] [PubMed] [Google Scholar]
- Sheikov N, McDannold N, Vykhodtseva N, Jolesz F, Hynynen K. Cellular mechanisms of the blood–brain barrier opening induced by ultrasound in presence of microbubbles. Ultrasound Med Biol. 2004;30:979–89. doi: 10.1016/j.ultrasmedbio.2004.04.010. [DOI] [PubMed] [Google Scholar]
- Thomas DL, Lythgoe MF, Gadian DG, Ordidge RJ. In vivo measurement of the longitudinal relaxation time of arterial blood (T1a) in the mouse using a pulsed arterial spin labeling approach. Mag Reson Med. 2006;55:943–7. doi: 10.1002/mrm.20823. [DOI] [PubMed] [Google Scholar]
- Tofts PS, et al. Estimating kinetic parameters from dynamic contrast-enhanced T1-weighted MRI of a diffusible tracer: standardized quantities and symbols. J Magn Res Imaging. 1999;10:223–32. doi: 10.1002/(sici)1522-2586(199909)10:3<223::aid-jmri2>3.0.co;2-s. [DOI] [PubMed] [Google Scholar]
- Tofts PS, Kermode AG. Measurement of the blood–brain barrier permeability and leakage space using dynamic MR imaging: 1. Fundamental concepts. Magn Res Med. 1991;17:357–67. doi: 10.1002/mrm.1910170208. [DOI] [PubMed] [Google Scholar]
- Turnbull LW. Dynamic contrast-enhanced MRI in the diagnosis and management of breast cancer. NMR Biomed. 2009;22:28–39. doi: 10.1002/nbm.1273. [DOI] [PubMed] [Google Scholar]
- Yankeelov TE, Cron GO, Addison CL, Wallace JC, Wilkins RC, Pappas BA, Santyr GE, Gore JC. Comparison of a reference region model with direct measurement of an AIF in the analysis of DCE-MRI data. Magn Res Med. 2007;57:353–61. doi: 10.1002/mrm.21131. [DOI] [PubMed] [Google Scholar]
- Yankeelov TE, Luci JJ, Lepage M, Li R, Debusk L, Lin PC, Price RR, Gore JC. Quantitative pharmacokinetic analysis of DCE-MRI data without an arterial input function: a reference region model. Magn Res Imaging. 2005;23:519–29. doi: 10.1016/j.mri.2005.02.013. [DOI] [PubMed] [Google Scholar]