Abstract
Arterial stiffness has been shown to be a good indicator of the arterial wall diseases. However, a single parameter is insufficient to describe the complex stress-strain relationship of a multi-component, non-linear tissue such as the aorta. We therefore propose a new approach to measure the stress-strain relationship locally in vivo and present a noninvasively, clinically relevant parameter describing the mechanical interaction between aortic wall constituents. The slope change of the circumferential stress-strain curve was hypothesized as a contribution of elastin and collagen, which was noninvasively defined in the term of strain using only radial aortic wall acceleration, i.e., transition strain . Two-spring parallel was employed as the phenomenological model and three Young's moduli were accordingly evaluated, i.e., corresponding to the: elastic lamellae (E1), elastin-collagen fibers (E2) and collagen fibers (E3). Our study performed on normal and Angiotensin II (AngII)-treated mouse abdominal aortas using aortic pressure from catheterization and local aortic wall diameters from a cross-correlation technique on the radio frequency (RF) ultrasound signal at 30 MHz and frame rate of 8 kHz. Using our technique, transition strain and three Young’s moduli in both normal and pathological aortas were mapped in 2D. In the results, the slope change of the circumferential stress-strain curve was first observed in vivo under physiologic conditions. The transition strain was identified at the lower strain level in the AngII-treated case, i.e., 0.029±0.006 of normal and 0.012±0.004 of AngII-treated aortas. E1, E2 and E3 were 69.7±18.6, 214.5±65.8 and 144.8±55.2 kPa for normal aortas, respectively, and 222.1±114.8, 775.0±586.4 and 552.9±519.1 kPa for AngII-treated aortas, respectively. This is because of the alteration of structures and content of the wall constituents, the degradation of elastic lamella and collagen formation due to AngII treatment. While such values illustrate the alteration of structure and content of the wall constituents related to AngII treatment, limitations regarding physical assumptions (isotropic linear elastic) should be kept in mind. The transition strain, however, was shown to be an aortic pressure waveform independent parameter that can be clinically relevant and noninvasively measured using ultrasound-based motion estimation techniques. In conclusion, our novel methodology can assess the stress-strain relationship of the aortic wall locally in vivo and quantify informative parameters which are related to vascular disease.
Keywords: Aorta, Cardiovascular Disease, Collagen, Elastin, Transition Strain, Ultrasound
1. Introduction
Arterial stiffness has been used as a predictive indicator of vascular disease [1, 2]. The ability to identify cardiovascular abnormalities based on stiffness has been used in both diagnosis and treatment planning [3]. Several arterial stiffness definitions have been proposed based on in vivo measurements. They were derived from the radial pulsation of the cardiac output at the end-systolic and end-diastolic phases, yielding, e.g., the compliance, the pressure-strain elastic modulus (Ep), the stiffness index (β), etc. [4]. Although they all represent the arterial stiffness in general, these moduli represent only a part of the mechanical behavior, not the entire stress-strain relationship. The stress-strain relationship includes more complete information on the wall including the effects of the different constituents.
Previous studies have shown the influence of the aortic wall constituents on its stress-strain relationship [5–10]. The change of the stress-strain slope, indicating the change of material properties, was hypothesized as a result of the effect of the elastin and collagen in the aortic wall [4, 11, 12]. The aortic wall expands in order to accommodate the increased blood volume during the systolic phase [4, 13]. The elastic lamellae are dilated first due to their relatively lower stiffness, thousand times lower than collagen [13, 14]. As the strain increases, the vascular elastic modulus increases because the collagen fibers start engaging in order to maintain the aortic wall shape. This modulus transition has previously been reported [4–6]. This transition is, however, ignored when measuring the general arterial stiffness. The contribution of the wall constituents can be rich in information for the detection of vascular disease at its early stages, before the artery becomes severely dysfunctional.
Several studies have been conducted using mechanical testing in vitro [4, 13–15]. It provides sufficient information on the underlying mechanical properties such as loading and their deformations in multiaxial directions, aortic wall constituents’ contents, fibers orientations, etc [13]. However, as soon as the aortic segment is excised, its characteristics are changed [16, 17].
The mechanical properties of the abdominal aorta in its physiological condition would naturally best be evaluated in vivo [4]. To our knowledge, the transition from elastin to the contribution of elastin-collagen fiber engagement on the stress-strain relationship has only been reported in vivo under abnormal conditions, i.e., aortic occlusion or drug induction [5–7, 18, 19]. Nonlinearity has not been reported, to our knowledge, under normal physiological conditions in vivo. Previous studies have reported the elastic modulus as a specific value at one site [2, 5–7, 20–23], i.e., without specifying the onset or the regions of vascular disease. A local mechanical characterization of the aortic wall could aid medical diagnosis by providing local, functional information on the wall constituents and its change with disease progression.
Therefore, in this study, we focus on the regional, qualitative assessment of the aortic wall in vivo obtained from the stress-strain behavior. In order to determine both the stress and strain within the aortic wall, both the aortic pressure and aortic wall deformation need to be obtained. There are several techniques for measuring aortic pressure and wall geometry changes in vivo. To obtain the aortic pressure waveform, standard methods include tonometry [13, 24, 25] and catheterization [4–6, 13, 26]. The latter method provides better accuracy on the pressure profile than the former and can also be applied on deeper-seated blood vessels.
A well-known imaging modality for the aortic wall geometry and motion detection is ultrasound imaging [27, 28] due to its high temporal resolution. Our group recently proposed the Pulse Wave Imaging (PWI) technique [29, 30] capable of noninvasively visualizing the pulse-wave propagation using radio-frequency (RF) signals at a very high frame rate of 8 kHz in mice. The acquired RF frames were processed to yield the aortic wall motion using a cross-correlation technique. The wall motion and thickness were then obtained across the entire imaged aortic region. This noninvasive in vivo technique has been proven very effective in pulse-wave-induced aortic wall displacement measurement.
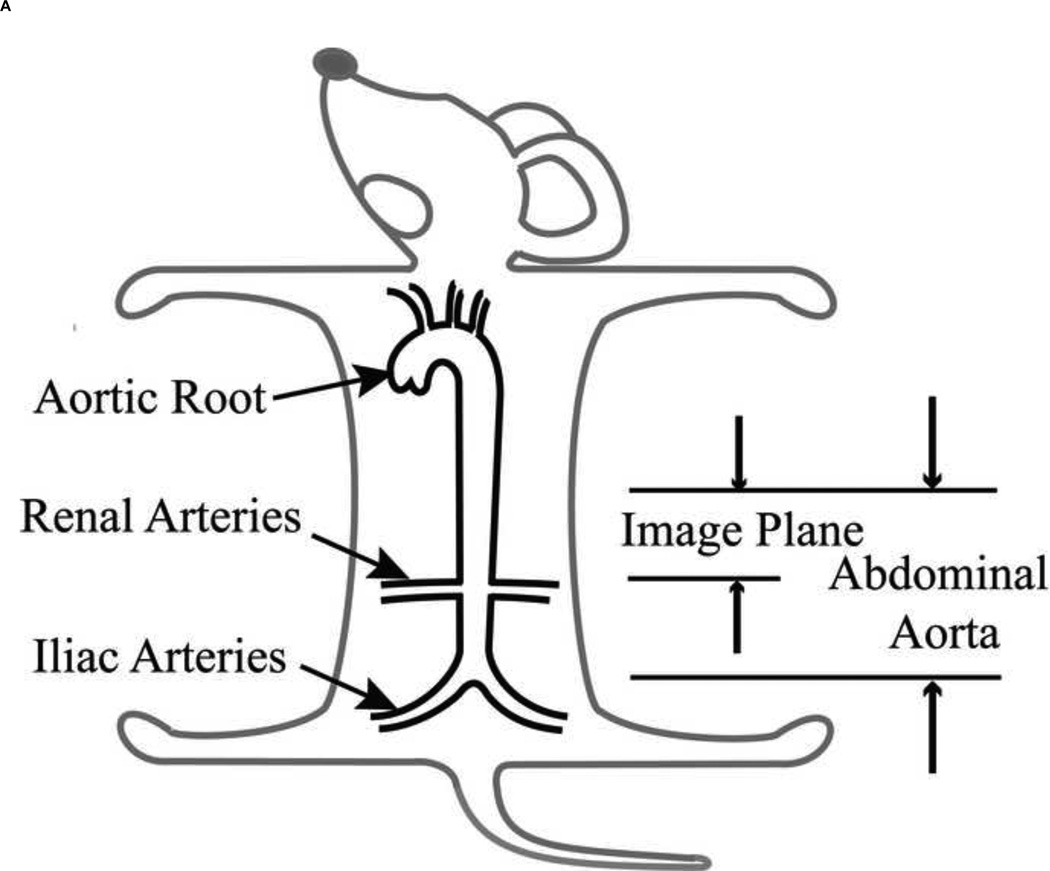
In this paper, we propose to characterize the stress-strain relationship of the aortic wall locally using catheterization for direct, aortic pressure measurement, and ultrasound-based wall motion estimation in vivo [29, 30]. The murine abdominal aorta was considered because of its simple geometry (Figure 1A) and its association with vascular diseases such as atherosclerosis and aneurysm [30]. We also investigated the effect of the aortic wall constituents on the stress-strain relationship upon administration of Angiotensin II (AngII). AngII infusion-based model has been widely used to increase blood pressure by causing extracellular matrix degradation and vessel wall injury [31–33]. The stress-strain relationship was therefore determined on normal and AngII-treated aortas. The experimental procedure, parameter calculations and model description of the stress-strain relationship are provided in the method section. Results of both normal and AngII-treated aortas are first presented, followed by the discussion, including limitations of the methodology proposed and conclusions.
Figure 1.
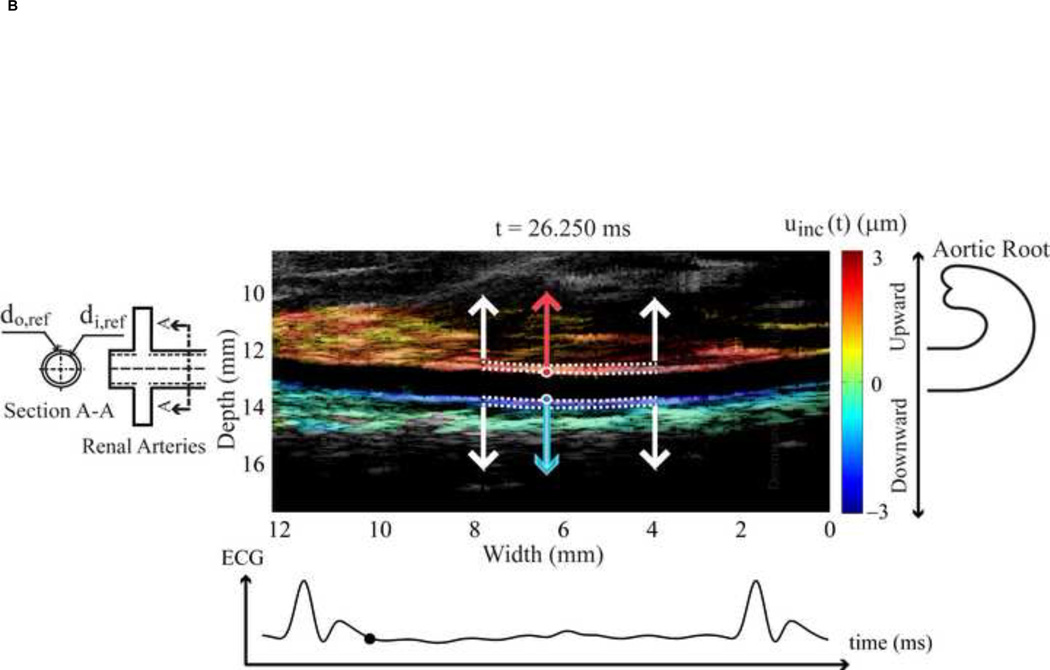
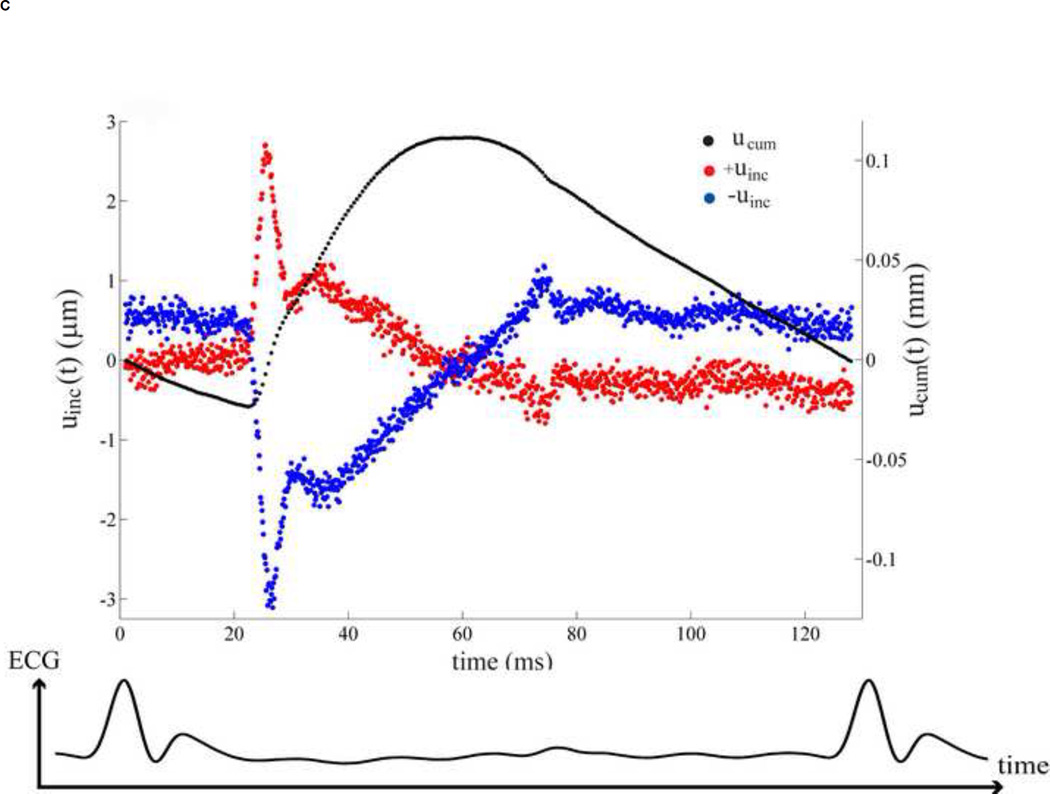
(A) Location of the abdominal aorta in mouse. (B) The B-mode image of the murine abdominal aorta in systolic phase of the heart. White dash line expresses the inner and outer diameter tracing. (C) The black dot on the ECG denotes the phase at which the image in Figure 1B was acquired. (D) The incremental displacements at of the inner wall. Red and blue indicate the locations of the ventral and dorsal aortic walls, respectively, which are corresponding to the locations of red and blue dots of Figure 1B. The corresponding accumulative displacements are presented as black dots, calculated from Eq. (2). (E)The time period over one cardiac cycle defined by R-wave where the displacements in Figure 1D were taken.
2. Methods
We assumed that the aortic wall exhibited during systole Two separate groups of animals were considered, i.e., five (n=5) normal mice (Group 1) and five (n=5) AngII-treated mice (Group 2). The experimental procedure, parameter calculation and phenomenological model of the aortic wall are described in separate sections below.
2.1 Experimental procedure
Eleven wild-type C57BL/6 male mice (7–10 months old) were obtained from the Jackson (Bar Harbor, ME) and Taconic (Germantown, NY) laboratories. One mouse was used for pressure measurement, five for Group 1 and five for Group 2. All procedures were approved by the Institutional Animal Care and Use Committee of Columbia University. Abdominal hair was removed prior to imaging using hair removal lotion (Veet, Reckith Benckiser Inc., Toronto, ON, Canada). The mice were placed supine on a heated platform (THM100, Indus Instruments, Houston, TX, USA) to maintain a constant body temperature of approximately 37.0 °C.
A murine abdominal aorta was cannulated by an ultra-miniature pressure catheter (SciSense, London, ON, Canada), and through the mouse's carotid artery and aortic arch, introduced into the abdominal aortic region. The aortic pressure waveform was subsequently acquired. The ECG was obtained using the electrode leads available on the heated mouse platform (THM100, Indus, Instruments, Houston, TX). Both the aortic pressure and ECG signals were acquired and stored using a two-channel 14-bit waveform digitizer (CompuScope 14200, Gage, Applied Technologies Inc., Lachine, QC, Canada) at the sampling frequency of 10 kHz. The average heart rate (HR) was 235 bpm under isoflurane anesthesia. The same aortic pressure waveform obtained from one mouse was employed as a first approximation in this study.
For Group 1, five murine abdominal aortas were scanned by high-frequency ultrasound in vivo. The ultrasound probe was placed on the murine abdomen using degassed ultrasound gel (Aquasonic 100, Parker Laboratories Inc., Orange, Fairfield, NJ) as the coupling medium. The high frame-rate data acquisition system previously developed was used in the in vivo experiments [29, 30]. A 30-MHz ultrasound probe (RMV-707B, VisualSonics Inc., Toronto, ON, Canada) was placed on the murine abdomen. A longitudinal (long-axis) view of the abdominal aorta was used so as to align the radial direction of the aorta with the axial direction of the ultrasound beams. The field of view (FOV) was equal to 12×12 mm2, the axial and lateral resolution were equal to 55 µm and 115 µm, respectively. In the EKV (ECG-based kilohertz visualization) mode provided by the imaging system (Vevo 770, VisualSonics Inc., Toronto, ON, Canada), the single-element transducer operated on a line-by-line basis. The ECG was obtained using the electrode leads available on the heating mouse platform. The heart rate (HR) of the 5 mice were as follows (mean±std) 447.4±27.5 bpm (between 409–481 bpm) under isoflurane anesthesia. Each RF cine-loop acquisition lasted approximately 7 min. After data acquisition, the acquired RF signals were gated between two consecutive R-waves to reconstruct the image sequence for a complete cardiac cycle at the extremely high frame rate of 8 kHz [34]. The incremental (i.e., between consecutive RF frames), axial (i.e., along the direction of ultrasound propagation) displacements, parallel to the radial direction of the abdominal aorta, were estimated off-line using a 1-D normalized cross-correlation technique on the RF signals. The window size used was equal to 240 µm with a 90% overlap. The rigid aortic motion induced by respiration was removed by subtracting the motion of the perivascular tissue from the motion of the aorta [30].
For Group 2, five normal mice were treated with AngI. After intraperitoneal administration of 125 mg/kg tribomoethanol (Sigma-Aldrich Corp., St. Louis, MO), a subcutaneous osmotic minipump (Alzet model 2004, Durect Corp, Cupertino, CA) was implanted into the mouse to deliver a slow release of AngII (1.44 mg/kg/day). On day 28, the aortic wall motion was estimated using the same technique as Group 1. The HR of the five AngII mice was (mean±std) 418.2±86.1 bpm (between 288–530 bpm) under isoflurane anesthesia.
2.2 Parameter calculation
The aortic pressure was measured over a cardiac cycle at to the region of interest in the abdominal aortic lumen of one mouse. This was assumed to be uniform over the entire scanned abdominal region and applied to the aortic wall deformation in Group 1 and Group2.
Regarding the high resolution ultrasound images, the inner and outer diameters, thickness and locations of the abdominal aortic wall were clearly obtained though manual tracing on the B-mode image by a trained observer (Figure 1B). The region of the abdominal aorta most orthogonal to the ultrasound beam was chosen in order to obtain the most accurate displacement estimation, i.e., in the axial direction as shown between white arrows in Figure 1B. These coordinates, from the selected region, were mapped onto the RF frame. The radial incremental displacements, uinc, of the inner and outer walls were then estimated using the cross-correlation technique [29]. As shown in Figure 1D, the positive values denote upward incremental displacements (red dots) to the ultrasound transducer, while the negative (blue dots) depict downward displacement. We assumed that the wall was expanded radially and symmetrically. The RF frame rate considered was 2 kHz in order to get the highest quality displacement estimation [30]. Then the cumulative displacement, ucum was calculated as follows.
| (1) |
| (2) |
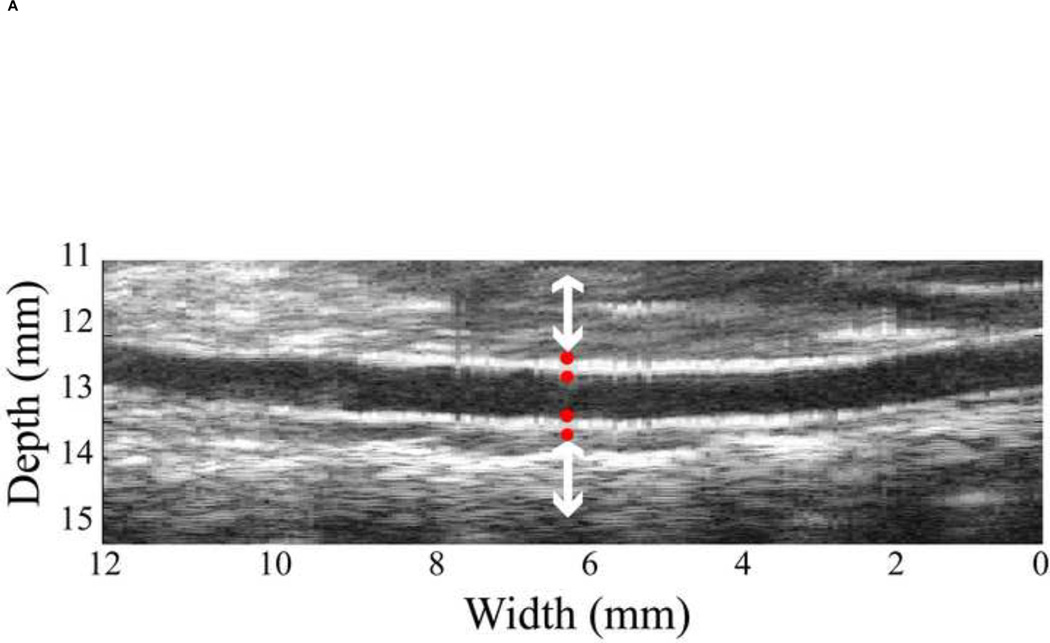
where dref is the reference diameter from manual tracing on the B-mode image as in Figure 2A, d(i) is the aortic diameter, ith is the frame number, which is related to time by t=i/frame rate (0.5ms), indicating the time in the cardiac cycle. The inner diameter, di(t), and outer diameter, do(t), variations are followed the Eq. (2).
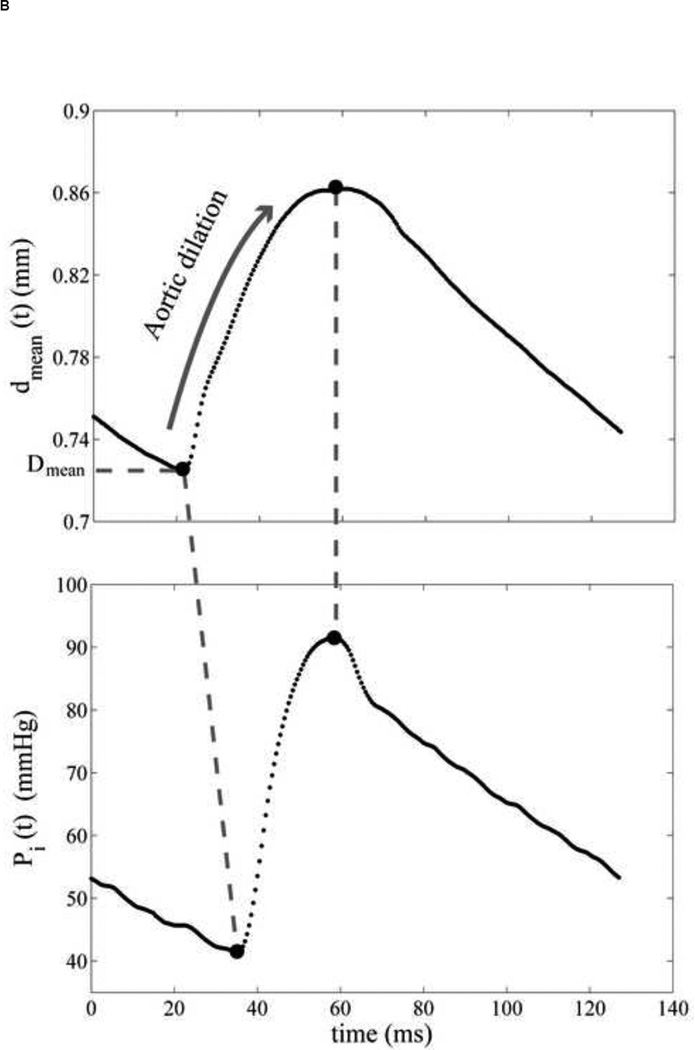
Figure 2.
(A) Four red dots display the locations of inner and outer diameter, which was chosen from B-mode ultrasound image. (B) The mean diameter variation of the abdominal aorta. Both pressure and diameter are corresponding to the selected location in Figure 2A. (C) The aortic pressure variation over one cardiac cycle. The minimum and maximum peaks are aligned to eliminate the viscosity effect and only the dilation of the aorta is considered. The reference diameter, Dmean, is defined as the minimum of the cycle.
The aortic pressure waveform was aligned with the aortic wall diameter variation using the corresponding ECG. Since the purely elastic behavior was only investigated, the maximum and minimum peaks of the pressure and diameter variations were aligned. Since the interaction between the aortic wall and blood flow was ignored, only the aortic dilation during the systolic phase was considered. The aortic wall motion was observed during the entire cardiac cycle in order to identify the dilation phase, i.e., the deformation of the wall between the minimum and maximum diameter peaks (Figure 3).
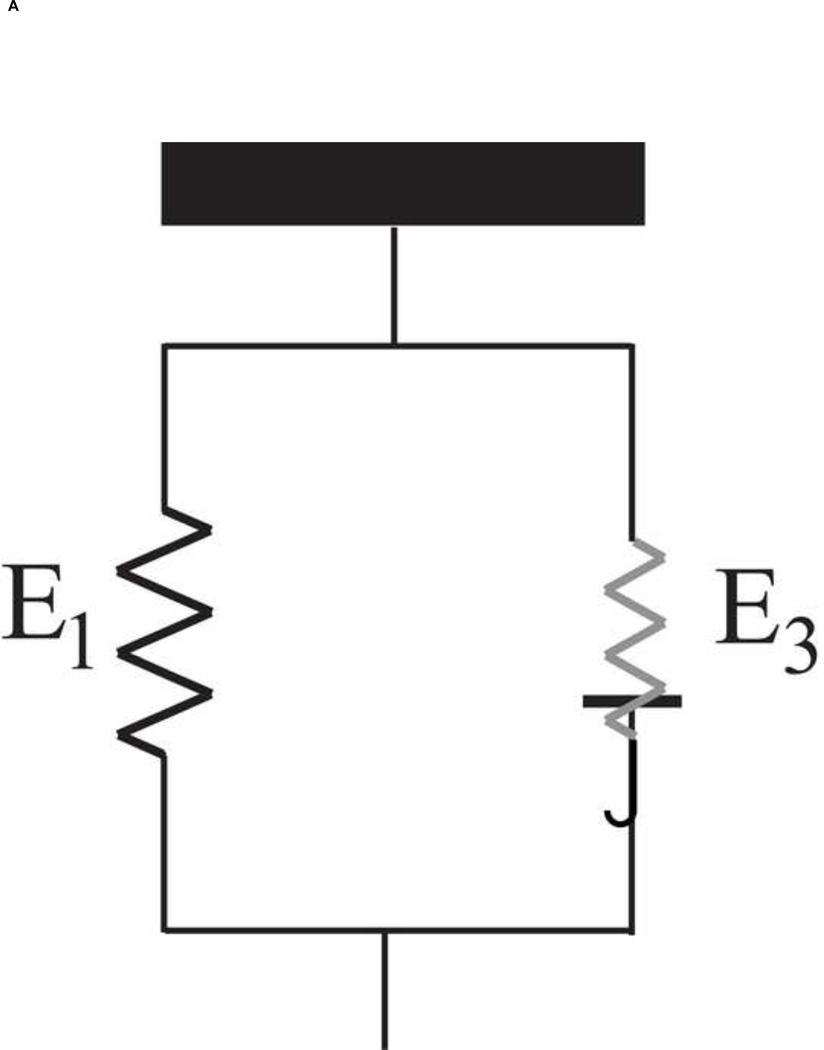
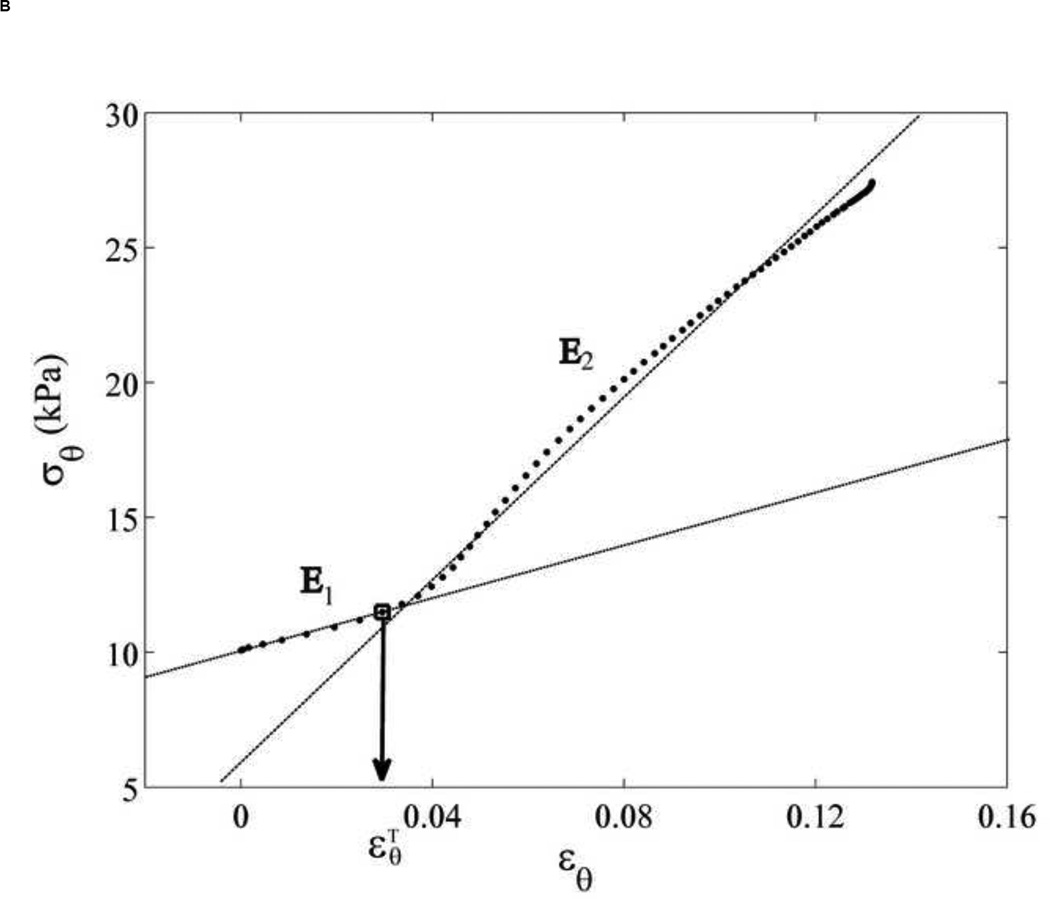
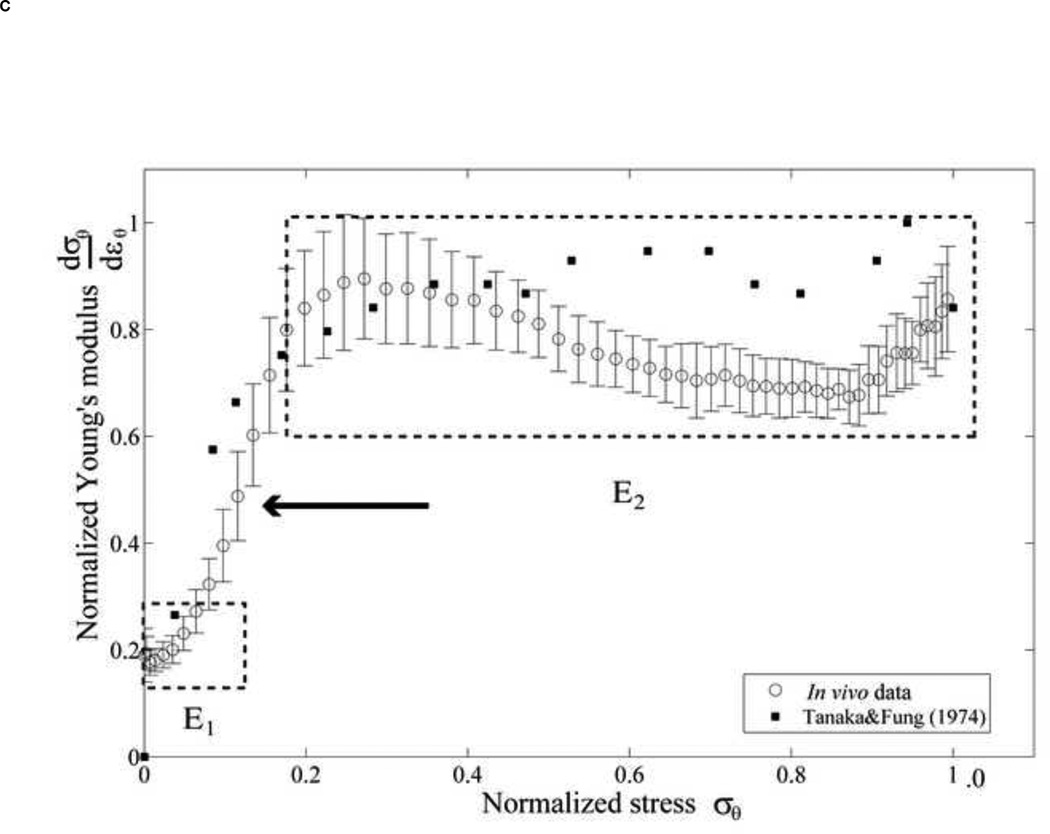
Figure 3.
(A) The phenomenological model of the aortic wall. (B) The stress-strain relationship was separated into two linear relations by a transition point, . This data is referred to location as shown in Figure 2A. (C) The normalized derivative of stress with respect to strain versus normalized stress are plotted to confirm two groups of elastic modulus, E1 and E2, compared to Tanaka and Fung (1974). The arrow indicates discontinuity.
The radial pulsation of the aortic wall induced both radial and circumferential deformations. The circumferential direction is the most dominant [35]. Also, the aortic wall thickness was very small i.e., 0.153±0.029 mm, but above the image resolution limit (55 µm) that provide inadequate resolution to determine the aortic radial strain. Hence, the stress-strain relationship was expressed in the circumferential direction. Laplace’s law was applied for the stress calculation, and the extravascular pressure was assumed to be zero, i.e.,
| (3) |
where σθ(t) is the mean circumferential stress and Pi(t), di(t), do(t) are the aortic pressure, inner and outer diameter of the aortic wall, respectively. εθ(t) is defined as the circumferential strain, i.e.,
| (4) |
where dmean(t) = (do(t)+di(t))/2 is the mean diameter and Dmean is the in vivo reference configuration, defined as the minimum diameter over a cardiac cycle.
The field of view was different across mice according to the individual location and orientation of the abdominal aorta. We focused on the region, where the inner and outer diameters of the aortic wall could be detected. The number of selected locations along the aorta for each mouse, defined as N, thus varied (11–92 locations). Hereafter, the circumferential stress and strain were calculated using Eqs.(3) and (4) N times for each mouse.
2.3 Model description
The media, the most dominant layer in determining the vascular mechanic [4], consists of several "musculo-elastic fascicle" [36] or medial lamellar unit [37]. Each one consists of elastin sheet, collagen fibers and vascular smooth muscle cells (VSM) oriented circumferentially [37–41]. They are pulled simultaneously in the circumferential direction as the aortic pressure increases. Therefore, a phenomenological model of the aortic wall was accordingly established as a two-parallel spring model [5, 11].
The passive elastic behavior of the aortic wall is mainly influenced by the elastin and collagen fibers since VSMs are totally relaxed [5–9, 42, 43]. We can therefore express the elastic modulus, E, of the aortic wall from the parallel action of the elastin and collagen fibers as follows [5, 7, 11, 42, 44, 45]:
| (5) |
where Eelastinand Ecoll are the Young's moduli of elastin and collagen fibers, respectively and. Velastin and Vcoll are volume fractions of elastin and collagen fibers, and fcoll,engage is the percentage of the actively engaged collagen fibers [5–7].
Figure 3B shows a typical stress-strain relationship obtained in a normal mouse. A transition point can be clearly observed, after which the slope of the stress-strain relationship is significantly increased, i.e., by 1.5 to 3 times (Table 1). We thus define the transition strain, , as the strain where the collagen fibers start engaging. In our study, the transition from elastin to collagen activation was expressed in terms of strain due to the fact that pressure was shown to have non-significant effect on the strain level of the transition (Appendix A). was defined as the minimum of the radial aortic wall acceleration (Appendix B). The two-slope was confirmed by plotting the normalized derivative of the circumferential stress with respect to the circumferential strain against the circumferential stress according to the method by Tanaka and Fung (1974) [46, 47] (Figure 3C). A clear discontinuity of the slope of the circumferential stress-strain curve was observed, separated into two slopes, E1 and E2, which corresponded to two values of the wall elastic modulus. E1 and E2 were hypothesized to be the results of elastin and contribution by elastin-collagen, respectively.
Table. 1.
Transition strain , Young's moduli of E1, E2 and E3 in the Group 1 (normal aortas)
| Mouse | (−) | E1 (kPa) | E2 (kPa) | E3 (kPa) | HR (bpm) |
|---|---|---|---|---|---|
| 1 | 0.031±0.006 | 93.6±20.0 | 229.2±46.7 | 135.7±30.3 | 465 |
| 2 | 0.030±0.004 | 46.3±6.9 | 146.0±10.1 | 99.7±8.4 | 444 |
| 3 | 0.036±0.011 | 73.5±13.8 | 196.8±18.5 | 123.3±16.4 | 409 |
| 4 | 0.018±0.004 | 78.5±15.0 | 319.3±47.4 | 240.7±38.3 | 438 |
| 5 | 0.029±0.006 | 56.6±10.2 | 181.0±22.9 | 124.4±14.7 | 481 |
| Average | 0.029±0.006 | 69.7±18.6 | 214.5±65.8 | 144.8±55.2 | 447.4±27.5 |
Data are presented as mean ± standard deviation over N locations in each mouse and over five mice in the bottom row. Values for E1, E2, and E3 are given in kilopascal. Heart rates (HR) are given in beats per minute.
However, Velastin, Vcoll and fcoll,engage were not known in vivo. The recoil and resilience of the aorta depended on the specific architectures of its elastic lamella [37, 48], which consisted of randomly arranged chains of elastin [49]. We therefore defined, E1 and E2 representing the Young’s modulus of the elastic lamellae and elastin-collagen fibers, respectively.
Before the transition strain , the elastic lamella were dilated up to a certain point and the stress-strain relationship was as follow,
| (6) |
After the transition strain , both the elastic lamellae and engaged collagen fibers equally contributed to the higher elastic modulus defined as E2.
| (7) |
where E3 is equal to . At each longitudinal location, the first two Young's moduli, E1 and E2, were assessed using linear curve fitting as in Eqs. (6 and 7). E3, which is expected to correspond mainly to collagen fibers, was then estimated as follows
| (8) |
The schematic drawing of the two-parallel spring model is shown in Figure 3A. The piecewise-linear stress-strain relationship was expressed as results of two linear elastic materials, namely, the elastic lamellae and collagen fibers. Therefore, three Young's moduli were evaluated in vivo: (1) elastic lamellae (E1), (2) elastin-collagen fibers (E2) and (3) collagen fibers (E3). Noted that, the three Young’s moduli are the mechanical properties corresponded to a certain structural appearance of elastin and collagen fibers at the given conditions, i.e., normal and AngII-treated aortas.
3. Results
The stress-strain relationships of the abdominal aortic walls were assessed in normal (Group 1) and AngII-treated (Group 2) mouse aortas.
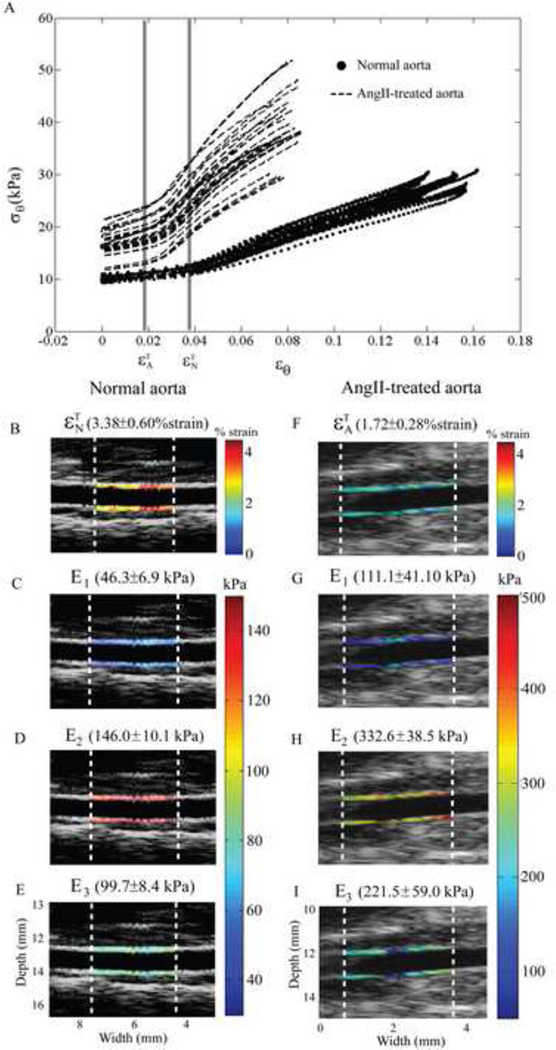
For Group 1, Figure 4A (dot lines) shows the variations of circumferential stress and strain of a normal aorta along the N longitudinal locations in the selected region. The circumferential stress gradually increases until it reaches a transition strain, , beyond which the stress increases dramatically.
Figure 4.
(A) The stress-strain relationship of a normal aorta (dot lines) with N=34 longitudinal locations, and those of an AngII-treated aorta (dash lines) with N=33 longitudinal locations. (B–E). The transition strain of the normal and AngII-treated aorta are and , respectively. Left column shows the local calculated parameters of the normal aorta, same mouse as the blue dots in Figure 4A, mapped on the aortic wall, i.e., , E1, E2 and E3. (E–H) Right column shows those calculated parameters of the AngII-treated aorta, same mouse as the red dots in Figure 4A.
For Group 2, the stress-strain relationship along N longitudinal locations of an AngII-treated aorta is shown in Figure 4A (dash lines). Although the similar trend as Group 1 is noted, the transition strain (means±std) of the AngII-treated aorta occurs at a lower strain level than the normal one , i.e., 1.18±0.36 % strain and 2.86±0.63 % strain at a p-value<0.001, respectively. The three Young's moduli of the AngII-treated aorta are significantly higher than those of the normal aorta, with p<0.001.
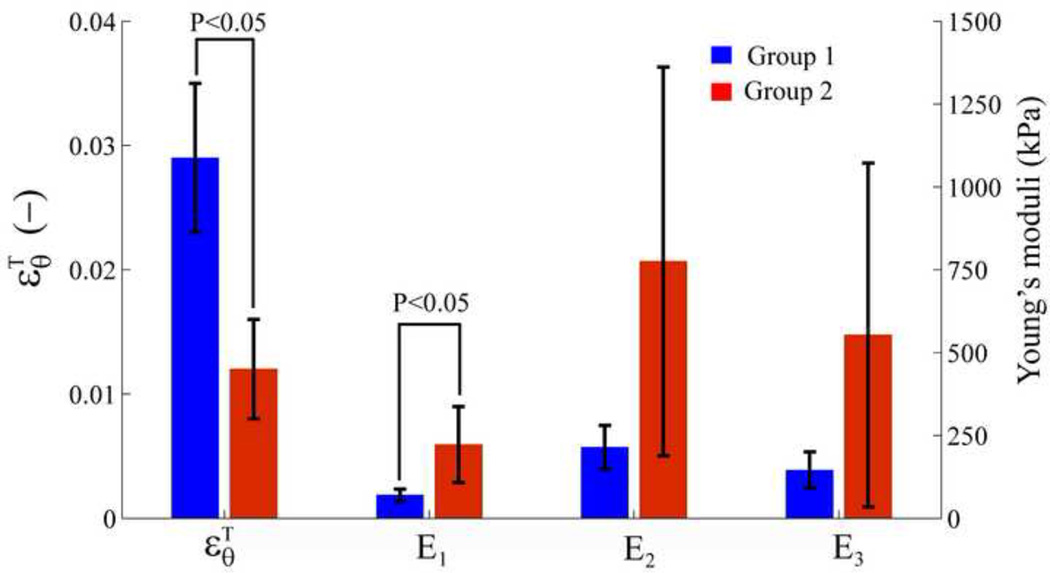
, E1, E2 and E3 (means±std) for each mouse were determined using Eqs. (6) to (8), arranged over N longitudinal locations as shown in Table 1 (Group 1) and Table 2 (Group 2). The comparison between Group 1 (Table 1) and Group 2 (Table 2) averagely over five mice is presented in Figure 5.
Table. 2.
Transition strain , Young's moduli of E1, E2 and E3 in the Group 2 (AngII-treated aortas)
| Mouse | (−) | E1 (kPa) | E2 (kPa) | E3 (kPa) | HR (bpm) |
|---|---|---|---|---|---|
| 6 | 0.009±0.004 | 352.0±250.0 | 611.6±384.8 | 259.6±150.3 | 530 |
| 7 | 0.013±0.007 | 143.5±87.6 | 356.2±59.0 | 212.7±140.8 | 288 |
| 8 | 0.008±0.005 | 340.0±168.7 | 1,763.0±970.2 | 1,423.0±879.4 | 431 |
| 9 | 0.012±0.003 | 163.8±53.3 | 811.4±134.7 | 647.7±102.1 | 418 |
| 10 | 0.017±0.003 | 111.1±41.0 | 332.6±38.5 | 221.5±59.0 | 424 |
| Average | 0.012±0.004 | 222.1±114.8 | 775.0±586.4 | 552.9±519.1 | 418.2±86.1 |
Data are presented as mean ± standard deviation over N locations in each mouse and over five mice in the bottom row. Values for E1, E2, and E3 are given in kilopascal. Heart rates (HR) are given in beats per minute.
Figure 5.
Comparison of , E1, E2 and E3 (mean±std) between Group 1 (normal aortas) and Group 2 (AngII-treated aortas) over five mice for each case.
According to our methodology, the transition strain and three Young's moduli of normal and AngII-treated aortas are locally mapped on the longitudinal locations as shown in left and right column of Figure 4, respectively, corresponding to the stress-strain relationships in Figure 4A. We can thus locally visualize the alterations of the aortic wall stress-strain relationship in both normal and AngII-treated aortas (Figure 4B–E and Figure 4F–I).
4. Discussion
This study aims at the development of a simple tool for the in vivo measurement of aortic wall stress-strain relationship. Both the stress and strain have to be measured in order to quantitatively determine the stress-strain relationship. The stress measurement requires knowledge on the intravascular pressure, which can be obtained using catheterization procedures for invasive, intravascular measurement. Our study proposed to measure only the wall strain obtained noninvasively using ultrasound-based method. Even though the wall deformation does not provide quantitative stress values, the general trend of the stress-strain behavior can be estimated by applying different, previously acquired, pressure waveforms (Appendix A). Most importantly, this allowed identification of the transition in the strain from elastin to collagen engagement. This transition in the strain was different between normal and pathological (i.e., AngII) cases. Therefore, the transition strain represented an interesting parameter that was directly related to the underlying physiological structures of the aortic wall.
The transition strain of the normal aortic wall stress-strain relationship was first measured in vivo under physiologic conditions, indicating the influence of elastin and collagen on the wall mechanical behavior. In order to modify the composition of these wall constituents, an AngII treatment was used. AngII has been reported as an effective agent for the abdominal aortic aneurysm (AAA) model, which induces changes in the aortic wall properties and increases the blood pressure [31, 33]. The associated decrease in elastin, forming of collagen fibers and degradation of elastic lamellae were reported as a result of the AngII administration [31, 33]. Our results showed that the change in elastin and collagen yielded the change in aortic stiffness as depicted in Figure 4A. The first slope (i.e., at low strains) of the stress-strain relationship reflected the elastin action. Since the elastin was partially degraded, it represented fissures in the internal elastic membrane with evident re-duplication and re-orientation of the elastin fibers [32]. As a consequence, in the AngII case, the collagen would start engaging at lower wall deformations, causing the transition strain to appear at a lower strain level in the AngII case relatively to the normal case, i.e, 0.012±0.004 and 0.029±0.006 as Table 1 and 2, respectively.
After the transition strain was defined, the three Young’s moduli were estimated. E2 was the highest (Figure 5) due to the contribution of both elastic lamella and collagen fibers. E3 (collagen engagement modulus) was twice time higher than E1 (elastic lamellae modulus), which was in agreement with previous reports, where the elastic modulus of collagen was significantly higher than that of the elastin [14]. E3 corresponded to the collagen fiber engagement in vivo. Only one slope change of the stress-strain curve beyond the transition strain was observed. We thus hypothesized that a number of activated collagen fibers became engaged after the transition and the subsequent activated collagen fibers had lower stiffness compared to the previously activated collagen fibers. The stress-strain relationship after the transition strain was thus approximated as a linear response including the action of fcoll,engage. All three Young's moduli of Group 2 were found significantly three times higher than Group 1, shown in Table 1 and Table 2, as a consequence of AngII treatment following previous studies [32].
For the purposes of this study, given the extreme difficulty in the catheterization of the abdominal aorta in a mouse, the aortic pressure waveform was measured in a different mouse from those used in the aortic wall deformation estimation. The difference in heart rate, respiratory rate and other physiologic factors would, however, influence the stress-strain relationship. It is impossible to obtain the actual aortic pressure in vivo because of the presence of the catheter in the lumen that affects the flow and subsequently the pressure experienced by the wall. It may also affect the values of the Young's moduli. Therefore, the three Young’s moduli in this study are not necessarily the exact reference values of the aortic wall mechanical properties. They still represented, however, the trend of aortic wall stiffness which varied with the change in the wall constituents. The pressure waveform did not significantly affect the trend of the stress-strain relationship. As in appendix A, the contribution of the elastin and collagen, i.e., the transition strain, occurred at the same strain level regardless of the pressure waveform. Therefore, the aortic wall displacement, as obtained from our noninvasive ultrasound-based method, was considered to be sufficient in identifying the transition strain as shown in appendix B.
Therefore, one important conclusion from our study is that the transition strain can serve as a clinically relevant parameter that can be obtained noninvasively using ultrasound-based motion estimation techniques. The proposed methodology using the transition strain has the following advantages; the transition strain was shown to be 1) pressure-independent, hence it can be easily measured noninvasively and 2) significantly correlated with the underlying structure and overall health of the aortic wall.
Regarding alternative techniques, Intravascular Ultrasound (IVUS) [13, 50] has also been employed to monitor the wall deformation. However, it constitutes invasive method and cannot always be used diagnostically. Our noninvasive imaging technique was capable of detecting the aortic wall deformation at every longitudinal location in a single scan [30]. As shown in Figure 4(B–I), we can observe the variation of the transition strain and Young's moduli along the aortic wall.
The proposed methodology is thus simple and provides the basic mechanical properties of the abdominal aortic wall by taking into account the influence of different constituents. However, there are certain limitations associated with the assumptions and experimental constraints used. First, the aorta is surrounded by perivascular tissue involving boundary conditions impossible to consider [13]. The motion and deformation of the aortic wall are caused by both extravascular and intravascular pressures. However, the extravascular pressure cannot be measured in vivo and was assumed to be zero. Moreover, the passive behavior of the aortic wall may be affected by the surrounding tissues, which have been ignored in the model used in this study [11]. Second, our method is limited by the lack of consideration of the wall viscosity and anisotropy. The viscosity of the aortic wall was not taken into account. However, the viscosity would affect the time delay between the pressure and the aortic wall motion, not the stress-strain relationship. Regarding the histological configuration, the aortic wall was previously assumed to be anisotropic [13, 22, 41, 46, 51–57]. In this paper, we defined the wall as an isotropic cylinder since only the circumferential strain was estimated. Therefore, the estimated Young's moduli reported in this paper approximated only the non-viscous, isotropic, elastic properties of the aorta. The proposed method could be expanded to include the viscoelastic and anisotropic properties of the wall. Viscoelastic properties of the aortic wall can be studied in the future by investigating the entire cardiac cycle, and select a suitable model to estimate viscoelastic parameters. Anisotropy of the wall could be evaluated by measuring radial and longitudinal strains. The study can also be repeated over a larger sample of animals to obtain the specificity and sensitivity of the proposed methodology in various types of pathologies.
5. Conclusion
In this study, we investigated the local, passive stress-strain relationship of the abdominal aortic wall in vivo. The aortic diameter variation of the murine abdominal aorta was obtained by applying a 1-D cross-correlation technique on the ultrasound RF signals at the very high frame rate of 8 kHz. The transition of the circumferential stress-strain relationship was hypothesized to indicate the change from elastin to collagen engagement. In summary, in this paper, 1) the stress-strain behavior was determined locally in vivo, 2) the contribution of elastin and collagen, i.e., before and after the transition strain, was first observed on the stress-strain relationship in vivo under normal physiologic conditions and 3) the transition strain can be an indirect measurement on the structure and health of the aortic wall, estimated noninvasively using the ultrasound-based method. Our method represents thus a simple way for mapping the aortic modulus in 2D and determines the local stress-strain relationship for detecting and monitoring vascular disease in vivo.
Acknowledgments
This study was supported in part by the National Institutes of Health (R01EB006042), the Fulbright Association and the Royal Golden Jubilee Scholarship (1.M.CM/47/A.2) under Thailand Research Fund. The authors are grateful to Kana Fujikura, M.D. Ph.D., from Columbia University and Jawad Latif, M.D., from St. Luke's-Roosevelt Hospital Center, for conducting the experiments. The authors also wish to thank Jean Provost, M.S., Wei-Ning Lee, Ph.D., Columbia University and Phrut Sakulchangsatjatai, Ph.D., Chiang Mai University, for all helpful discussions.
Appendix A
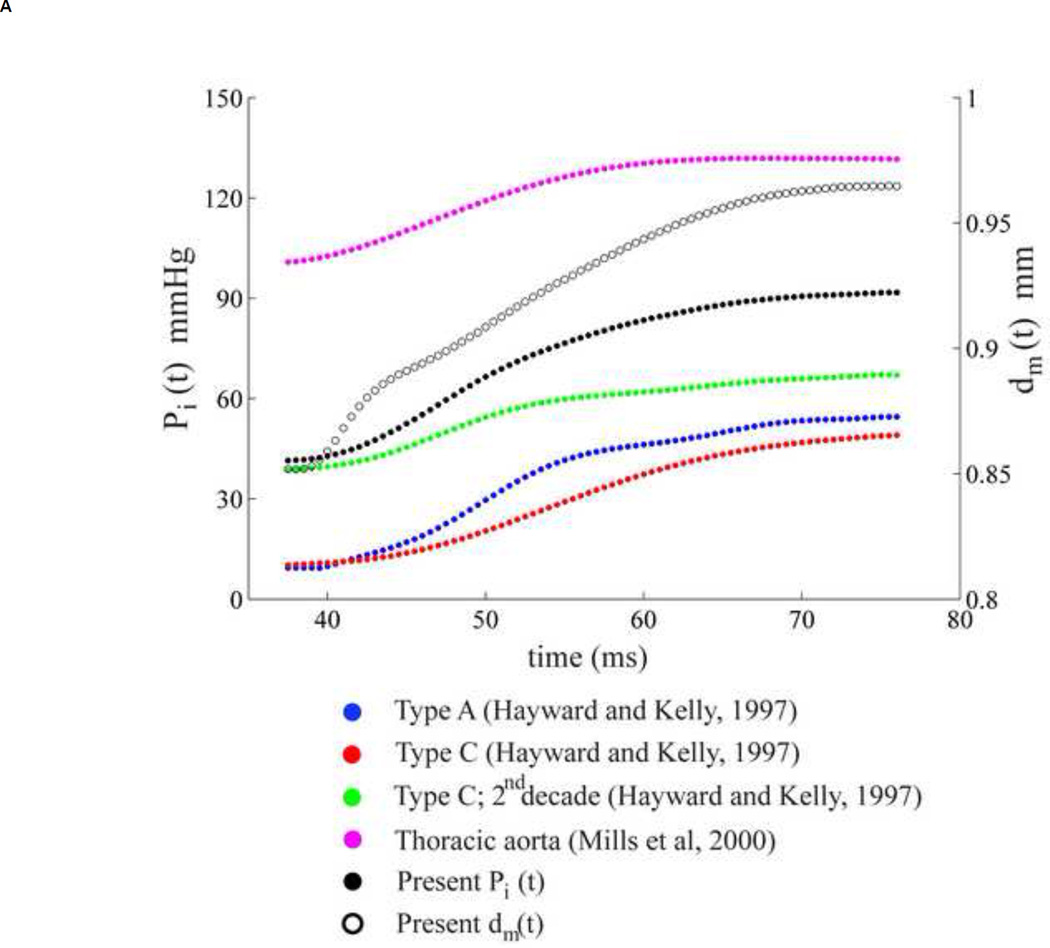
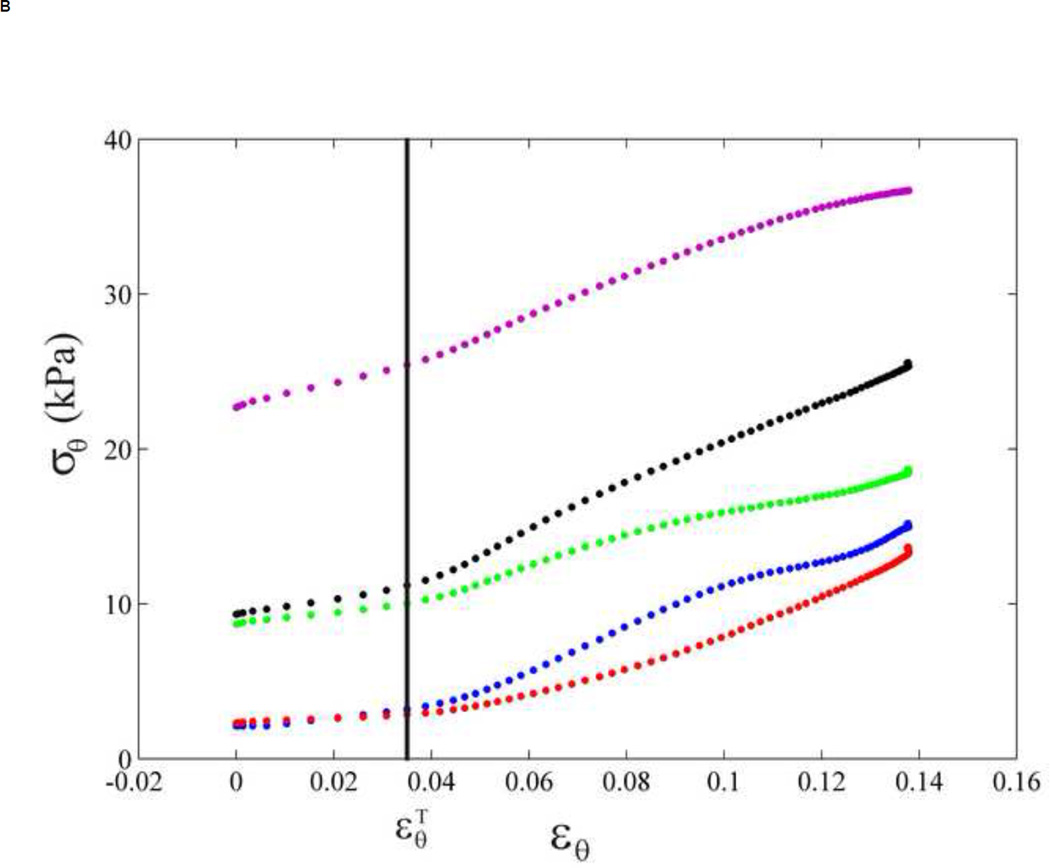
In order to determine the pressure dependence, four different aortic pressure waveforms were considered from previous studies [58, 59]. For each case, only the pressure in the systolic phase was chosen and applied to our displacement data using the same procedure in the method section. The change in the aortic pressure and aortic mean diameter (black empty dots, location referred to Figure 2A) were plotted in Figure 6A. The corresponding stress-strain relationship and transition regions are shown in Figure 6B. The similar trend of stress-strain curve was found in every case, i.e., contribution of two-linear relationship. The slopes of the stress-strain relationship before and after the transition strain are different among each case, indicating the magnitude difference of the Young's moduli, not the relationship. The transition strains appear at the same strain level in every type of pressure waveform as shown in Figure 6B. For our study, the displacement or strain of the aortic wall plays a dominant role in the transition from elastin to collagen fibers. The transition strain was thus concluded to be pressure-waveform independent.
Figure 6.
(A) Five aortic pressure waveforms (four were traced from the previous studies [58, 59] and one from our measurement) and one mean diameter of the abdominal aortic wall over systolic phase. (B) Stress-strain relationships are determined from five aortic pressures and the same mean diameter corresponding to Figure 6A, each color refers to its stress-strain relationship. Blue, red, green, purple and black refer to aortic pressure waveform of Type A [58], Type C [58], Type C (2nd decade) [58], Thoracic aorta [59] and the present data, respectively as in Figure 6A. The transition strain are expressed by a vertical line.
Appendix B
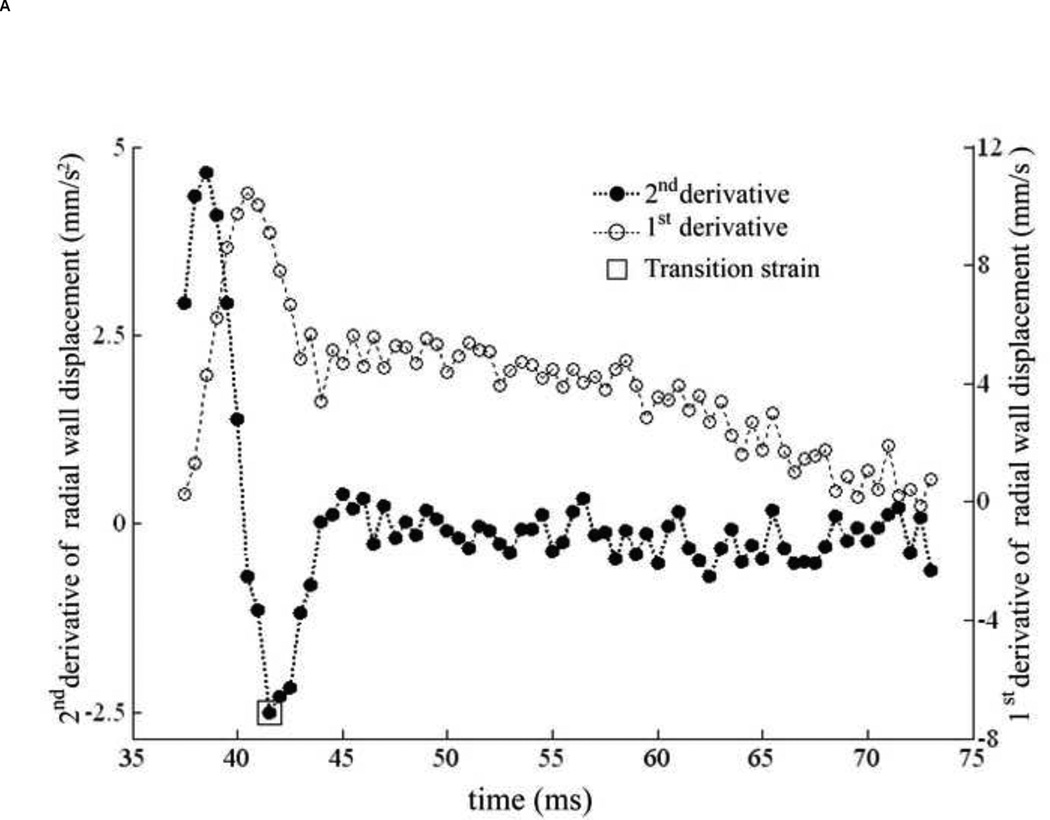
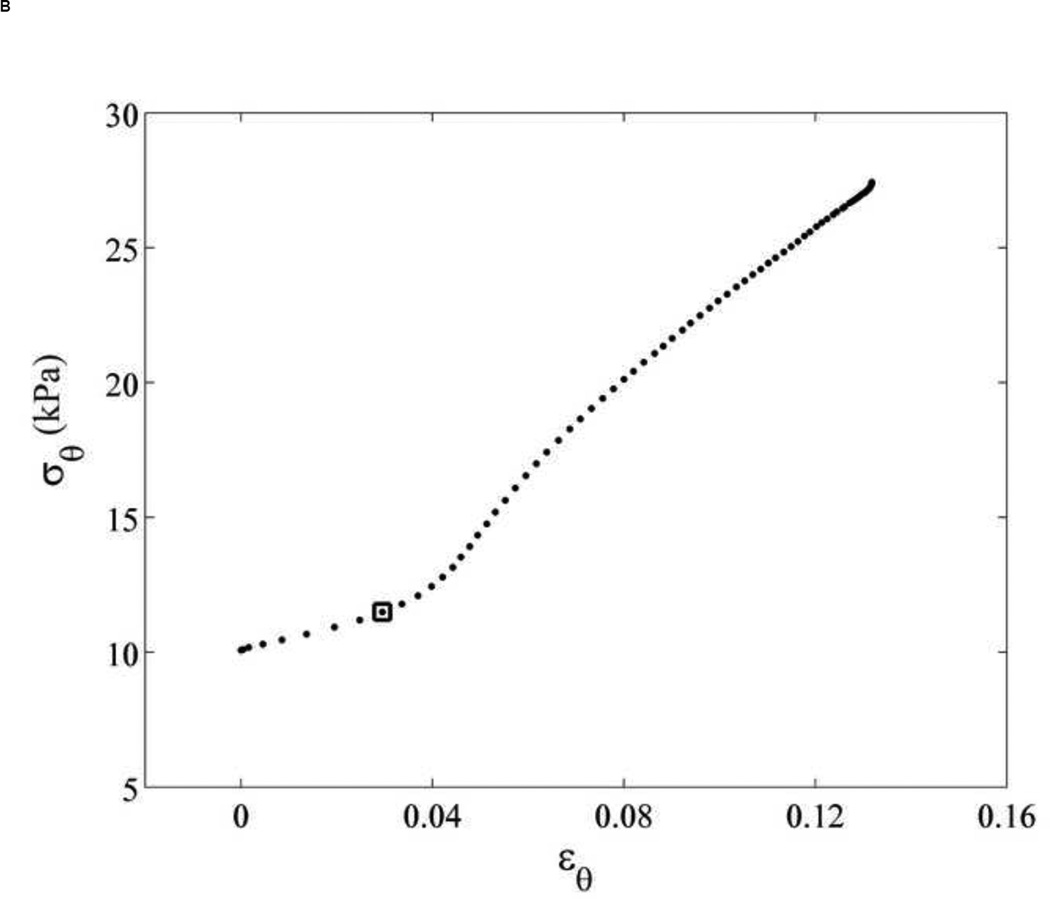
The transition strain (Appendix A) can be identified using only the aortic wall displacement. The transition strain was assumed as the strain, at which collagen starts engaging, which was defined as the 'knee' of the stress-strain curve expressed as linear function. The transition strain was found to occur at the minimum of the plot of the second derivative of the aortic wall displacement as shown in Figure 7A, and was mapped on the corresponding stress-strain relationship as in Figure 7B. For our study, we thus chose this value to be the transition strain for the Young’s moduli calculation using Eqs. (6), (7) and (8).
Figure 7.
(A) The 1st (empty dots) and 2nd (black dots) derivative of aortic wall displacement over systolic phase of cardiac cycle. The transition strain is defined as the minimum of 2nd derivative as shown by empty square. (B) The transition strain (square), corresponding to Figure 7A, is mapped on its stress-strain relationship.
Footnotes
Publisher's Disclaimer: This is a PDF file of an unedited manuscript that has been accepted for publication. As a service to our customers we are providing this early version of the manuscript. The manuscript will undergo copyediting, typesetting, and review of the resulting proof before it is published in its final citable form. Please note that during the production process errors may be discovered which could affect the content, and all legal disclaimers that apply to the journal pertain.
References
- 1.Hall AJ, Busse EFG, McCarville DJ, Burgess JJ. Aortic Wall Tension as a Predictive Factor for Abdominal Aortic Aneurysm Rupture: Improving the Selection of Patients for Abdominal Aortic Aneurysm Repair. Annals of Vascular Surgery. 2000;14:152–157. doi: 10.1007/s100169910027. [DOI] [PubMed] [Google Scholar]
- 2.O'Rourke MF, Staessen JA, Vlachopoulos C, Duprez D, Plante GeE. Clinical applications of arterial stiffness; definitions and reference values. Am J Hypertens. 2002;15:426–444. doi: 10.1016/s0895-7061(01)02319-6. [DOI] [PubMed] [Google Scholar]
- 3.Van Bortel LM. Is arterial stiffness ready for daily clinical practice. Journal of Hypertension. 2006;24:281–283. doi: 10.1097/01.hjh.0000199805.03058.78. [DOI] [PubMed] [Google Scholar]
- 4.Nichols WW, O'Rourke MF. McDonald's blood flow in arteries : theoretical, experimental, and clinical principles. 5 ed. London: A Hodder Arnold Publication; 2005. pp. 67–76. [Google Scholar]
- 5.Armentano RL, Levenson J, Barra JG, Fischer EI, Breitbart GJ, Pichel RH, Simon A. Assessment of elastin and collagen contribution to aortic elasticity in conscious dogs. Am J Physiol Heart Circ Physiol. 1991;260:H1870–H1877. doi: 10.1152/ajpheart.1991.260.6.H1870. [DOI] [PubMed] [Google Scholar]
- 6.Armentano RL, Barra JG, Levenson J, Simon A, Pichel RH. Arterial Wall Mechanics in Conscious Dogs : Assessment of Viscous, Inertial, and Elastic Moduli to Characterize Aortic Wall Behavior. Circ Res. 1995;76:468–478. doi: 10.1161/01.res.76.3.468. [DOI] [PubMed] [Google Scholar]
- 7.Barra JG, Armentano RL, Levenson J, Fischer EI, Pichel RH, Simon A. Assessment of smooth muscle contribution to descending thoracic aortic elastic mechanics in conscious dogs. Circ Res. 1993;73:1040–1050. doi: 10.1161/01.res.73.6.1040. [DOI] [PubMed] [Google Scholar]
- 8.Zulliger MAMA, Fridez P, Hayashi K, Stergiopulos N. A strain energy function for arteries accounting for wall composition and structure. Journal of Biomechanics. 2004;37:989–1000. doi: 10.1016/j.jbiomech.2003.11.026. [DOI] [PubMed] [Google Scholar]
- 9.Fonck E, Prod'hom G, Roy S, Augsburger L, Rufenacht DA, Stergiopulos N. Effect of elastin degradation on carotid wall mechanics as assessed by a constituent-based biomechanical model. Am J Physiol Heart Circ Physiol. 2007;292:H2754–H2763. doi: 10.1152/ajpheart.01108.2006. [DOI] [PubMed] [Google Scholar]
- 10.Wells SM, Langille BL, Lee JM, Adamson SL. Determinants of mechanical properties in the developing ovine thoracic aorta. Am J Physiol Heart Circ Physiol. 1999;277:H1385–H1391. doi: 10.1152/ajpheart.1999.277.4.H1385. [DOI] [PubMed] [Google Scholar]
- 11.Cox RH. Passive mechanics and connective tissue composition of canine arteries. Am J Physiol Heart Circ Physiol. 1978;234:H533–H541. doi: 10.1152/ajpheart.1978.234.5.H533. [DOI] [PubMed] [Google Scholar]
- 12.Cox RH. Comparison of arterial wall mechanics in normotensive and spontaneously hypertensive rats. Am J Physiol Heart Circ Physiol. 1979;237:H159–H167. doi: 10.1152/ajpheart.1979.237.2.H159. [DOI] [PubMed] [Google Scholar]
- 13.Humphrey JD. Cardiovascular solid mechanics : cells, tissues, and organs. New York: Springer; 2002. pp. 259–318. [Google Scholar]
- 14.Fung Y-c. Biomechanics : mechanical properties of living tissues. New York, NY;Berlin [u.a.]: Springer; 1993. pp. 243–295. [Google Scholar]
- 15.Vito RP, Dixon SA. BLOOD VESSEL CONSTITUTIVE MODELS-1995–2002. Annual Review of Biomedical Engineering. 2003;5:413–439. doi: 10.1146/annurev.bioeng.5.011303.120719. [DOI] [PubMed] [Google Scholar]
- 16.Angouras D, Sokolis DP, Dosios T, Kostomitsopoulos N, Boudoulas H, Skalkeas G, Karayannacos PE. Effect of impaired vasa vasorum flow on the structure and mechanics of the thoracic aorta: implications for the pathogenesis of aortic dissection. Eur J Cardiothorac Surg. 2000;17:468–473. doi: 10.1016/s1010-7940(00)00382-1. [DOI] [PubMed] [Google Scholar]
- 17.Nili N, Zhang M, Strauss BH, Bendeck MP. Biochemical analysis of collagen and elastin synthesis in the balloon injured rat carotid artery. Cardiovascular Pathology. 2002;11:272–276. doi: 10.1016/s1054-8807(02)00119-9. [DOI] [PubMed] [Google Scholar]
- 18.Holzapfel GA, Gasser TC. A viscoelastic model for fiber-reinforced composites at finite strains: Continuum basis, computational aspects and applications. Computer Methods in Applied Mechanics and Engineering. 2001;190:4379–4403. [Google Scholar]
- 19.Gundiah N, Ratcliffe MB, Pruitt LA. Determination of strain energy function for arterial elastin: Experiments using histology and mechanical tests. Journal of Biomechanics. 2007;40:586–594. doi: 10.1016/j.jbiomech.2006.02.004. [DOI] [PubMed] [Google Scholar]
- 20.Lacolley P, Labat C, Pujol A, Delcayre C, Benetos A, Safar M. Increased Carotid Wall Elastic Modulus and Fibronectin in Aldosterone-Salt-Treated Rats: Effects of Eplerenone. Circulation. 2002;106:2848–2853. doi: 10.1161/01.cir.0000039328.33137.6c. [DOI] [PubMed] [Google Scholar]
- 21.Marque V, Kieffer P, Gayraud B, Lartaud-Idjouadiene I, Ramirez F, Atkinson J. Aortic Wall Mechanics and Composition in a Transgenic Mouse Model of Marfan Syndrome. Arterioscler Thromb Vasc Biol. 2001;21:1184–1189. doi: 10.1161/hq0701.092136. [DOI] [PubMed] [Google Scholar]
- 22.Stålhand J, Klarbring A, Karlsson M. Towards in vivo aorta material identification and stress estimation. Biomechanics and Modeling in Mechanobiology. 2004;2:169–186. doi: 10.1007/s10237-003-0038-z. [DOI] [PubMed] [Google Scholar]
- 23.Storkholm JH, FrØbert O, Gregersen H. Static elastic wall properties of the abdominal porcine aorta in vitro and in vivo. European Journal of Vascular and Endovascular Surgery. 1997;13:31–36. doi: 10.1016/s1078-5884(97)80047-0. [DOI] [PubMed] [Google Scholar]
- 24.Kemmotsu O, Ueda M, Otsuka H, Yamamura T, Winter DC, Eckerle JS. Arterial Tonometry for Noninvasive, Continuous Blood Pressure Monitoring during Anesthesia. Anesthesiology. 1991;75:333–340. doi: 10.1097/00000542-199108000-00023. [DOI] [PubMed] [Google Scholar]
- 25.Sato T, Nishinaga M, Kawamoto A, Ozawa T, Takatsuji H. Accuracy of a continuous blood pressure monitor based on arterial tonometry. Hypertension. 1993;21:866–874. doi: 10.1161/01.hyp.21.6.866. [DOI] [PubMed] [Google Scholar]
- 26.Stefanadis C, Stratos C, Vlachopoulos C, Marakas S, Boudoulas H, Kallikazaros I, Tsiamis E, Toutouzas K, Sioros L, Toutouzas P. Pressure-Diameter Relation of the Human Aorta : A New Method of Determination by the Application of a Special Ultrasonic Dimension Catheter. Circulation. 1995;92:2210–2219. doi: 10.1161/01.cir.92.8.2210. [DOI] [PubMed] [Google Scholar]
- 27.Mackenzie IS, Wilkinson IB, Cockcroft JR. Assessment of arterial stiffness in clinical practice. QJM. 2002;95:67–74. doi: 10.1093/qjmed/95.2.67. [DOI] [PubMed] [Google Scholar]
- 28.Laurent S, Cockcroft J, Van Bortel L, Boutouyrie P, Giannattasio C, Hayoz D, Pannier B, Vlachopoulos C, Wilkinson I, Struijker-Boudier H A. on behalf of the European Network for Non-invasive Investigation of Large. Expert consensus document on arterial stiffness: methodological issues and clinical applications. Eur Heart J. 2006;27:2588–2605. doi: 10.1093/eurheartj/ehl254. [DOI] [PubMed] [Google Scholar]
- 29.Fujikura K, Luo JW, Gamarnik V, Pernot M, Fukumoto R, Tilson MD, Konofagou EE. A novel noninvasive technique for pulse-wave Imaging and characterization of clinically-significant vascular mechanical properties in vivo. Ultrasonic Imaging. 2007 Jul;29:137–154. doi: 10.1177/016173460702900301. [DOI] [PubMed] [Google Scholar]
- 30.Luo J, Fujikura K, Tyrie LS, Tilson MD, Konofagou EE. Pulse Wave Imaging of Normal and Aneurysmal Abdominal Aortas In Vivo. Medical Imaging, IEEE Transactions on. 2009;28:477–486. doi: 10.1109/TMI.2008.928179. [DOI] [PubMed] [Google Scholar]
- 31.Daugherty A, Cassis LA. Mouse Models of Abdominal Aortic Aneurysms. Arterioscler Thromb Vasc Biol. 2004 Mar 1;24:429–434. doi: 10.1161/01.ATV.0000118013.72016.ea. [DOI] [PubMed] [Google Scholar]
- 32.Tham DM, Martin-McNulty B, Wang Y-X, Da Cunha V, Wilson DW, Athanassious CN, Powers AF, Sullivan ME, Rutledge JC. Angiotensin II injures the arterial wall causing increased aortic stiffening in apolipoprotein E-deficient mice. Am J Physiol Regul Integr Comp Physiol. 2002 Dec 1;283:R1442–R1449. doi: 10.1152/ajpregu.00295.2002. [DOI] [PubMed] [Google Scholar]
- 33.Manning MW, Cassis LA, Huang J, Szilvassy SJ, Daugherty A. Abdominal aortic aneurysms: fresh insights from a novel animal model of the disease. Vascular Medicine. 2002 Feb 1;7:45–54. doi: 10.1191/1358863x02vm413ra. [DOI] [PubMed] [Google Scholar]
- 34.Hartley CJ, Taffet GE, Michael LH, Pham TT, Entman ML. Noninvasive determination of pulse-wave velocity in mice. 1997;273:H494–H500. doi: 10.1152/ajpheart.1997.273.1.H494. [DOI] [PubMed] [Google Scholar]
- 35.Saada AS. Elasticity: Theory and Applications. New York: Pergamon Press; 1974. [Google Scholar]
- 36.Clark JM, Glagov S. Transmural organization of the arterial media. The lamellar unit revisited. Arterioscler Thromb Vasc Biol. 1985;5:19–34. doi: 10.1161/01.atv.5.1.19. [DOI] [PubMed] [Google Scholar]
- 37.O'Connell MK, Murthy S, Phan S, Xu C, Buchanan J, Spilker R, Dalman RL, Zarins CK, Denk W, Taylor CA. The three-dimensional micro- and nanostructure of the aortic medial lamellar unit measured using 3D confocal and electron microscopy imaging. Matrix Biology. 2008;27:171–181. doi: 10.1016/j.matbio.2007.10.008. [DOI] [PMC free article] [PubMed] [Google Scholar]
- 38.Koert PTJHLAEB, Dingemans P. Extracellular matrix of the human aortic media: An ultrastructural histochemical and immunohistochemical study of the adult aortic media. The Anatomical Record. 2000;258:1–14. doi: 10.1002/(SICI)1097-0185(20000101)258:1<1::AID-AR1>3.0.CO;2-7. [DOI] [PubMed] [Google Scholar]
- 39.Driessen NJB, Wilson W, Bouten CVC, Baaijens FPT. A computational model for collagen fibre remodelling in the arterial wall. Journal of Theoretical Biology. 2004;226:53–64. doi: 10.1016/j.jtbi.2003.08.004. [DOI] [PubMed] [Google Scholar]
- 40.Finlay HM, McCullough L, Canham PB. Three-Dimensional Collagen Organization of Human Brain Arteries at Different Transmural Pressures. Journal of Vascular Research. 1995;32:301–312. doi: 10.1159/000159104. [DOI] [PubMed] [Google Scholar]
- 41.Gasser TC, Ogden RW, Holzapfel GA. Hyperelastic modelling of arterial layers with distributed collagen fibre orientations. Journal of The Royal Society Interface. 2006;3:15–35. doi: 10.1098/rsif.2005.0073. [DOI] [PMC free article] [PubMed] [Google Scholar]
- 42.Cox RH. Viscoelastic properties of canine pulmonary arteries. Am J Physiol Heart Circ Physiol. 1984;246:H90–H96. doi: 10.1152/ajpheart.1984.246.1.H90. [DOI] [PubMed] [Google Scholar]
- 43.Wolinsky H, Glagov S. Structural Basis for the Static Mechanical Properties of the Aortic Media. Circ Res. 1964;14:400–413. doi: 10.1161/01.res.14.5.400. [DOI] [PubMed] [Google Scholar]
- 44.Roy S, Tsamis A, Prod'hom G, Stergiopulos N. On the in-series and in-parallel contribution of elastin assessed by a structure-based biomechanical model of the arterial wall. Journal of Biomechanics. 2008;41:737–743. doi: 10.1016/j.jbiomech.2007.11.025. [DOI] [PubMed] [Google Scholar]
- 45.VanBavel E, Siersma P, Spaan JAE. Elasticity of passive blood vessels: a new concept. Am J Physiol Heart Circ Physiol. 2003;285:H1986–H2000. doi: 10.1152/ajpheart.00248.2003. [DOI] [PubMed] [Google Scholar]
- 46.Tanaka TT, Fung Y-C. Elastic and inelastic properties of the canine aorta and their variation along the aortic tree. Journal of Biomechanics. 1974;7:357–370. doi: 10.1016/0021-9290(74)90031-1. [DOI] [PubMed] [Google Scholar]
- 47.Fung YC. Elasticity of soft tissues in simple elongation. Am J Physiol. 1967;213:1532–1544. doi: 10.1152/ajplegacy.1967.213.6.1532. [DOI] [PubMed] [Google Scholar]
- 48.Kielty CM. Elastic fibres in health and disease. Expert Reviews in Molecular Medicine. 2006;8:1–23. doi: 10.1017/S146239940600007X. [DOI] [PubMed] [Google Scholar]
- 49.Hiroaki N. Electron microscopic study of the prenatal development of the thoracic aorta in the rat. American Journal of Anatomy. 1988;181:406–418. doi: 10.1002/aja.1001810409. [DOI] [PubMed] [Google Scholar]
- 50.Hardt SE, Just A, Bekeredjian R, Kubler W, Kirchheim HR, Kuecherer HF. Aortic pressure-diameter relationship assessed by intravascular ultrasound: experimental validation in dogs. Am J Physiol Heart Circ Physiol. 1999;276:H1078–H1085. doi: 10.1152/ajpheart.1999.276.3.H1078. [DOI] [PubMed] [Google Scholar]
- 51.Stålhand J, Klarbring A. Parameter Identification in Arteries Using Constraints. Mechanics of Biological Tissue. 2006:295–305. [Google Scholar]
- 52.von Maltzahn WW, Warriyar RG, Keitzer WF. Experimental measurements of elastic properties of media and adventitia of bovine carotid arteries. Journal of Biomechanics. 1984;17:839–847. doi: 10.1016/0021-9290(84)90142-8. [DOI] [PubMed] [Google Scholar]
- 53.Holzapfel GA. Determination of material models for arterial walls from uniaxial extension tests and histological structure. Journal of Theoretical Biology. 2006;238:290–302. doi: 10.1016/j.jtbi.2005.05.006. [DOI] [PubMed] [Google Scholar]
- 54.Hariton I, deBotton G, Gasser T, Holzapfel G. Stress-driven collagen fiber remodeling in arterial walls. Biomechanics and Modeling in Mechanobiology. 2007;6:163–175. doi: 10.1007/s10237-006-0049-7. [DOI] [PubMed] [Google Scholar]
- 55.Holzapfel G, Gasser T, Ogden R. A New Constitutive Framework for Arterial Wall Mechanics and a Comparative Study of Material Models. Journal of Elasticity. 2000;61:1–48. [Google Scholar]
- 56.Vorp DA, Rajagopal KR, Smolinski PJ, Borovetz HS. Identification of elastic properties of homogeneous, orthotropic vascular segments in distension. Journal of Biomechanics. 1995;28:501–512. doi: 10.1016/0021-9290(94)00012-s. [DOI] [PubMed] [Google Scholar]
- 57.Holzapfel GA, Weizsacker HW. Biomechanical behavior of the arterial wall and its numerical characterization. Computers in Biology and Medicine. 1998;28:377–392. doi: 10.1016/s0010-4825(98)00022-5. [DOI] [PubMed] [Google Scholar]
- 58.Hayward CS, Kelly RP. Gender-Related Differences in the Central Arterial Pressure Waveform. Journal of the American College of Cardiology. 1997;30:1863–1871. doi: 10.1016/s0735-1097(97)00378-1. [DOI] [PubMed] [Google Scholar]
- 59.Mills PA, Huetteman DA, Brockway BP, Zwiers LM, Gelsema AJM, Schwartz RS, Kramer K. A new method for measurement of blood pressure, heart rate, and activity in the mouse by radiotelemetry. J Appl Physiol. 2000 May 1;88:1537–1544. doi: 10.1152/jappl.2000.88.5.1537. [DOI] [PubMed] [Google Scholar]


