

Abstract
Background and Objectives
To investigate accuracy of magnetic resonance imaging (MRI) for measuring residual tumor size in breast cancer patients receiving neoadjuvant chemotherapy (NAC).
Methods
Ninety-eight patients were studied. Several MRI were performed during NAC for response monitoring, and the residual tumor size was measured on last MRI after completing NAC. Covariates, including age, tumor characteristics, biomarkers, NAC regimens, MRI scanners, and time from last MRI to operation, were analyzed. Univariate and Multivariate linear regression models were used to determine the predictive value of these covariates for MRI-pathology size discrepancy as the outcome measure.
Results
The mean (±SD) of the absolute difference between MRI and pathological residual tumor size was 1.0 ± 2.0 cm (range, 0–14 cm). Univariate regression analysis showed tumor type, morphology, HR status, HER2 status, and MRI scanner (1.5 T or 3.0 T) were significantly associated with MRI-pathology size discrepancy (all P < 0.05). Multivariate regression analyses demonstrated that only tumor type, tumor morphology, and biomarker status considering both HR and HER-2 were independent predictors (P = 0.0014, 0.0032, and 0.0286, respectively).
Conclusion
The accuracy of MRI in evaluating residual tumor size depends on tumor type, morphology, and biomarker status. The information may be considered in surgical planning for NAC patients.
Keywords: breast cancer, residual tumor size, MRI, neoadjuvant chemotherapy, biomarker
INTRODUCTION
Neoadjuvant chemotherapy (NAC) is the standard of care to downstage inoperable cancers, and it is increasingly being used for operable cancers to facilitate better outcomes in breast-conserving surgery [1–3]. Because of the heterogeneous nature of breast cancer, each individual patient may respond differently to NAC and an accurate assessment of residual disease is important for surgical planning. Many studies have suggested the superior role of MRI in assessing residual tumor size after NAC when compared with other modalities [4–9]. Most of these studies, however, focused on the overall accuracy not the factors that may affect the accuracy. MRI may either overestimate or underestimate the residual disease [5,10,11]. Knowing which factors may influence the diagnostic accuracy will provide important information to assist in choosing the optimal subsequent management procedures for patients undergoing NAC.
It has been shown that many factors, including the morphological response pattern (e.g., some tumors shrink concentrically, while others break apart into scattered tumor cells) [12], chemotherapeutic agents, NAC-induced reactive changes within the tumor [13], and cellular and molecular characteristics of cancer [14–22] are associated with diagnostic accuracy of MRI. In general, the accuracy of MRI is better in more aggressive tumors that are sensitive to chemotherapy, for example, triple negative tumors and HER2-postive tumors that respond well to trastuzumab-containing chemotherapy. However, the manner in which the MRI assessment of post-NAC residual disease can be used in clinical practice has not been fully established yet, and more research is still needed [7,23].
Improved knowledge about the detection accuracy of residual disease after NAC by imaging is crucial to help planning of an optimal surgery to achieve a tumor free margin. This can reduce the re-excision rate and minimize local recurrence. Of the 607 patients studied in the German Preoperative Adriamycin Docetaxel trial, more than 70% were treated by breast conservation but 21.1% of them required re-excision [24]. The result suggests that tumor characteristics and the response to NAC should be taken into account in surgical planning [24].
The clinical value of MRI is further complicated by the use of specific therapeutic agents in different studies with small subject numbers [14,25,26]. Also, since the 3.0 T scanner is widely available, there is also a question about its diagnostic performance compared to 1.5 T. A recent study has shown that the higher spatial resolution at 3 T compared to 1.5 T did not improve the detection of residual disease presenting as small tumor foci or scattered cell clusters [27].
We have established a large NAC patient cohort in which MRI monitoring has been performed. The purpose of this study is to investigate the role of multiple factors, including tumor characteristics (cellular type, morphology, and biomarker status), NAC regimens, MRI systems, and time to operation, in affecting the accuracy of MRI in measurement of residual tumor size following NAC. The diagnostic performance was commonly reported as the true-positive, true-negative, false-positive, and false-negative rates; however, this assessment method did not reflect the accuracy in determination of the tumor size or the extent of disease for surgical planning. In the present study the outcome measure of MRI diagnostic accuracy was defined as the size discrepancy measured on the last MRI after NAC and the pathological size measured from the surgical specimen. Univariate and multivariate linear regression models were applied to test the predictive values of all analyzed clinical and tumor characteristic parameters for MRI-measured tumor size accuracy.
MATERIALS AND METHODS
Subjects
This is a retrospective analysis of prospectively conducted studies approved by the Investigational Review Board of the University of California, Irvine. A total of 98 patients (28 to 82 y/o, mean 49 y/o) were identified for this study. All patients had histologically-confirmed invasive breast cancer and elected to receive NAC and serial breast MRI for response monitoring. Every subject gave written informed consent at the time of enrollment. In the retrospective review, we identified all patients studied from January 2004 to November 2010 who had a final follow-up MRI within 90 days of the definitive surgery, and had both MRI and pathological tumor size available for analysis. The mean (±SD) time from the final MRI to the operation was 36 ± 18 days (range, 3–90 days).
Biomarker Evaluation
Tumors were classified as estrogen receptor (ER) or progesterone receptor (PR) positive if immunoperoxidase staining of tumor cell nuclei ≥10%. Tumors with either ER-positive or PR-positive are hormonal receptor (HR)-positive; and tumors with both ER-negative and PR-negative are HR-negative. HER-2 was determined by immunohistochemical (IHC) and/or FISH analysis from biopsied tissue prior to NAC treatment. On IHC analysis, a score of 3+ was considered positive, and scores of 0 to 1+ negative. Patients with a score of 2+ were further examined using FISH for HER2 gene amplification. By FISH analysis, HER2 was considered positive when the HER-2 to chromosome 17 centromere ratio was above 2.0. In addition to using HR and HER2 status as independent variables, they were also combined to separate subjects into three groups: HER2-postive, HER2-negative/HR-negative (i.e., triple negative), and HER2-negative/HR-positive. The definitions used for determining ER, PR, and HER2 status in our study were based on the criteria used at the time of patient enrollment (from 2004 to 2010) by analyzing the biopsy specimen taken for the initial diagnosis, which is slightly different from the current recommendations of American Society of Clinical Oncology/College of American Pathologists (ASCO/CAP) [28,29]. Tumor grade was based on the Nottingham grading system which grades breast carcinomas by adding up scores for tubule formation, nuclear pleomorphism, and mitotic count, each of which is given 1 to 3 points. The scores for each of these three criteria are added together to give an overall final score and corresponding grade. In this study, the analysis was done to compare between low to medium grade (score of 3–7) and high grade (score of 8 and 9).
Neoadjuvant Chemotherapy Protocol
Treatment protocols were chosen by oncologists who evaluated all available clinical information of the patient (renal function, overall health, tumor type, etc.). Before 2007, patients received anthracycline regimen with doxorubicin and cyclophosphamide (AC) followed by taxane-based regimens (cremophor or albumin-bound paclitaxel and carboplatin). After 2007 the taxane-based regimen was used as the first line, with the AC regimen as optional second line. All patients with HER-2 positive cancers also received trastuzumab with taxane, and 37 women with HER-2 negative cancer also received bevacizumab. Since the main difference in the chemotherapy regimen is the use of AC or not, a two-category variable was created representing regimens containing doxorubicin and AC + taxane versus those with taxane only without AC.
MRI Acquisition
All MRI’s of a subject were evaluated to assess the tumor response pattern, and the tumor size was measured on the last MRI performed after completing NAC before surgery. The studies were done on a 1.5 T (N = 51) or a 3 T (N = 47) MRI scanner. The transition from 1.5 T to 3.0 T was in November of 2006. The 1.5 T scanner is a Philips Eclipse unit (Philips Medical Systems, Cleveland, OH) with a dedicated four-channel phased-array breast coil. DCE-MRI of the bilateral breasts was acquired using a 3D spoiled gradient-recalled echo (SPGR) radio frequency Fourier-acquired steady-state (RF-FAST) pulse sequence. The imaging parameters were as follows: imaging plane = axial, TR = 8.1 msec, TE = 4.0 msec, slice thickness = 4 mm, number of slices = 32, flip angle = 20°, matrix size = 256 × 128, and FOV = 38 cm. The scan time was 42 sec per imaging acquisition. The sequence was repeated 16 times for the DCE-MRI, with four pre-contrast frames and 12 post-contrast frames. The protocol of the earlier MRI studies done at 1.5 T was designed to have a high temporal resolution. When the study was moved from 1.5 T to 3.0 T, the protocol was changed to improve the spatial resolution by reducing the temporal resolution. The 3 T scanner is a Philips Achieva unit (Philips Medical Systems, Best, Netherlands) with a dedicated, SENSE-enabled, bilateral 4-channel breast coil. DCE-MRI of the bilateral breasts was acquired using a 3D gradient-echo, fat-suppressed sequence in axial section with FOV = 31–36 cm, acquisition slice thickness = 2 mm, reconstructed slice thickness = 1 mm, slice overlap = 1 mm, image-matrix = 480 × 480, TR/TE = 6.2/1.26 msec, flip-angle = 12°, NSA = 1, SENSE-factor = 2. Seven dynamic frames, including two pre-enhanced and five post-enhanced, were acquired. The imaging temporal resolution was 1 min and 38 sec for each frame.
MRI Interpretation
Two radiologists (J.C. for 1.5 T and S.B. for 3.0 T), with 7 and 6 years of experience in interpreting breast MRI, performed the MRI tumor size measurement using the same measurement standard. The residual tumor size in the final MRI was measured based on subtracting the pre-contrast images from the post-contrast images, and the maximum intensity projections (MIPs) generated from the subtraction images. The three dimensional tumor size was measured for each case on MRI, but only the longest dimension was used to correlate with pathological size. When there was no discernible enhancement or a faint enhancement equal to the background normal breast tissue in the previous lesion site, this case was determined as complete clinical response (CCR) on MRI. When measuring the residual tumor size in MRI, the two radiologists were blinded to the pathology results.
Pathological Determination of Residual Tumor
The pathological findings were interpreted by an experienced pathologist (P.C.). The surgical specimens were fixed with 10% neutral-buffered formalin and stained with H&E for the evaluation of residual tumor. If tumors were clearly visible, usually 2 cm or larger, only gross measurements were made. Small residual tumors, not clearly visible, were measured microscopically across slides of known thickness. If no invasive tumor was found within all examined slides, a diagnosis of pathological complete response (pCR) was made. The largest dimension provided by the pathologist was used in the comparative study. The tumor size difference between pathology and MRI was the absolute value between these two measurements. For a patient diagnosed as CCR, the MRI tumor size was zero. For a pCR case, the pathologic tumor size was zero.
Statistical Analysis
Descriptive statistics were obtained for continuous measures (age, time in days from the last MRI to operation, baseline and final MRI tumor size, final pathologic tumor size, difference between final MRI, and pathologic tumor sizes) and categorical variables including tumor type (invasive ductal carcinoma [IDC] or invasive lobular carcinoma [ILC] and mixed invasive ductal and lobular carcinoma), tumor morphology (mass or non-mass-like enhancement), tumor grade (low-medium grade or high grade), presence of biomarkers (HR, HER2, and combined HR and HER2), chemotherapy regimen (AC + taxane or taxane only), and MRI system (1.5 T or 3 T). The diagnostic accuracy based on true-positive (TP), true-negative (TN), false-positive (FP), and false-negative (FN) in each subtype group was evaluated, and whether they show a significant difference in FN rate and overall accuracy (TP + TN/all cases) was tested using the Fisher’s Exact test. For diagnostic accuracy based on the measurement of residual tumor size, the outcome variable was defined as the absolute difference between MRI-measured and pathological tumor size. Separate univariate linear regression models were formed to assess the association between the outcome variable and demographic and clinical predictors. Multivariate linear regression was applied using the backward selection method to model the mean difference between MRI and pathological tumor size as a function of demographic and clinical predictors. The predicted residual sums of squares (PRESS) statistic was examined with the objective of identifying the model with the minimum predicted residual sum of squares. SAS v9.2 was utilized for the statistical analysis.
RESULTS
Clinical and Tumor Characteristics
Summary statistics for each predictor variable is shown in Tables I and II. Of the 98 patients, 85 had IDC, 10 had ILC, and 3 had mixed IDC and ILC. Since the case number for ILC and mixed IDC + ILC was small, they were combined into one group in the analysis. Seventy-four patients presented with a mass type lesion and 24 presented with a non-mass-like enhancement lesion. Sixty tumors had grade score of 3 to 7 (low to medium grade), 37 had a grade score of 8 and 9 (high-grade), and one unspecified. Regarding molecular biomarkers, there were 57 HR-positive and 41 HR-negative patients; 40 HER2-positive and 57 HER2-negative patients. Of HER2-negtaive patients, 16 were triple negative, and 41 were HER2-negative/HR-positive. Fifty-one patients received the final MRI on a 1.5 T MRI scanner and 47 patients on a 3.0 T MRI scanner. Sixty-three patients received AC + taxane, and 35 had taxane without AC.
TABLE I.
MRI Diagnostic Results Based on True-Positive (TP), True-Negative (TN), False-Positive (FP), False-Negative (FN) in Each Category, and the Comparison Between Subtypes using the Fisher’s Exact Tests
| TP | TN | FP | FN (%) | Accuracy (TP + TN, %) | P values for FN | P values for accuracy | |
|---|---|---|---|---|---|---|---|
| All cases (N = 98) | 38 | 39 | 5 | 16 (16.3%) | 77 (78.6%) | ||
| Tumor type | 0.007 | 0.03 | |||||
| IDC (N = 85) | 32 | 38 | 5 | 10 (11.8%) | 70 (82.4%) | ||
| ILC and mixed (N = 13) | 6 | 1 | 0 | 6 (46.2%) | 7 (53.8%) | ||
| Tumor morphology | 0.52 | 0.26 | |||||
| Mass lesion (N = 74) | 32 | 28 | 3 | 11 (14.9%) | 60 (81.1%) | ||
| Non-mass-like (N = 23) | 6 | 10 | 2 | 5 (21.7%) | 16 (69.6%) | ||
| Tumor grade | 0.27 | 0.45 | |||||
| 4–7 (low–med, N = 60) | 24 | 21 | 3 | 12 (20.0%) | 45 (75%) | ||
| 8–9 (high, N = 37) | 14 | 17 | 2 | 4 (10.8%) | 31 (83.8%) | ||
| Hormonal receptor | 0.42 | 1 | |||||
| Positive (N = 57) | 29 | 16 | 1 | 11 (19.3%) | 45 (78.9%) | ||
| Negative (N = 41) | 9 | 23 | 4 | 5 (12.2%) | 32 (78%) | ||
| HER-2 receptor | 0.26 | 1 | |||||
| Positive (N = 40) | 9 | 23 | 4 | 4 (10%) | 32 (80%) | ||
| Negative (N = 57) | 29 | 16 | 1 | 11 (19.3%) | 45 (78.9%) | ||
| MR scanner | 0.005 | 0.03 | |||||
| 1.5 T (N = 51) | 12 | 33 | 3 | 3 (5.9%) | 45 (88.2%) | ||
| 3.0 T (N = 47) | 26 | 6 | 2 | 13 (27.7%) | 32 (68.1%) | ||
| Chemotherapy regimen | 0.16 | 0.30 | |||||
| AC + Taxane (N = 63) | 18 | 29 | 3 | 13 (20.6%) | 47 (74.6%) | ||
| Taxane w/o AC (N = 35) | 20 | 10 | 2 | 3 (8.6%) | 30 (85.7%) |
TABLE II.
Results from Univariate Linear Regression Models for Prediction of MRI Diagnostic Accuracy Based on the Absolute Difference Between MRI and Pathological Residual Tumor Size
| Number of subject |
MRI-pathology tumor size difference (cm) |
Regression model coefficient of determination |
Regression model slope parameter |
|
|---|---|---|---|---|
|
|
||||
| Clinical and tumor characteristic | N (%) | Mean ± Stdev | R2 | P-value |
| Tumor type | 0.16436 | <0.0001 | ||
| IDC | N = 85 (87%) | 0.69 ± 1.20 | ||
| ILC and mixed | N = 13 (13%) | 3.07 ± 4.13 | ||
| Tumor morphology | 0.08448 | 0.0039 | ||
| Mass lesion | N = 74 (76%) | 0.69 ± 1.00 | ||
| Non-mass-like | N = 23 (24%) | 2.06 ± 3.59 | ||
| Tumor grade | 0.0385 | 0.0541 | ||
| 4–7 (low–medium) | N = 60 (62%) | 1.32 ± 2.44 | ||
| 8–9 (high) | N = 37 (38%) | 0.51 ± 0.79 | ||
| Hormonal receptor | 0.05961 | 0.0154 | ||
| Positive | N = 57 (58%) | 1.42 ± 2.49 | ||
| Negative | N = 41 (42%) | 0.43 ± 0.68 | ||
| HER-2 receptor | 0.07846 | 0.0055 | ||
| Positive | N = 40 (41%) | 0.34 ± 0.50 | ||
| Negative | N = 57 (59%) | 1.48 ± 2.50 | ||
| MR scanner | 0.04395 | 0.0383 | ||
| 1.5 T | N = 51 (52%) | 0.60 ± 1.48 | ||
| 3.0 T | N = 47 (48%) | 1.44 ± 2.39 | ||
| Chemotherapy regimen | 0.01281 | 0.2672 | ||
| AC + Taxane | N = 63 (64%) | 0.83 ± 2.16 | ||
| Taxane without AC | N = 35 (36%) | 1.31 ± 1.66 | ||
| Days to operation | 0.00249 | 0.6259 | ||
| 0–30 days | N = 43 (44%) | 0.89 ± 2.22 | ||
| >30 days | N = 55 (56%) | 1.09 ± 1.84 | ||
Diagnostic Performance of MRI in Predicting Presence of Cancer
Of all 98 patients, 44 achieved pCR. MRI had 39 TN diagnoses (complete response by MRI and pCR by pathology) and 16 FN diagnoses (complete response by MRI but pathology showed residual invasive tumor). There were 38 TP diagnoses and 5 FP diagnoses. Overall the sensitivity, specificity, positive predictive predicating value, negative predicting value, and accuracy of MRI were 70.4%, 88.6%, 88.4%, 70.9%, and 78.6%, respectively. Table I summarizes the diagnosis of TP, TN, FP, FN cases in each subgroup. For FN diagnosis in (which could impact the surgical margin), the rate is 10/85 = 11.8% the IDC group and 6/13 = 46.2% in the ILC + mixed group, which is significantly different with P = 0.007. The FN rate is 3/51 = 5.9% at 1.5 T and 13/37 = 27.7% at 3 T, significantly different with P = 0.005. The overall diagnostic accuracy (TP + TN/all cases) is also significantly different between IDC and ILC + mixed (82.4% vs. 53.8%, P = 0.03), and between 1.5 T and 3 T (88.2% vs. 68.1%, P = 0.03). Tumor morphology, grade or biomarker status was not associated with diagnostic performance based on this conventional assessment method to predict presence of cancer.
Accuracy of MRI in Diagnosing Residual Tumor Size
The mean (±SD) baseline MRI tumor size was 3.9 ± 2.1 cm (range, 0.7–9.9 cm). After completing NAC, the mean residual tumor size by MRI was 0.9 ± 1.5 cm (0–6.3 cm). The final residual tumor size by pathology was 1.5 ± 2.4 cm (0–14 cm). The scatter plot of the pathological size against MRI-measured size is shown in Figure 1. The unity line is also plotted in the figure. In 27 patients MRI underestimated the residual tumor size by >5 mm (above the unity line), and in 14 patients MRI overestimated the residual tumor size by >5 mm (below the unity line). The mean absolute difference between final MRI and pathological residual tumor size was 1.0 ± 2.0 cm (0–14 cm). The size difference in each subtype group is listed in Table II.
Fig. 1.
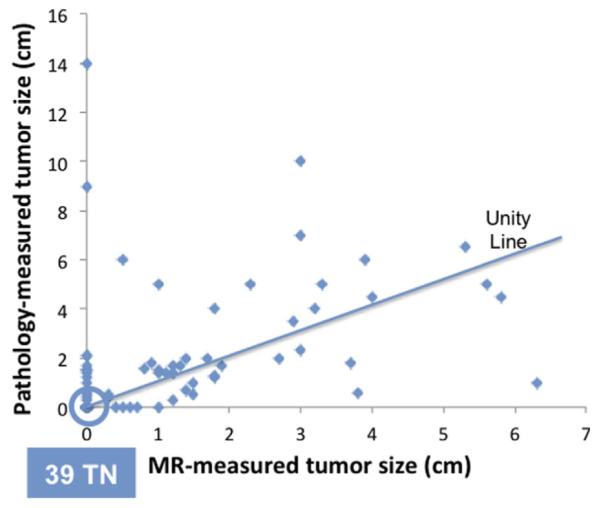
The scatter plot between the residual pathological tumor size and the MRI size after completing NAC. There are 39 true negative cases that are located on the origin. The unity line is also shown. MRI underestimates the residual tumor size by >5 mm (above unity line) in 27 patients (27/98 = 28%), and overestimates the residual tumor size by >5 mm (below the unity line) in 14 patients (14/98 = 14%).
Univariate and Multivariate Regression Analysis of Covariates Affecting MRI Accuracy
The results of univariate linear regression models for each considered variable in predicting the size difference between MRI and pathology are summarized in Table II, and graphically illustrated in Figure 2. The strongest predictor was tumor type (P < 0.0001). The mean absolute difference was 0.69 cm in IDC group, which was significantly smaller than the mean of 3.07 cm in the ILC + mixed group. Tumor morphology was also significantly associated with MRI size measurement accuracy, with the mean size difference of 0.69 cm in mass lesions and a greater difference of 2.06 cm in non-mass lesions (P = 0.0039). Tumor grade showed marginal significance, with a mean of 1.32 cm in low-med grade group and a smaller difference of 0.51 cm in high-grade group, with P = 0.0541. The size difference was significantly associated with HR and HER2 biomarker status, smaller in HR-negative group (mean of 0.43 cm) than in HR-positive group (mean of 1.42 cm, P = 0.0154); and smaller in HER2-positive group (mean 0.34 cm) than in HER2-negative group (mean of 1.48 cm, P = 0.0055). Among HER2-negative tumors, the mean difference in triple negative group was 0.75 cm, which was significantly smaller than in HER2-negative/HR-positive group (mean of 1.76 cm, P = 0.0468). The mean size difference measured at 1.5 T was 0.60 cm, which was significantly smaller than at 3 T (1.44 cm, P = 0.0383). The mean size difference in the AC + taxane chemotherapy regimen group (0.83 cm) was smaller than in the taxane-only group (1.31 cm), but not significantly different with P = 0.2672. The time between the last MRI to operation (0–30 days vs. >30 days) did not affect the accuracy of MRI (mean size difference 0.89 cm vs. 1.09 cm, P = 0.6259).
Fig. 2.

The plot of MRI-pathology size discrepancy stratified by different clinical parameters. The mean value in each sub-group is specified in the figure. It can be seen that the discrepancy is larger in ILC + Mixed than IDC, larger in non-mass than mass lesions, larger in low-med grade than high grade, larger in HR-positive than HR-negative, larger in HER2-negative than HER2-positive, larger in 3 T than 1.5 T, larger in taxane than AC + taxane NAC regimens. If HR and HER2 status are combined, the discrepancy is larger in HER2-negative HR-positive than HER2-negtaive HR-negative (i.e., triple negative) than HER2-positive tumors.
A multivariate regression analysis using the backward selection method was applied to find independent predictors. The final model selected tumor type, tumor morphology, HER2 status, and MRI scanner (P = 0.0005, 0.0028, 0.0119, and 0.1181, respectively; F-statistic for the overall model, P < 0.0001), but MRI scanner did not reach the significance level. For tumor biomarkers, HER2-negative and HR-positive tumor was the dominant biomarker subtype, and as such, these two parameters showed a high correlation with coefficient r = −0.34 and P = 0.0006. Because of their high correlation, only HER2 survived as an independent predictor. In order to precisely evaluate the biomarker effect, the three categorical subtypes based on combined HER2-HR status (3 categories: HER2-positive, triple negative, and HER2-negative/HR-positive) were used in the multivariate analyses, and the final model selected tumor type, tumor morphology, HER2-HR biomarker, and MRI scanner (P = 0.0014, 0.0032, 0.0286, and 0.1190, respectively; F-statistic for the overall model, P < 0.0001). Similar to the previous model the MRI scanner did not reach the significance level either. Four case examples with different HER2-HR biomarker status and tumor morphology are illustrated, a triple-negative mass lesion in Figure 3; a HER2-positive/HR-negative non-mass lesion in Figure 4; a HER2-negative/HR-positive mass lesion in Figure 5; and a HER2-negative/HR-positive non-mass lesion in Figure 6.
Fig. 3.

A 64-year-old patient with a well-circumscribed, triple-negative, mass lesion (invasive ductal cancer) in the left breast. The maximum intensity projection (MIP) images of pre-treatment, F/U-1, and final MRI are shown. The tumor size is 2.5 cm before treatment and shows concentric shrinkage to 1.8 cm in F/U-1 and further down to 1.1 cm in final MRI after completing treatment. The residual tumor size determined in post-NAC pathological examination is 1.4 cm, and the MRI discrepancy is 3 mm. This is a true positive case.
Fig. 4.

A 37-year-old patient with HR-negative and HER2-positive non-mass-like lesion (invasive ductal cancer). The maximum intensity projection (MIP) images of pretreatment, F/U-1, and final MRI are shown. MRI shows a complete response and the pathology shows pCR. Although this is a non-mass lesion, the diagnosis of MRI in HR-negative and HER2-positive tumor that receives trastuzumab is highly accurate. This is a true negative case.
Fig. 5.

A 48-year-old patient with HR-positive and HER2-negative mass lesion (invasive ductal cancer). The maximum intensity projection (MIP) images of pretreatment, F/U-1, and final MRI are shown. The tumor size on final MRI is measured as 3.0 cm, but the pathology shows residual disease in a 7.0 cm region. This is a true positive case with a size discrepancy of 4.0 cm. Although this case is a mass lesion, the diagnosis of MRI in HR-positive and HER2-negative tumor is the worst compared to other biomarker types, and may not be accurate.
Fig. 6.

A 31-year-old patient with HR-positive and HER2-negative non-mass-like enhancement lesion (invasive ductal cancer with extensive carcinoma in situ components). The contrast-enhanced (subtraction) images selected from the same level in pretreatment, F/U-1, and final MRI are shown. The area of the enhanced tumor tissues and the degree of enhancement are decreasing with treatment, indicating a good response to the chemotherapy. The size measured on final MRI is 3.0 cm, but the post-NAC pathological examination shows scattered cancer cells within a 10 cm region. This is a true positive case with a large size discrepancy of 7.0 cm. It is typical for a non-mass lesion to show scattered diseases within the original tumor bed, and it is difficult for MRI to make a correct diagnosis. Furthermore, MRI diagnostic accuracy is the worst in HR-positive and HER2-negative tumors compared to other biomarker types.
DISCUSSION
Currently used NAC regimens and targeted therapies are effective to induce tumor shrinkage down to minimal residual tumor burden or pCR. A good NAC response would facilitate the breast conserving surgery (BCS). Although in large prospective randomized clinical trials BCS has shown to have disease-free survival and overall survival comparable to that of mastectomy [30,31], there was a lifelong risk of local recurrence in women treated with BCS, about 2–20% during the follow-up period of 5–10 years [32,33]. The 5-year local recurrence rate was 2–7% in patients with tumor-free margins, but the risk increased to as high as 22% if the resection margin was positive [33]. The risk of surgical margin on the recurrence was mainly established in patients without receiving NAC. There were only a few studies investigating the recurrence in patients who underwent BCS after receiving NAC [34–38]. It was noted that tumor size and pathological stage influenced loco-regional recurrence in patients with BCS [37]. Another study found that ER status and multifocality of the residual tumor after NAC were independent predictors of recurrence after BCS, which was associated with worse overall survival [38]. Therefore, imaging assessment of residual disease plays an important role in patients undergoing NAC, which may provide critical information for planning of an optimal surgery to achieve a tumor free margin.
Despite MRI has shown its superiority than other traditional modalities for evaluating the extent of residual tumor following NAC, it might not detect small foci or scattered cancer cells/clusters [14,27]. In the present study we had 16 of 98 false negative diagnoses (16%), with a negative predictive value of 70.9%. In this situation, the surgeon might have difficulty in determining how much tissue should be removed, or even be misled by the imaging findings. The diagnostic role of MRI for assessing tumor response after NAC has been evaluated in many studies [4–11,14–16,23,25–27]. In this study we considered several possible factors that may potentially affect the diagnostic accuracy of breast MRI following NAC, including tumor type, morphology, grade, molecular biomarkers, NAC regimen, and the use of MRI systems. Conventional assessment of imaging diagnostic performance based on prediction of the presence of cancer (i.e., TP, TN, FP, FN rates) did not provide sufficient information for evaluating its role for surgical planning, and in this study the diagnostic accuracy was evaluated based on the difference between MRI-measured tumor size and pathological size as the outcome measure.
Using a cut-off value of 0.5 cm [10], the residual tumor size was underestimated in 27 of 98 patients (28%) and overestimated in 14 patients (14%) by MRI. Our findings were similar to one study showing 23% underestimation and 6% overestimation of the residual disease by MRI [5]. In another study, however, MRI underestimated residual disease in 7% of patients and overestimated residual disease in 19% [10]. Kwong et al. [11] also reported that MRI frequently overestimated residual disease in responders to chemotherapy. The discrepancy might be related to the analyzed tumor types, the criterion used to diagnose residual disease on MRI, as well as the effort put in to search for the extent of residual tumor cells in the surgical specimen. When there were enhanced tissues remaining in the tumor bed they were usually diagnosed as residual disease. However, NAC might also induce reactive changes, such as fibrosis and inflammation [39], and result in non-specific contrast enhancements leading to overestimated tumor size by MRI [40]. In this study there were five false positive diagnoses. Although these five cases were classified as pCR, DCIS was present in three. For these cases, correct diagnosis of DCIS on MRI might help to achieve tumor-free margin in surgery.
Using univariate linear regression analyses, a statistically significant association was found between the absolute difference between MRI and pathological tumor size and each of four covariates: tumor type (P < 0.0001), tumor morphology (P = 0.0039), HR status (P = 0.0154), HER2 status (P = 0.0055) and the type of MRI scanner (1.5 T or 3.0 T, P = 0.0383). Tumor grade reached a marginal significance with P = 0.0541. The accuracy was better in IDC than ILC + mixed type, better in mass than non-mass morphology, better in HR-negative than HR-positive, better in HER2-positive treated with trastuzumab than HER2-negtaive; and these findings were consistent with results in several large series studies published recently [17–22]. There was a weak, yet significant, association with the type of MRI scanner (1.5 T or 3 T). In a recent study it has been shown that, with a higher imaging spatial resolution, 3 T MRI did not diagnose small residual tumors more accurately than did 1.5 T MRI [27]. It was postulated that the limitation is most likely due to the low contrast enhancement of the small residual tumor. In this case, the detection accuracy of MRI might not be improved by using a higher spatial resolution in the imaging protocol [27]. The MRI scanner was not a significant predictor in the multivariate regression model. Interestingly, we had a significantly lower FN rate at 1.5 T than 3 T (5.9% vs. 27.7%, P = 0.0005). At 1.5 T we had a high number of HER2-positive patients who received AC + taxane and reached a high pCR rate. When a high pCR rate was achieved, MRI was highly accurate in giving true negative diagnosis [14].
The mean MRI-pathology size difference was 0.69 cm in IDC group and 3.07 cm in ILC + mixed group. ILC is the cancer growing in the lobules. It is associated with the loss of E-cadherine expression, a glycoprotein that mediates adhesion between epithelial cells, and ILC is usually characterized by a diffuse grown pattern [41]. Several studies investigated the differences of pCR between lobular and ductal carcinomas, and the pCR rate for ILC was only 0–3% [42–44]. The unique tumor growth features of linear and scattered pattern in ILC might account for the underestimation of the tumor size by MRI. The tumor may respond to NAC, but more likely showing the scattered islands with decreased cellular density without substantially decreasing the total extent of tumor region. It has been shown that the use of NAC did not increase the rates of BCS in patients with ILC [45]. According to the German Preoperative Adriamycin Docetaxel trial the re-excision rate after BCS was significantly higher in patients with ILC than in patients with IDC or other histological diagnoses (32.4%, 14.6%, and 8.8%, respectively; P <.0001) [24]. Similarly, another study found 43% of ILC had positive tumor margins versus 16% in IDC after BCS [46]. The survival outcome of ILC compared to other cancers is still under investigation [47,48]. A recent report showed that the response of ILC was mainly due to their HR and HER2 biomarkers [17], but in our study we showed that after controlling for biomarker the cellular type was still the strongest independent predictor.
The mean MRI-pathology size difference was 0.69 cm in mass lesions and 2.06 cm in non-mass lesions. Previous studies had shown that non-mass-like enhancement lesions were more likely to break into scattered residual islands or clusters distributed in a large area after NAC, resulting in underestimation of tumor size by MRI [14,27,49–52]. It was noted that MRI was not significantly correlated with histological size when the tumor showed shrinkage with residual multinodular lesions [14,46,49]. Unlike mass lesions that shrank down to nodules [52], in non-mass-like enhancement lesions, although tumor cells were destroyed, the fibrous stroma remained. The residual cancer cells presenting as small foci or scattered cells might receive nutrients via diffusion and not from vascular perfusion [49,52]. With the decrease of contrast enhancement, the conspicuity of the residual tumor that can be used for detection by MRI was lost [50].
The mean MRI-pathology size difference was 0.34 cm in HER2-positive cancer and 1.48 cm in HER2-negative cancer (0.75 cm for triple negative and 1.76 cm for HER2-negative/HR-positive). Considering HR status alone, the mean MRI-pathology size difference was 0.43 cm in HR-negative cancer and 1.42 cm in HR-positive cancer. Previous studies [14,15,19–21] have shown that the diagnostic accuracy of MRI was better in HER-2 positive than in HER-2 negative cancer. Although it was noted that HER-2 positive cancer might be less sensitive to taxane therapy than were HER-2 negative tumors [50], the targeted therapy trastuzumab was very effective and were more likely to achieve pCR in HER-2 positive than negative tumors [14], also to improve patient outcome [53–56]. HR-negative cancer was known to be more chemo-sensitive than HR-positive cancer. After NAC and BCS, positive tumor margin was present in 20% of HR-positive cancer, while only in 10% of HR-negative cancer (P = 0.014) [46].
In general, MRI diagnosis is more accurate in tumors that have a better response, and many studies have shown that the accuracy is related to combined HER2-HR, or HER2-luminal, biomarker status [15,17–21,27,48,57–59].
Based on our results and others published in the literature, one may ask how these MRI results can be used to choose an optimal surgery that can achieve tumor-free margin in one operation. At our institution, for patients who have pre-operative diseases covering two quadrants and have substantial diseases remaining after NAC, particularly for those known to have cancers not responding well to chemotherapy (lobular cancer, HR-positive cancer, HER2-negative cancer, extensive non-mass-like enhancement lesions), our surgeons will recommend mastectomy- but it is up to the patient to decide whether they like to take chances to conserve the breast. In a previous publication [60] we analyzed 65 NAC patients to investigate their surgical outcome, also to compare the patient’s choice of surgery with surgeon’s recommendation (made in a blind review). In that study, 28 of 65 patients received lumpectomy, and 5 of 28 patients had a positive margin that required re-excision (including one patient with extensive lobular cancer but decided to receive lumpectomy first). We found that approximately 30% of patients will choose the surgery against surgeon’s recommendation, which is a factor that cannot be controlled for studying the impact of MRI on surgical outcome. Since we know that MRI has intrinsic limitation in detecting scattered residual diseases with a low cellularity, are there other imaging modalities (mammography, sonography, breast-specific nuclear medicine imaging) that can be used for detecting these forms of residual diseases? Although this question remains to be investigated, based on the different detection mechanisms of these imaging modalities, it will be very difficult to detect such residual diseases, and there is no evidence in the literature that any existing clinical breast imaging modality is sensitive enough to detect cell clusters. Therefore, perhaps a more important question that can be asked is whether detecting these minimal residual diseases has any clinical significance. One may argue that although these cells are present, they may have already lost ability to grow. Furthermore, even if surgery misses these diseases, the following radiation may wipe them out. More research in this area is needed to find out the significance of these minimum residual diseases and the role of imaging for such cases.
In this study we did not find that NAC regimen with AC + taxane or taxane-only was a significant predictor affecting MRI accuracy. The mean MRI-pathology size difference was 0.83 cm in the AC + taxane group, and 1.31 cm in the taxane-only group. Anthracycline regimen with AC had a high cardiac toxicity, and in recent years it has been slowly changed from the standard first-line regimen to an optional regimen. In our NAC protocol after 2007 although patients might be given AC after taxane, none of them was given additional AC before surgery. For patients who still had substantial disease remaining at surgery, AC was given in the adjuvant setting after surgery. Due to the multiple available NAC regimens, previous studies regarding the impact of different NAC regimens on MRI accuracy for assessing residual tumor size were difficult to compare and remained not clear [14,52,61,62]. One study reported underestimation of MRI was more likely (P = 0.02) among patients receiving taxane than among those given anthracycline [61]. With the continuing evolution of NAC regimens for breast cancer, it would be difficult to compare results from different studies [51]. In this study, 37 patients with HER-2 negative cancer also received the anti-angiogenic agent bevacizumab. A previous study has shown that the accuracy of MRI in patients with and without receiving bevacizumab was comparable, thus the use of bevacizumab was not considered as a covariate in the analysis [52].
Lastly, we performed multivariate analysis and found tumor type, morphology, and HER2-HR biomarker status were independent predictors, with P = 0.0014, 0.0032, 0.0286, respectively. Since the HER2-negative and HR-positive was the dominant subtype (i.e., with the highest prevalence), in statistical analysis they were considered as highly correlated. If HER2 and HR were not combined only HER2, not HR, was an independent predictor.
The case number in the present study was relatively small compared to several recently published studies. However, since this was a single-site study, we could ensure consistent study procedures (treatment regimen and imaging follow-up) and standardized data analysis methods in imaging and pathological evaluation were used. Despite of the small subject number, we could thoroughly investigate the predictive role of all considered variables, and indeed our results were consistent with reports in the literature.
In conclusion, in this study, by using univariate analysis we have found that as an individual parameter the tumor type, tumor morphology, HR and HER2 biomarker status, and the MRI scanner (1.5 T or 3.0 T) were significantly associated with the difference between MRI and pathological tumor sizes. Cancers with lobular component, non-mass-like enhancement lesions, HR-positive, and HER2-negative cancers had an increased discrepancy between MRI versus pathology tumor size compared to their counterpart lesions (invasive ductal cancers, mass lesions, HR-negative, and HER2-positive cancers, respectively). Multivariate regression analysis showed that tumor type, tumor morphology, and combined HER2-HR status were independent predictors. This study has also found that NAC regimens did not significantly affect the accuracy of MRI residual tumor size measurement. The results from this study may provide useful information for breast surgeons to decide the optimal surgical plan for NAC patients that can achieve tumor free margin in one operation.
ACKNOWLEDGMENT
This study was supported in part by NIH/NCI R01 CA127927 and California Breast Cancer Research Program # 16GB-0056.
Grant sponsor: NIH/NCI R01; Grant number: CA127927.; Grant sponsor: California Breast Cancer Research Program; Grant number: 16GB-0056.
Footnotes
This study was conducted at the Center for Functional Onco-Imaging, Univ. of California Irvine.
REFERENCES
- 1.Wolmark N, Wang J, Mamounar E, et al. Preoperative chemotherapy in patients with operable breast cancer: Nine-year results from National Surgical Adjuvant Breast and Bowel Project D-18. J Natl Cancer Inst Monogr. 2001;30:96–102. doi: 10.1093/oxfordjournals.jncimonographs.a003469. [DOI] [PubMed] [Google Scholar]
- 2.Fisher B, Brown A, Mamounas E, et al. Effect of chemotherapy on local-regional disease in women with operable breast cancer: Finding from National Surgical Adjuvant Breast and Bowel Project B-18. J Clin Oncol. 1997;15:2483–2493. doi: 10.1200/JCO.1997.15.7.2483. [DOI] [PubMed] [Google Scholar]
- 3.Buchholz TA, Lehman CD, Harris JR, et al. Statement of the science concerning locoregional treatments after preoperative chemotherapy for breast cancer: A National Cancer Institute conference. J Clin Oncol. 2008;26:791–797. doi: 10.1200/JCO.2007.15.0326. [DOI] [PubMed] [Google Scholar]
- 4.Partridge SC, Gibbs JE, Lu Y, et al. Accuracy of MR imaging for revealing residual breast cancer in patients who have undergone neoadjuvant chemotherapy. Am J Roentgenol. 2002;179:1193–1199. doi: 10.2214/ajr.179.5.1791193. [DOI] [PubMed] [Google Scholar]
- 5.Yeh E, Slanetz P, Kopans DB, et al. Prospective comparison of mammography, sonography, and MRI in patients undergoing neoadjuvant chemotherapy for palpable breast cancer. AJR Am J Roentgenol. 2005;184:868–877. doi: 10.2214/ajr.184.3.01840868. [DOI] [PubMed] [Google Scholar]
- 6.Boetes C, Mus RD, Holland R, et al. Breast tumors: comparative accuracy of MR imaging relative to mammography and US for demonstrating extent. Radiology. 1995;197:743–747. doi: 10.1148/radiology.197.3.7480749. [DOI] [PubMed] [Google Scholar]
- 7.Rosen EL, Blackwell KL, Baker JA, et al. Accuracy of MRI in the detection of residual breast cancer after neoadjuvant chemotherapy. Am J Roentgenol. 2003;181:1275–1282. doi: 10.2214/ajr.181.5.1811275. [DOI] [PubMed] [Google Scholar]
- 8.Bhattacharyya M, Ryan D, Carpenter R, et al. Using MRI to plan breast conserving surgery following neoadjuvant chemotherapy for early breast cancer. Br J Cancer. 2008;98:289–293. doi: 10.1038/sj.bjc.6604171. [DOI] [PMC free article] [PubMed] [Google Scholar]
- 9.Segara D, Krop IE, Garber JE, et al. Does MRI predict pathologic tumor response in women with breast cancer undergoing preoperative chemotherapy? J Surg Oncol. 2007;96:474–480. doi: 10.1002/jso.20856. [DOI] [PubMed] [Google Scholar]
- 10.Shin HJ, Kim HH, Ahn JH, et al. Comparison of mammography, sonography, MRI and clinical examination in patients with locally advanced or inflammatory breast cancer who underwent neoadjuvant chemotherapy. Br J Radiol. 2011;84:612–620. doi: 10.1259/bjr/74430952. [DOI] [PMC free article] [PubMed] [Google Scholar]
- 11.Kwong M, Chung G, Horvath L, et al. Postchemotherapy MRI overestimates residual disease compared with histopathology in responders to neoadjuvant therapy for locally advanced breast cancer. Cancer J. 2006;12:212–221. doi: 10.1097/00130404-200605000-00010. [DOI] [PubMed] [Google Scholar]
- 12.Kaufmann M, Minckwitz GV, Rody A. Preoperative (neoadjuvant) systemic treatment of breast cancer. Breast. 2005;14:576–581. doi: 10.1016/j.breast.2005.08.010. [DOI] [PubMed] [Google Scholar]
- 13.Orel S. Who should have breast magnetic resonance imaging evaluation? J Clin Oncol. 2008;26:703–711. doi: 10.1200/JCO.2007.14.3594. [DOI] [PubMed] [Google Scholar]
- 14.Chen JH, Feig B, Agrawal G, et al. MRI evaluation of pathological complete response and residual tumors in breast cancer after neoadjubant chemotherapy. Cancer. 2008;112:17–26. doi: 10.1002/cncr.23130. [DOI] [PubMed] [Google Scholar]
- 15.Loo CE, Straver ME, Rodenhuis S, et al. Magnetic resonance imaging response monitoring breast cancer during neoadjuvant chemotherapy: Relevance of breast cancer subtype. J Clin Onocol. 2011;29:660–666. doi: 10.1200/JCO.2010.31.1258. [DOI] [PubMed] [Google Scholar]
- 16.Chen JH, Mehta RS, Carpenter PM, et al. MRI in predicting pathological response of triple negative breast cancer following neoadjuvant chemotherapy. J Clin Oncol. 2007;25:5667–5669. doi: 10.1200/JCO.2007.14.6134. [DOI] [PubMed] [Google Scholar]
- 17.Lips EH, Mukhtar RA, Yau C, et al. I-SPY TRIAL Investigators. Lobular histology and response to neoadjuvant chemotherapy in invasive breast cancer. Breast Cancer Res Treat. 2012;136:35–43. doi: 10.1007/s10549-012-2233-z. [DOI] [PMC free article] [PubMed] [Google Scholar]
- 18.Moon HG, Han W, Ahn SK, et al. Breast cancer molecular phenotype and the use of HER2-targeted agents influence the accuracy of breast MRI after neoadjuvant chemotherapy. Ann Surg. 2013;257:133–137. doi: 10.1097/SLA.0b013e3182686bd9. [DOI] [PubMed] [Google Scholar]
- 19.Hayashi Y, Takei H, Nozu S, et al. Analysis of complete response by MRI following neoadjuvant chemotherapy predicts pathological tumor responses differently for molecular subtypes of breast cancer. Oncol Lett. 2013;5:83–89. doi: 10.3892/ol.2012.1004. [DOI] [PMC free article] [PubMed] [Google Scholar]
- 20.Cruz Ciria S, Jiménez Aragón F, García Mur C, et al. Magnetic resonance imaging in breast cancer treated with neoadjuvant chemotherapy: Radiologic-pathologic correlation of the response and disease-free survival depending on molecular subtype. Radiologia. 2013 doi: 10.1016/j.rx.2012.10.004. [Epub ahead of print] [DOI] [PubMed] [Google Scholar]
- 21.De Los Santos JF, Cantor A, Amos KD, et al. Magnetic resonance imaging as a predictor of pathologic response in patients treated with neoadjuvant systemic treatment for operable breast cancer: Translational Breast Cancer Research Consortium trial 017. Cancer. 2013;119:1776–1783. doi: 10.1002/cncr.27995. [DOI] [PMC free article] [PubMed] [Google Scholar]
- 22.Ko ES, Han BK, Kim RB, et al. Analysis of factors that influence the accuracy of magnetic resonance imaging for predicting pesponse after neoadjuvant chemotherapy in locally advanced breast cancer. Ann Surg Oncol. 2013;20:2562–2568. doi: 10.1245/s10434-013-2925-6. [DOI] [PubMed] [Google Scholar]
- 23.Rieber A, Brambs HJ, Gabelmann A, et al. Breast MRI for monitoring response of primary breast cancer to neo-adjuvant chemotherapy. Eur Radiol. 2002;12:1711–1719. doi: 10.1007/s00330-001-1233-x. [DOI] [PubMed] [Google Scholar]
- 24.Loibl S, von Minckwitz G, Raab G, et al. Surgical procedures after neoadjuvant chemotherapy in operable breast cancer: Results of the GEPARDUO trial. Ann Surg Oncol. 2006;13:1434–1442. doi: 10.1245/s10434-006-9011-2. [DOI] [PubMed] [Google Scholar]
- 25.Douek M, Tobias J. How reliable is MRI for predicting extent of residual breast cancer with different primary medical therapies? Nat Clin Pract Oncol. 2005;2:128–129. doi: 10.1038/ncponc0105. [DOI] [PubMed] [Google Scholar]
- 26.Moon HG, Han W, Lee JW, et al. Age and HER2 expression status affect MRI accuracy in predicting residual tumor extent after neo-adjuvant systemic treatment. Ann Oncol. 2009;20:636–641. doi: 10.1093/annonc/mdn683. [DOI] [PubMed] [Google Scholar]
- 27.Chen JH, Bahri S, Mehta RS, et al. Evaluation of breast cancer response to neoadjuvant chemotherapy using breast MRI at 3T. Radiology. 2011;261:735–743. doi: 10.1148/radiol.11110814. [DOI] [PMC free article] [PubMed] [Google Scholar]
- 28.Hammond ME, Hayes DF, Dowsett M, et al. American Society of Clinical Oncology/College of American Pathologists guideline recommendations for immunohistochemical testing of estrogen and progesterone receptors in breast cancer. J Clin Oncol. 2010;28:2784–2795. doi: 10.1200/JCO.2009.25.6529. [DOI] [PMC free article] [PubMed] [Google Scholar]
- 29.Wolff AC, Hammond ME, Schwartz JN, et al. American Society of Clinical Oncology/College of American Pathologists guideline recommendations for human epidermal growth factor receptor 2 testing in breast cancer. J Clin Oncol. 2007;25:118–145. doi: 10.1200/JCO.2006.09.2775. [DOI] [PubMed] [Google Scholar]
- 30.Veronesi U, Cascinelli N, Mariani L, et al. Twenty-year follow-up of a randomized study comparing breast-conserving surgery with radical mastectomy for early breast cancer. N Engl J Med. 2002;347:1227–1232. doi: 10.1056/NEJMoa020989. [DOI] [PubMed] [Google Scholar]
- 31.Poggi MM, Danforth DN, Sciuto LC, et al. Eighteen-year results in the treatment of early breast carcinoma with mastectomy versus breast conservation therapy: The National Cancer Institute Randomized Trial. Cancer. 2003;98:697–702. doi: 10.1002/cncr.11580. [DOI] [PubMed] [Google Scholar]
- 32.Singletary SE. Surgical margins in patients with early-stage breast cancer treated with breast conservation therapy. Am J Surg. 2002;184:383–393. doi: 10.1016/s0002-9610(02)01012-7. [DOI] [PubMed] [Google Scholar]
- 33.Swanson GP, Rynearson K, Symmonds R. Significance of margins of excision on breast cancer recurrence. Am J Clin Oncol. 2002;25:438–441. doi: 10.1097/00000421-200210000-00002. [DOI] [PubMed] [Google Scholar]
- 34.Chen AM, Meric-Bernstam F, Hunt KK, et al. Breast conservation after neoadjuvant chemotherapy: The MD Anderson Cancer Center experience. J Clin Oncol. 2004;22:2303–2312. doi: 10.1200/JCO.2004.09.062. [DOI] [PubMed] [Google Scholar]
- 35.Beriwal S, Schwartz GF, Komarnicky L, et al. Breast conserving therapy after neoadjuvant chemotherapy: Long-term results. Breast J. 2006;12:159–164. doi: 10.1111/j.1075-122X.2006.00225.x. [DOI] [PubMed] [Google Scholar]
- 36.Gentilini O, Intra M, Gandini S, et al. Ipsilateral breast tumor reappearance in patients treated with conservative surgery after primary chemotherapy. The role of surgical margins on outcome. J Surg Oncol. 2006;94:375–379. doi: 10.1002/jso.20583. [DOI] [PubMed] [Google Scholar]
- 37.Cebrecos I, Cordoba O, Deu J, et al. Can we predict local recurrence in breast conserving surgery after neoadjuvant chemotherapy? Eur J Surg Oncol. 2010;36:528–534. doi: 10.1016/j.ejso.2010.04.004. [DOI] [PubMed] [Google Scholar]
- 38.Ishitobi M, Ohsumi S, Inaji H, et al. Ipsilateral breast tumor recurrence (IBTR) in patients with operable breast cancer who undergo breast-conserving treatment after receiving neoadjuvant chemotherapy: Risk factors of IBTR and validation of the M.D. Anderson prognostic index. Cancer. 2012;118:4385–4393. doi: 10.1002/cncr.27377. [DOI] [PubMed] [Google Scholar]
- 39.Sinn HP, Schmid H, Junkermann H, et al. Histologic regression of breast cancer after primary (neoadjuvant) chemotherapy. Geburtshilfe Frauenheilkd. 1994;54:552–558. doi: 10.1055/s-2007-1022338. [DOI] [PubMed] [Google Scholar]
- 40.Knopp MV, Brix G, Junkermann HJ, et al. MR mammography with pharmacokinetic mapping for monitoring of breast cancer treatment during neoadjuvant therapy. Magn Reson Imaging Clin N Am. 1994;2:633–658. [PubMed] [Google Scholar]
- 41.Straver ME, Rutgers EJTh, Rodenhuis S, et al. The relevance of breast cancer subtypes in the outcome of neoadjuvant chemotherapy. Ann Surg Oncol. 2010;17:2411–2418. doi: 10.1245/s10434-010-1008-1. [DOI] [PMC free article] [PubMed] [Google Scholar]
- 42.Katz A, Saad ED, Porter P, et al. Primary systemic chemotherapy of invasive lobular carcinoma of the breast. Lancet Oncol. 2007;8:55–62. doi: 10.1016/S1470-2045(06)71011-7. [DOI] [PubMed] [Google Scholar]
- 43.Tubiana-Hulin M, Stevens D, Lasry S, et al. Response to neoadjuvant chemotherapy in lobular and ductal breast carcinomas: A retrospective study on 860 patients from one institution. Ann Oncol. 2006;17:1228–1233. doi: 10.1093/annonc/mdl114. [DOI] [PubMed] [Google Scholar]
- 44.Mathieu MC, Rouzier R, Llombart-Cussac A, et al. The poor responsiveness of infiltrating lobular breast carcinomas to neoadjuvant chemotherapy can be explained by their biological profile. Eur J Cancer. 2004;40:342–351. doi: 10.1016/j.ejca.2003.08.015. [DOI] [PubMed] [Google Scholar]
- 45.Boughey JC, Wagner J, Garrett BJ, et al. Neoadjuvant chemotherapy in invasive lobular carcinoma may not improve rates of breast conservation. Ann Surg Oncol. 2009;16:1606–1611. doi: 10.1245/s10434-009-0402-z. [DOI] [PMC free article] [PubMed] [Google Scholar]
- 46.Soucy G, Bélanger J, Leblanc G, et al. Surgical margins in breast-conservation operations for invasive carcinoma: Does neoadjuvant chemotherapy have an impact? J Am Coll Surg. 2008;206:1116–1121. doi: 10.1016/j.jamcollsurg.2007.12.025. [DOI] [PubMed] [Google Scholar]
- 47.Nagao T, Kinoshita T, Hojo T, et al. The differences in the histological types of breast cancer and the response to neoadjuvant chemothepy: The relationship between the outcome and the clinicopathological characteristics. Breast. 2012;21:289–295. doi: 10.1016/j.breast.2011.12.011. [DOI] [PubMed] [Google Scholar]
- 48.Cristofanilli M, Gonzalez-Angulo A, Sneige N, et al. Invasive lobular carcinoma classic type: Response to primary chemotherapy and survival outcomes. J Clin Oncol. 2005;23:41–48. doi: 10.1200/JCO.2005.03.111. [DOI] [PubMed] [Google Scholar]
- 49.Kim TH, Kang DK, Yim H, et al. Magnetic resonance imaging patterns of tumor regression after neoadjuvant chemotherapy in breast cancer patients: Correlation with pathological response grading system based on tumor cellularity. J Comput Assist Tomogr. 2012;36:200–206. doi: 10.1097/RCT.0b013e318246abf3. [DOI] [PubMed] [Google Scholar]
- 50.Wasser K, Sinn HP, Fink C, et al. Accuracy of tumor size measurement in breast cancer using MRI is influenced by histological regression induced by neoadjuvant chemotherapy. Eur Radiol. 2003;13:1213–1223. doi: 10.1007/s00330-002-1730-6. [DOI] [PubMed] [Google Scholar]
- 51.Kuzucan A, Chen JH, Bahri S, et al. Diagnostic performance of magnetic resonance imaging for assessing tumor response in patients with HER2-negative breast cancer receiving neoadjuvant chemotherapy is associated with molecular biomarker profile. Clin Breast Cancer. 2012;12:110–118. doi: 10.1016/j.clbc.2012.01.009. [DOI] [PMC free article] [PubMed] [Google Scholar]
- 52.Bahri S, Chen JH, Mehta RS, et al. Residual breast cancer diagnosed by MRI in patients receiving neoadjuvant chemotherapy with and without bevacizumab. Ann Surg Oncol. 2009;16:1619–1628. doi: 10.1245/s10434-009-0441-5. [DOI] [PMC free article] [PubMed] [Google Scholar]
- 53.Slamon DJ, Leyland-Jones B, Shak S, et al. Use of chemotherapy plus a monoclonal antibody against HER2 for metastatic breast cancer that overexpresses HER2. N Engl J Med. 2001;344:783–792. doi: 10.1056/NEJM200103153441101. [DOI] [PubMed] [Google Scholar]
- 54.Mersin H, Yildirim E, Berberogly U, et al. The prognostic importance of triple negative breast carcinoma. Breast. 2008;17:341–346. doi: 10.1016/j.breast.2007.11.031. [DOI] [PubMed] [Google Scholar]
- 55.Dawood S, Broglio K, Gong Y, et al. Prognostic significance of HER2 status in women with Inflammatory breast cancer. Cancer. 2008;112:1905–1911. doi: 10.1002/cncr.23350. [DOI] [PMC free article] [PubMed] [Google Scholar]
- 56.Sorlie T, Perous CM, Tibshirani R, et al. Gene expression patterns of breast carcinomas distinguishes tumor subclasses with clinical implications. Proc Natl Acad Sci USA. 2001;40:2667–2675. doi: 10.1073/pnas.191367098. [DOI] [PMC free article] [PubMed] [Google Scholar]
- 57.McGuire KP, Toro-Burguete J, Dang H, et al. MRI staging after neoadjuvant chemotherapy for breast cancer: Does tumor biology affect accuracy? Ann Surg Oncol. 2011;18:3149–3154. doi: 10.1245/s10434-011-1912-z. [DOI] [PubMed] [Google Scholar]
- 58.Nakahara H, Yasuda Y, Machida E, et al. MR and US imaging for breast cancer patients who underwent conservation surgery after neoadjuvant chemotherapy: Comparison of triple negative breast cancer and other intrinsic subtypes. Breast Cancer. 2011;18:152–160. doi: 10.1007/s12282-010-0235-4. [DOI] [PubMed] [Google Scholar]
- 59.Marcos dePaz LM, Tejerina Bernal A, Arranz Merino ML, et al. Breast MR imaging changes after neoadjuvant chemotherapy: Correlation with molecular subtypes. Radiologia. 2012;54:442–448. doi: 10.1016/j.rx.2011.05.013. [DOI] [PubMed] [Google Scholar]
- 60.Chen JH, Feig BA, Hsiang DJ, et al. Impact of MRI-evaluated neoadjuvant chemotherapy response on change of surgical recommendation in breast cancer. Ann Surg. 2009;249:448–454. doi: 10.1097/SLA.0b013e31819a6e01. [DOI] [PMC free article] [PubMed] [Google Scholar]
- 61.Denis F, Desbiez-Bourcier AV, Chapiron C, et al. Contrast enhanced magnetic resonance imaging underestimates residual disease following neoadjuvant docetaxel based chemotherapy for breast cancer. Eur J Surg Oncol. 2004;30:1069–1076. doi: 10.1016/j.ejso.2004.07.024. [DOI] [PubMed] [Google Scholar]
- 62.Kim HJ, Im YH, Han BK, et al. Accuracy of MRI for estimating residual tumor size after neoadjuvant chemotherapy in locally advanced breast cancer: Relation to response patterns on MRI. Acta Oncol. 2007;46:996–1003. doi: 10.1080/02841860701373587. [DOI] [PubMed] [Google Scholar]