

Abstract
Autism spectrum disorder (ASD) is a neurodevelopmental condition exhibiting impairments in behaviour, social and communication skills. These deficits may arise from aberrant functional connections that impact synchronization and effective neural communication. Neurofeedback training (NFT), based on operant conditioning of the electroencephalogram (EEG), has shown promise in addressing abnormalities in functional and structural connectivity. We tested the efficacy of NFT in reducing symptoms in children with ASD by targeting training to the mirror neuron system (MNS) via modulation of EEG mu rhythms. The human MNS has provided a neurobiological substrate for understanding concepts in social cognition relevant to behavioural and cognitive deficits observed in ASD. Furthermore, mu rhythms resemble MNS phenomenology supporting the argument that they are linked to perception and action. Thirty hours of NFT on ASD and typically developing (TD) children were assessed. Both groups completed an eyes-open/-closed EEG session as well as a mu suppression index assessment before and after training. Parents filled out pre- and post-behavioural questionnaires. The results showed improvements in ASD subjects but not in TDs. This suggests that induction of neuroplastic changes via NFT can normalize dysfunctional mirroring networks in children with autism, but the benefits are different for TD brains.
Keywords: mirror neuron system, sensorimotor systems, electroencephalogram mu rhythms, mu suppression index
1. Introduction
Autism is currently one of the most researched areas in neuroscience. It is a complex neurodevelopmental disorder that impairs a child's development of language, behaviour, social and communication skills [1–3]. There is no template for what characterizes a ‘typical’ individual with autism as symptoms can range from mild to severe. Low-functioning individuals may have problems with speech production while high-functioning individuals may have normal IQ levels yet exhibit social interaction deficits. This wide spectrum of symptoms is more commonly known as autism spectrum disorder (ASD). Currently, ASD is of serious concern because no cure exists and worldwide prevalence has been increasing rapidly in the last few decades. Although little agreement exists as to the exact causes for this increased prevalence, scientists believe that ASD might be related to a variety of factors, including genetic or mitochondrial disorders, environmental factors and/or atypical brain development [4,5]. An interesting observation is that generally males are four to five times more prone for developing autism than females. An autism-risk gene, a variant of the CACNA1G gene, has been found more common in males than females, suggesting that it might be an important clue to the sex differences [6].
One mechanism hypothesized to underlie the social impairments associated with high-functioning autism (HFA) is a dysfunctional mirror neuron system (MNS) [7–9]. The discovery of mirror neurons in monkeys and an MNS in the human brain has provided a neurological substrate for understanding many key concepts in human social cognition directly relevant to the behavioural and cognitive deficits observed in ASD [10], including the ability to comprehend actions, glean intentions and learn through imitation. First described by Rizzolatti and co-workers [11] in the macaque monkey, mirror neurons are thought to be involved in both self-initiated action and the representation of action performed by others. Neurons in the pars opercularis of the inferior frontal gyrus (IFG) show increased firing while executing and observing the same action, representing a potential mechanism for mapping seeing into doing [12,13]. As has been noted in a number of recent reviews, deficits in MNS activity may explain the abnormal social skills prevalent in ASD, such as impairment in joint attention, understanding the intentions of others and empathy—a condition also referred to as ‘mindblindness’ [14,15].
Although some studies have raised questions about the role of mirror neurons in human social behaviour [16,17], an increasing amount of work suggests that a dysfunction in the MNS does contribute to social deficits [7,8,18–21]. Specifically, impairments likely arise from an inability to ‘form and coordinate social representations of self and others via amodal or cross-modal representation processes’ [22, p. 137]—the type of function ascribed to mirror neurons. A particularly relevant functional magnetic resonance imaging (fMRI) study by Dapretto et al. [8] demonstrated decreased activation in the IFG (pars opercularis) in individuals on the autism spectrum, and activity in this region was found to be inversely related to symptom severity in the social domain. Electroencephalogram (EEG) studies have also shown that putative electro-biomarkers of MNS activity exhibit abnormalities in ASD compared with typically developing (TD) children [7,20,23,24]. Nonetheless, despite the excitement generated by these observations, few if any investigations have focused on operationalizing such insights towards practical solutions to the early diagnosis, amelioration or possible repair of MNS deficits.
Direct recording of neural activity using electromagnetic methods have unveiled activation patterns correlated with mirroring [13,25,26]. These scalp-recorded EEG patterns of activity occurring in the alpha (8–12 Hz) and beta (15–25 Hz) ranges are most evident over the central region of the scalp overlying the sensorimotor cortices and are modulated by motor activity [27]. Traditionally, these EEG patterns have been labelled mu rhythms (reviewed by Pineda [13]). The major characteristic of the mu rhythms is that they reach maximal power in the absence of overt movements, when the participant is at rest. In fact, mu rhythms are desynchronized, their power reduced when a hand or a foot movement is prepared, and disappear when the movement is actually performed. Particularly relevant to this chapter is evidence for mu suppression not only when participants perform movements but also when they observe such movements [28–30]. During the self-initiation, observation or even imagination of action in TD individuals, the MNS network is active, and power in the mu rhythm is suppressed [29,31–33]. Indeed, the phenomenology of the mu rhythm resembles the phenomenology of mirror neuron activity. Both are sensitive to movement as well as to motor and cognitive imagery (i.e. observed meaningful actions). Their overlapping neural sources in sensorimotor frontoparietal networks support the argument that they are related and involved in linking perception to action, which may be a critical component in the development of social cognition. Mu rhythms appear to reflect the translation of ‘seeing’ and ‘hearing’ into ‘doing.’ This function requires the entrainment of multiple domain-specific generators. These domains exhibit synchronized and desynchronized activity in a locally independent manner but become entrained when they are coherently and globally engaged in translating perception into action [13]. These patterns suggest a link between MNS and mu rhythms and raise the possibility that brain mechanisms manifested by EEG mu rhythms reflect social interaction, including imitation behaviour and theory of mind [26]. If so, it stands to reason that the modulation of mu rhythms might be dysfunctional in ASD individuals whose performance in these domains is impaired.
Indeed, several studies have demonstrated that individuals with ASD exhibit abnormal mu rhythm suppression, suggesting that their mirroring system does not engage normally when observing someone else's movements [7,23]. As argued above, deficits in MNS activity provide a basis for problems in higher order social cognition, such as empathy, theory of mind, imitation and language. If true, then one hypothesized method for recovering MNS function and ameliorating these behavioural deficits is neurofeedback training (NFT), an operant conditioning technique that results in the self-regulation of brain electrical oscillations. As an intervention, NFT has been used primarily in clinical settings, and therefore efficacy is based largely on case studies with few large randomized, controlled and blinded studies. Nonetheless, a substantial amount of work supports the rationale for its use in the context of treatment [34–40]. It is well recognized that more than 50% of ASD individuals demonstrate significant EEG abnormalities [41–43], with upwards of 30% developing clinical seizures by adolescence. Even when clinical seizures have not been identified, more than 50% show paroxysmal sharp discharges, especially during sleep. Additional daytime abnormalities include altered spectral profiles, abnormal patterns of coherence and reduced mu rhythm activity. These observations have led many clinical practitioners to use EEG-based interventions, such as NFT, as a therapeutic strategy. Supporting this case is strong evidence for the efficacy of this approach towards a variety of other neuropsychological conditions, including attention deficit hyperactivity disorder [43–45], epilepsy [46–49], traumatic brain injury [50,51], anxiety [52] and substance abuse [53].
The main goal of the study described in this paper was to assess whether NFT provided over a period of many weeks could improve behaviour and normalize the electrophysiology in children with HFA. Our working hypothesis was that neurofeedback-induced alpha mu (8–12 Hz) rhythm suppression or desynchronization, a marker of cortical activation [54], should induce neuroplastic changes in relevant networks, such as the MNS. A secondary hypothesis was that similar benefits would accrue for TD children with no known dysfunctions. In the behavioural component of the study, parents filled out paper and pencil assessments prior to and following NFT. In the electrophysiological component, a 20-channel EEG recording was used to quantify EEG in eyes-open/-closed conditions and in a mu suppression index (MSI) task prior to and following NFT. We hypothesized that NFT would normalize abnormal functional connectivity in the ASD brain via induction of neuroplastic changes and that this would produce improved behavioural responses as well as normal patterns of electrical activity compared with TD children, who would show similar improvements as the ASD group, or at minimum show no changes.
2. Research design and methods
(a). Participants
A total of 13 ASD (10 males; mean age = 11.38 years; range = 7–17 years; s.d. = 3.86) and 11 TD (seven males; mean age = 10.18 years; range = 8–17 years; s.d. = 2.68) subjects participated. There was gender inequality among the groups owing to the fact that more males tend to be diagnosed with ASD compared with females.
(b). Training
Subjects in each of the groups completed approximately 30 h of NFT. They came into the laboratory once or twice a week and completed a session that lasted either 45 or 60 min, respectively. Sessions involved three short 15 min video clips plus short rest periods between clips or an hour-long DVD. The videos consisted of either cartoon- or human-based interactions. The DVD was chosen from a variety of children's movies. Subjects had the choice of either the videos or DVD they wanted to use at each session. In order for the video clip or DVD to play, power in the 8–12 Hz band recorded at the C4 electrode site on the scalp had to be maintained above a pre-determined threshold for at least 1 s, while theta (4–8 Hz) and beta (13–30 Hz) activity had to remain below pre-determined thresholds. Theta and beta rhythms are typically associated with distraction, changes in focused attention and movement. When the theta and beta rhythms exceeded threshold, the video or DVD would pause. To resume playing, the subject had to focus and maintain levels of these frequencies above (mu rhythm) and below (theta, beta) threshold for at least 1 s. Thresholds for the three frequencies were determined in an initial baseline period during each session and were calibrated such that performance for the entire session fell in the 75–85% success range. Parents and children with ASD were primarily motivated by the expectation that the training would produce differences in behaviour and electrophysiology, as we have previously shown [36]. For the TD group, the main motivation was an expected change in their ability to focus attention.
(c). Electrode placement
Two clip electrodes were attached to each earlobe, with one electrode acting as reference (right earlobe) and the other as ground, while the third electrode was placed on the C4 site overlying the premotor region of the scalp on the right hemisphere. Thought technology hardware (ProComp2 bioamplifier; 256 Hz sampling rate) and the BioGraph Infiniti software computer program were used to record brain activity and control the NFT sessions.
(d). Behavioural assessments
Parents filled out three different paper and pencil assessments: the social responsiveness scale (SRS), the autism treatment evaluation checklist (ATEC) and the Vineland adaptive behaviour scales (Vineland-II). The SRS contains subcategories related to social awareness, social cognition, social communication, social motivation and autistic mannerisms. Scores less than or equal to 59 are considered within the normal range, while scores greater than 59 are considered to fall in the autism range. The ATEC also contains subcategories for speech/language/communication, sociability, sensory/cognitive awareness and health/physical behaviour. ATEC scores less than or equal to 5 are considered in the normal range, while more than 5 are considered to fall in the autism range. The Vineland adaptive scale includes subcategories for communication, daily-living skills and socialization. Scores of 90 or greater are considered in the normal range, while less than 90 are considered in the autism range. Assessments were filled out prior to the start of any NFT sessions and following the completion of the 30 h of training. All 13 parents of ASD children completed the SRS and ATEC forms, while 12 completed the Vineland. Compliance from TD parents was less consistent with seven completing the SRS and Vineland, while nine completed the ATEC.
(e). Electrophysiological assessments
At the beginning and end of 30 h of NFT, subjects were prepped with a 20-channel EEG cap (including one channel for the electrooculogram) for the eyes open/closed and MSI assessments. During recording sessions, subjects were asked to first close their eyes for approximately 10 min and remain still avoiding major movements of head and body. After a brief rest period, they were asked to maintain eyes open for another 10 min while minimizing body/head movements. For the MSI assessment, subjects were asked to watch 2-min biological movement videos of simple (hand, crayon and biomotion) and complex (social play) actions or of non-biological movements (balls), in addition to making self-initiated movements with their right hand when signalled to do so on the screen. The hand video showed a right hand making a duck movement (bringing the thumb and other fingers together rhythmically every second). The crayon video showed a right hand taking a crayon out of a crayon box and putting it back into the box rhythmically at least once a second. The biomotion video involved a point-light display of an adult male jumping rope. The social play video displayed three individuals (two females and a male) tossing a small ball around to each other. Lastly, the self-initiated movement involved subjects making the duck hand movement with their right hand, as seen in the hand video.
(f). Blind source separation
EEG data collected during the eyes-open/-closed assessment were processed using the EEGLab toolbox [55] for Matlab. Data were bandpassed from 3 to 40 Hz with an offline finite impulse response filter. Artefacts such as eye blinks, electromyography (EMG) or noisy channels were visually identified and removed. Data were then re-referenced to the average channel value and sectioned into 2 s epochs for averaging in frequency space. Pre- and post-training datasets were concatenated for homogeneous source space separation. EEG source estimates were obtained using the Infomax ICA algorithm, and dipole positions estimated with the DIPFIT 2.x toolbox on an MNI Boundary Element head model. Power spectra were averaged across subjects for channels C3, C4 and Cz, and then a mu cluster in source space was computed and averaged across subjects. Source estimates were clustered by dipole locations into 10 clusters via K-means. The cluster was identified as a mu component based on scalp distribution (central, left/right lateralized), dipole estimate (e.g. pre-central gyrus, Talairach: −61, −11, 29) and spectral profile including discernible peaks at 10 and 20 Hz. In the MSI measures, individual differences in power spectra are controlled via ratios of active condition to a control condition. To correct for individual differences during eyes-open/-closed tasks, we computed a ratio dividing the active condition by data from the first 10% of each condition as a baseline period. With the power spectra ratios derived, a repeated-measures ANOVA was employed to compare the mu (8–12 Hz) portions of the data in both channel and component space. A section of the low beta (16–22 Hz) was also compared across conditions to observe any possible harmonic effect of the mu activity.
3. Results
(a). Training
As shown in figure 1a, assessment of EEG changes during training shows that for some measures, particularly overall mu power in the 8–12 Hz band, the ASD group exhibited greater increases following training than the TD group. However, for the majority of the measures examined, such as sensorimotor rhythm (SMR) and beta means or EMG noise, there were no significant differences between groups. The TD group did exhibit greater changes in the theta band with training compared with the ASD group. Learning to control mu rhythms was assessed as a function of the hits per minute subjects scored given the mu thresholds set for a particular session. Figure 1b shows that using that metric both groups showed a positive learning curve with number of sessions, although the ASD curve is somewhat flatter than the TD curve.
Figure 1.

(a) Mean EEG changes during training. (b) Learning to control mu rhythms. Learning curves for TD and ASD groups. (Online version in colour.)
(b). Behaviour
SRS, ATEC and Vineland data were analysed using a repeated-measures ANOVA with treatment (pre, post) and subcategories as within-subject factors and group (ASD, TD) as a between-subject factor. The Greenhouse-Geisser correction for degrees of freedom was used in determining significance while multiple comparisons were Bonferroni corrected.
(i). Social responsiveness scale
The SRS results indicated a main effect of group, F1,12 = 109.46, p < 0.001 and a treatment × group interaction, F1,18 = 5.73, p < 0.05. As illustrated in figure 2a, there was an overall significant difference between pre-/post-ASD scores and pre-/post-TD scores, with ASD group scores exceeding threshold for an autism diagnosis, while TD scores fell below the threshold. Separate one-way ANOVAs showed a main effect of treatment, F1,12 = 10.56, p < 0.01, and a main effect of subcategories, F4,48 = 6.76, p < 0.001, for the ASD group. The TD group did not show a treatment effect but only a main effect of subcategories, F4,24 = 5.32, p < 0.01. The significant decreases in scores as a function of treatment support the hypothesis that children with autism improved their behaviour following NFT.
Figure 2.
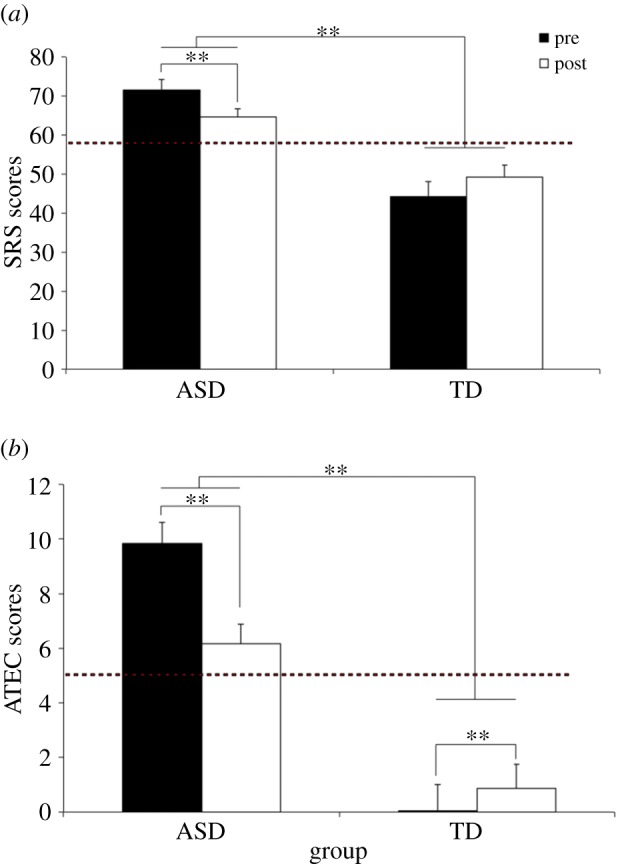
Mean SRC (a) and ATEC (b) pre-/post-NFT scores. **p < 0.01.
(ii). Autism treatment evaluation checklist
As shown in figure 2b, analysis of the ATEC scores disclosed the main effect of group, F1,20 = 96.29, p < 0.001, indicating that pre- and post-training ATEC scores were significantly higher for the ASD than that for the TD group. Mean ASD scores (8) exceeded the threshold for autism (5), while TD scores (1.6) remained below that threshold. However, there was a significant treatment × group interaction, F1,20 = 24.55, p < 0.001, indicating that treatment improved ASD scores by lowering them to 6.2, while TD scores increased to 3.0, although still below the normal cut-off point. The results also showed a main effect of subcategories, F3,60 = 29.17, p < 0.001, and specifically a group × subcategories interaction, F3,60 = 11.62, p < 0.001. Analysis of that interaction indicated that overall higher ATEC scores occurred for all subcategories in the ASD compared with TD group. Finally, a three-way interaction of group × treatment × subcategories, F3,60 = 6.01, p < 0.01, indicated that while ASD scores in all subcategories were reduced post-training, they increased for the TD group. Individual one-way ANOVAs for the ASD and TD groups showed significant treatment effects for both groups, ASD: F1,12 = 14.01, p < 0.01, TD: F1,8 = 15.10, p = < 0.01. The significant decrease in ATEC scores between pre- and post-training support the hypothesis that NFT improved ASD behaviour, although TD scores were changed in the opposite direction.
(iii). Vineland adaptive behaviour scales
As illustrated in figure 3, there was a significant main effect of group, F1,17 = 36.43, p < 0.001, with TD subjects showing normal scores (above the threshold) and ASD subjects showing scores below the threshold. A marginally significant treatment × group interaction, F1,17 = 4.20, p = 0.056, followed by two separate one-way ANOVAs showed that there were no significant effects in the ASD group, while the TD group showed a marginally significant score increase, F2,12 = 3.72, p = 0.055, indicating a slight regression in scores for these subjects.
Figure 3.
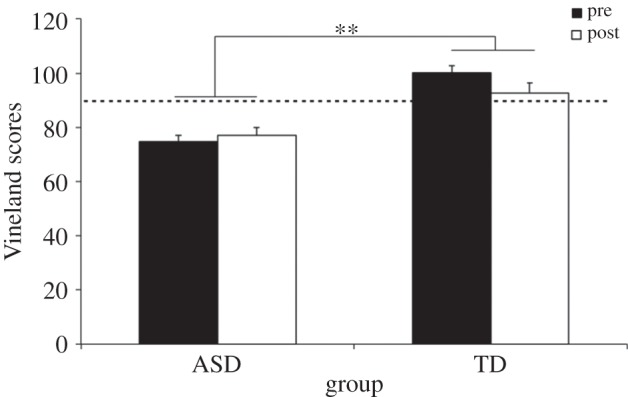
Mean Vineland pre-/post-training scores. **p < 0.01.
4. Standard electrophysiology
Nineteen EEG electrodes were divided into five different electrode clusters for statistical analysis: frontal (F7, F8, F3, F4, FP1 and FP2); centro-parietal (C3, C4, P3 and P4); temporal (T3, T4, T5 and T6); occipital (O1 and O2) and midline (Fz, Cz, and Pz). For each cleaned segment of EEG, the integrated power in the 8–12 Hz range was computed using a fast Fourier transform. Data were segmented into epochs of 2 s beginning at the start of the segment. Fast Fourier transforms were performed on the epoched data (1024 points). A cosine window was used to control for artefacts resulting from data splicing. Mu suppression was computed by taking the log base 10 of the mu power in the 8–12 Hz band during the experimental condition divided by the baseline (ball) mu power. A repeated-measures ANOVA was used to analyse mu suppression for the different clusters using video (hand, crayon, biomotion, social play and self-initiated movement), electrodes and treatment (pre, post) as within-subject factors, and group (ASD, TD) as a between-subject factor.
There were no main or interactive effects in the frontal or temporal electrode clusters. The occipital cluster showed a main effect of video, F4,36 = 4.11, p < 0.05, indicating that suppression effects occurred only in the social play condition (−0.105). However, no other main or interactive effects were noted at occipital sites. Indeed, the primary set of electrodes showing effects were in the centro-parietal and midline clusters.
(a). Centro-parietal cluster
As shown in figure 4, a main effect of video, F4,36 = 6.69, p < 0.01, indicated that mu suppression in this cluster was the largest for self-initiated movement (−0.200) followed by social play (−0.107), and then hand movement (−0.082). A main effect of electrodes, F3,27 = 3.76, p < 0.05, disclosed larger mu suppression at central (C3, C4) compared with parietal (P3, P4) sites and larger over right (C4: −0.205) compared with left (C3: −0.100) sites. A video × electrodes effect, F12,108 = 3.31, p < 0.05, indicated that for all video conditions, except biomotion, there was overall larger mu suppression on the right (C4) compared with left (C3) sites. Finally, as illustrated in figure 5a for central sites, a treatment × electrodes interaction, F3,27 = 3.79, p = 0.052, indicated that training produced larger mu suppression at most sites (C3, P3, P4) but reduced it at the C4 sites.
Figure 4.
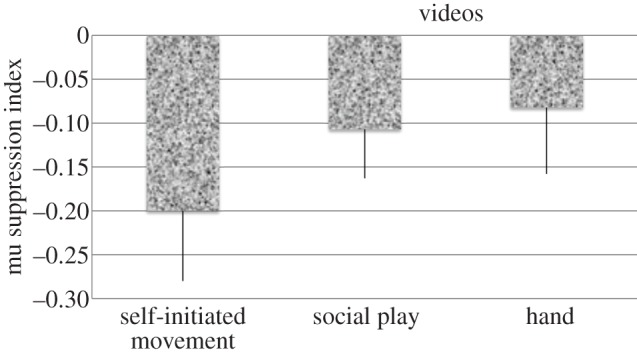
Effect of self-initiated movement and video content on the mu suppression gradient.
Figure 5.
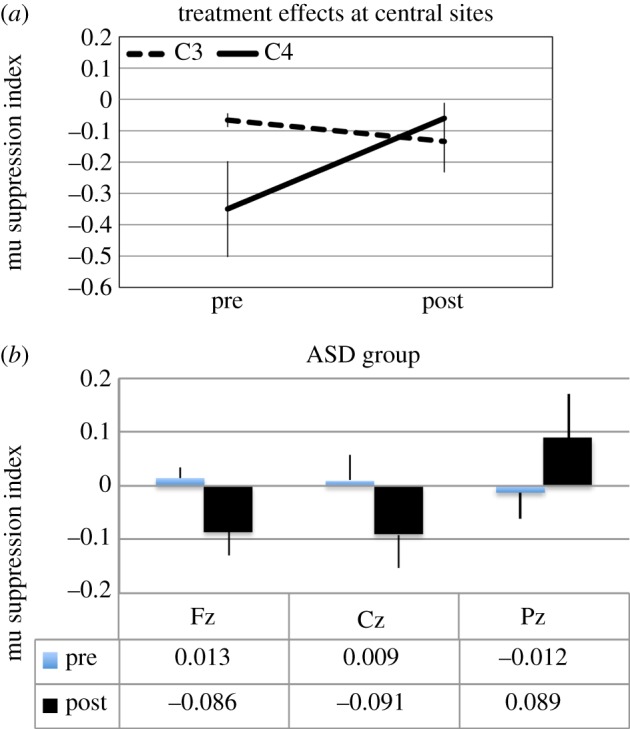
(a,b) Central and midline electrode effects. (Online version in colour.)
(b). Midline cluster
Analysis of midline electrodes showed no main effect of group or treatment but a marginally significant treatment × group interaction, F1,9 = 4.68, p = 0.059, indicating that while mu suppression in the ASD group became more negative from pre- to post-training (0.003 versus −0.029), it became more positive for the TD group (−0.040 versus 0.088). Furthermore, as shown in figure 5b for ASD data, a marginally significant treatment × group × electrode, F2,18 = 3.87, p = 0.052, showed that the enhanced mu suppression in the ASD group and the decrease in TD group centred on the fronto-central sites.
5. Quantitative electroencephalogram
Separate multivariate tests were carried out for mu and beta frequency bands in both channel and source space. For channel space, a repeated-measures ANOVA was computed using task (eyes open, eyes closed), treatment (pre-, post-training) and electrode (C3, Cz, C4) as within-subject factors and group (ASD, TD) as between-subject factors. The source space tests used the same ANOVA factors, with the exception of electrode, as this was only carried out on one localized cluster of activity. Multiple comparisons were controlled with a Bonferroni correction.
(a). Channel space
At the central electrodes, there was a main effect of task in the mu band (F1,7 = 6.34, p < 0.05). This indicates a smaller baseline corrected value for the eyes-closed than the eyes-open task. This likely indicates that the ratio of activity between the baseline window and active portion of the QEEG session was more similar for eyes closed than for eyes open. There was also an interaction between task × electrode (F2,6 = 6.71, p < 0.05). As shown in figure 6a, for the eyes-open task, Cz and C4 exhibit a similar power, which is significantly smaller than mu power at C3. For the eyes-closed task, C3 resembles Cz, both of which are lower power than at C4. A three-way interaction between treatment × electrode × group (F2,6 = 6.98, p < 0.05) suggests different changes between groups at different electrodes (figure 6b). ASD subjects exhibited an increase in power at site Cz from the pre-training session to the post-training assessment. TD subjects exhibited increases at all central electrodes as a result of NFT, with the greatest increases exhibited at C3. In the beta band, a marginally significant effect was observed for task (F1,7 = 5.51, p = 0.051) and group × treatment interaction (F1,7 = 3.75, p = 0.094). Larger beta power was observed for ratios of eyes-open rather than eyes-closed condition. TDs showed an increase in beta after NFT training.
Figure 6.
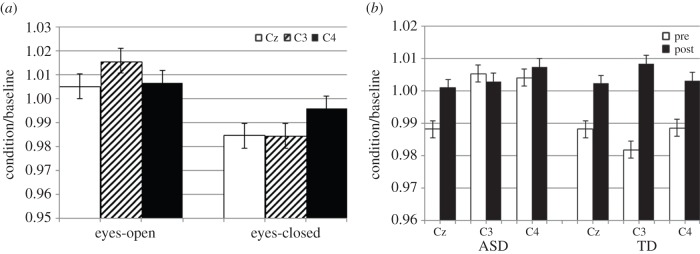
Task differences of mu power in channel space (a) and comparison pre- and post-NFT (b).
(b). Source space
A mu cluster centred on the left pre-central gyrus (Talaraich −61, −11, 29) was identified, as illustrated in figure 7a. There was no main effect of participant group in source space, but there was a significant interaction between treatment × task × group (F1,12 = 6.35, p < 0.05). There was little change in the eyes-open task between pre- and post-training assessments in either subject group. However, there is a divergence in direction of change between ASD and TDs for the eyes-closed task (figure 7b). TD participants increased mu power from pre- to post-training (1.001–1.020), whereas ASDs decreased mu power, and by a larger factor than TDs (1.021–0.987). No significant effects or interactions were observed for the beta band component.
Figure 7.
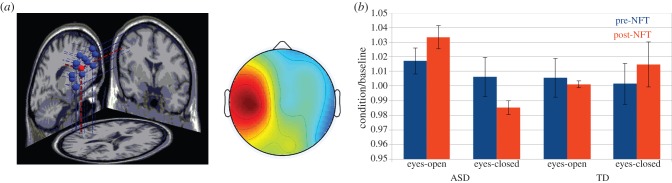
(a) Left: Mu component dipole sources, mean in red; right: mean scalp distribution of mu components. (b) Ratio of mu power for condition divided by baseline. (Online version in colour.)
6. Discussion
The results from this study are consistent with the mirror neuron theory of autism, which proposes that the varied social dysfunctions found in ASD can be accounted for by a dysfunctional MNS [7,8,10,56–58]. ASD is a neurodevelopmental condition that impairs a child's maturity in terms of communication, motor and/or social skills. Children with ASD, and in particular those with HFA, exhibit problems socializing and understanding the actions and intentions of others, what Baron-Cohen called ‘mindblindness’ [59]. The MNS is a network of brain areas centred in the IFG and parietal lobes that is activated when individuals observe or perform a goal-directed action [12,60–62]. In humans, this network is assumed to be critical for social cognition, from imitation learning to theory of mind and empathy [56,62], aspects of what David Siegel has called ‘mindsight’ [63]. The relationship between mindsight and mindblindness appears to depend on the integrity of the MNS. In our data, there is support for the hypothesis that affecting the modulation of the MNS, as indexed by EEG mu rhythms, can result in behavioural and electrophysiological changes in children with ASD. Furthermore, NFT focused on EEG mu rhythms is an effective methodology for gaining control of that modulation. In a recent study, Keuken et al. [64] showed, for example, that repetitive transcranial magnetic stimulation to disrupt the function of left IFG in neurotypical human adults increases reaction times during an emotion recognition task and eliminates the suppression of the mu rhythm. In another recent study, Arnstein et al. [26] used fMRI and EEG to show that suppression of mu power is correlated with BOLD signal activations in areas associated with the human MNS.
Children with ASD in this study exhibited deficits in social cognition and in the suppression of EEG mu rhythms compared to TD controls. This is consistent with previous studies showing a similar pattern of responses [7,58]. Following 30 h of NFT, the pre–post changes in behaviour and electrophysiology indicated that positive changes occurred in the children with ASD but that those benefits did not translate in a similar way to TD children. The efficacy of NFT as an intervention for autism is still an unsettled question but a variety of studies have shown consistent positive effects [36,65]. It still remains an unresolved question whether similar effects are seen in TD brains.
In this study, both groups appeared to learn to enhance mu power with time, although at slightly different rates. Nonetheless, assessment of the effects of training on a variety of EEG measures showed differential effects, with the ASD group showing the expected increases in mu rhythm (8–12 Hz band) power compared with the TD group, while the TD group showed enhanced power in the theta band compared with the ASD group. The set of validated measures used to assess behaviour in both groups included the SRS, the ATEC and the Vineland adaptive behaviour scales. These scales encompass subcategories related to sensory/social/cognitive awareness, social cognition/sociability/socialization, speech/language/social communication, social motivation, and autistic mannerisms and health/physical behaviour, including daily-living skills. All these measures improved in the ASD group but showed an opposite trend in the TD group following NFT.
In terms of the electrophysiology, there were no group differences in EEG mu suppression prior to training and indeed both groups showed some expected similarities. First, the foci for mu rhythms and the measured changes were primarily over sensorimotor regions of the brain, proposed to be the source(s) of such rhythms [55,66–69]. Second, mu suppression responsiveness to movement of increasing complexity showed a gradient, consistent with previous reports [70]. That is, power in the 8–12 Hz band exhibited the largest suppression during self-initiated movement or the execution of movement compared with the observation of movement. No differences were seen whether the observed movement was simple (hand movement) or complex (social play). Finally, larger mu suppression occurred on the right (hemisphere) central site (C4) compared with the left site (C3). All these features argue for significant similarities in mu rhythm neural sources and functional properties in the ASD and TD groups. Nonetheless, quantitative EEG analysis indicated that one main difference between groups in terms of channel space might simply be overall reduced mu and beta power in the ASD compared with the TD group. Furthermore, NFT increased synchronization of mu and beta power in the ASD group but reduced mu power in the TD group. An increase in synchronization occurred during the eyes-closed condition in the ASD group.
Additionally, the effects of NFT were to increase mu suppression primarily in the centro-parietal and midline electrode clusters. Within the centro-parietal cluster, training enhanced mu suppression at C3, P3 and P4 but reduced it at C4. Along midline sites, the effects were to enhance mu suppression mainly at frontal and central sites and decrease it at parietal sites. Overall, these results indicate that NFT is an effective form of intervention that affects the electrophysiology in specific brain regions, namely those associated with MNS, and its outcome is behavioural improvements in the social behaviour of children with HFA. By contrast, in a normal brain, this type of intervention does not translate into benefits and in fact produces overall reduced synchronization of mu rhythms that leads to decreased social behaviours.
Several methodological limitations suggest accepting these interpretations with some caution. First, the size of the subject pool was relatively small. Long-term and resource-intensive studies such as these are difficult to do and accrual of a very large subject population is difficult. For parents and children, the visit to a laboratory twice a week for 40 sessions requires significant commitment and patience. Although over the years we have learned to limit the number of dropouts and to reduce non-compliance, this is only a small part of the problem. Another limitation is that in order to maintain attentiveness and motivation, we allow every child to customize the videos and DVDs they watch during training. It may be that certain videos and movies activate the brain's social networks more than others and we did not control for this. An additional limitation is that autism is primarily a male disorder, and hence our subject pool comprised mainly males. Such gender disparity can be overcome with an intense search for female subjects, but that is dependent on time and resources, which were not available for this study. A potential concern in the behavioural component of the study is that parents fill out assessments with high expectations of positive results, especially parents of the children with ASD. As this is an unblinded study, such expectations may contribute to some of the behavioural results. However, the fact that the electrophysiology is also congruent with the behavioural findings adds support to the idea that these effects are real and not necessarily placebo effects. Somewhat related to this issue is that the behavioural scales used have been validated for an autism population and not for TD children. Therefore, the behavioural changes observed in the TD population using these scales have to be taken with a great deal of caution.
Source space analyses for the electrophysiological data are a new and an important contribution to the literature on the effects of NFT for ASD therapy, as they strengthen the standard ways of analysing such data. We observed some significant effects of treatment for different subject groups in the mu band, although these should also be interpreted with caution. The existing QEEG databases are built upon 21 channel EEG recordings. To maintain consistency with the clinical database, we used the same 10–20 electrode montage. However, in terms of source space, this is a sub-optimal array, as 64 channels provides significantly more accurate estimations [71] and increasing to 128 channels can yield single dipole estimates approaching 4 mm accuracy [72]. One interesting question that remains with regards to neurofeedback is how training at one electrode site influences activity at other sites. For instance, we observed significant changes at the C3 electrode when C4 was the target of training. A common mu source driving both of these electrodes could explain these observations.
With regards to the QEEG, the changes in power, particularly for source space, are counter to our predictions. We observed a decrease in mu power for ASD and an increase for TD at the mu cluster. It is important to keep in mind the baseline correction ratio we employed. The farther a score is away from 1, the greater the differences between the first 10% of a trial used as a baseline period and the latter 90% of the trial used as the active period. The eyes-closed task, surprisingly, exhibits less coherence between the baseline and active window. One might expect to see greater alpha or mu power throughout the duration of the eyes-closed task, which might yield a ratio closer to 1. The eyes-open task, on the other hand, exhibits a more uniform mu power across the trial with ratios for both groups approaching 1. While superficially the decrease in mu power for ASD and increase for TD as a result of training might seem antithetical to the divergence of the two populations in other electrophysiological measures, this may actually corroborate these findings. The direction of divergence is inversely correlated between the electrophysiology measures. The ambiguity between changes at different electrodes and diverging direction of responses further corroborates the need to examine physiological effects of NFT in EEG source space.
Although the results are consistent with the mirror neuron theory of autism, they demonstrate that this type of NFT affects ASD and TD groups differently. The ASD group showed increased or normalized mu suppression over centro-parietal and frontal electrodes following NFT suggesting greater engagement of the MNS. By contrast, the TD group showed reductions in mu suppression and therefore decreases in MNS engagement. More research is needed to tease these effects apart.
Acknowledgements
We also thank Yuan Yao (Lisa) for her help in organizing the data for statistical analysis. The behavioural analysis portion was partially the result of K.C.'s summer research experience in the Ronald E. McNair Postbaccalaureate Achievement Programme at the University of California, San Diego.
Funding statement
We thank the Congressionally Directed Medical Research Programme for an Autism Research Programme (ARP) Idea Award (AR093335) to J.P.
Reference
- 1.Abrahams BS, Geschwind DH. 2010. Connecting genes to brain in the autism spectrum disorders. Arch. Neurol. 67, 395–399. ( 10.1001/archneurol.2010.47) [DOI] [PMC free article] [PubMed] [Google Scholar]
- 2.Allely CS, Wilson P. 2011. Diagnosing autism spectrum disorders in primary care. Practitioner 255, 27–30. [PubMed] [Google Scholar]
- 3.Yoder P, Stone WL, Walden T, Malesa E. 2009. Predicting social impairment and ASD diagnosis in younger siblings of children with autism spectrum disorder. J. Autism Dev. Disord. 39, 1381–1391. ( 10.1007/s10803-009-0753-0) [DOI] [PMC free article] [PubMed] [Google Scholar]
- 4.Posthuma D, Polderman TJ. 2013. What have we learned from recent twin studies about the etiology of neurodevelopmental disorders? Curr. Opin. Neurol. 26, 111–121. ( 10.1097/WCO.0b013e32835f19c3) [DOI] [PubMed] [Google Scholar]
- 5.Chaste P, Leboyer M. 2012. Autism risk factors: genes, environment, and gene-environment interactions. Dialogues Clin. Neurosci. 14, 281–292. [DOI] [PMC free article] [PubMed] [Google Scholar]
- 6.Strom SP, Stone JL, ten Bosch JR, Merriman B, Cantor RM, Geschwind DH, Nelson SF. 2010. High-density SNP association study of the 17q21 chromosomal region linked to autism identifies CACNA1G as a novel candidate gene. Mol. Psychiatry 15, 996–1005. ( 10.1038/mp.2009.41) [DOI] [PMC free article] [PubMed] [Google Scholar]
- 7.Oberman LM, Hubbard EM, McCleery JP, Altschuler EL, Ramachandran VS, Pineda JA. 2005. EEG evidence for mirror neuron dysfunction in autism spectrum disorders. Cogn. Brain Res. 24, 190–198. ( 10.1016/j.cogbrainres.2005.01.014). [DOI] [PubMed] [Google Scholar]
- 8.Dapretto M, Davies MS, Pfeifer JH, Scott AA, Sigman M, Bookheimer SY, Iacoboni M. 2006. Understanding emotions in others: mirror neuron dysfunction in children with autism spectrum disorders. Nat. Neurosci. 9, 28–30. ( 10.1038/nn1611) [DOI] [PMC free article] [PubMed] [Google Scholar]
- 9.Le Bel RM, Pineda JA, Sharma A. 2009. Motor–auditory–visual integration: the role of the human mirror neuron system in communication and communication disorders. J. Commun. Disord. 42, 299–304. ( 10.1016/j.jcomdis.2009.03.011) [DOI] [PMC free article] [PubMed] [Google Scholar]
- 10.Williams JH, Whiten A, Suddendorf T, Perrett DI. 2001. Imitation, mirror neurons and autism. Neurosci. Biobehav. Rev. 25, 287–295. ( 10.1016/S0149-7634(01)00014-8) [DOI] [PubMed] [Google Scholar]
- 11.di Pellegrino G, Fadiga L, Fogassi L, Gallese V, Rizzolatti G. 1992. Understanding motor events: a neurophysiological study. Exp. Brain Res. 91, 176–180. ( 10.1007/BF00230027) [DOI] [PubMed] [Google Scholar]
- 12.Rizzolatti G, Craighero L. 2004. The mirror-neuron system. Annu. Rev. Neurosci. 27, 169–192. ( 10.1146/annurev.neuro.27.070203.144230) [DOI] [PubMed] [Google Scholar]
- 13.Pineda JA. 2005. The functional significance of mu rhythms: translating ‘seeing’ and ‘hearing’ into ‘doing’. Brain Res. Rev. 50, 57–68. ( 10.1016/j.brainresrev.2005.04.005) [DOI] [PubMed] [Google Scholar]
- 14.Carpenter M, Nagell K, Tomasello M. 1998. Social cognition, joint attention, and communicative competence from 9 to 15 months of age. Monogr. Soc. Res. Child Dev. 63, i–143. ( 10.2307/1166214) [DOI] [PubMed] [Google Scholar]
- 15.Baron-Cohen S. 2009. Autism: the empathizing-systemizing (E-S) theory. Ann. NY Acad. Sci. 1156, 68–80. ( 10.1111/j.1749-6632.2009.04467.x) [DOI] [PubMed] [Google Scholar]
- 16.Hickok G. 2009. Eight problems for the mirror neuron theory of action understanding in monkeys and humans. J. Cogn. Neurosci. 21, 1229–1243. ( 10.1162/jocn.2009.21189) [DOI] [PMC free article] [PubMed] [Google Scholar]
- 17.Turella L, Pierno AC, Tubaldi F, Castiello U. 2009. Mirror neurons in humans: consisting or confounding evidence? Brain Lang. 108, 10–21. ( 10.1016/j.bandl.2007.11.002) [DOI] [PubMed] [Google Scholar]
- 18.Hadjikhani N, Joseph RM, Snyder J, Tager-Flusberg H. 2006. Anatomical differences in the mirror neuron system and social cognition network in autism. Cereb. Cortex 16, 1276–1282. ( 10.1093/cercor/bhj069) [DOI] [PubMed] [Google Scholar]
- 19.Nishitani N, Avikainen S, Hari R. 2004. Abnormal imitation-related cortical activation sequences in Asperger's syndrome. Ann. Neurol. 55, 558–562. ( 10.1002/ana.20031) [DOI] [PubMed] [Google Scholar]
- 20.Bernier R, Dawson G, Webb S, Murias M. 2007. EEG mu rhythm and imitation impairments in individuals with autism spectrum disorder. Brain Cogn. 64, 228–237. ( 10.1016/j.bandc.2007.03.004) [DOI] [PMC free article] [PubMed] [Google Scholar]
- 21.Theoret H, Halligan E, Kobayashi M, Fregni F, Tager-Flusberg H, Pascual-Leone A. 2005. Impaired motor facilitation during action observation in individuals with autism spectrum disorder. Curr. Biol. 15, R84–R85. ( 10.1016/j.cub.2005.01.022) [DOI] [PubMed] [Google Scholar]
- 22.Rogers SJ, Pennington BF. 1991. A theoretical approach to the deficits in infantile autism. Dev. Psychopathol. 3, 137–162. ( 10.1017/S0954579400000043) [DOI] [Google Scholar]
- 23.Oberman LM, Ramachandran VS, Pineda JA. 2008. Modulation of mu suppression in children with autism spectrum disorders in response to familiar or unfamiliar stimuli: the mirror neuron hypothesis. Neuropsychologia 46, 1558–1565. ( 10.1016/j.neuropsychologia.2008.01.010) [DOI] [PubMed] [Google Scholar]
- 24.Raymaekers R, Wiersema JR, Roeyers H. 2009. EEG study of the mirror neuron system in children with high functioning autism. Brain Res. 1304, 113–121. ( 10.1016/j.brainres.2009.09.068) [DOI] [PubMed] [Google Scholar]
- 25.Muthukumaraswamy SD, Singh KD. 2008. Modulation of the human mirror neuron system during cognitive activity. Psychophysiology 45, 896–905. ( 10.1111/j.1469-8986.2008.00711.x) [DOI] [PubMed] [Google Scholar]
- 26.Arnstein D, Cui F, Keysers C, Maurits NM, Gazzola V. 2011. Mu-suppression during action observation and execution correlates with BOLD in dorsal premotor, inferior parietal, and SI cortices. J. Neurosci. 31, 14 243–14 249. ( 10.1523/JNEUROSCI.0963-11.2011) [DOI] [PMC free article] [PubMed] [Google Scholar]
- 27.Altschuler EL, Vankov A, Wang V, Ramachandran VS, Pineda JA. 1998. Person see, person do: human cortical electrophysiological correlates of monkey see monkey do cells? J. Cogn. Neurosci. 9(Suppl.), 91. [Google Scholar]
- 28.Pfurtscheller G, Neuper C, Krausz G. 2000. Functional dissociation of lower and upper frequency mu rhythms in relation to voluntary limb movement. Clin. Neurophysiol. 111, 1873–1879. ( 10.1016/S1388-2457(00)00428-4) [DOI] [PubMed] [Google Scholar]
- 29.Pineda JA, Allison BZ, Vankov A. 2000. The effects of self-movement, observation, and imagination on mu rhythms and readiness potentials (RPs): toward a brain-computer interface (BCI). IEEE Trans. Rehabil. Eng. 8, 219–222. ( 10.1109/86.847822) [DOI] [PubMed] [Google Scholar]
- 30.Francuz P, Zapala D. 2011. The suppression of the mu rhythm during the creation of imagery representation of movement. Neurosci. Lett. 495, 39–43. ( 10.1016/j.neulet.2011.03.031) [DOI] [PubMed] [Google Scholar]
- 31.Gastaut H. 1952. Etude electrocorticographique de la reactivite des rhythmes rolandiques. Rev. Neurol. 87, 176–182. [PubMed] [Google Scholar]
- 32.Gastaut HJ, Bert J. 1954. EEG changes during cinematographic presentation. Electroencephalogr. Clin. Neurophysiol. 6, 433–444. ( 10.1016/0013-4694(54)90058-9) [DOI] [PubMed] [Google Scholar]
- 33.Cochin S, Barthelemy C, Roux S, Martineau J. 1999. Observation and execution of movement: similarities demonstrated by quantified electroencephalography. Eur. J. Neurosci. 11, 1839–1842. ( 10.1046/j.1460-9568.1999.00598.x) [DOI] [PubMed] [Google Scholar]
- 34.Sichel AG. 1995. Positive outcome with neurofeedback treatment in a case of mild autism. J. Neurother. 1, 60–64. ( 10.1300/J184v01n01_08) [DOI] [Google Scholar]
- 35.Jarusiewicz B. 2003. Efficacy of neurofeedback for children in the autistic spectrum: a pilot study. Appl. Psychophysiol. Biofeedback 28, 311. [Google Scholar]
- 36.Pineda JA, et al. 2008. Positive behavioral and electrophysiological changes following neurofeedback training in children with autism. Res. Austism Spectr. Disord. 2, 557–581. ( 10.1016/j.rasd.2007.12.003) [DOI] [Google Scholar]
- 37.Kouijzer MEJ, de Moor JMH, Gerrits BJL, Buitelaar JK, van Schie HT. 2009. Long-term effects of neurofeedback treatment in autism. Res. Austism Spectr. Disord. 3, 496–501. ( 10.1016/j.rasd.2008.10.003) [DOI] [Google Scholar]
- 38.Rossignol DA. 2009. Novel and emerging treatments for autism spectrum disorders: a systematic review. Ann. Clin. Psychiatry 21, 213–236. [PubMed] [Google Scholar]
- 39.Coben R, Myers TE. 2010. The relative efficacy of connectivity guided and symptom based EEG biofeedback for autistic disorders. Appl. Psychophysiol. Biofeedback 35, 13–23. ( 10.1007/s10484-009-9102-5) [DOI] [PubMed] [Google Scholar]
- 40.Pineda JA, Juavinett A, Datko M. 2012. Self-regulation of brain oscillations as a treatment for aberrant brain connections in children with autism. Med. Hypotheses 79, 790–798. ( 10.1016/j.mehy.2012.08.031) [DOI] [PubMed] [Google Scholar]
- 41.Gomot M, Wicker B. 2012. A challenging, unpredictable world for people with autism spectrum disorder. Int. J. Psychophysiol. 83, 240–247. ( 10.1016/j.ijpsycho.2011.09.017) [DOI] [PubMed] [Google Scholar]
- 42.Townsend J, Westerfield M, Leaver E, Makeig S, Jung T-P, Pierce K, Courchesne E. 2001. Event-related brain response abnormalities in autism: evidence for impaired cerebello-frontal spatial attention networks. Brain Res. Cogn. Brain Res. 11, 127–145. ( 10.1016/S0926-6410(00)00072-0) [DOI] [PubMed] [Google Scholar]
- 43.Fuchs T, Birbaumer N, Lutzenberger W, Gruzelier JH, Kaiser J. 2013. Neurofeedback treatment for attention-deficit/hyperactivity disorder in children: a comparison with methylphenidate. Appl. Psychophysiol. Biofeedback 28, 1–12. ( 10.1023/A:1022353731579) [DOI] [PubMed] [Google Scholar]
- 44.Heinrich H, Gevensleben H, Freisleder FJ, Moll GH, Rothenberger A. 2004. Training of slow cortical potentials in attention-deficit/hyperactivity disorder: evidence for positive behavioral and neurophysiological effects. Biol. Psychiatry 55, 772–775. ( 10.1016/j.biopsych.2003.11.013) [DOI] [PubMed] [Google Scholar]
- 45.Lubar JO, Lubar JF. 1984. Electroencephalographic biofeedback of SMR and beta for treatment of attention deficit disorders in a clinical setting. Biofeedback Self Regul. 9, 1–23. ( 10.1007/BF00998842) [DOI] [PubMed] [Google Scholar]
- 46.Lubar JF, Shabsin HS, Natelson SE, Holder GS, Whitsett SF, Pamplin WE, Krulikowski DI. 1981. EEG operant conditioning in intractable epileptics. Arch. Neurol. 38, 700–704. ( 10.1001/archneur.1981.00510110060009) [DOI] [PubMed] [Google Scholar]
- 47.Monderer RS, Harrison DM, Haut SR. 2002. Neurofeedback and epilepsy. Epilepsy Behav. 3, 214–218. ( 10.1016/S1525-5050(02)00001-X) [DOI] [PubMed] [Google Scholar]
- 48.Sterman MB. 2000. Basic concepts and clinical findings in the treatment of seizure disorders with EEG operant conditioning. Clin. Electroencephalogr. 31, 45–55. [DOI] [PubMed] [Google Scholar]
- 49.Sterman MB, Friar L. 1972. Suppression of seizures in an epileptic following sensorimotor EEG feedback training. Electroencephalogr. Clin. Neurophysiol. 33, 89–95. ( 10.1016/0013-4694(72)90028-4) [DOI] [PubMed] [Google Scholar]
- 50.Schoenberger NE, Shif SC, Esty ML, Ochs L, Matheis RJ. 2001. Flexyx Neurotherapy System in the treatment of traumatic brain injury: an initial evaluation. J. Head Trauma Rehabil. 16, 260–274. ( 10.1097/00001199-200106000-00005) [DOI] [PubMed] [Google Scholar]
- 51.Wing K. 2001. Effect of neurofeedback on motor recovery of a patient with brain injury: a case study and its implications for stroke rehabilitation. Top. Stroke Rehabil. 8, 45–53. ( 10.1310/4G2F-5PLV-RNM9-BGGN) [DOI] [PubMed] [Google Scholar]
- 52.Moore NC. 2000. A review of EEG biofeedback treatment of anxiety disorders. Clin. Electroencephalogr. 31, 1–6. [DOI] [PubMed] [Google Scholar]
- 53.Sokhadze TM, Cannon RL, Trudeau DL. 2008. EEG biofeedback as a treatment for substance use disorders: review, rating of efficacy, and recommendations for further research. Appl. Psychophysiol. Biofeedback 33, 1–28. ( 10.1007/s10484-007-9047-5) [DOI] [PMC free article] [PubMed] [Google Scholar]
- 54.Neuper C, Wortz M, Pfurtscheller G. 2006. ERD/ERS patterns reflecting sensorimotor activation and deactivation. Prog. Brain Res. 159, 211–222. ( 10.1016/S0079-6123(06)59014-4) [DOI] [PubMed] [Google Scholar]
- 55.Lopes da Silva FH, Vos JE, Mooibroek J, van Rotterdam A. 1980. Relative contributions of intracortical and thalamo-cortical processes in the generation of alpha rhythms, revealed by partial coherence analysis. Electroencephalogr. Clin. Neurophysiol. 50, 449–456. ( 10.1016/0013-4694(80)90011-5) [DOI] [PubMed] [Google Scholar]
- 56.Gallese V. 2003. The roots of empathy: the shared manifold hypothesis and the neural basis of intersubjectivity. Psychopathology 36, 171–180. ( 10.1159/000072786) [DOI] [PubMed] [Google Scholar]
- 57.Iacoboni M, Dapretto M. 2006. The mirror neuron system and the consequences of its dysfunction. Nat. Rev. Neurosci. 7, 942–951. ( 10.1038/nrn2024) [DOI] [PubMed] [Google Scholar]
- 58.Martineau J, Andersson F, Barthelemy C, Cottier JP, Destrieux C. 2010. Atypical activation of the mirror neuron system during perception of hand motion in autism. Brain Res. 1320, 168–175. ( 10.1016/j.brainres.2010.01.035) [DOI] [PubMed] [Google Scholar]
- 59.Baron-Cohen S. 1995. Mindblindness: an essay on autism and theory of mind. Cambridge, MA: MIT Press. [Google Scholar]
- 60.Umilta MA, Kohler E, Gallese V, Fogassi L, Fadiga L, Keysers C, Rizzolatti G. 2001. I know what you are doing. A neurophysiological study. Neuron 31, 155–165. ( 10.1016/S0896-6273(01)00337-3) [DOI] [PubMed] [Google Scholar]
- 61.Keysers C, Kohler E, Umilta MA, Nanetti L, Fogassi L, Gallese V. 2003. Audiovisual mirror neurons and action recognition. Exp. Brain Res. 153, 628–636. ( 10.1007/s00221-003-1603-5) [DOI] [PubMed] [Google Scholar]
- 62.Iacoboni M, Molnar-Szakacs I, Gallese V, Buccino G, Mazziotta JC, Rizzolatti G. 2005. Grasping the intentions of others with one's own mirror neuron system. PLoS. Biol. 3, e79 ( 10.1371/journal.pbio.0030079) [DOI] [PMC free article] [PubMed] [Google Scholar]
- 63.Siegel DJ. 2010. Commentary on ‘integrating interpersonal neurobiology with group psychotherapy’: reflections on mind, brain, and relationships in group psychotherapy. Int. J. Group Psychother. 60, 483–485. ( 10.1521/ijgp.2010.60.4.483) [DOI] [PubMed] [Google Scholar]
- 64.Keuken MC, Hardie A, Dorn BT, Dev S, Paulus MP, Jonas KJ, Den Wildenberg WP, Pineda JA. 2011. The role of the left inferior frontal gyrus in social perception: an rTMS study. Brain Res. 1383, 196–205. ( 10.1016/j.brainres.2011.01.073) [DOI] [PubMed] [Google Scholar]
- 65.Coben R, Linden M, Myers TE. 2010. Neurofeedback for autistic spectrum disorder: a review of the literature. Appl. Psychophysiol. Biofeedback 35, 83–105. ( 10.1007/s10484-009-9117-y) [DOI] [PubMed] [Google Scholar]
- 66.Pfurtscheller G, Neuper C, Andrew C, Edlinger G. 1997. Foot and hand area mu rhythms. Int. J. Psychophysiol. 26, 121–135. ( 10.1016/S0167-8760(97)00760-5) [DOI] [PubMed] [Google Scholar]
- 67.Hari R, Salmelin R, Makela JP, Salenius S, Helle M. 1997. Magnetoencephalographic cortical rhythms. Int. J. Psychophysiol. 26, 51–62. ( 10.1016/S0167-8760(97)00755-1) [DOI] [PubMed] [Google Scholar]
- 68.Nunez PL, Wingeier BM, Silberstein RB. 2001. Spatial-temporal structures of human alpha rhythms: theory, microcurrent sources, multiscale measurements, and global binding of local networks. Hum. Brain Mapp. 13, 125–164. ( 10.1002/hbm.1030) [DOI] [PMC free article] [PubMed] [Google Scholar]
- 69.Babiloni C, et al. 2006. Sources of cortical rhythms in adults during physiological aging: a multicentric EEG study. Hum. Brain Mapp. 27, 162–172. ( 10.1002/hbm.20175) [DOI] [PMC free article] [PubMed] [Google Scholar]
- 70.Oberman LM, Pineda JA, Ramachandran VS. 2006. The human mirror neuron system: a link between action observation and social skills. Soc. Cog. Affect. Neurosci. 2, 62–66. ( 10.1093/scan/nsl022) [DOI] [PMC free article] [PubMed] [Google Scholar]
- 71.Michel CM, Murray MM, Lantz G, Gonzalez S, Spinelli L, Grave de Peralta R. 2004. EEG source imaging. Clin. Neurophysiol. 115, 2195–2222. ( 10.1016/j.clinph.2004.06.001) [DOI] [PubMed] [Google Scholar]
- 72.Acar ZA, Makeig S. 2010. Neuroelectromagnetic forward head modeling toolbox. J. Neurosci. Methods 190, 258–270. ( 10.1016/j.jneumeth.2010.04.031) [DOI] [PMC free article] [PubMed] [Google Scholar]