Abstract
Gamma oscillations of the local field potential are organized by collective dynamics of numerous neurons and have many functional roles in cognition and/or attention. To mathematically and physiologically analyse relationships between individual inhibitory neurons and macroscopic oscillations, we derive a modification of the theta model, which possesses voltage-dependent dynamics with appropriate synaptic interactions. Bifurcation analysis of the corresponding Fokker–Planck equation (FPE) enables us to consider how synaptic interactions organize collective oscillations. We also develop the adjoint method (infinitesimal phase resetting curve) for simultaneous equations consisting of ordinary differential equations representing synaptic dynamics and a partial differential equation for determining the probability distribution of the membrane potential. This method provides a macroscopic phase response function (PRF), which gives insights into how it is modulated by external perturbation or internal changes of parameters. We investigate the effects of synaptic time constants and shunting inhibition on these gamma oscillations. The sensitivity of rising and decaying time constants is analysed in the oscillatory parameter regions; we find that these sensitivities are not largely dependent on rate of synaptic coupling but, rather, on current and noise intensity. Analyses of shunting inhibition reveal that it can affect both promotion and elimination of gamma oscillations. When the macroscopic oscillation is far from the bifurcation, shunting promotes the gamma oscillations and the PRF becomes flatter as the reversal potential of the synapse increases, indicating the insensitivity of gamma oscillations to perturbations. By contrast, when the macroscopic oscillation is near the bifurcation, shunting eliminates gamma oscillations and a stable firing state appears. More interestingly, under appropriate balance of parameters, two branches of bifurcation are found in our analysis of the FPE. In this case, shunting inhibition can effect both promotion and elimination of the gamma oscillation depending only on the reversal potential.
Keywords: neuronal population, gamma oscillation, macroscopic phase response function, adjoint method, sparse firing
1. Introduction
It is known that various biological systems use collective rhythms that are composed of noisy individual oscillations with their complex interactions [1–4]. Among them, local circuits in the cerebral cortex and hippocampus consist of thousands of interacting excitatory and inhibitory neurons that together often generate macroscopic oscillations called the local field potential (LFP). Many recent experiments have shown that gamma oscillations (30–80 Hz) of the LFP may play functional roles in cognition and/or attention [1,5–7]. Furthermore, inhibitory neurons are known to be a key factor for gamma oscillations [5,8–12], which emerge in the LFP even when individual neurons do not fire at every gamma cycle [13,14]. This phenomenon is sometimes called sparse firing. Because of the difficulty of mathematical treatments of this type of activity, much remains unknown about the relationship between the physiological properties of synaptic interactions and macroscopic gamma oscillations. The relationship between external inputs (or changes of internal state) and macroscopic response also remains unclear.
In the case of a limit cycle oscillator, the phase response function (PRF), which is also called the infinitesimal phase resetting curve [15], is a powerful tool for investigating how such rhythms are modulated by external interactions [16,17]. With respect to the PRF for population activity, theoretical studies have used the Fokker–Planck equation (FPE) [18–20] to derive macroscopic PRFs and have shed light on the theoretical relationships between the microscopic oscillations and the macroscopic ones. Furthermore, a recent experimental study determined the macroscopic PRF in a local neuronal population in the CA3 region of the hippocampus [21]. Therefore, it is important to develop theoretical frameworks including the derivation of the macroscopic PRFs to achieve an in-depth understanding of the mathematical and physiological relationships between individual neurons or synapses and macroscopic oscillations.
In this study, we focused on a neuron model, the so-called theta model, which has the simplest form as well as equivalent dynamics to the conductance-based Class I neuron models because it is mathematically the normal form of the saddle-node infinite period [15]. We then derived a version of the theta model that incorporates conductance-based synapses, but remains tractable for numerical and mathematical analysis. The advantage of the theta model is that the resulting FPE lies on a circle (periodic boundary conditions) so that there are no discontinuities (as in leaky integrate-and-fire (LIF) models). Furthermore, the continuous nature of the system and its periodicity in phase space allow us to define a related adjoint operator and thus compute macroscopic PRFs. In addition, we can also use numerical continuation to study bifurcations in the model. The model also retains the physiological properties of conductance-based synapses so that properties like shunting inhibition can be analysed.
Next, to obtain macroscopic PRFs for the neuronal population model, the adjoint method was developed for simultaneous equations composed of ordinary differential equations (ODEs) for synaptic dynamics and a partial differential equation (PDE) for determining the probability distribution of the membrane dynamics. After confirming the validity of the proposed analytical frameworks, we focused on the case of an inhibitory population and used the macroscopic PRFs and bifurcation diagrams to investigate how the synaptic rising time constant, synaptic decaying time constant and shunting inhibition affected the macroscopic gamma oscillations. We finally studied locking to periodic stimuli.
2. Material and methods
2.1. Derivation of the modified theta model
We consider a homogeneous network of N = 1000 inhibitory neurons as described by the quadratic integrate-and-fire (QIF) model. The QIF model is a representative model of Class I neurons and is widely used for computational studies [22–24]. Here, V(i)(t) denotes the potential of the ith neuron at time t. Then, the dynamics of V(i)(t) are represented as
 |
2.1 |
where ξ represents stochastic fluctuations with  and
and 
 is the magnitude of the fluctuation, C = 1 μF cm−2 is the membrane capacitance and I (μA cm−2) is a constant current. gL = 0.1 mS cm−2 is the leak conductance and gsyn is the synaptic conductances. In absence of synapses and external current, the firing threshold is VT = −55 mV. That is, when V(t) crosses the threshold, then the voltage grows faster than exponentially and blows up to infinity in a finite amount of time. At this point, V(t) is then reset to −∞ where it will then tend towards VR. The resting potential VR is −62 mV. The reversal potential of inhibitory synaptic currents is Vsyn = −70 mV.
The dynamics of the GABAergic (GABAA) synaptic conductances  are second-order exponentials
 |
2.2 |
where t(k) is the firing time of the pre-synaptic cell, τr = 0.5 ms is a rise time and τd = 5 ms is a decay time [25]. To match the peak conductance of GABA on interneurons to 6.2 nS, which is based on the earlier model and experimental studies [25–27], we set 2.9 × 10⁻⁴ cm2 as the area of a neuron [28] and thus obtained the value  Under the condition that the synaptic connections between neurons are random with a probability of psyn, it is known that the synaptic influence on each neuron can be homogenized as an approximation [25]. Then, the above equation reads as
 |
2.3 |
Here, we introduce θ that satisfies the relation
| 2.4 |
Then, equation (2.1) reads as
 |
2.5 |
We call this the modified theta model because it is a physiologically precise version of the theta model, which is well known as a reduced model of Class I neurons [15]. It should be noted that the conversion to the modified phase model is valid even under strong noise or synaptic interactions because it is not derived from a phase reduction, which is valid only in the case of weak interactions [11,29,30], but rather by the transformation of variables.
2.1.1. Fokker–Planck equation and macroscopic phase reduction by the adjoint method
We developed an appropriate adjoint method for the population of the neurons, each of which is described by the modified theta model (equations (2.3) and (2.5)). First, we set the current I = 2, noise intensity σ = 2 and probability of connections psyn = 0.2 as nominal values. Physiologically, I, σ and psyn depend on the state of neurons and networks; therefore, they should be treated more flexibly compared with other parameters. The FPE [31,32] of the neurons and synaptic equation are described as
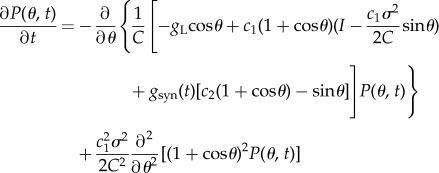 |
2.6 |
and
| 2.7 |
where c1 = 2/(VT − VR), c2 = (2Vsyn − VR − VT)/(VT − VR), c3 = −1/τrτd, c4 = −(τr + τd)/τrτd,  nsyn = psyn × N = 0.2 × 1000 = 200 and A(t) is a firing probability of neurons. Because A(t) is obtained by the flux at θ = π [18,33], it satisfies A(t) = gLP(π,t)/C.
By introducing G = (g1, g2)T = (gsyn, dgsyn/dt)T, the synaptic dynamics can be re-written as
| 2.8 |
The adjoint method is a useful analytical method for deriving the PRF from a limit cycle oscillator [15]. Recently, it has been extended to the FPE by Kawamura et al. [19,20]. In the case of our population model (equations (2.6) and (2.7)), the adjoint equation and the dual product for the adjoint method should be derived as a combination of the conventional adjoint method for ODE [15] and the adjoint method for PDE, which was recently developed [19,20]. First, we introduce P0(θ, t) and G0(t) = (g0(t), dg0(t)/dt)T as the limit cycle solution for P and G. They are defined in the region of 0 ≤ t < Tmacro, where Tmacro is the period of the limit cycle oscillation.
In this article, t = 0 is set so that P0(π, t = 0) is the maximum firing probability. P0 and G0 satisfy the relations
 |
2.9 |
and
| 2.10 |
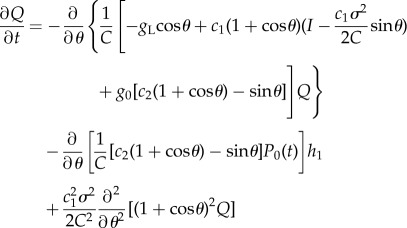
We then decompose P(θ, t) and G as P(θ, t) = P0(θ, t) + Q(θ, t) and G = G0 + H with H = (h1, h2)T, respectively. The linearized equations for Q(θ, t) and H are
 |
2.11 |
| 2.12 |
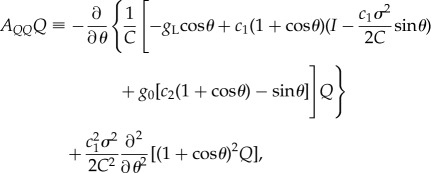
These equations can be rewritten in matrix representation as
| 2.13 |
where
 |
2.14 |
 |
2.15 |
| 2.16 |
| 2.17 |
The phase space of equation (2.13), C0, is the direct sum of two subspaces of C1 and C2 as
| 2.18 |
| 2.19 |
| 2.20 |
Then, their dual spaces are defined as
| 2.21 |
| 2.22 |
| 2.23 |
It can be analytically confirmed that 
 is a solution of equation (2.13).
From equation (2.13), the linear operator for this phase space is given as
| 2.24 |
By defining the dual product as
| 2.25 |
the adjoint operator L* is determined by the relation
| 2.26 |
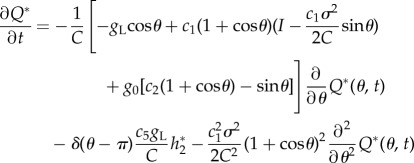
and the adjoint equation  is derived as
 |
2.27 |
and
 |
2.28 |
We need the zero eigensolutions of the adjoint equation,  and
and  with the normalizing condition
| 2.29 |
In actual calculations, we integrate equations (2.27) and (2.28) backwards in time from arbitrary initial conditions to obtain the zero eigensolution (i.e.  and
and  ) of the adjoint equation, because functional components other than the zero eigensolution have positive eigenvalues; therefore, they eventually vanish (in reverse time).1
2.1.2. Macroscopic phase response function
Here, we consider the macroscopic PRF. When the external perturbation is added to the equation of synapses, the macroscopic PRF is simply provided by  On the other hand, when the external perturbation is applied to all of the neurons, the macroscopic PRF is obtained as
| 2.30 |
where u(θ) = c1(1 + cosθ)/C is the sensitivity of a single neuron to the phase θ [20]. This equation provides unique insights into how the external perturbations and/or changes of internal states affect macroscopic properties of gamma oscillations and will be discussed in following sections.
3. Results
In order to study the dynamics of large networks of neurons with synaptic coupling, we have extended the so-called theta model (a continuous version of the QIF) to incorporate conductance-based synapses. We did this in order to explore how aspects of synaptic coupling, for example shunting inhibition, affect the ability of inhibitory networks to produce population rhythms. The advantages of the theta model over other simple spiking models are that the model is continuous and certain numerical computations are much easier. For large numbers of neurons with random coupling, we can reduce the system to a single PDE for the firing rate and synaptic activity (see Material and methods). We can thus turn the focus onto the dynamics of a deterministic system for which there are many available tools.
3.1. Population dynamics of the modified theta models
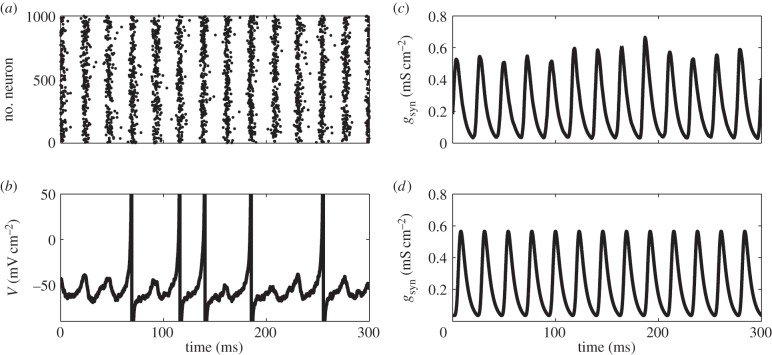
The numerical computation results for the population of the modified theta models (equations (2.3) and (2.5)) with nominal values of parameters are shown in figure 1a,c, where the macroscopic gamma oscillation can be observed. In figure 1c, we plot the total synaptic conductance as a macroscopic version of the population dynamics. Figure 1b shows an example of the membrane potential of a single neuron, which is obtained by reversal transform of equation (2.4). We can see that in this parameter set, there is sparse firing in which the individual neurons do not fire at every gamma cycle. We also confirmed that the numerical simulation of the corresponding FPE (equations (2.6) and (2.7)) accurately matches the simulated population dynamics (figure 1d). Because our model does not incorporate the effect of resetting and a refractory period, an equivalent representation of this model with resetting and a refractory period is discussed in the electronic supplementary material, text S1 and figure S1.
Figure 1.
(a) A typical example of the raster plot of the population of modified theta model. (b) Time course of membrane potential of one representative neuron in (a), which is obtained by reversal transform of equation (2.4). Note that individual neurons do not fire in each gamma cycle observed in (a). (c) Time course of the averaged synaptic conductance gsyn. (d) Time course of gsyn obtained by the corresponding FPE. Note that the time course given by the neuronal model population (c) and by FPE (d) are in a good agreement. All simulations in this figure are executed with nominal values of parameters as C = 1, gL = 0.1, VT = −55, VR = − 62, Vsyn = − 70, τr = 0.5, τd = 5,  I = 2, σ = 2 and psyn = 0.2.
3.2. Bifurcation diagrams of gamma oscillation
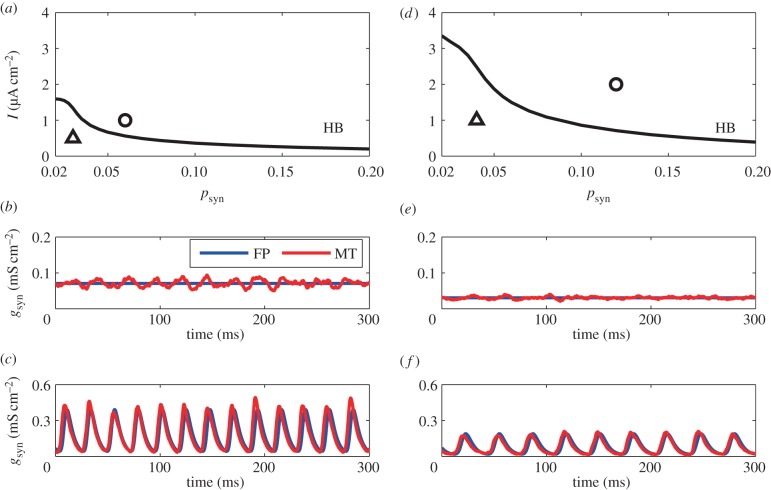
As we are looking only at an inhibitory network (with no ‘exotic’ currents like the calcium T-current), the network needs tonic drive and feedback inhibition in order to produce population rhythms. Thus, with no synaptic coupling or with reduced drive, the network will produce asynchronous constant in time dynamics. However, as the drive increases and with sufficient negative feedback, a population rhythm emerges through a loss of stability of the constant asynchronous state via a Hopf bifurcation (HB). Thus, we wish to study the stability of the constant asynchronous state as the drive and negative feedback change. The parameter regions for macroscopic gamma oscillations can be identified by bifurcation analyses of the discretized FPEs [31,34].1 We chose the applied current, I, and the connection probability, psyn, as two parameters of interest. We note that psyn essentially sets the magnitude of the synaptic connections via the quantity c5 in the FPE (equations (2.6) and (2.7)). By varying, say, I with psyn fixed, we detect HBs. We then compute a two-parameter curve of HBs as a function of the two parameters I and psyn. Figure 2a,d shows the two-parameter curve for noise amplitudes, σ = 1, 2. Below the curve (small inputs and sparse connectivity), the constant asynchronous state is stable and above it, there will be oscillations in gsyn and thus any macroscopic measure of the behaviour. We also see that the numerical computations of the modified theta models (equations (2.3) and (2.5)) follow the bifurcation analyses and the numerical solutions of the FPE. The small fluctuations in both the stable regions (figure 2b,e) and the gamma oscillatory region (figure 2c,f) are due to the finite-size effect. We note that the curve of HBs is raised up in the higher noise case which means that larger inputs and more densely connected networks are needed for gamma oscillations to emerge and overcome the stability of the asynchronous state.
Figure 2.
(a) Bifurcation diagram with σ = 1. HB, Hopf bifurcation. (b,c) Time course of the averaged conductance gsyn in the stable region (b) and unstable region (c) by the Fokker–Planck (FP) equation and the modified theta (MT) model. (psyn, I) = (0.03, 0.5), plotted as a triangle in (a), are adopted for (b) and (psyn, I) = (0.06, 1.0), circle in (a), are adopted for (c). (d) Bifurcation diagram with σ = 2. HB, Hopf bifurcation. (e,f) Time course of the averaged conductance gsyn in the stable region (e) and unstable region (f) by the FP equation and the MT model. (psyn, I) = (0.04, 1.0), plotted as a triangle in (d), are adopted for (e) and (psyn, I) = (0.12, 2.0), circle in (a), are adopted for (f). Besides σ, psyn and I, parameters in this figure are set as nominal values (i.e. the same as figure 1). (Online version in colour.)
3.3. Macroscopic phase response function by the adjoint method
The adjoint method provides a rigorous technique for the determination of the PRF and has been successfully applied to individual neural oscillators. The PRF of an oscillating system measures the shift in timing of the oscillation owing to a stimulus delivered at a specified phase in the ongoing oscillation. The solution to the adjoint equation is proportional to the PRF when the perturbations are small and, thus, the PRF is useful in determining, for example, how changes in the parameters affect the frequency of an oscillator or whether or not it will lock onto a periodic stimulus. For the coupled PDE/ODE system in our population model, obtaining the adjoint solution requires solving a certain linear PDE along with some normalization requirements. We solve the linear PDE by backwards integration (see Material and methods) and to check whether we have found the correct solution, we need to look at an inner product that involves both the solution to the adjoint and the population oscillation. We confirmed the validity of the adjoint method developed in this study by the dual product of the zero eigensolution and its dual and comparison with the phase shift occurring when a perturbation is applied. Figure 3a shows a two-dimensional solution  of the adjoint method, and figure 3b shows one-dimensional solutions of
  To check the numerical computation, we checked to see whether equations (2.25) and (2.29) were satisfied for each state on the limit cycle orbit. Figure 3c shows that the sum of the two terms corresponding to
  and
and  is, indeed, constant for all time.
Figure 3.
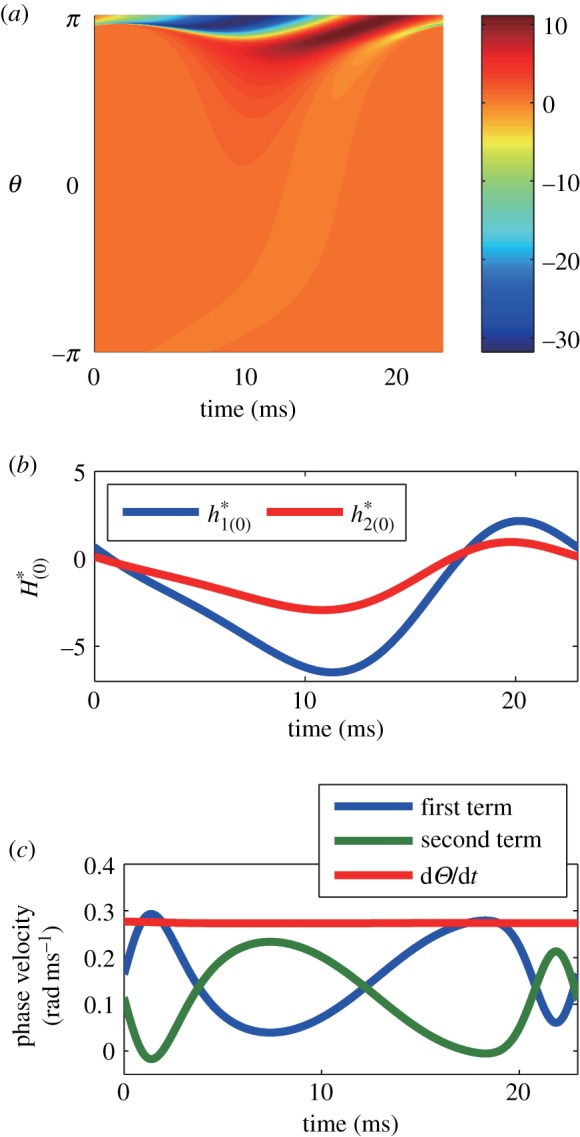
(a,b) A zero eigensolution of the adjoint equation. (a) is  and (b) is
  (c) Dual product of zero eigensolution and its dual. The red line is the total sum of the dual product defined in equation (2.25), while the blue line is the first term and the green one is the second term. The flatness of the red line suggests that the macroscopic phase advances constantly in time and consequently indicates the appropriateness of the adjoint method. Parameters in this figure are set as nominal values.
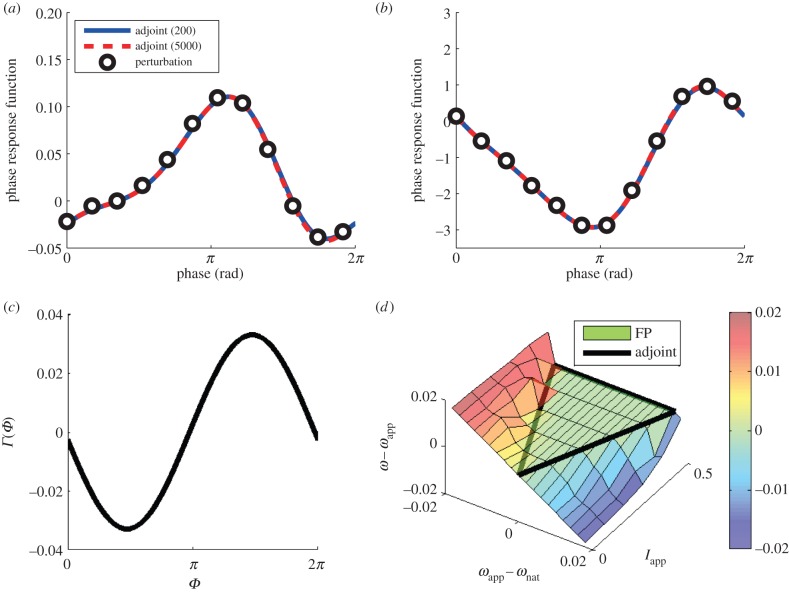
Equation (2.30) provides a formula for the PRF of the network when an identical current perturbation is applied to every cell. Thus, we can compare this bulk PRF to the phase shifts induced by a direct perturbation of the network with a short current injection. Therefore, another confirmation of the adjoint method was performed by comparison with PRFs by direct perturbation of the FPE (equations (2.6) and (2.7)) and the results are shown in figure 4a. We applied a square wave (amplitude 50, duration 0.01 ms) current pulse to the whole population at different points in the cycle and used this to compute the phase shift and the approximate PRF. Both PRFs determined by the adjoint method (with discretization of the PDE into 200 and 5000 bins) coincided with the results obtained by the direct perturbation of the FPE, which again indicated the appropriateness of the adjoint method. Similarly, the validity of  was confirmed by the perturbation (amplitude 2, duration 0.01 ms) to the left hand side of equation (2.7) (figure 4b).
Figure 4.
(a,b) Macroscopic PRFs by perturbations to I in (a) and the synaptic function (i.e. the left hand side of equation (2.7)) in (b). The black open circles are the results of direct perturbations of the FPE (equations (2.6) and (2.7)). The blue solid line shows the macroscopic PRF by the adjoint method with 5000 bins for dividing the phase (−π, π], while the red dotted line shows that with 200 bins. In (a,b), the adjoint method matches the result of the direct perturbation of the FPE. The agreement of the adjoint method with 200 and 5000 bins indicates that 200 bins is enough to calculate macroscopic PRFs. (c) The phase coupling function against oscillatory sinusoidal inputs. (d) The frequency differences between applied oscillation and numerically obtained gamma oscillation by equations (2.6), (2.7) and (3.1) with different inputs of amplitude and frequency. The region that is inside of the black thick lines is the analytically derived synchronized region by the phase reduction theory. There is no frequency difference inside of the black triangle, indicating synchronization is confirmed by the numerical computation of the FPE. Parameters in this figure are set as nominal values without oscillatory current I in (d).
One of the main purposes for computing the PRF is to study the effects of coupling and periodic forcing of oscillatory systems. Coupling between inhibitory networks could be studied using this method, but, as most coupling between populations is mediated by excitatory outputs, we will not pursue the coupled problem further. However, periodic driving can also be analysed using the method and the experimental driving of inhibitory populations is possible [12]. Thus, to further test the utility of the adjoint method as a means of studying populations, we applied a weak sinusoidal current to the full population. We used current I(t) in equation (2.6) as
| 3.1 |
where I0 = 2 and Iapp and ωapp are the amplitude and frequency of the sinusoidal oscillation, respectively. The region of synchronization can be analytically estimated by the phase coupling function obtained by convolving the periodic current with the PRF [16,17]. The coupling function is defined as
| 3.2 |
where Zmacro(Θ) is the macroscopic PRF equation (2.30). Γ(Φ) is shown in figure 4c. The maximum and the minimum value of Γ indicate tolerance of frequency mismatches between ωapp and the natural frequency of gamma oscillation without oscillatory inputs, ωnat, for synchronization to a unit amplitude of oscillation (i.e. Iapp = 1). That is, if the frequency difference is greater or less than the magnitude of Γ, then 1 : 1 locking is not possible.
Figure 4d shows the result of both the theory based on equation (3.2) and direct simulation of the FPE. We plot the difference between the network frequency and the forcing frequency as a function of the difference between the natural (with Iapp = 0) and the forcing frequency. We can see that the synchronized region by numerical computations matches the analytical prediction, which is inside of the black thick lines.
3.4. Modulation of gamma oscillation by varying synaptic time constants
We used the macroscopic PRF obtained by adjoint method to predict the effect of changing the synaptic time constant on the frequency of gamma oscillation.
We denote Rr(t) as the sensitivity of the small change in τr to d2g/dt2. This sensitivity can be derived as the partial differentiation of d2g0/dt2 by τr and turns out to be
| 3.3 |
Therefore, the frequency changes of the macroscopic oscillation are evaluated as
| 3.4 |
Similarly, the influence of τd on the period of the macroscopic oscillations can be obtained by
| 3.5 |
with
| 3.6 |
Figure 5 shows the frequency of the macroscopic oscillation with different values of τr and τd obtained by numerical computation of the population of the modified theta model as well as those analytically predicted by the phase reduction. The slopes of the straight lines were obtained by equations (3.4) and (3.5) with the nominal values of parameters (τr = 0.5 and τd = 5). In both cases in which τr and τd were changed, the numerical computations matched the analytical predictions provided by the phase reduction across almost the entire region. The discrepancy at τr = 0.1 could be due to the fact that τr is getting close to zero where the model is singular. The plots nevertheless show that the population PRF can be used to estimate the frequency dependence on the characteristics of the synaptic inhibition.
Figure 5.
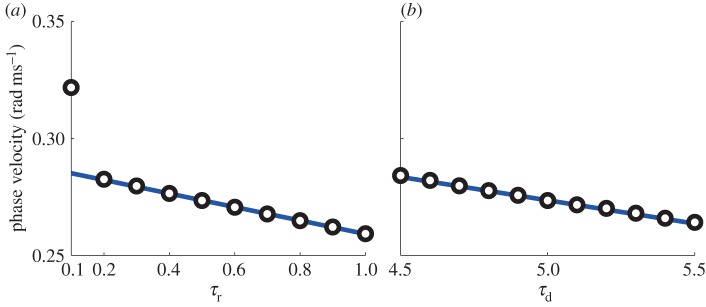
Period of the macroscopic oscillations by changing τr (a) and τd (b). The circles are obtained by the direct numerical computations of the population of the modified theta model, while the solid lines are analytical predictions by the adjoint method. (Online version in colour.)
To capture the influence of changing τr and τd on the macroscopic frequency in a wide parameter range of gamma oscillation, we evaluated Δωr and Δωd as
 |
3.7 |
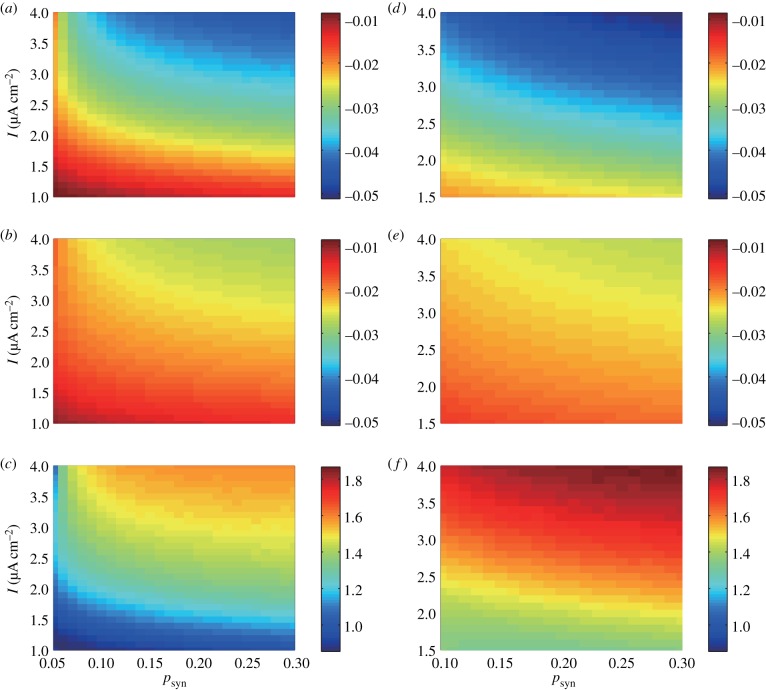
by the adjoint method when changing I and psyn with different values of σ (figure 6a,b,d,e). We confirmed that the signs of Δωr and Δωd were always negative over the entire regions shown in figure 6. In addition, Δωr/Δωd (figure 6c,f) varies between 0.85 and 1.87. It was larger than 1 over the almost the entire regions. However, it was smaller than 1 with I ≃ 1 and σ = 1. In general, Δωr/Δωd increased with increasing I and σ, whereas it was less affected by psyn.
Figure 6.
(a,b) Δωr in (a) and Δωd in (b) with σ = 1. (d,e) Δωr in (d) and Δωd in (e) with σ = 2. (c,f) Ratio of the influence of changing synaptic time constant to gamma oscillation frequency (Δωr/Δωd). σ = 1 in (c) and σ = 2 in (f). The parameter regions are determined by referring to the bifurcation diagrams for macroscopic oscillatory region in figure 2a,d; therefore, 1 ≤ I ≤ 4 and 0.05 ≤ psyn ≤ 0.3 are adopted for (a–c), while 1.5 ≤ I ≤ 4 and 0.1 ≤ psyn ≤ 0.3 are for (d–f). Besides τr, τd, σ, psyn and I, parameters in this figure are set as nominal values.
3.5. Effect of shunting inhibition
Experimental evidence has shown that the GABA synapses sometimes increase membrane potential for VR ≤ Vsyn [35]. This phenomenon is called shunting inhibition, and it was recently argued that it promotes macroscopic gamma oscillation by improving its robustness [35]. Here, we test this hypothesis using the FPE.
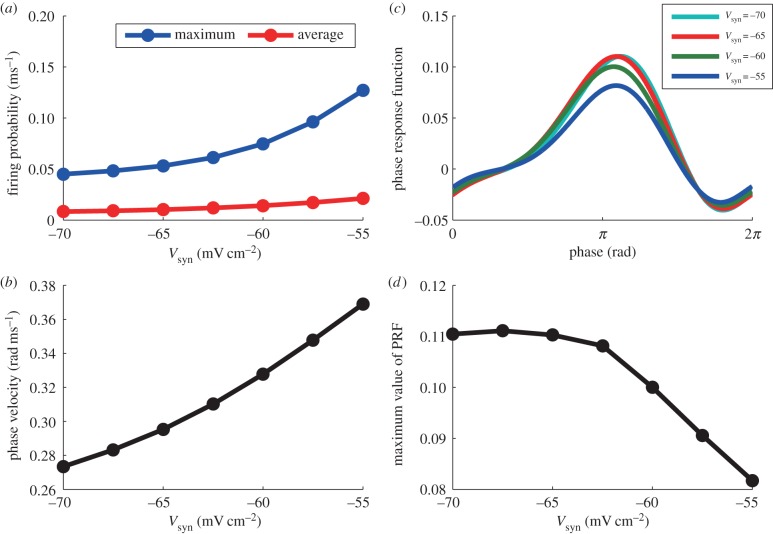
First, we numerically solved the FPE and evaluated the maximum firing probability, the average firing probability and ω as in figure 7a,b in the range of −70 ≤ Vsyn ≤−55. Increasing the maximum value of the firing probability indicates that the amplitude of the gamma oscillation increases, which means that the robustness of the gamma oscillation is increased by shunting inhibition. The average firing probability and ω also increase as Vsyn increases. These properties of shunting inhibition are the same as those reported previously [35].
Figure 7.
(a) Average and maximum firing probability with different values of Vsyn. (b) ω with different values of Vsyn. (c) PRFs against perturbations to I provided by the adjoint method with different values of Vsyn. (d) Maximum value of PRF with different values of Vsyn. Besides Vsyn, parameters in this figure are set as nominal values.
Next, we evaluated the PRFs with shunting inhibition as shown in figure 7c. As Vsyn increases, the amplitudes of PRF become smaller while maintaining the waveform, indicating that the phase of the oscillation is stable and robust against external interactions. (The larger is the PRF, the more sensitive is the oscillator.) Therefore, the results of PRF also support the finding that shunting inhibition improves the robustness of the gamma oscillations. The maximum value of PRF almost remains constant in the first part of the shunting inhibition in the range of Vsyn <−62.5 mV and decreases in the range of Vsyn >−62.5 mV (figure 7d), which differs from the other indexes (maximum, average of firing probability and ω) that are monotonic over the entire range of −70 ≤ Vsyn ≤−55.
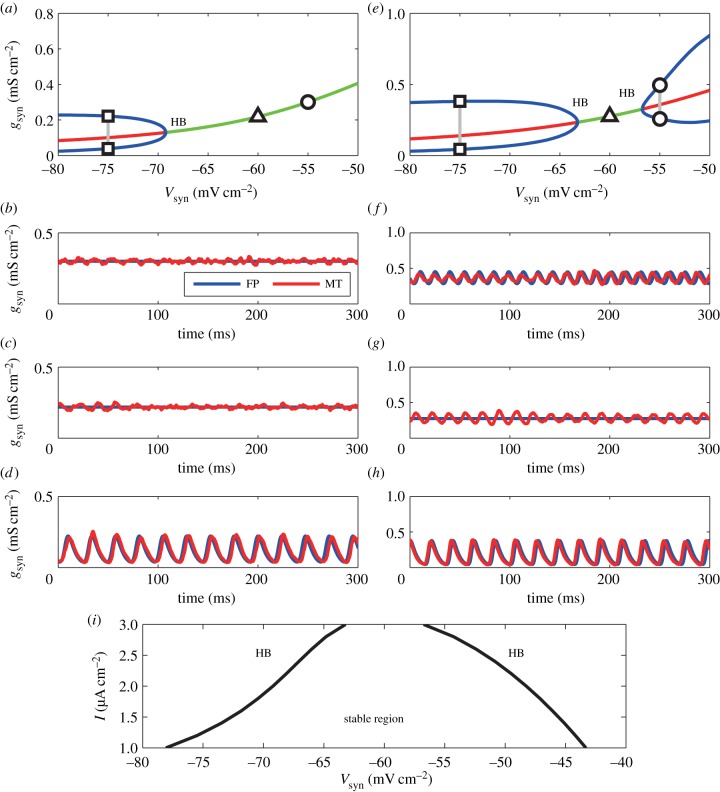
We computed the bifurcation diagram for the FPE using Vsyn as a parameter and changing the other parameters to investigate whether the above effects of shunting inhibition hold in general. Surprisingly, when we set psyn = 0.05, I = 2, the gamma oscillation disappeared above Vsyn ≃ − 69.0 mV and a stable fixed firing state appeared (figure 8a–d). This result means that increasing Vsyn can destroy the macroscopic gamma oscillation, which is in contrast to the study by Vida et al. [35]. More interestingly, when we increased the current to I = 3 with the same synaptic probability, there were two branches of HB for the macroscopic oscillations: below Vsyn ≃ − 63.0 mV and above Vsyn ≃ − 56.5 mV. Between these bifurcations, there was a region that had a stable fixed firing state (figure 8e–h), although the numerical computation fluctuated near the gamma frequency because of the vicinity of the bifurcation point and the finite-size effect. Therefore, the effect of shunting inhibitions is largely altered by the balance of the inhibitory synapses psyn and current I. Finally, the stable region and oscillatory region are shown in the two-dimensional bifurcation diagram for I and Vsyn (figure 8i).
Figure 8.
Bifurcation diagrams with (psyn, I) = (0.05, 2) in (a) and with (psyn, I) = (0.05, 3) in (e). (a,e) The green line is a stable fixed solution and the red one is an unstable one. The blue lines indicate the upper bound and lower bound of the Hopf oscillation. HB, Hopf bifurcation. (b–d) Time course of the conductance gsyn obtained by the Fokker–Planck (FP) equation and the modified theta (MT) model. Vsyn = −55 mV in (b,f), Vsyn = −60 mV in (c,g) and Vsyn = −75 mV in (d,h). In the case of (psyn, I) = (0.05, 2) (in (a)), as Vsyn is increased, the gamma oscillation disappears above Vsyn ≃− 69.0 mV and a stable fixed firing mode emerges. On the other hand, when we adopt (psyn, I) = (0.05, 3) (in (e)), gamma oscillations appear in both regions below Vsyn ≃− 63.0 mV and above Vsyn ≃− 56.5 mV. Between them, a stable fixed firing state appears in the solution of the FPE. (i) Two-dimensional bifurcation diagram for shunting inhibition. In the region of 1 ≤ I ≤ 3 and −80 ≤ Vsyn ≤− 40, there are two Hopf oscillatory regions and there is a stable state between them. Besides Vsyn, psyn and I, parameters in this figure are set as nominal values.
4. Discussion
In this study, we first derived a modified theta model that possesses voltage-dependent dynamics and appropriate forms and strengths of the synaptic interactions. These properties are not incorporated into the conventional theta model which is the normal form for the saddle-node infinite cycle bifurcation [15]. Unlike related integrate-and-fire models with conductance-based synapses, the modified theta model is continuous with no resetting. By letting the number of neurons tend to infinity, we derived a hybrid PDE/ODE for the coupled neurons and their synaptic gates. The PDE for the population dynamics has simple periodic boundary conditions, and because it is continuous, requires no special methods for solving it. Furthermore, solutions to the discretized PDE can be numerically continued and bifurcations are easily detected using AUTO or other packages. Thus, we were able to find the parameter regions for macroscopic gamma oscillations and show that these arise via a supercritical HB. We found that the macroscopic oscillation tends to emerge with larger currents (I), higher rates of synaptic couplings (psyn) and the weaker noise (σ). These results match the experimental findings that the pharmacological activations of interneurons by agonist of metabotropic glutamate receptors or kainate receptors induce large amplitude gamma oscillations and the loss of their interactions by GABAA receptor antagonist bicuculline eliminates such inhibition-based gamma oscillations [8–10]. Thus, the analyses of the proposed model aid our understanding of the mechanism by which the inhibition-based gamma oscillation arises.
Populations of neurons are subject to external perturbations, so it is important to understand how perturbations affect the population rhythm. For limit cycle oscillations, the PRF describes how perturbations shift the timing of the rhythm. In the limit of short, weak perturbations, the shift in timing is described by the solution to the adjoint equation for the linearization about the limit cycle. Here, we derived the adjoint equation for the linearized Fokker–Planck and synaptic equations along with the limit cycle orbit. Accurate PRFs for the macroscopic oscillation are provided by solutions to the adjoint equation. As the adjoint method for solving a combined problem of ODE and PDE has not been described, we successfully developed a method by introducing the appropriate dual product. The validity of the derived PRFs was confirmed by the dual product of zero eigensolution and its dual (figure 3c), by direct perturbation of the FPE (figure 4a,b), by the region of synchronization to oscillatory inputs (figure 4d) and by the frequency shift caused by changing the synaptic time constants (τr and τd) to the population of the modified theta model (figure 5a,b). Although the PRF derived by the adjoint method is generally used to evaluate the effect of external perturbations [16,17], in our study, the macroscopic PRF was successfully applied to evaluate not only the effects of external perturbations but also how intrinsic parameter changes alter the macroscopic oscillatory dynamics. Recent experiments have used optogenetic tools to selectively drive subpopulations of neurons with periodic stimuli [12,21,36]; the adjoint method allows us to investigate the effects of such perturbations on the macroscopic gamma oscillations analytically.
Many studies have used the LIF model [25,35,37] or other neuronal models [26,38] to investigate the properties of population rhythms. Their analyses have often been confined to simulations of the population of individual neurons. This is partly because the FPEs for their models require complex boundary conditions, which makes mathematical and numerical treatments somewhat limited. In particular, it is hard to perform numerical bifurcation analysis on these PDEs. Although Brunel et al. derived the spike rate response from the FPE to evaluate the properties of the population of the LIF model [25,37], the resulting formulae are complicated and also valid only in the linear regime. By contrast, the population activity of the standard theta model is rather easily numerically analysed because the corresponding FPE can be treated with periodic boundary conditions and has no discontinuities [18,31,39]. The physiological origin of the gamma oscillations is not easy to discuss in the conventional theta model because the synaptic activity comes through additive currents rather than conductance-based synapses. By contrast, the modified theta model and its analytical framework developed in this study provide mathematically rigorous analyses for determining how collective dynamics depend on physiologically relevant parameters. Some theoretical work has been done on this with regard to inhibitory networks. Brunel et al. [25] showed that increases of the rise (τr) and decay (τd) times of GABA synapses decreased the frequency of gamma oscillations and that the sensitivity of τd was much lower than that of τr. Maex et al. also demonstrated a significant frequency decrease by increasing τd [40]. Using the adjoint method, we derived expressions for the sensitivity of the frequency to the synaptic time constants (figure 6). Our results, like those of previous authors, show that the frequency decreases with the increase in both the synaptic decay and the synaptic rise time. We also showed that the ratio of the sensitivities to the time constants, Δωr/Δωd, is smaller than 1; i.e. the changes in τd affect the oscillatory frequency more than τr, under the condition of weak current (I ≃1) and noise (σ = 1). This result differs from that of Brunel et al. [25], who focused on much higher frequency (more than 100 Hz) states of gamma oscillation where the slower scale of the decay time may not be as relevant.
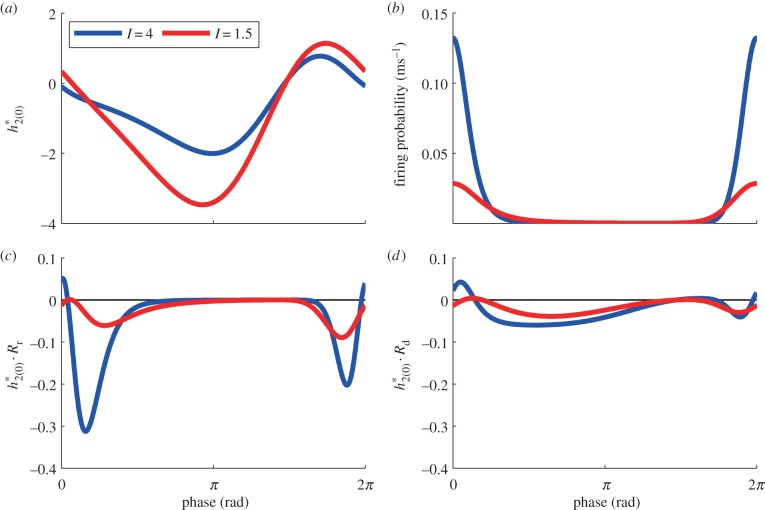
In a pair of comprehensive papers, White et al. [41] and Chow et al. [42] systematically explored the effects of synaptic time constants on the firing period of individual neurons in inhibitory networks. In their analyses, the sensitivity of the firing period to the synaptic time constant is largely dependent on I and it is larger when the applied current is smaller, which is different from our finding that the macroscopic frequency is more sensitive to the time constants when I is large (figure 6a,b,d,e). Their result makes sense for individual neurons since at low drives, the neuron is close to the bifurcation from rest and, so, will be more sensitive to perturbations. Our situation is different since there are two ‘competing’ factors. To better understand why our results are different from the Chow et al. and White et al. work, the results of the adjoint method were compared for a higher current I = 4 and a lower one I = 1.5 with fixed parameters of psyn = 0.2 and σ = 2. Figure 9a shows the PRFs  and figure 9b shows the firing probability of the periodic orbit with I = 4 and I = 1.5. The macroscopic PRF is smaller with larger I, which would be related to the fact that the PRF of an individual neuron is smaller with larger I [43] (i.e. the individual neuron is farther to its bifurcation point). On the other hand, the large amplitude oscillation in firing probability is obtained with I = 4 (figure 9b), because it is far from the supercritical HB point. From equations (3.4) and (3.5), the sensitivity of frequency, ∂ω/∂τr and ∂ω/∂τd, is obtained by averaging of the time course of
  and
and  respectively. Thus, we show these time courses in figure 9c,d. Regardless of smaller PRF of I = 4, they have larger negative values, which leads to high sensitivity. These larger values are caused because the large amplitude oscillation in firing probability influences these time courses through Rr in equation (3.3) and Rd in equation (3.6). Thus, the high sensitivity is obtained even though the macroscopic PRF is larger under the condition of smaller I (figure 9c,d). We can also see that this feature is apparent in the case of τr in figure 9c, which leads to large Δωr/Δωd.
Figure 9.
(a) PRFs  . (b) Firing probability gLP(π, t)/C of the periodic orbit. (c) Time course of
  (d) Time course of
  In all panels, the blue line is provided by I = 4, while the red one is provided by I = 1.5. The horizontal axis in all panels is normalized from 0 to 2π. In (c), we can see that there are large negative peaks with I = 4, which would be because of sharp peaks for firing probability and synaptic influences. Besides I, parameters in this figure are set as nominal values.
From these sensitivity analyses, we see that the analyses of firing probability allow for a more quantitative evaluation of population activity, that would be difficult with only numerical computations of the finite-size neuron network [41,42]. The macroscopic PRF with its link to the microscopic one (equation (2.30)) enables us to understand the complicated relationships between microscopic structure and macroscopic oscillatory dynamics, and it cannot be achieved by the phase reduction of the simplified firing rate models of neuronal population [21,44].
Other relatively minor (hence small) types of interactions can also be taken into account as perturbations in this framework. In the electronic supplementary material, we evaluated the influence of a small number of gap junctions on the frequency of oscillation and obtained good agreement between theoretical prediction and numerical computations (see the electronic supplementary material, text S2 and figure S2 for details).
Shunting inhibition has been experimentally shown to promote macroscopic gamma oscillations [35]. Using weak coupling analysis and in the strongly oscillatory regime (all neurons fire on every cycle), the Gutkin group has shown that shunting inhibition can destabilize the perfectly synchronized state [11,30]. Our results show that the effects of shunting are complicated and depend on other parameters in the model. For example with lower bias currents, increasing the reversal potential of the GABA synapse destroys the gamma oscillation while at higher bias currents, there is only a small interval of reversal potentials where the gamma oscillations are destroyed. Thus, far from the bifurcation point (high drive), shunting inhibition can enhance gamma but near the bifurcation to gamma (low bias), the reduction in inhibitory drive (increased GABA reversal) pushes the population towards an asynchronous steady state. These non-trivial properties are observed not only by the modified theta model, but also by the conductance-based neuron model (see the electronic supplementary material, text S3 and figure S3 for details). Furthermore, it is also known that the reversal potential is higher than the resting membrane potential in the immature brain [45]; the systematic analyses of our model would be effective to understand the dynamics of the immature brain.
In the sparse firing state, it is difficult to systematically explore parameter space because the simulations must necessarily be long and involve many cells (in contrast to systems where every neuron fires in each cycle). For this reason, population models are a very useful tool as they result in PDEs that are deterministic. The proposed model enables us to evaluate the effect of synaptic interactions more rigorously than the conventional theta model. We demonstrated that the precise evaluation of synaptic interactions is important because the time constants and reversal potential greatly altered macroscopic properties (stability, frequency and PRF) of gamma oscillations as they are varied even within biologically plausible ranges. Thus, the proposed model and methods could be a key technique for elucidation of the micro–macro relationship of the gamma oscillation and its functional roles. Although we restricted ourselves only to networks of inhibitory neurons so as to limit the number of parameters studied, the same methods could be used to analyse networks of excitatory and inhibitory neurons. Such extensions would be very useful in the study of phase-locking of gamma across different areas as we could then use the derived adjoint functions (PRFs) to couple macroscopic population rhythms. Furthermore, we believe that the adjoint method for simultaneous equations composed of ODEs for interactions and a PDE for the probability distribution, that we have developed in this study, will provide a useful starting point for an in-depth understanding of various collective oscillations in biology that are composed of individual noisy oscillators with complex interactions including circadian oscillation in suprachiasmatic nucleus [2], quorum-sensing bacteria [3] and somite segmentations in vertebrate embryos [4].
Endnotes
The FPE is numerically integrated by the Crank–Nicolson method. In the case of solving the adjoint equation, the Lax–Wendroff scheme is further adopted in order to improve the precision of the numerical integration. We basically divide the phase (−π, π] into 200 bins except for figure 3 and blue lines in figure 4a,b, in which 5000 bins are adopted for accurate computation. In figure 4a,b, the results of 200 and 5000 bins are in good agreement, indicating that 200 bins are enough to calculate macroscopic phase response functions. For the bifurcation analyses by XPPAUT, centred difference for 100 bins is adopted and numerically integrated by CVODE [31]. This scheme preserves the total probability. Because of this conservation, there is always a zero eigenvalue. To eliminate this eigenvalue and thus fix the mass, we reduce the dimension to 99 equations and set, say, P1dx = 1 − dx∑Nj=2 Pj. Here, dx = 2π/100. With the elimination of the zero eigenvalue, we can use AUTO to compute steady states and their stability.
Funding statement
This study was supported by Grants-in-Aid for Scientific Research (23680024 to K.K. and 23240065 to Y.J.). K.K. was also supported by SCOPE (112103010). G.B.E. was supported by National Science Foundation grant no. DMS1219754.
References
- 1.Wang XJ. 2010. Neurophysiological and computational principles of cortical rhythms in cognition. Physiol. Rev. 90, 1195–1268. ( 10.1152/physrev.00035.2008) [DOI] [PMC free article] [PubMed] [Google Scholar]
- 2.Yamaguchi S, Isejima H, Matsuo T, Okura R, Yagita K, Kobayashi M, Okamura H. 2003. Synchronization of cellular clocks in the suprachiasmatic nucleus. Science 302, 1408–1412. ( 10.1126/science.1089287) [DOI] [PubMed] [Google Scholar]
- 3.Garcia-Ojalvo J, Elowitz MB, Strogatz SH. 2004. Modeling a synthetic multicellular clock: repressilators coupled by quorum sensing. Proc. Natl Acad. Sci. USA 101, 10 955–10 960. ( 10.1073/pnas.0307095101) [DOI] [PMC free article] [PubMed] [Google Scholar]
- 4.Horikawa K, Ishimatsu K, Yoshimoto E, Kondo S, Takeda H. 2006. Noise-resistant and synchronized oscillation of the segmentation clock. Nature 441, 719–723. ( 10.1038/nature04861) [DOI] [PubMed] [Google Scholar]
- 5.Wang XJ, Buzsáki G. 1996. Gamma oscillation by synaptic inhibition in a hippocampal interneuronal network model. J. Neurosci. 16, 6402–6413. [DOI] [PMC free article] [PubMed] [Google Scholar]
- 6.Womelsdorf T, Schoffelen JM, Oostenveld R, Singer W, Desimone R, Engel AK, Fries P. 2007. Modulation of neuronal interactions through neuronal synchronization. Science 316, 1609–1612. ( 10.1126/science.1139597) [DOI] [PubMed] [Google Scholar]
- 7.Rodriguez E, George N, Lachaux JP, Martinerie J, Renault B, Varela FJ. 1999. Perception's shadow: long-distance synchronization of human brain activity. Nature 397, 430–433. ( 10.1038/17120) [DOI] [PubMed] [Google Scholar]
- 8.Bartos M, Vida I, Jonas P. 2007. Synaptic mechanisms of synchronized gamma oscillations in inhibitory interneuron networks. Nat. Rev. Neurosci. 8, 45–56. ( 10.1038/nrn2044) [DOI] [PubMed] [Google Scholar]
- 9.Fisahn A, Contractor A, Traub RD, Buhl EH, Heinemann SF, McBain CJ. 2004. Distinct roles for the kainate receptor subunits GluR5 and GluR6 in kainate-induced hippocampal gamma oscillations. J. Neurosci. 24, 9658–9668. ( 10.1523/JNEUROSCI.2973-04.2004) [DOI] [PMC free article] [PubMed] [Google Scholar]
- 10.Whittington MA, Traub RD, Jefferys JG. 1995. Synchronized oscillations in interneuron networks driven by metabotropic glutamate receptor activation. Nature 373, 612–615. ( 10.1038/373612a0) [DOI] [PubMed] [Google Scholar]
- 11.Stiefel KM, Wespatat V, Gutkin B, Tennigkeit F, Singer W. 2005. Phase dependent sign changes of GABAergic synaptic input explored in-silicio and in-vitro. J. Comput. Neurosci. 19, 71–85. ( 10.1007/s10827-005-0188-3) [DOI] [PubMed] [Google Scholar]
- 12.Cardin JA, Carlén M, Meletis K, Knoblich U, Zhang F, Deisseroth K, Tsai L, Moore CI. 2009. Driving fast-spiking cells induces gamma rhythm and controls sensory responses. Nature 459, 663–667. ( 10.1038/nature08002) [DOI] [PMC free article] [PubMed] [Google Scholar]
- 13.Buzsaki G, Horvath Z, Urioste R, Hetke J, Wise K. 1992. High-frequency network oscillation in the hippocampus. Science 256, 1025–1027. ( 10.1126/science.1589772) [DOI] [PubMed] [Google Scholar]
- 14.Fisahn A, Pike FG, Buhl EH, Paulsen O. 1998. Cholinergic induction of network oscillations at 40 Hz in the hippocampus in vitro. Nature 394, 186–189. ( 10.1038/28179) [DOI] [PubMed] [Google Scholar]
- 15.Ermentrout B. 1996. Type I membranes, phase resetting curves, and synchrony. Neural Comput. 8, 979–1001. ( 10.1162/neco.1996.8.5.979) [DOI] [PubMed] [Google Scholar]
- 16.Kuramoto Y. 1984. Chemical oscillations, waves, and turbulence. New York, NY: Springer. [Google Scholar]
- 17.Pikovsky A, Rosenblum M, Kurths J. 2001. Synchronization: a universal concept in nonlinear science. Cambridge, UK: Cambridge University Press. [Google Scholar]
- 18.Kanamaru T, Sekine M. 2005. Synchronized firings in the networks of class 1 excitable neurons with excitatory and inhibitory connections and their dependences on the forms of interactions. Neural Comput. 17, 1315–1338. ( 10.1162/0899766053630387) [DOI] [PubMed] [Google Scholar]
- 19.Kawamura Y, Nakao H, Arai K, Kori H, Kuramoto Y. 2008. Collective phase sensitivity. Phys. Rev. Lett. 101, 024101 ( 10.1103/PhysRevLett.101.024101) [DOI] [PubMed] [Google Scholar]
- 20.Kawamura Y, Nakao H, Kuramoto Y. 2011. Collective phase description of globally coupled excitable elements. Phys. Rev. E 84, 046211 ( 10.1103/PhysRevE.84.046211) [DOI] [PubMed] [Google Scholar]
- 21.Akam T, Oren I, Mantoan L, Ferenczi E, Kullmann DM. 2012. Oscillatory dynamics in the hippocampus support dentate gyrus-CA3 coupling. Nat. Neurosci. 15, 763–768. ( 10.1038/nn.3081) [DOI] [PMC free article] [PubMed] [Google Scholar]
- 22.Fourcaud-Trocmé N, Hansel D, Van Vreeswijk C, Brunel N. 2003. How spike generation mechanisms determine the neuronal response to fluctuating inputs. J. Neurosci. 23, 11 628–11 640. [DOI] [PMC free article] [PubMed] [Google Scholar]
- 23.Pfeuty B, Mato G, Golomb D, Hansel D. 2003. Electrical synapses and synchrony: the role of intrinsic currents. J. Neurosci. 23, 6280–6294. [DOI] [PMC free article] [PubMed] [Google Scholar]
- 24.Dipoppa M, Gutkin BS. 2013. Flexible frequency control of cortical oscillations enables computations required for working memory. Proc. Natl Acad. Sci. USA 110, 12 828–12 833. ( 10.1073/pnas.1303270110) [DOI] [PMC free article] [PubMed] [Google Scholar]
- 25.Brunel N, Wang XJ. 2003. What determines the frequency of fast network oscillations with irregular neural discharges? I. Synaptic dynamics and excitation-inhibition balance. J. Neurophysiol. 90, 415–430. ( 10.1152/jn.01095.2002) [DOI] [PubMed] [Google Scholar]
- 26.Bartos M, Vida I, Frotscher M, Geiger JRP, Jonas P. 2001. Rapid signaling at inhibitory synapses in a dentate gyrus interneuron network. J. Neurosci. 21, 2687–2698. [DOI] [PMC free article] [PubMed] [Google Scholar]
- 27.Gupta A, Wang Y, Markram H. 2000. Organizing principles for a diversity of GABAergic interneurons and synapses in the neocortex. Science 287, 273–278. ( 10.1126/science.287.5451.273) [DOI] [PubMed] [Google Scholar]
- 28.McCormick DA, Huguenard JR. 1992. A model of the electrophysiological properties of thalamocortical relay neurons. J. Neurophysiol. 68, 1384–1400. [DOI] [PubMed] [Google Scholar]
- 29.Ermentrout B, Pascal M, Gutkin B. 2001. The effects of spike frequency adaptation and negative feedback on the synchronization of neural oscillators. Neural Comput. 13, 1285–1310. ( 10.1162/08997660152002861) [DOI] [PubMed] [Google Scholar]
- 30.Jeong HY, Gutkin B. 2005. Study on the role of GABAergic synapses in synchronization. Neurocomputing 65, 859–868. ( 10.1016/j.neucom.2004.10.063) [DOI] [Google Scholar]
- 31.Ly C, Ermentrout GB. 2010. Analysis of recurrent networks of pulse-coupled noisy neural oscillators. SIAM J. Appl. Dyn. Syst. 9, 113–137. ( 10.1137/090756065) [DOI] [Google Scholar]
- 32.Risken H. 1985. The Fokker–Planck equation: methods of solution and applications. Berlin, Germany: Springer. [Google Scholar]
- 33.Gerstner W, Kistler WM. 2002. Spiking neuron models: single neurons, populations, plasticity. Cambridge, UK: Cambridge University Press. [Google Scholar]
- 34.Ermentrout B. 2002. Simulating, analyzing, and animating dynamical systems: a guide to XPPAUT for researchers and students, vol. 14 Philadelphia, PA: Society for Industrial and Applied Mathematics. [Google Scholar]
- 35.Vida I, Bartos M, Jonas P. 2006. Shunting inhibition improves robustness of gamma oscillations in hippocampal interneuron networks by homogenizing firing rates. Neuron 49, 107–118. ( 10.1016/j.neuron.2005.11.036) [DOI] [PubMed] [Google Scholar]
- 36.Sohal VS, Zhang F, Yizhar O, Deisseroth K. 2009. Parvalbumin neurons and gamma rhythms enhance cortical circuit performance. Nature 459, 698–702. ( 10.1038/nature07991) [DOI] [PMC free article] [PubMed] [Google Scholar]
- 37.Brunel N, Hansel D. 2006. How noise affects the synchronization properties of recurrent networks of inhibitory neurons. Neural Comput. 18, 1066–1110. ( 10.1162/neco.2006.18.5.1066) [DOI] [PubMed] [Google Scholar]
- 38.Bartos M, Vida I, Frotscher M, Meyer A, Monyer H, Geiger JRP, Jonas P. 2002. Fast synaptic inhibition promotes synchronized gamma oscillations in hippocampal interneuron networks. Proc. Natl Acad. Sci. USA 99, 13 222–13 227. ( 10.1073/pnas.192233099) [DOI] [PMC free article] [PubMed] [Google Scholar]
- 39.Kilpatrick ZP, Ermentrout B. 2011. Sparse gamma rhythms arising through clustering in adapting neuronal networks. PLoS Comput. Biol. 7, e1002281 ( 10.1371/journal.pcbi.1002281) [DOI] [PMC free article] [PubMed] [Google Scholar]
- 40.Maex R, De Schutter E. 2003. Resonant synchronization in heterogeneous networks of inhibitory neurons. J. Neurosci. 23, 10 503–10 514. [DOI] [PMC free article] [PubMed] [Google Scholar]
- 41.White JA, Chow CC, Ritt J, Soto-Treviño C, Kopell N. 1998. Synchronization and oscillatory dynamics in heterogeneous, mutually inhibited neurons. J. Comput. Neurosci. 5, 5–16. ( 10.1023/A:1008841325921) [DOI] [PubMed] [Google Scholar]
- 42.Chow CC, White JA, Ritt J, Kopell N. 1998. Frequency control in synchronized networks of inhibitory neurons. J. Comput. Neurosci. 5, 407–420. ( 10.1023/A:1008889328787) [DOI] [PubMed] [Google Scholar]
- 43.Brown E, Moehlis J, Holmes P. 2004. On the phase reduction and response dynamics of neural oscillator populations. Neural Comput. 16, 673–715. ( 10.1162/089976604322860668) [DOI] [PubMed] [Google Scholar]
- 44.Battaglia D, Brunel N, Hansel D. 2007. Temporal decorrelation of collective oscillations in neural networks with local inhibition and long-range excitation. Phys. Rev. Lett. 99, 238106 ( 10.1103/PhysRevLett.99.238106) [DOI] [PubMed] [Google Scholar]
- 45.Ben-Ari Y. 2002. Excitatory actions of GABA during development: the nature of the nurture. Nat. Rev. Neurosci. 3, 728–739. ( 10.1038/nrn920) [DOI] [PubMed] [Google Scholar]


