Abstract
Tiger beetles are fast diurnal predators capable of chasing prey under closed-loop visual guidance. We investigated this control system using statistical analyses of high-speed digital recordings of beetles chasing a moving prey dummy in a laboratory arena. Correlation analyses reveal that the beetle uses a proportional control law in which the angular position of the prey relative to the beetle's body axis drives the beetle's angular velocity with a delay of about 28 ms. The proportionality coefficient or system gain, 12 s−1, is just below critical damping. Pursuit simulations using the derived control law predict angular orientation during pursuits with a residual error of about 7°. This is of the same order of magnitude as the oscillation imposed by the beetle's alternating tripod gait, which was not factored into the control law. The system delay of 28 ms equals a half-stride period, i.e. the time between the touch down of alternating tripods. Based on these results, we propose a physical interpretation of the observed control law: to turn towards its prey, the beetle on average exerts a sideways force proportional to the angular position of the prey measured a half-stride earlier.
Keywords: pursuit dynamics, time-delayed proportional control, visual guidance, insect walking kinematics
1. Introduction
Diurnally active insects that perform visually guided pursuit to track their prey or potential mates face two problems compared with vertebrate animals: relatively small nervous systems to compute control algorithms [1] and poor visual resolution to provide input [2]. How such insects overcome these challenges may reveal principles that could be applied to other similar control systems. Vertebrate animals have relatively complex brains, thus predators such as fish [3], birds [4], bats [5] and social carnivores [6,7] can develop sophisticated neural computational algorithms to process sensory information about the prey and provide control commands to their locomotor systems. Insects, on the other hand, must adopt a simpler type of control system to accomplish the same tasks. Male flies of one species use open-loop control of their pursuit trajectory to intercept females [8]. Successful capture depends on a conspecific female to be a certain size and, after the male first localizes her, to fly on a straight trajectory at a constant velocity. But most insects, whether pursuing potential mates or prey, cannot depend on their targets to move along straight trajectories at constant velocities and thus have evolved closed-loop control of their pursuit systems, e.g. male flies [9], male honeybees [10] and dragonflies [11,12].
Closed-loop control algorithms for angular orientation of the pursuit trajectory have received the most scrutiny, and two kinds of control laws have been reported (figure 1). The first one minimizes the error angle of the target using a proportional, position-sensitive servo system in which the pursuer's angular velocity depends upon the visual angular position of the target with some lag time, typically of the order of 10–40 ms in flying flies [9,13,14]. Tiger beetles running after their prey also show a relationship between the angular position of the prey and the subsequent angular velocity of the beetle [15], but this has not been rigorously tested as a control algorithm.
Figure 1.
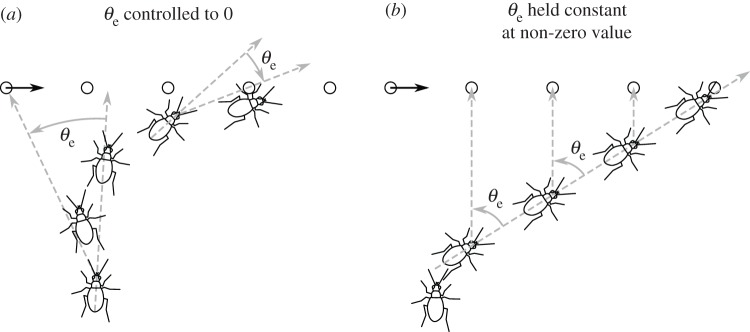
Two closed-loop pursuit strategies: ‘tracking’ and ‘interception’ [11]. (a) The animal controls its angular velocity to minimize the error angle θe by turning proportional to θe with a time delay τ. (b) The animal controls its angular velocity to maintain the position of the prey at some non-zero error angle.
The second type of controller keeps a constant, but non-zero, error angle [12,16]. Dragonflies appear to continuously control their angular velocity to maintain the target's position at a retinal elevation of about 45°, where the image can be viewed by so-called target-selective descending neurons (TSDNs), visual interneurons thought to be involved in the control circuit [17]. The temporal lag of the dragonfly's control system is about 30 ms [12], which is similar to that measured for other insect visual guidance systems.
Tiger beetles are visual predators that run their prey down on relatively flat, open habitats [18]. They run so fast that visual motion blur degrades target contrast and the beetles must momentarily stop to re-localize the prey, typically resulting in ‘stop and go’ pursuits [15]. When prey contrast is high enough, however, tiger beetles are able to chase prey continuously under closed-loop control. Thus, they are an ideal animal to address questions of visually guided control of pursuit in a walking insect and coupling of the system lag with actuation timing. More broadly, the pursuit dynamics provides a natural experimental system for us to understand the interplay between the internal neural control and the mechanics of locomotion [19–22].
In this work, we carry out a systematic study of the control algorithm used by tiger beetles to adjust their orientation during pursuit. We filmed beetles at 250 Hz during the pursuit of a prey dummy controlled by hand to move in an arbitrary fashion. To find the control law, we examined various statistical correlations between the beetle's dynamic state and that of the prey. Much of the observed trajectories can be explained by a simple proportional control law that dictates angular rotation of the beetle's body in response to the error angle of the prey with a time delay of about 28 ms and a gain just below critical damping. Simulated angular orientation according to this control law compares well with the empirical data. The beetle walks by alternating its two sets of leg tripods every 28 ms, thus the system lag is very similar to half the stride period. To understand the physical meaning of this proportional control, we offer an interpretation of this control law in terms of the beetle's walking strategy.
2. Material and methods
2.1. Experimental animals
Tiger beetles, Cicindela tranquebarica (Carabidae: Cicindelinae), were collected in an abandoned quarry near Ithaca, NY, USA. Beetles are housed individually in transparent plastic containers (13 × 18 × 7 cm tall) in the laboratory. The floor of the container is covered with a mixture of soil and sand that is kept slightly damp and beetles are fed houseflies. Each beetle has the left hindwing clipped to prevent flight and escape from the containers or test arena. A small dot of white paint (Witeout) is applied to the centre of the thoracic pronotum and to the posterior tip of the elytra to serve as fiducial marks for digitizing. The dataset is derived from the five beetles that responded most robustly to the prey dummies. We analyse 39 pursuits elicited by different movements of the prey, some are stationary, some move in relatively straight paths and others move in complex patterns.
2.2. Experimental set-up and protocol
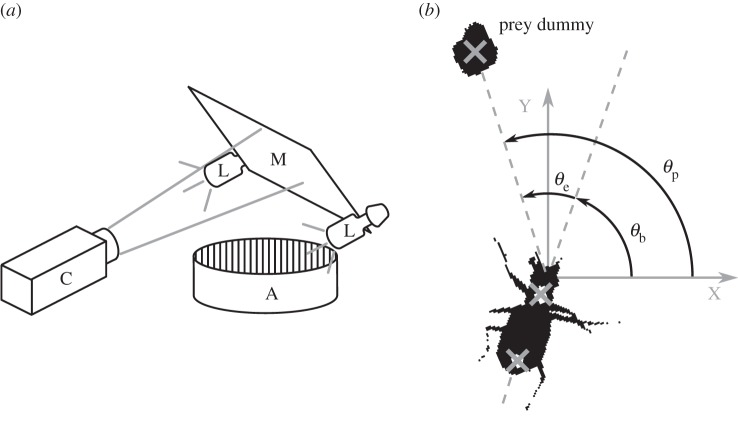
Experiments are performed in a cylindrical arena (33 cm diameter × 18 cm tall, figure 2a). The walls are patterned alternately with black (4 mm) and white (12 mm) vertical stripes to provide contrast for the beetle moving through the arena. Two 45 W compact fluorescent lamps illuminate the arena from above. The temperature in the arena during filming was about 25°C. The floor of the arena is calibrated by filming a 1 × 1 cm grid on the floor. The prey dummy is a high-contrast black sphere (4.5 mm diameter) glued to a nylon monofilament.
Figure 2.
(a) Schematic of the experimental set-up. Beetles are filmed through a mirror (M) by a high-speed camera (C) as they pursue a prey dummy in an arena (A) illuminated by two lamps (L). (b) Actual binary image of a tiger beetle pursuing a prey dummy automatically extracted from a digital frame. Our software finds the two fiducial white spots painted on the beetle and the centroid of the prey dummy (marked as grey crosses). From these three points, the angular variables with respect to an external Cartesian frame (X,Y) are calculated: the beetle's orientation θb, the error angle θe from the beetle's mid-sagittal plane (dotted line) and the prey's angular position θp.
Pursuits of a prey dummy are digitally filmed at 250 frames per second with 1024 × 1024 resolution using a high-speed camera (Phantom v. 5.0, AMETEK, USA) aimed at a mirror inclined 45° above the arena. The digital greyscale images are imported into a custom Matlab (MathWorks, Natick, MA, USA) program and automatically converted to binary black-and-white images (figure 2b). Our program then finds the centre point of the prey dummy and the fiducial spots on the beetle. The coordinates of these three points are used to calculate the following angles and angular velocities with respect to an external Cartesian (X,Y) frame of reference:
θb, orientation of the beetle's longitudinal body axis;
θp, angular position of the prey dummy;
θe, error angle between the prey dummy and the beetle's body axis;
ωb, angular velocity of the beetle defined as the rate of change of θb;
ωp, prey angular velocity defined as the rate of change of θp;
ωe, angular velocity of the error defined as the rate of change of θe.
All angles are calculated for each frame and no smoothing is applied. In the kinematic analysis, velocities ( , vb, vp) are calculated as the central difference over two frames. In the analysis of the control law velocities (ωb, ωp, ωe,
vT) are calculated as the central difference over the mean stride period. Prey velocity vp is calculated for the dummy's geometric centre and the beetle's linear velocity is calculated for the centre of mass, which is assumed to be on the mid-sagittal body axis close to where the hind legs are attached. The beetle's sideways acceleration, a⊥, is calculated as the product of linear velocity and angular velocity, a⊥ = vTωb. Unless otherwise noted, values are presented in terms of mean value ± 1 s.d. Statistical tests are performed in Matlab.
In addition, we analyse the walking gait for one straight run from each of the five beetles by counting the time frames that each leg is in stance phase (leg has ground contact) and swing phase (leg is airborne).
Individual beetles are acclimatized to the arena for 10 min before the prey dummy is introduced by lowering it from above and moving it across the floor by hand. The beetles often chase with intermittent runs and stops, stopping when the target contrast is too degraded owing to motion blur, but when contrast of the target is high the beetle is able to achieve continuous pursuit [15]. The angular and linear velocities of tiger beetles are similar for pursuits of dummies and live prey [15]. In the present dataset of 39 pursuits, only those in which the beetle moves continuously towards the target from a stationary position are analysed, comprising five straight runs, 17 runs with a single turn to either the left or right and 17 runs with two or more turns. The pursuit durations range from 220 to 2284 ms.
3. Results
3.1. Walking gait and associated body oscillation
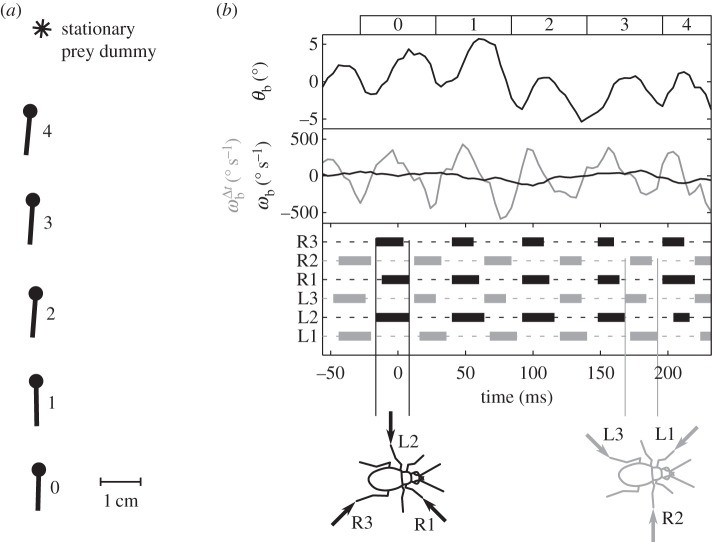
Like other typical six-legged insects, tiger beetles walk and run with an alternating tripod gait (figure 3). To understand the walking kinematics of tiger beetles, we first analyse a straight run from each of the five beetles in pursuit of a stationary prey dummy. The beetles run with a mean velocity of 30.5 ± 6.9 cm s−1 (or 22.9 body lengths per second). Their maximum velocity is 35.5 ± 4.9 cm s−1 (26.7 body lengths per second). The mean stride period, the time between successive initiations of stance phase for one leg, is 56 ± 4 ms, corresponding to a stride frequency of about 18 Hz. The beetle's alternating tripod gait leads to a periodic sway of the body; the longitudinal axis of the body oscillates in the yaw plane about 4° over half a stride, which corresponds to an angular velocity  of about ±500° s−1.
Figure 3.
Body oscillation owing to tripod gait. (a) The beetle's body axis is shown by a line with the dot as the head during a straight run. The asterisk represents the position of the stationary prey dummy. For clarity, the beetle is plotted every 56 ms, which equals the average stride period, and thus the spatial distances equal the stride lengths. (b) The oscillation of the beetle's heading, θb (upper panel), owing to the alternating tripod gait (bottom panel). Two angular velocities are shown in the middle panel: the beetle's instantaneous angular velocity,  , calculated from the finite difference over the sampling period, and the averaged angular velocity over a stride, ωb, calculated from the finite difference over a stride. As expected, the averaged angular velocity, ωb, eliminates the oscillations owing to symmetric stepping to the left and right, thus giving us the angular rotation due to turning. Numbers across the top correspond to beetle positions in panel (a). The bottom panel shows the stepping pattern for the three right (R) and three left (L) legs with stance indicated as solid rectangles and swing as dotted lines. One tripod consists of R1, L2, R3 (black), the other one of L1, R2, L3 (grey). The arrows in the beetle icons indicate the ground reaction forces (arrows) on the legs of each tripod as they support the beetle in stance phase.
When alternating between the stance phase of one tripod and that of the other tripod, the swing phase of each leg lasts slightly longer than the stance phase, on average by about 15%. The stance phase of the middle leg is significantly longer on average than that of the front and hind legs (α = 0.05, Kruskal–Wallis). The mean (±s.d.) proportion of time during one stride cycle spent in stance phase for front, middle and hind legs is 0.39 ± 0.08, 0.48 ± 0.10, 0.40 ± 0.06 (n = 50 for each leg), respectively.
3.2. Chasing patterns
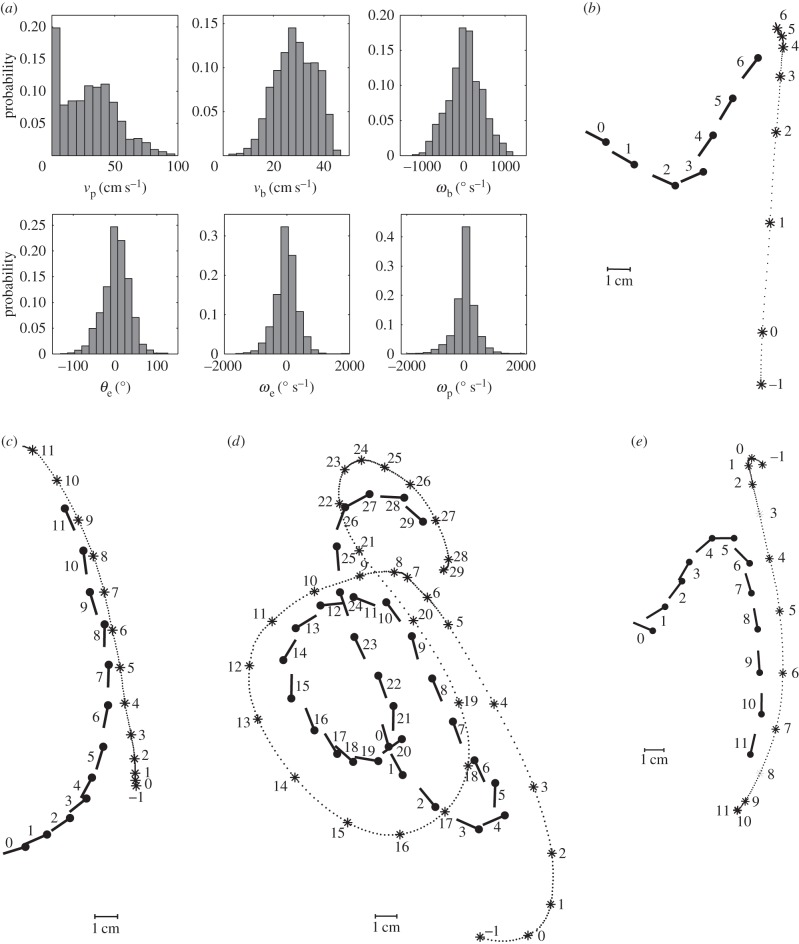
Tiger beetles approach stationary prey if it is initially wiggled to attract their attention. To elicit a pursuit, we wiggle and drag the dummy prey in the arena along simple or complex paths (figure 4). During such pursuits with turning trajectories (n = 34), the beetle's linear velocity has a similar magnitude to that in straight runs, with a mean of 27.5 ± 3.9 cm s−1 (19.7 body lengths per second) and a maximum of 38.6 ± 5.4 cm s−1 (27.7 body lengths per second). The highest recorded linear velocity is 46.6 cm s−1 (35.1 body lengths per second). The mean stride frequency is 18.4 ± 1.2 s−1, corresponding to an average stride period of 55 ± 4 ms. During a sharp turn, the angular velocity ωb can be as high as 1400° s−1.
Figure 4.
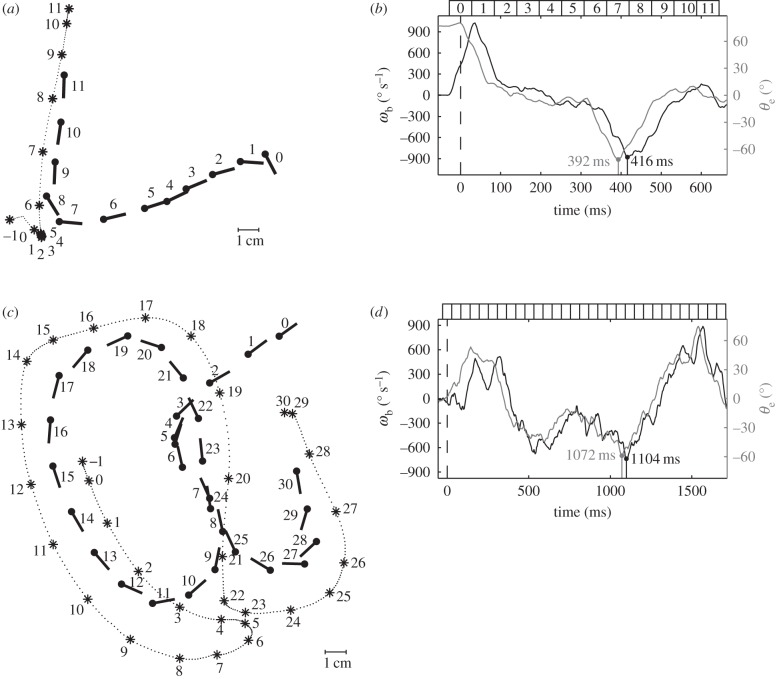
Statistics and example of the chases. (a) Probability distributions of a beetle's kinematics (vb, ωb) and the prey dummies' kinematics in the fixed coordinate system (vp) as well as relative to the beetle (θe, ωe, ωp; 34 pursuits, n = 5929 frames). (b–e) Sample of recorded chases. The beetles are able to pursue prey moving along straight trajectories or very sinuous ones. Conventions are as in figure 2 with prey positions connected by a dotted line.
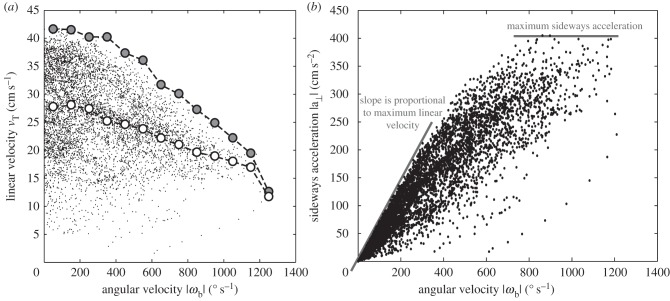
In a typical pursuit in this study, the beetle starts its chase when the prey is moved in its lateral field of view. During each pursuit, the beetle adjusts its orientation as well as its velocity. The beetle's orientation is almost tangential to the path, which is similar to other walking insects and has also been quantified for cockroaches [23]. Here, we further note that, from geometry, the angular velocity of a point travelling along the path is the same as the angular velocity of the beetle about its centre of mass. The data show that the maximum of linear velocity vT is inversely correlated to angular velocity ωb averaged over a stride period (figure 5a). This inverse relationship implies that the beetle has a maximal sideways acceleration, a⊥, as a⊥ = vTωb. The maximum sideways acceleration is 405 cm s−2, as shown in figure 5b. The maximum linear velocity over one stride is 41.7 cm s−1 (figure 5a,b). We thus expect that the angular and translational velocities are not independently controlled owing to the coupling between the force and torque exerted by the legs. In this study, we focus on the control law for the observed angular velocity during pursuits.
Figure 5.
Coupling between linear and angular velocity. (a) Relationship between the beetle's linear velocity vT and its angular velocity magnitude |ωb|. Each datum point corresponds to one frame in the 34 pursuits with the first 28 ms of each chase excluded to avoid irregularities owing to the acceleration from the stopped position, with 28 ms being half of the average stride duration. The maximum linear velocity (large grey circles) in each angular velocity interval of 100 s−1 decreases with angular velocity, as does the mean linear velocity (white circles) for each interval. (b) The sideways acceleration. The slope of the lower line corresponds to the maximal linear velocity, 41.7 cm s−1, and the upper plateau corresponds to the value of maximum sideways acceleration, 405 cm s−2.
3.3. Control law for beetle orientation during pursuit
When the prey dummy moves in a relatively straight path, the beetle approaches towards the prey initially, and as it gets closer the beetle makes a sharp turn and then follows along the prey trajectory (figure 4b,e). This may seem to suggest a control law that would depend on the distance to the prey. But as we will see, a control law for the beetle's angular orientation alone is sufficient to describe the bulk of the behaviour.
To find the control law for the beetle's orientation, we analyse 34 of the pursuits that contained one or more turns for correlations between the parameters of the target and the kinematics of the beetle (figure 6a,c). Of potential candidates of dynamic variables of the beetle and prey, we have tested the correlations among different pairs: ωb and θe, ωb and ωe, ωb and ωp,  and θe,
  and ωe, and
  and ωp (figure 7c). The strongest correlation is between the beetle's rotational velocity, ωb, and the angular position of the prey relative to the beetle's heading, θe (figure 7c). This correlation can be seen directly from the time traces of these two variables (figure 6b,d). When calculating angular velocity, we note that the beetle's orientation consists of the superposition of two components, one corresponding to the turning motion given by the control law and the other faster oscillation owing to the beetle's alternating tripod gait (figure 3b). Therefore, for analysis of the control law, we calculate ωb by taking a finite difference of θb over an averaged stride period. This effectively measures the average angular velocity of the beetle over each stride period and omits the high-frequency wobble owing to the alternating tripod gait (figure 3b). A cross-correlation of ωb(t) and θe(t − τ) for various temporal lags τ for each pursuit yields the maximum correlation, R2 = 0.873 ± 0.109 (n = 34), when τ = 28 ms (figure 7a, inset).
Figure 6.
Correlation between a tiger beetle's angular velocity, ωb, and the error angle, θe. (a,c) Examples of simple and complex trajectories of tiger beetles chasing the prey dummies. The notations are the same as in figure 4. (b,d) Time courses of ωb and θe in (a) and (c), respectively. The angular velocity ωb (black curve) follows the error angle θe (grey) with a delay of about 30 ms.
Figure 7.
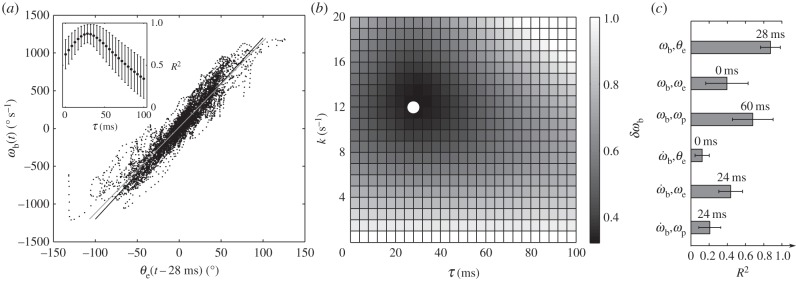
Control law ωb(t) = kθe(t−τ) and the best-fitted parameters for k and τ. (a) Cross-correlation of the beetle's angular velocity, ωb(t), and the error angle at a time lag of 28 ms, θe(t−0.028). The data are compared with the control law  (black line) and the regression equation
  (grey line). Inset shows that the correlation coefficient R2 reaches its maximum at a temporal lag of 28 ms. (b) Parameter study of the gain k and the lag τ in the control law by examining the normalized RMS deviation δωb of the beetle's observed and predicted angular velocities. The minimum (white dot) δωb = 0.344 ± 0.100 occurs at k = 12 s−1 and τ = 28 ms. (c) Correlations among other dynamic variables of the beetle and the prey. Plotted are maximum cross-correlations and the corresponding time delays. The two strongest correlations are between ωb and the error angle θe, and ωb and ωp. Other correlations have coefficients R2 < 0.5.
The correlation between ωb and θe suggests a proportional control law for the predicted angular velocity of the beetle of the form ωb(t) = kθe(t − τ), where k is the gain and τ is the time delay. To find the values of k and τ, we compared observed (ωb) and predicted angular ( ) velocities by minimizing their RMS deviation
  over all data. The deviation δωb has its minimum when k = 12 s−1 and τ = 28 ms (figure 7b, white dot), yielding a control law of
  indicated by the black line (figure 7a).
3.4. Simulated trajectories
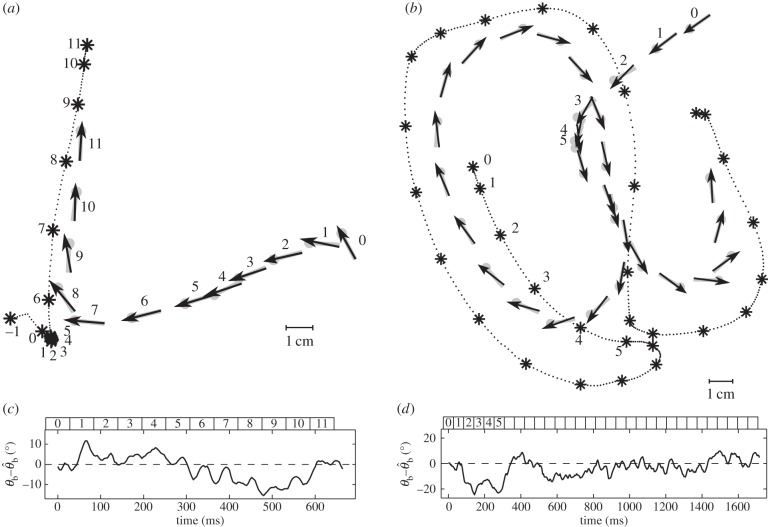
To further examine whether this control law describes the instantaneous orientation of the beetle during a chase, we forward integrate the differential equation to predict θb, the orientation of the beetle's body, and compare it with the actual measured value. The predicted orientation compares well with the observed ones. Two representative pursuits, one a relatively straight chase and the other with a very sinuous trajectory, illustrate that the body orientations predicted from the control law are a very close fit to the measured orientations (figure 8). Across all 34 pursuits, the simulated orientation  deviates from the measured orientation θb on average 6.6 ± 2.2° (n = 34). Such a mean difference is comparable to the angular deviation due to oscillation of the tripod gait (figure 3), which is not accounted for in the control law. The highest deviation in any pursuit was 33°, which occurred during a sharp turn when the beetle turned slower than the simulation predicted. The second highest deviation of 31°, however, occurred when the beetle turned faster than predicted. Note that we have only simulated the body orientation, and body position is given by the experiments. We have assumed a constant gain k and also neglect the coupling between the controls of linear and angular velocity.
Figure 8.
Simulation of the beetle's body orientation θb predicted by the proportional controller for the chases in figure 6. The beetle's position is taken from the experimental data. Notations are the same as in figure 4. Typical trajectories of the beetle chasing a prey dummy moving along a straight (a) or sinuous (b) trajectory. Grey symbols = measured orientation θb, black arrows = simulated orientation  derived from the control law
  . (c,d) Deviation between the measured and predicted orientations for pursuits shown in (a) and (b), respectively. (c) For the simple trajectory (a), the mean deviation is 5.3 ± 4.0° (n = 167) with the maximum deviation of 15.5° that occurs after the sharp turn at strides 7–9. (d) For the more complex sinuous pursuit (b), the mean deviation is 6.7 ± 5.5° (n = 430) with the maximum of 24.6° occurring when the beetle almost stopped (strides 3–5).
3.5. The role of prey angular velocity in the control law
The simplicity of proportional control is appealing considering that the beetle's brain has relatively slow and limited computing power. With proportional control, the computational task only requires the beetle to measure the angular position of the prey, without measuring the angular velocity of the prey or itself. Nevertheless, our data do not rule out that a beetle can and may use additional input variables for its control algorithm. In their study of freely flying houseflies, Land & Collett [9] suggested that the visual angular velocity of a target may be used to augment proportional control and would allow the pursuer to anticipate or predict the trajectory of the target. Although such augmentation would be adaptive for prey seen anywhere in the visual field, the benefit may best be explained by a scenario in which the prey is located on one side of the beetle's visual midline and moves to the opposite side of the visual field, e.g. the prey is seen at 20° on the left side and is moving to the right (figure 9). With only proportional control of ωb, the beetle would turn to the left, likely overshooting the position of the prey. A prey velocity term in the control strategy, however, could compensate the tendency to turn left, and guide the beetle to turn rightward. That way the beetle could ‘predict’ the prey's path resulting in a quicker approach towards the prey.
Figure 9.
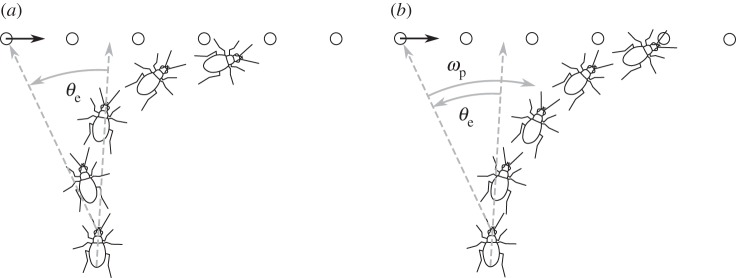
Comparison of simple proportional control and proportional control augmented with a velocity term. (a) Simple proportional control in which the error angle θe drives the beetle's orientation. In the beginning, the beetle turns to the left because the prey is on the left side of its visual field. As the prey crosses the midline of the beetle's field of view, the beetle turns to the right, leading to an S-like trajectory. (b) Augmented proportional control in which the beetle's orientation is driven by the prey positional error θe and its angular velocity ωp. Although the prey item begins on the left side of the visual field, the beetle turns to the right as the velocity term outweighs the position term and leads to a quicker approach to the prey.
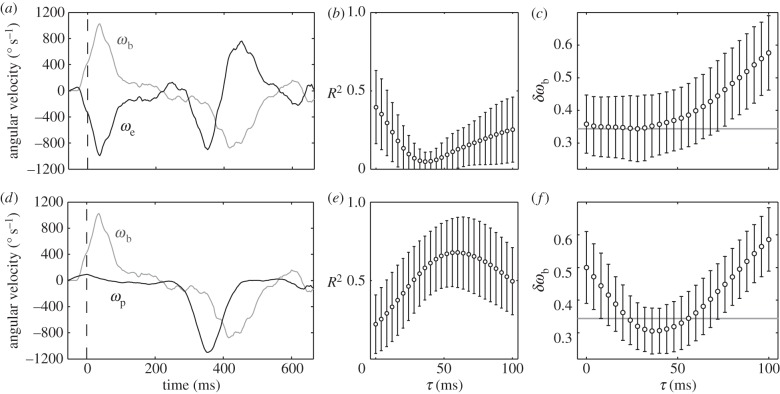
The use of angular velocity as an input parameter has been further explored in flies ([24], fig. 3 in [25]), but the data are equivocal. In the case of tiger beetles, including the angular velocity of the prey image ωe as the second term in the control law,  , does not improve the statistical fit, but including prey velocity ωp,
  , reduces the fitting error to δωb = 0.305 ± 0.070 (n = 34), which is an 11.3% improvement over the simple proportional controller (figure 10). The minimum deviation occurs with values of k1 = 9, k2 = 0.3 and τ = 36 ms, suggesting a control law of
 . Allowing different time delays for the two terms, i.e.
  , has a negligible effect on the statistical fit. Because the derivative term is small for a large part of the data when θe is finite, we expect the effect of the derivative term on the overall statistics to be small. Thus, an improvement of 11% is not negligible. On the other hand, we note that ωp is not a directly measured quantity. In order for the beetle to detect prey angular velocity ωp, it has to compute a summation of two other angular velocities, ωp = ωb + ωe. ωe can be measured from the visual input and ωb could either be extracted from movement of the stationary background in the optical flow or be an efference copy from the beetle's motor signals to control angular velocity. All of these would introduce complexity in both neural sensing and computation. One would need to carry out analysis beyond the statistical correlations in order to demonstrate the effect of ωp.
Figure 10.
Testing the control law with a predictive term,  . (a,d) Typical time course of the beetle's angular velocity ωb (grey line), the error angular velocity ωe and the prey's angular velocity ωp (both black lines). Data are from the chase shown in figure 6a. (b) Cross-correlation of the beetle's angular velocity ωb and the prey error angular velocity ωe. The correlation is the highest when τ = 0 ms (R2 = 0.395 ± 0.233; n = 34). (c) Quantification for PD-control using the error angle θe and its derivative ωe. The gains for each term in the control law, k1 and k2, were optimized for each value of τ by minimizing the RMS deviation δωb as done previously for the proportional control law. The grey line shows the minimum deviation δωb for the proportional control model. Adding the ωe term does not improve the goodness of fit. (e) The cross-correlation function for the beetle's angular velocity ωb and the prey's angular velocity ωp has its maximum at a time delay of τ = 60 ms (R2 = 0.679 ± 0.224; n = 34). (f) Quantification of models using both the positional error angle θe and the prey's angular velocity ωp. The grey line represents the minimum deviation δωb achieved by the proportional θe control model. Adding a velocity term improves the fit by 11.3%.
The lack of solid evidence for augmentation of the proportional controller with a signal derived from the velocity of the prey in tiger beetles and other insects is curious. Several groups of insects, such as dragonflies [26,27], mantids [28] and various families of flies (blow flies [29]; hover flies [30]), have visual neurons that are excited by motion of small targets through their receptive fields. Thus, such neurons would ideally encode a target motion signal that could be used for visual guidance. Even the well-studied TSDNs of the dragonfly, which as a population encode a vector indicating the direction of moving prey [31], do not seem to carry velocity information about target motion that could augment positional information. The presence of ideally responsive neurons, however, does not mean that they are used to guide pursuit behaviour. Thus, it remains an open question whether any insect is capable of using target velocity information to augment its position-sensitive control during visually guided pursuit and more careful behavioural studies directly addressing this issue would be informative.
4. Physical interpretation of the control law
The results of our correlation analyses and simulations reveal that tiger beetles in closed-loop pursuit of prey use a visual guidance control law that is well described as a proportional controller of the form  in which the beetle's angular velocity ωb is driven by the visual angular position of the prey θe with a lag of 28 ms. Proportional controllers in which the target angular position in the visual field drives the pursuer's angular velocity after a short delay have been found in other insect pursuit systems. Male flies of many families use closed-loop, continuous control and attempt to reduce the positional error of the target to zero in azimuth, and presumably elevation, although in practice the well-studied pursuits have only examined pursuit flights in the horizontal plane [9,13,14,32]. Moreover, Wagner's [33] fully three-dimensional study of chasing flies failed to find any statistical relationship between vertical visual error and the pursuer's elevational angular velocity in the pitch plane. Dragonflies may also use simple proportional control in which positional changes of the target are followed by changes in the pursuit trajectory after a short lag [12]. Praying mantids visually track prey with closed-loop smooth pursuit and open-loop saccadic head movements. Nevertheless, the angular velocity of the saccades is related to the prey angular positional error [34]. Thus, proportional controllers of the type found in tiger beetles are common in visually guided pursuit by insects. We will focus on the gain and lag of the tiger beetle's control law, as well as develop the physical interpretation of the control law.
4.1. Interpretation of the gain k
The dynamical behaviour of the beetle's heading, governed by ωb(t) = kθe(t − τ), depends on the relationship between k and τ (figure 11), as the solution to this time-delayed differential equation depends on the relation between k and τ. When kτ = 1/e, the system is critically damped (see the electronic supplementary material for a derivation of this). In our system, at a time delay of τ = 28 ms, the system would be critically damped at k = 1/eτ = 13.1 s−1. Therefore, the observed k = 12 s−1 corresponds to a feedback control just below critical damping. That is, at k = 12 s−1, the beetle minimizes the error angle in close to the shortest possible time. Above the critical k, the orientation would oscillate about zero. Below the critical k, it would take longer to approach to zero.
Figure 11.
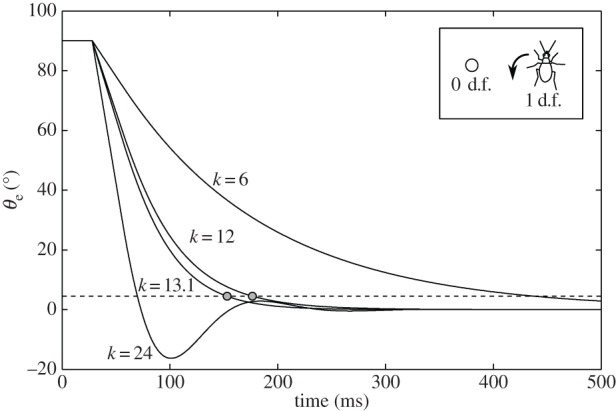
Simulation of the effect of the gain k on a beetle's dynamics. Inset: the simulated beetle turns according to the proportional control law,  , and has no linear velocity. The initial error angle θe is 90°. The dashed line corresponds to θe = 4.5°, 5% of the initial value, and also represents the amount of visual wobble induced by the alternating tripod gait. The system is critically damped with a gain of 13.1 s−1.
These effects are illustrated in simulations of the delayed differential equation with different values for k (figure 11). A stationary prey is positioned at an initial error angle θe = 90°. At the critical value of k = 13.1 s−1, it takes 153 ms to reduce the error to 5% of the initial value while it takes 177 ms when k = 12 s−1.
4.2. Interpretation of the delay τ
The time delay of the running tiger beetle's control system, 28 ms, is within the range measured for other visual guidance control systems of flying insects: fruit fly, 20–30 ms [35]; lesser house fly, 20–40 ms [9]; house fly, 10–50 ms [33,36]; blowfly, 20 ms [14]; long-legged fly, 20 ms [32]; hover fly, 10–20 ms [13,37]; dragonfly, 28 ms [12]. The values reported by some authors, e.g. [14], admittedly may be overestimates due to slow camera speed when the best correlation between target position and the pursuer's angular velocity occurs with a lag of a single frame. Thus, the actual lag could be shorter than that reported. Nevertheless, the wingbeat period of these flying insects is much faster than these lags reported for visual control. Flies respond to mechanical perturbations during flight more quickly. Halteres that sense such perturbations of flight trajectory do supply sensory information to the wings with each stroke [38]. Nevertheless, several wing strokes occur before the control system begins to correct the perturbation about 12 ms later [20]. Thus, even in this fast system, control from sensor to actuator does not appear to operate on a wingstroke-by-wingstroke basis. Given the longer lags of the visual control systems, it is even more unlikely that visual information is used to control wing actuation on a wingstroke-by-wingstroke basis. A delay of 10–50 ms may simply be how long it takes for a signal to get through the retina, optic lobe and down to the thoracic musculature to initiate a change in body orientation.
With the running tiger beetle, however, the control system's delay value of 28 ms may be interpreted differently because it is almost identical to the time it takes to alternate between the two sets of tripods, i.e. half of the measured stride period of 55 ms. We are therefore tempted to think that the observed time delay is functionally coupled with actuation time. That is, each time the beetle places one set of leg tripods into stance phase, it adjusts the forces in response to the error angle measured at a time one half-stride earlier. This would imply that the net time it takes the beetle to measure the error angle and the time to make a neural calculation of how much force and torque to apply occur within a half-stride.
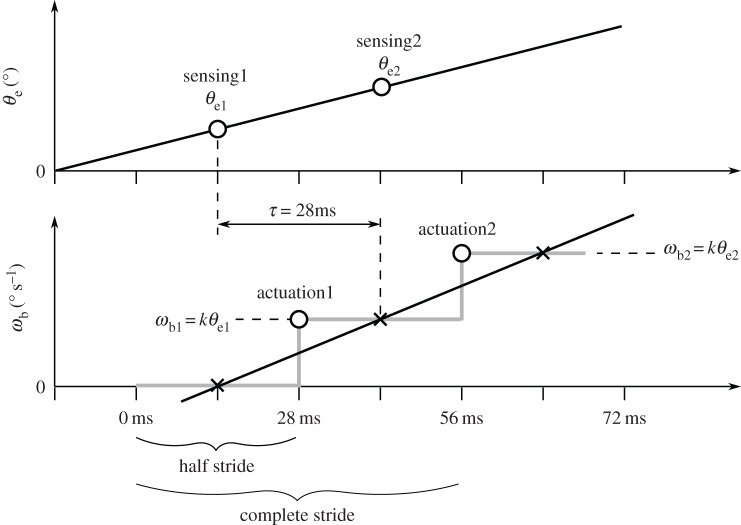
We further note that the time delay found in the statistical correlation does not necessarily correspond to the delay between sensing and actuation in a discrete control system. To illustrate this, we consider an ideal case in which the error angle θe increases linearly (figure 12). If the system is continuous, then the response (ωb) is also a linearly increasing function (black curve) with a fixed delay. However, if the actuation is discrete, then ωb can follow a different time course. In the case shown above, the delay between sensing and actuation is only half of the delay in the continuous model.
Figure 12.
In this scenario, discrete sensing and one discrete actuation per half-stride are assumed. Although the continuous linear angular velocity (ωb) function has a delay of 28 ms to the linear error angle (θe) function, the time delay between discrete sensing and actuation is 14 ms. See text for further explanation.
In figure 12, the grey curve shows one possible case of actuation dynamics in which the torque is applied at discrete time steps. In this step function, the beginning of each step represents the time the beetle actuates by applying torque. To ensure that the beetle turns the same amount as in the continuous model at the end of each step, the integrals of the linear function and the step function must be the same. Thus, the two functions intersect in the middle of each of the constant ωb periods (figure 12, black crosses). By assuming discrete sensing of the error angle θe, we can find the time when sensing happens by finding the correct θe values corresponding to the ωb step values. From the definition of the continuous ωb response, we know that ωb at the intersection point is proportional to the value of θe 28 ms earlier. Actuation, however, happens 14 ms before the intersection point as the curves intersect in the middle of the constant ωb period. The θe value proportional to the ωb period is 28 ms before intersection and 14 ms before actuation. This is the θe value used to control ωb at the following discrete actuation and therefore represents the time of discrete sensing. Consequently, in the given scenario the time difference between sensing and actuation is 14 ms although the continuous linear functions have a delay of 28 ms.
4.3. Interpreting the control law in terms of a walking strategy
We conclude by offering a mechanical interpretation of the proportional control law. So far, we have not assumed any physical law governing the beetle's dynamics. The control law was deduced from the statistical correlations. This control law now allows us to deduce the underlying dynamic law associated with walking.
As the first guess, we may argue that the proportional control law implies  , by taking the time derivative on each side. This would further imply that the tiger beetle exerts a torque in proportion to
  because torque is proportional to
  ,
,  . While this relation is statistically true, it does not lend itself to a simple mechanical picture of walking dynamics. It is also unlikely that the beetle's walking is driven by
  which is not a directly measured quantity.
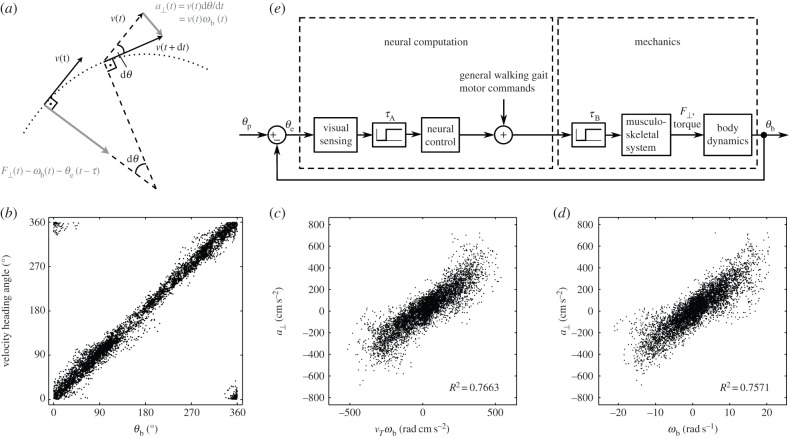
Instead, a more natural interpretation of this control law comes from considering sideways force generation. We can see from geometry that the sideways acceleration is proportional to the body's rotational rate, a⊥(t) = v(t)ωb(t). To see this, first consider the case of a moving point mass, the sideways acceleration, i.e. the acceleration perpendicular to the path, is given by the product of its translational velocity and the turning rate along the arc, a⊥ = v(dθ/dt) (figure 13a). Since the beetle's orientation is almost tangential to the path (figure 13b), its turning rate is the same as that of a point along the arc, ωb = dθ/dt. Therefore, a⊥ = vωb. Although the translational velocity is not strictly a constant, a⊥∼ ωb still turns out to be a good description of the data (figure 13d). Given this, the control law ωb(t) = kθe(t − τ) can be viewed as a consequence of the dynamic law Ma⊥(t) = k′θe(t − τ). An advantage of viewing the control law in this way is that it suggests a walking strategy for the pursuit dynamics. That is, on average, the beetle exerts sideways force in proportion to the error measured one half-stride earlier.
Figure 13.
Physical interpretation of the control of angular velocity ωb. (a) The sideways force is proportional to the angular rotational rate of a point travelling along the arc. (b–d) The beetle's orientation is almost tangential to the path, and F⊥(t) ∼ a⊥(t) ∼ ωb(t). (e) A sketch of the flow of the feedback control system.
5. Conclusion
In summary, our statistical analyses of pursuit dynamics of tiger beetles show that they use a proportional control law to catch their prey. We further argue that the proportional control law is a manifestation of a walking strategy. To turn towards the prey, the beetle biases its alternating tripods to generate a sideways force proportional to the error angle measured a half-stride earlier. The data also show that the beetle adopts a nearly optimal gain value so that it minimizes the error angle in close to the shortest possible time.
Funding statement
C.G. acknowledges support from NSF award IOS 0950688.
References
- 1.Chittka L, Niven J. 2009. Are bigger brains better? Curr. Biol. 19, R995–R1008 (doi:10.1016/j.cub.2009.08.02) [DOI] [PubMed] [Google Scholar]
- 2.Wehner R. 1981. Spatial vision in arthropods. In Handbook of sensory physiology, vol. VII/6C (ed. Autrum H.), pp. 287–616 Berlin, Germany: Springer [Google Scholar]
- 3.Schlegel T, Schuster S. 2008. Small circuits for large tasks: high-speed decision-making in archerfish. Science 319, 104–106 (doi:10.1126/science.1149265) [DOI] [PubMed] [Google Scholar]
- 4.Tucker V, Tucker A, Akers J, Enderson K. 2000. Curved flight paths and sideways vision in peregrine falcons, Falco peregrinus. J. Exp. Biol. 203, 3755–3763 [DOI] [PubMed] [Google Scholar]
- 5.Yovel Y, Falk B, Moss C, Ulanovsky N. 2010. Optimal localization by off axis pointing. Science 327, 701–704 (doi:10.1126/science.1183310) [DOI] [PubMed] [Google Scholar]
- 6.Kruuk H. 1972. The spotted hyena: a study of predation and social behavior. Chicago, IL: University of Chicago Press [Google Scholar]
- 7.Drea CM, Carter AN. 2009. Cooperative problem solving in a social carnivore. Anim. Behav. 78, 967–977 (doi:10.1016/j.anbehav.2009.06.030) [Google Scholar]
- 8.Collett TS, Land MF. 1978. How hoverflies compute interception courses. J. Comp. Physiol. A 125, 191–204 (doi:10.1007/BF00656597) [Google Scholar]
- 9.Land MF, Collett TS. 1974. Chasing behaviour of houseflies (Fannia canicularis). J. Comp. Physiol. A 89, 331–357 (doi:10.1007/BF00695351) [Google Scholar]
- 10.Gries M, Koeniger N. 1996. Straight forward to the queen: pursuing honeybee drones (Apis mellifera L.) adjust their body axis to the direction of the queen. J. Comp. Physiol. A 179, 539–544 (doi:10.1007/BF00192319) [Google Scholar]
- 11.Olberg RM, Worthington AH, Venator KR. 2000. Prey pursuit and interception in dragonflies. J. Comp. Physiol. A 186, 155–162 (doi:10.1007/s003590050015) [DOI] [PubMed] [Google Scholar]
- 12.Olberg R, Seaman R, Coats M, Henry A. 2007. Eye movements and target fixation during dragonfly prey-interception flights. J. Comp. Physiol. A 193, 685–693 (doi:10.1007/s00359-007-0223-0) [DOI] [PubMed] [Google Scholar]
- 13.Collett TS, Land MF. 1975. Visual control of flight behavior in the hoverfly, Syritta pipiens. J. Comp. Physiol. A 99, 1–66 (doi:10.1007/BF01464710) [Google Scholar]
- 14.Boeddeker N, Kern R, Egelhaaf M. 2003. Chasing a dummy target: smooth pursuit and velocity control in male blowflies. Proc. R. Soc. Lond. B 270, 393–399 (doi:10.1098/rspb.2002.2240) [DOI] [PMC free article] [PubMed] [Google Scholar]
- 15.Gilbert C. 1997. Visual control of cursorial prey pursuit by tiger beetles (Cicindelidae). J. Comp. Physiol. A 181, 217–230 (doi:10.1007/s003590050108) [Google Scholar]
- 16.Leonardo A. 2013. Guidance laws underlying prey capture in the dragonfly. Integr. Comp. Biol. 53(Suppl. 1), e125 [Google Scholar]
- 17.Frye M, Olberg RM. 1995. Receptive field properties of feature detecting neurons in the dragonfly. J. Comp. Physiol. A 177, 569–576 (doi:10.1007/BF00207186) [Google Scholar]
- 18.Pearson D, Vogler A. 2001. Tiger beetles: the evolution, ecology, and diversity of the Cicindelids. Ithaca, NY: Cornell University Press [Google Scholar]
- 19.Dickinson MH, Farley CT, Full RJ, Koehl MA, Kram R, Lehman S. 2000. How animals move: an integrative view. Science 288, 100–106 (doi:10.1126/science.288.5463.100) [DOI] [PubMed] [Google Scholar]
- 20.Ristroph L, Bergou AJ, Ristroph G, Coumes K, Berman G, Guckenheimer JM, Wang ZJ, Cohen I. 2010. Discovering the flight autostabilizer of fruit flies by inducing aerial stumbles. Proc. Natl Acad. Sci. USA 107, 4820–4824 (doi:10.1073/pnas.1000615107) [DOI] [PMC free article] [PubMed] [Google Scholar]
- 21.Tytell ED, Holmes P, Cohen AH. 2011. Spikes alone do not behavior make: why neural science needs biomechanics. Curr. Opin. Neurobiol. 21, 816–822 (doi:10.1016/j.conb.2011.05.017) [DOI] [PMC free article] [PubMed] [Google Scholar]
- 22.Roth E, Sponberg S, Cowen NJ. 2014. A comparative approach to closed-loop computation. Curr. Opin. Neurobiol. 25, 54–62 (doi:10.1016/j.conb.2013.11.005) [DOI] [PubMed] [Google Scholar]
- 23.Cowan NJ, Lee J, Full RJ. 2006. Task-level control of rapid wall following in the American cockroach. J. Exp. Biol. 209, 1617–1629 (doi:10.1242/jeb.02166) [DOI] [PubMed] [Google Scholar]
- 24.Land MF. 1992. Visual tracking and pursuit: humans and arthropods compared. J. Insect Physiol. 38, 939–951 (doi:10.1016/0022-1910(92)90002-U) [Google Scholar]
- 25.Boeddeker N, Egelhaaf M. 2005. A single control system for smooth and saccade-like pursuit in blowflies. J. Exp. Biol. 208, 1563–1572 (doi:10.1242/jeb.01558) [DOI] [PubMed] [Google Scholar]
- 26.O'Carroll DC. 1993. Feature-detecting neurons in dragonflies. Nature 362, 541–543 (doi:10.1038/362541a0) [Google Scholar]
- 27.Olberg R. 2012. Visual control of prey capture flight in dragonflies. Curr. Opin. Neurobiol. 22, 267–271 (doi.org/10.1016/j.conb.2011.11.015) [DOI] [PubMed] [Google Scholar]
- 28.Gonka MD, Laurie TJ, Prete FR. 1999. Responses of movement-sensitive visual interneurons to prey-like stimuli in the praying mantis Sphodromantis lineola (Burmeister). Brain Behav. Evol. 54, 243–262 (doi:10.1159/000006626) [DOI] [PubMed] [Google Scholar]
- 29.Egelhaaf M. 1985. On the neural basis of figure-ground discrimination by relative motion in the visual system of the fly. Biol. Cybern. 52, 123–140 (doi:10.1007/BF00364003) [Google Scholar]
- 30.Nordstrom K, Barnett PD, O'Carroll DC. 2006. Insect detection of small targets in visual clutter. PLoS Biol. 4, 378–386 (doi:10.1371/journal.pbio.0040054) [DOI] [PMC free article] [PubMed] [Google Scholar]
- 31.Gonzalez-Bellido PT, Penga H, Yanga J, Georgopoulos AP, Olberg R. 2013. Eight pairs of descending visual neurons in the dragonfly give wing motor centers accurate population vector of prey direction. Proc. Natl Acad. Sci. USA 110, 696–701 (doi:10.1073/pnas.1210489109) [DOI] [PMC free article] [PubMed] [Google Scholar]
- 32.Land MF. 1993. Chasing and pursuit in the dolichopodid fly Poecilobothrus nobilitatus . J. Comp. Physiol. A 173, 605–613 (doi:10.1007/BF00197768) [Google Scholar]
- 33.Wagner H. 1986. Flight performance and visual control of flight of the free-flying housefly (Musca domestica L.). II. Pursuit of targets. Phil. Trans. R. Soc. Lond. B 312, 553–579 (doi:10.1098/rstb.1986.0018) [Google Scholar]
- 34.Liske E, Mohren W. 1984. Saccadic head movements of the praying mantis, with particular reference to visual and proprioceptive information. Physiol. Entomol. 9, 29–38 (doi:10.1111/j.1365-3032.1984.tb00678.x) [Google Scholar]
- 35.Bülthoff H, Poggio T, Wehrhahn C. 1980. 3-D analysis of the flight trajectories of flies (Drosophila melanogaster). Zeit. Naturforsch. 35c, 811–815 [Google Scholar]
- 36.Wehrhahn C, Poggio T, Bülthoff H. 1982. Tracking and chasing in houseflies: an analysis of 3D flight trajectories. Biol. Cybern. 45, 123–130 (doi:10.1007/BF00335239) [Google Scholar]
- 37.Collett TS. 1980. Angular tracking and the optomotor response: an analysis of visual reflex interaction in a hoverfly. J. Comp. Physiol. A 140, 145–158 (doi:10.1007/BF00606306) [Google Scholar]
- 38.Fayyazuddin A, Dickinson MH. 1996. Haltere afferents provide direct, electrotonic input to a steering motor neuron in the blowfly, Calliphora . J. Neurosci. 16, 5225–5232 [DOI] [PMC free article] [PubMed] [Google Scholar]


