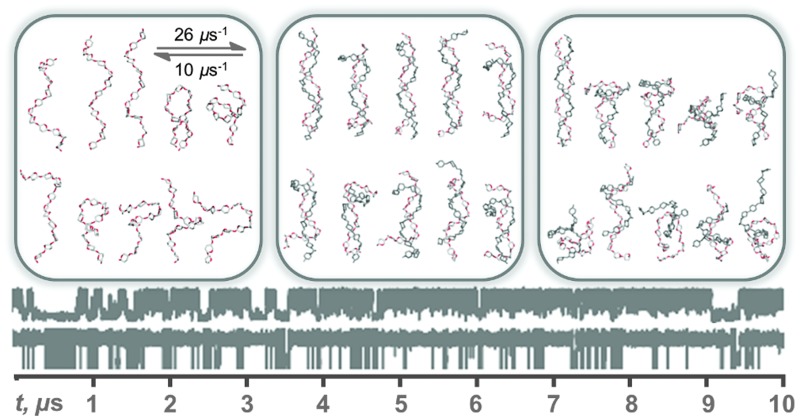
 Amylose, a component of starch with increasing biotechnological significance, is a linear glucose polysaccharide that self-organizes into single- and double-helical assemblies.
Abstract
Amylose, a component of starch with increasing biotechnological significance, is a linear glucose polysaccharide that self-organizes into single- and double-helical assemblies. Starch granule packing, gelation and inclusion-complex formation result from finely balanced macromolecular kinetics that have eluded precise experimental quantification. Here, graphics processing unit (GPU) accelerated multi-microsecond aqueous simulations are employed to explore conformational kinetics in model single- and double-stranded amylose. The all-atom dynamics concur with prior X-ray and NMR data while surprising and previously overlooked microsecond helix–coil, glycosidic linkage and pyranose ring exchange are hypothesized. In a dodecasaccharide, single-helical collapse was correlated with linkages and rings transitioning from their expected syn and 4 C 1 chair conformers. The associated microsecond exchange rates were dependent on proximity to the termini and chain length (comparing hexa- and trisaccharides), while kinetic features of dodecasaccharide linkage and ring flexing are proposed to be a good model for polymers. Similar length double-helices were stable on microsecond timescales but the parallel configuration was sturdier than the antiparallel equivalent. In both, tertiary organization restricted local chain dynamics, implying that simulations of single amylose strands cannot be extrapolated to dimers. Unbiased multi-microsecond simulations of amylose are proposed as a valuable route to probing macromolecular kinetics in water, assessing the impact of chemical modifications on helical stability and accelerating the development of new biotechnologies.
Introduction
Starch is a major plant energy storage material comprising a source-dependent mix of two α(1 → 4) linked d-glucose (Glc) polysaccharides: linear amylose and α(1 → 6) branched amylopectin. Amylose is smaller in size, typically less abundant and pivotal to the aqueous insolubility and partial crystallinity of starch granules.1 A major dietary component, amylose is also used as a thickener, stabilizer and gelling agent in foods, cosmetics, textiles and paper.2 It has recently been employed as a prototype biotechnological device, with notable successes in host–guest inclusion3,4 and for improving the biocompatibility of carbon nanotubes,5 drugs and flavor ingredients.6 These diverse current and potential applications stem from the dynamic molecular shape of amylose, which gives rise to characteristic helices and self-association.
A helical amylose structure was first reported in 1943.7 Subsequent X-ray studies have revealed three principal crystal allomorphs: single-helical V-type amylose and the A- and B-type double-helices (from cereals and tubers, respectively). Flexible in solution, V-amylose has been found by X-ray analyses to include six, seven or eight monosaccharides per helical turn.8 The A and B forms are more rigid and differ only in their packing arrangement, with six pyranoses per turn.9 Water plays a key role in amylose shape and single-helix stability can be tuned by solvent and chemical modifications that modulate inter- and intra-molecular hydrogen-bonding (e.g., DMSO10 and alkylation11). Interrupting these through-space interactions while maintaining higher-order helical structures is a promising route to improving the solubility of amylose-based materials.12
Precise quantification of aqueous conformational exchange rates in amylose has eluded experimental techniques. For example, iodine induced self-assembly rates can only be estimated to occur in the sub-ms domain.13 Solution NMR has revealed single-stranded amylose to transition between compact coils and extended helices10 but more detailed analyses using this technique are restricted by severe resonance overlap.
The kinetics of conformational exchange in amylose glycosidic linkages and pyranose rings also remain enigmatic. Reversible rotation of the amylose α(1 → 4) glycosidic ψ torsion through ≈180°, a syn → anti transition or band-flip, interrupts helical shapes causing chain kinks that are associated with coiled structures in cyclic amyloses.14,15 Constituent rings may also be flexible in water and Glc conformational transitions are thought to underlie amylose elasticity.16 While the Glc 4 C 1 chair is favored, the aqueous pyranose ring puckering equilibrium is sensitive to the chemical environment (e.g., substituents17 and anomeric configuration18). Recent graphics processing unit (GPU) accelerated simulations have predicted μs conformational exchange to occur in β-d-glucose19 but this has not yet been explored in linear α(1 → 4) linked Glc chains.
Further conformational insights into aqueous amylose motions have been derived from computational studies of fragments using molecular dynamics20–23 and Monte Carlo24 methods. However, unbiased simulations have been limited by computational cost to short ns timescales and theoretical techniques that artificially enhance conformational sampling preclude calculation of accurate kinetic data for exchange between molecular shapes.25 While coarse grained modeling has provided macroscopic conformational predictions for large amylose chains,26 until recently27 such mesoscale approaches have neglected pyranose ring puckering and have also been based on predictions from ns simulations.
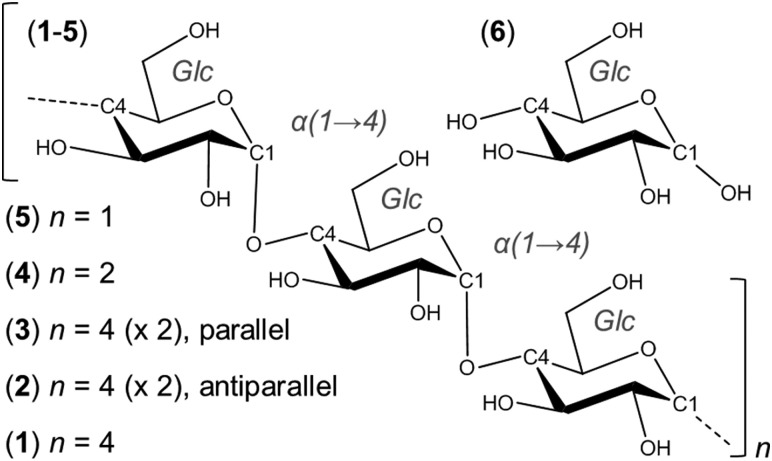
Here, GPU-accelerated all-atom simulations were used to explore the microsecond kinetics of amylose macromolecular motions in water, to improve understanding of biological function and to enable future engineering of derivative biotechnological materials. In particular, 10 μs simulations were carried out on a model amylose dodecasaccharide (1) and model dodecasaccharide double-helices, initiated in both antiparallel and parallel configurations (2 and 3). For comparison, 10 μs simulations of a constituent hexa-, tri- and monosaccharide (4, 5 and 6) were also performed (Fig. 1). These trajectories were used to identify and characterize μs conformational exchange rates for helix–coil, glycosidic linkage and pyranose ring transitions. Additionally, the effects of chain length, position, tertiary association and double-helix directionality on these degrees of freedom were investigated.
Fig. 1. Chemical structures of amylose fragments simulated for 10 μs each in explicit water. The double-stranded models 2 and 3 were initiated in antiparallel and parallel double-helical configurations, respectively. Polymers 1–5 were hydroxyl-terminated (at the 1- and 4-positions) to form the α-anomer.
Results and discussion
Experimental consistency and microsecond exchange
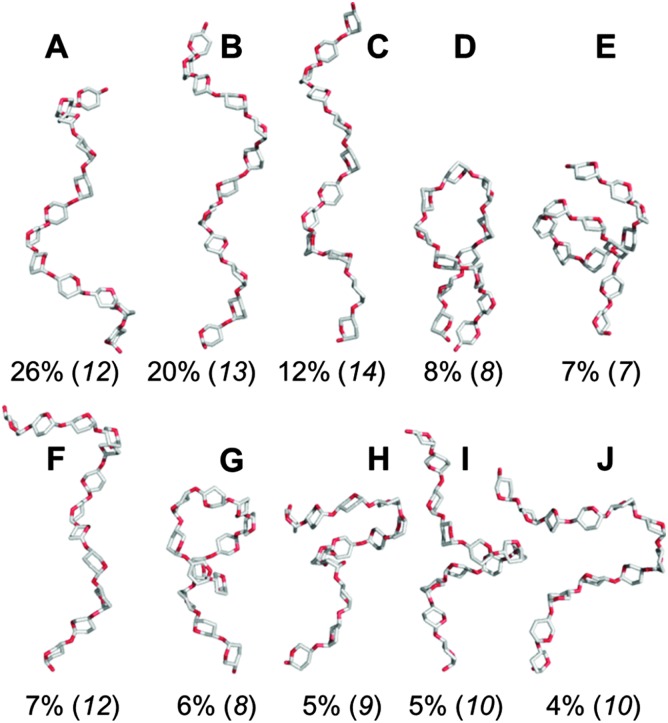
The mean radius of gyration, R g, and the standard deviation of this mean (see Methods) in the simulations of 1, 2 and 3 (see Fig. 1 for structures) were 11.5 (±1.1) Å, 13.2 (±0.3) Å and 14.4 (±0.1) Å, respectively, consistent with prior experiments of similar amylose fragments.28 The dodecasaccharide 1 underwent numerous μs timescale transitions between helical and coiled shapes (Fig. 2, vide infra), which have been hypothesized to exist based on aqueous NMR experiments.10
Fig. 2. Representative aqueous shapes for a model amylose dodecasaccharide 1 derived via hierarchical clustering of a 10 μs explicit solvent simulation. Percentage occupancies and radii of gyration (in parentheses) are illustrated. Hydrogen atoms and pyranose ring substituents are hidden for clarity.
In 1–5, the single major α(1 → 4) glycosidic linkage syn conformer was centered on (φ,ψ) ≈ (70°,90°), in agreement with the consensus from X-ray and solution NMR studies.20,29–31 Almost half of the linkages (28/62) underwent reversible μs exchange between this and a second minor anti conformer centered on ≈(70°,–60°). These geometries agree with major and minor conformers inferred from ns molecular dynamics simulations and ab initio calculations of α(1 → 4) linked Glc di- and tetrasaccharides.20,32 The anti conformer, while consistent with the band-flipped geometry in cycloamyloses observed by X-ray diffraction,14,15 was predicted to be populated for at most 4% (see ESI†) in the 10 μs trajectories (with the exception of the non-reducing end linkage in 4, 9%); such low populations are unlikely to be detectable by standard spectroscopic experiments, perhaps explaining why they have not been reported previously. Further experimental work is deemed necessary to confirm these predictions.
The pyranose 4 C 1 chair pucker was predominant in all Glc rings from the simulations of 1–6 (see ESI†). Pyranose puckering approached conformational equilibrium in all Glc rings after several μs, in agreement with recent simulations.17–19,27,33,34 The majority of pyranoses (63/70) reversibly transitioned from the most populated 4 C 1 chair to the inverted 1 C 4 pucker. Rings populated non-4 C 1 puckers for 1–15% during the simulations, consistent with analysis of 174 Glc-protein X-ray co-complexes (<2 Å resolution), where 11% contained non-4 C 1 Glc shapes (see ESI†). Resonance overlap and conformational averaging compound precise experimental quantification of such low pyranose pucker populations by NMR. Predicted ring 1H–1H spin-vicinal couplings (3 J HH), however, were in acceptable agreement with prior measurements for free 1-O-methyl-Glc35 and a maltose disaccharide,36 which are not indicative of perfect 4 C 1 Glc chairs (see ESI†). The trend for computed ring 3 J HH values to be lower than experiment (and to deviate by up to 2 Hz) was consistent with previous comparisons using GLYCAM06.17,34 This may be attributable to slight differences in chemical environments (simulation vs. experiment) or force field inaccuracies.17,34
These analyses show agreement between the μs simulations of 1–6, X-ray, solution NMR, ns molecular dynamics and ab initio computational studies. Experimentally observed shape, glycosidic linkage and pyranose ring conformers were sampled extensively while hitherto unquantified μs conformational exchange was predicted. The simulations lead us to conclude that modeling of α(1 → 4) linked Glc oligosaccharides on μs timescales is both essential and valuable, enabling quantitative predictions of currently enigmatic helix–coil, glycosidic linkage and pyranose ring exchange kinetics.
Polymer kinetics in a dodecasaccharide model
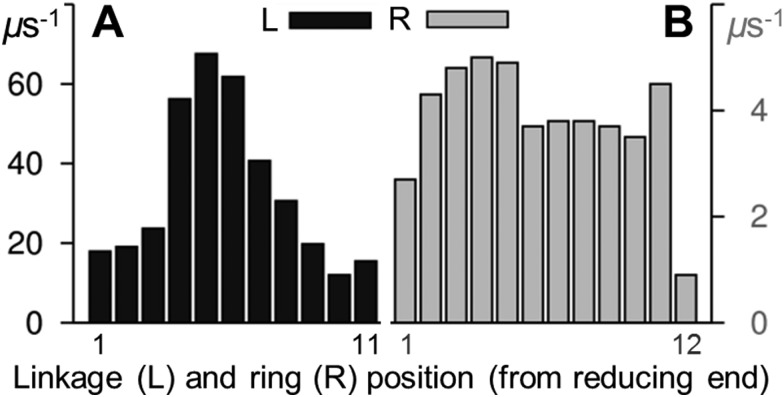
In 1, glycosidic linkage syn ↔ anti exchange occurred more frequently towards the middle of the dodecasaccharide. Computed forward rates (Fig. 3) ranged from ≈10 μs–1 (at the termini) to ≈70 μs–1 (at the chain center). Over 10 μs, only two such transitions were present in the hexasaccharide 4 (in the central and non-reducing end linkages) and just one occurred in the trisaccharide 5 (at the non-reducing end). The simulation of 5 was extended to 20 μs and a single further glycosidic linkage syn → anti transition occurred (see ESI†).
Fig. 3. Forward aqueous transition rates for (A) glycosidic linkages (ψ, syn → anti) and (B) pyranose rings (θ, 4 C 1 → 1 C 4) in a model amylose dodecasaccharide 1. Linkage exchange rates (black) were derived by counting transitions of ψ from positive (syn) to negative (anti) values. Ring inversion rates (grey) were derived by counting as θ exchanged from ≤60° (4 C 1) to ≥120° (1 C 4). Molecular properties were calculated from a 10 μs unbiased explicit solvent simulation.
The terminal Glc rings of 1 underwent forward (4 C 1 → 1 C 4) chair–chair exchange at a rate of ≈1–2 μs–1. All internal rings inverted more frequently, in the range ≈4–5 μs–1 (Fig. 3). This end-effect was not apparent in the shorter hexa- and tri-saccharide (4 and 5, respectively) where forward ring transitions were within ±0.3 μs–1 of each other and chair–chair exchange occurred at notably slower rates compared to in 1 (<1 μs–1). The single exception to this trend was the pyranose adjacent to the reducing end in 4, which inverted at a rate of 2 μs–1. The monosaccharide ring 6 inverted at a rate of 0.9 μs–1.
The two dodecasaccharide terminal pyranoses had the inverted 1 C 4 chair as the second most favored pucker, with computed relative free energies (ΔG cf. 4 C 1) of 1.7 and 2.3 kcal mol–1 at the reducing and non-reducing ends, respectively. At the termini, the skew-boat O S 2 was the third most populated Glc ring conformation. However, at all internal residues O S 2 was preferred over 1 C 4 and the free energy separating the chair puckers was greater at ≈3–4 kcal mol–1. Compared with the two terminal pyranoses, the internal Glc rings explored a greater number of non-chair puckers (see ESI†).
In 1–6, the rates of μs ring inversions and linkage syn ↔ anti exchange (1–5 only) were affected by the chain position and the degree of polymerization (as seen previously in μs simulations of human oligosaccharides17–19,27,33,34). Forward pyranose chair–chair exchange rates were less dependent on chain location and length than the linkage syn ↔ anti kinetics. Comparison of puckering in 6 (free α-anomer) with a μs study of the β-d-glucose monosaccharide19 (which underwent forward transitions at a rate of 2 μs–1) implicates anomeric configuration in d-glucose ring flexibility (as for idose18).
The increased rates of internal (cf. terminal) linkage and ring transitions in 1 (Fig. 3), and also the greater flexibility at the chain center in longer fragments (comparing 1, 4 and 5), suggests that the augmented kinetics result from increased mass, concomitant additional momentum and force acting on the chain center. The small range of internal Glc forward inversion rates, across the tri-(<1 μs–1), hexa-(<1–2 μs–1) and dodecasaccharides (≈4–5 μs–1), suggests that chair–chair transitions may have reached a maximum rate in 1. Thus the dodecasaccharide ring kinetics are likely to be representative of polymeric puckering behavior. The large difference in internal linkage syn → anti transition rates, comparing the hexasaccharide 5 (one transition in 10 μs) with the dodecasaccharide 1 (≈70 μs–1), suggests that even faster rates for this exchange could manifest in longer chains. Despite this possibility, the 10 μs simulation of 1 represents the most realistic set of atomic kinetic predictions for single-stranded amylose polymers to date.
Microscopic flexibility underpins helix–coil exchange
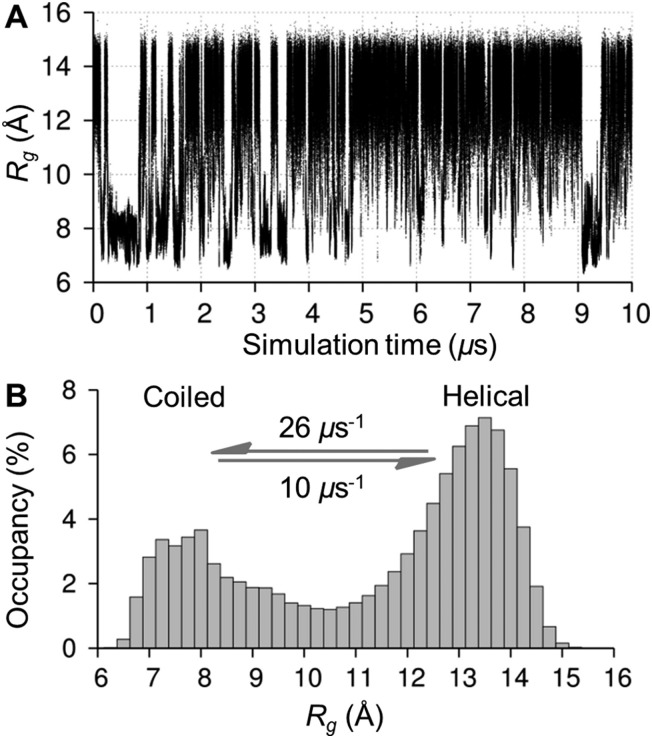
The predominant conformers from the simulation of 1 were helix-like (58% of the simulation) with computed R g values in the range 12–14 Å (Fig. 2A–C). The time series for R g (Fig. 4A) revealed μs exchange between extended shapes and meta-stable self-associating coiled conformers with R g ≈ 8 Å (e.g., Fig. 2D and E). These most compact structures persisted for up to ≈0.5 μs and were associated with a loss of water from the first hydration shell (see ESI†). Transient intermediate conformers contained loop-like and semi-helical sections (e.g., Fig. 2F–J). Helix–coil exchange occurred at forward (helix → coil) and backward rates of 26 and 10 μs–1, respectively (Fig. 4B). Thus, a small free energy barrier to helix–coil transitions in 1 is proposed.
Fig. 4. Aqueous exchange between helical and coiled shapes in a model amylose dodecasaccharide 1. (A) Radius of gyration (R g) time series showing μs timescale helix ↔ coil exchange. (B) Computed conformer populations and calculated transition rates between helical and coiled shapes (defined as R g = 13 Å and R g = 8 Å, respectively). Molecular properties were calculated from a 10 μs unbiased explicit solvent simulation.
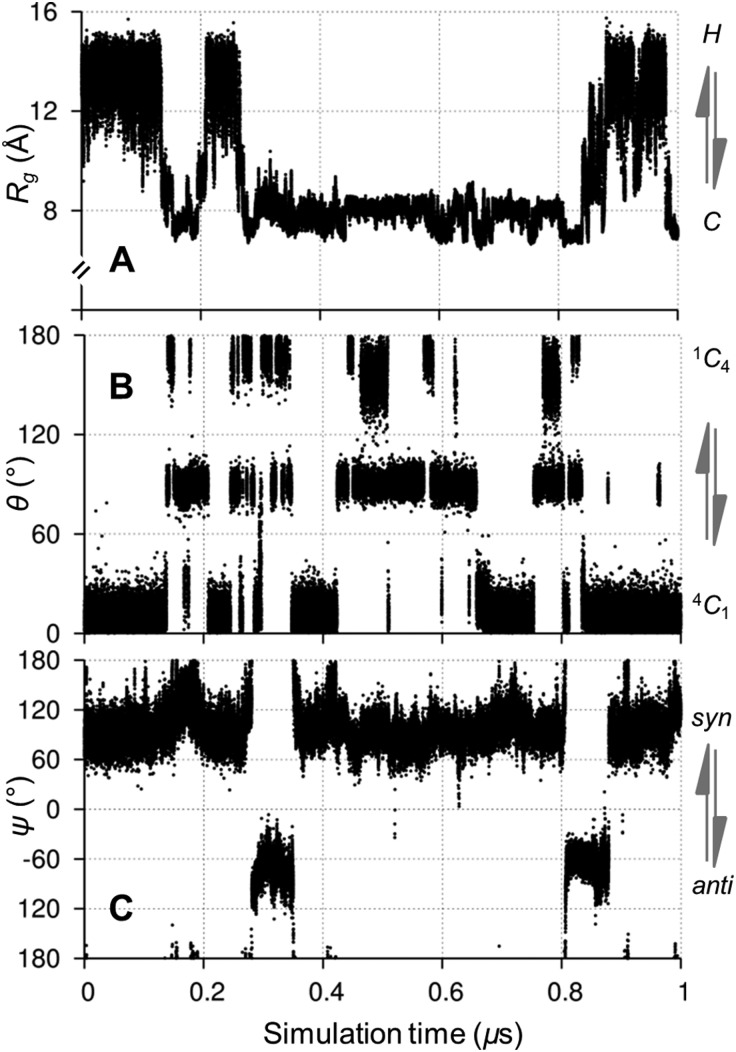
Helix–coil transitions in 1 were correlated with glycosidic linkage and pyranose ring conformational exchange (Fig. 5). In particular, helix collapse was associated with linkages transitioning from the major syn conformer, (φ,ψ) ≈ (70°,90°), to the anti orientation, centered on (70°,–60°), overcoming a computed free energy barrier of ≈8 kcal mol–1 (see ESI†). Interestingly, these helix–coil and linkage transitions in 1 were correlated with pyranose ring exchange from the predominant 4 C 1 chair; this observation is highlighted in Fig. 5 during the initial 1 μs of the simulation (also see ESI†). Correlations between helix–coil, linkage and ring conformational exchange were increasingly prevalent towards the middle of the dodecasaccharide 1.
Fig. 5. Correlated aqueous microsecond conformational exchange in a model amylose dodecasaccharide 1 during the initial 1 μs of a 10 μs unbiased explicit solvent simulation of 1. (A) Transitions between helical (H) and coiled (C) shapes monitored by radius of gyration (R g), (B) 4 C 1 ↔ 1 C 4 chair puckering of ring 5 and (C) syn ↔ anti exchange in glycosidic linkage 6 (numbered from the reducing end). See ESI† for time series of all degrees of freedom.
The predominant helical nature of 1 suggests that in water single-stranded amylose is primed for encapsulation of guest molecules into the helix. While recent ns simulations predicted that V-amylose helices can collapse on short (ns) timescales,22 these molecular dynamics were incapable of exploring the μs helix–coil exchange proposed here. The relatively long-timescale transitions in R g (Fig. 4A) concur with experimental evidence for sub-ms iodine induced helix self-assembly13 but the rate of helix–coil exchange has remained elusive, underscoring that the simulation of 1 provides a route to novel atomic scale kinetic insights into amylose motions.
The correlation between linkage syn ↔ anti exchange and R g in 1 (Fig. 5) is as expected, based on X-ray studies that associate glycosidic linkage anti conformers with coiled cycloamylose shapes.14,15 Ring flexing in 1, in particular the presence of skew-boat puckers in coiled conformers (Fig. 5), is consistent with previous atomic force microscopy measurements that implicate non-chair ring geometries in amylose elasticity16 and also the observation of non-chair puckers in high-resolution Glc-protein co-complexes (vide supra).
The simulation of 1 suggests that the microscopic basis of helix–coil exchange, which underlies gelation and the partial crystallinity of starch granules, involves correlated μs conformational transitions in both linkages and rings. These exchange rates have hitherto been inaccessible to precise quantification by experiments or ns timescale simulations. Based on these computationally-derived insights, it is concluded that GPU-accelerated molecular dynamics simulations are a useful theoretical procedure for assessing the kinetic properties and helical stability of derivatized amyloses, and also for future studies of amylose inclusion complexes (e.g., encapsulated drugs or flavor ingredients).
Microsecond stability of model double-helices
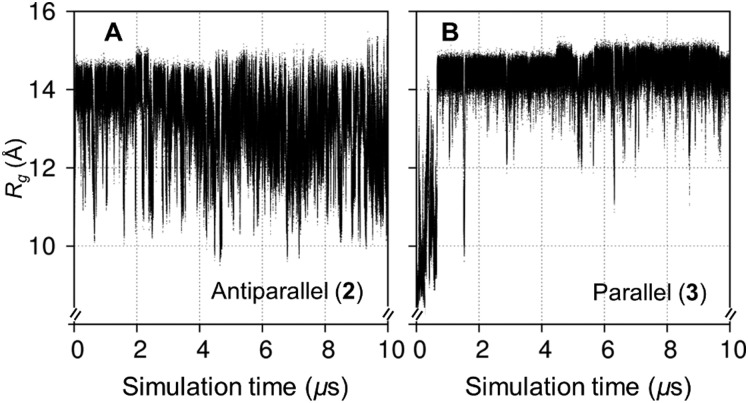
The simulations of 2 and 3 contained μs fluctuations in R g that were not repeatedly sampled (Fig. 6). The parallel double-helix 3 initially disassembled, it reformed over ≈0–1 μs with no similar event being observed in the subsequent 9 μs. Although this double-helical collapse may be attributed to a suboptimal starting geometric configuration (illustrating that similar ns simulations would be sensitive to the initial coordinates), it was concluded that 2 and 3 had not reached conformational equilibrium over 10 μs. While even longer simulations will be needed to confirm this, the dynamics of 2 and 3 were interpreted excluding the initial 1 μs to ensure that properties were derived only from shapes with predominantly double-helical tertiary structures and to facilitate direct comparisons with the model single-stranded amylose 1.
Fig. 6. Microsecond timescale aqueous conformational exchange in model double-stranded amylose fragments 2 (A) and 3 (B). Computed radii of gyration (R g) time series were derived from 10 μs unbiased explicit solvent simulations.
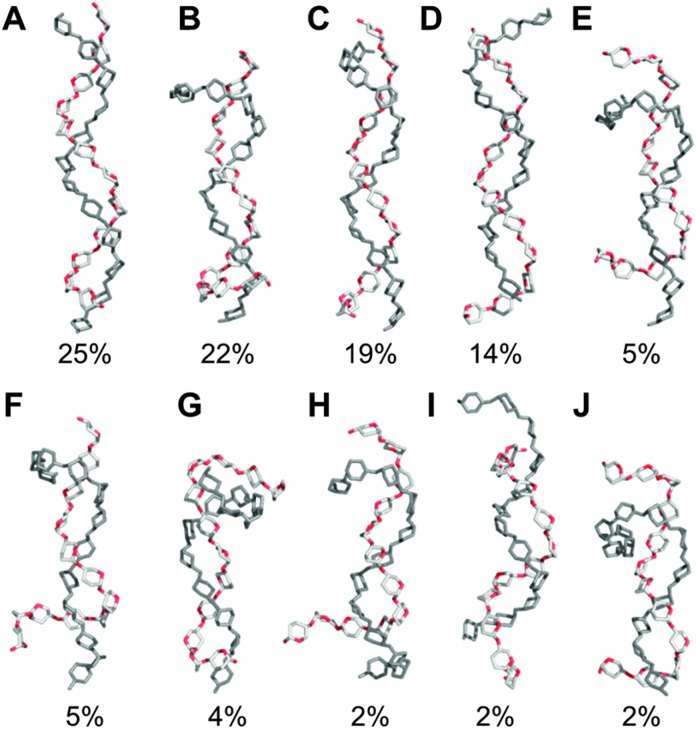
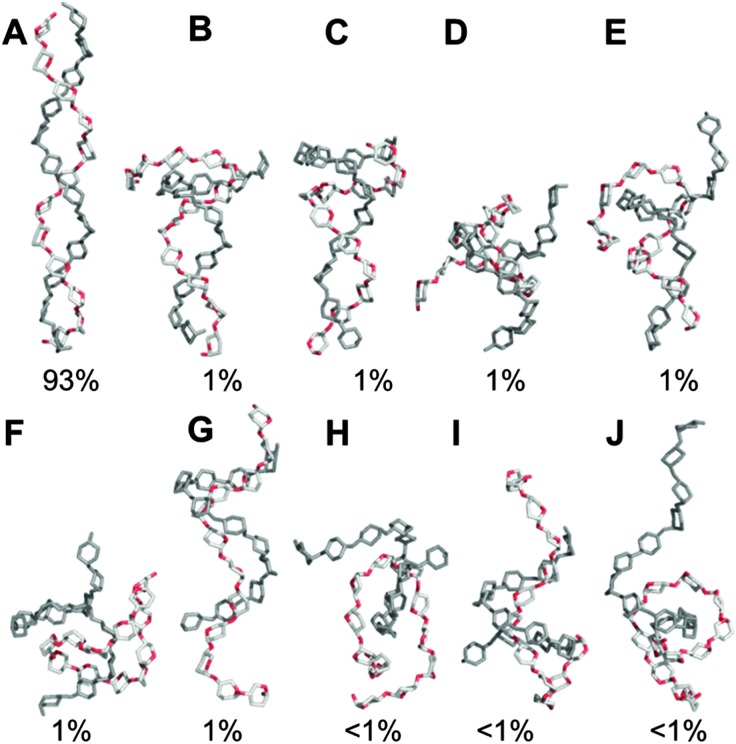
In the simulation of 2, iterative dodecasaccharide dissociation and association at the termini caused frequent reversible transitions from the predominant antiparallel double-helix (R g ≈ 13 Å, Fig. 7A) to more contracted partially unwound shapes (R g < 12 Å, Fig. 7E–J). These conformers were short-lived (tens of ns) and the two chains did not completely dissociate during the 10 μs simulation of 2. The parallel double-helix 3 was comparatively stable for the majority of the 10 μs simulation (93%, Fig. 8A). Its initial collapse resulted in shapes containing coiled and semi-helical dodecasaccharides (Fig. 8B–J). In light of conformers exhibiting two essentially coiled amylose chains in 3 (e.g., Fig. 8F and H), it is noteworthy that this disassembly did not result in dimerization to the antiparallel configuration.
Fig. 7. Representative aqueous shapes and percentage occupancies for a model amylose fragment comprising two antiparallel-aligned dodecasaccharides (2). Conformers were derived via hierarchical clustering of a 10 μs unbiased explicit solvent simulation. Hydrogen atoms and ring substituents are hidden for clarity.
Fig. 8. Representative aqueous shapes and percentage occupancies for a model amylose fragment comprising two parallel-aligned dodecasaccharides (3). Conformers were derived via hierarchical clustering of a 10 μs unbiased explicit solvent simulation. Hydrogen atoms and ring substituents are hidden for clarity.
Considered together, the simulations of 2 and 3 suggest that the parallel configuration is a more stable double-helix in water (cf. antiparallel). This finding supports the consensus view from previous X-ray studies of A type amylose37,38 while remaining consistent with crystallographic evidence for antiparallel double-helices.30
Tertiary organization slows linkage and ring kinetics
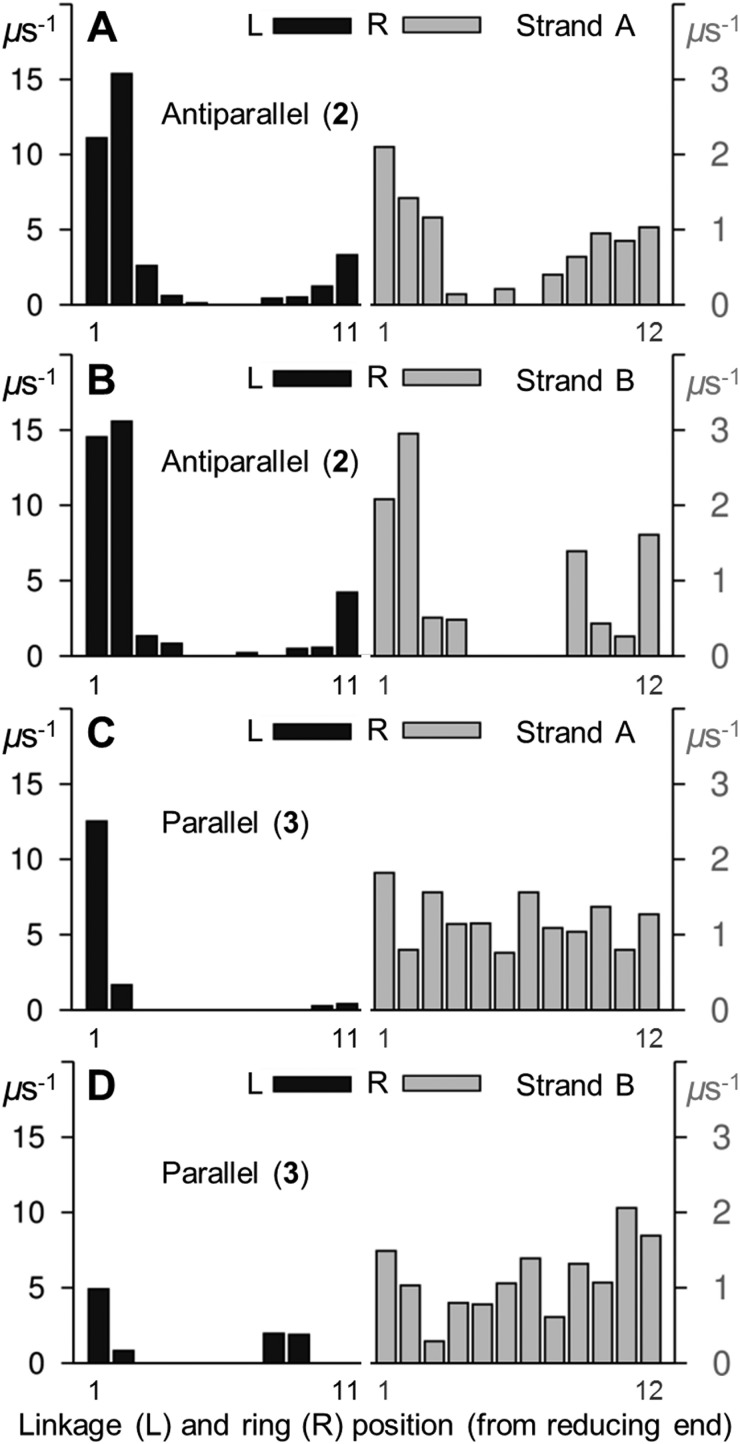
As for 1, the simulations of the antiparallel and parallel double-helices 2 and 3 contained correlated μs conformational transitions in R g, glycosidic linkages and pyranose rings (see ESI†). In both double-helices, the rates of forward linkage (syn → anti) and ring (4 C 1 → 1 C 4) transitions (derived excluding the initial 1 μs) were fastest at the dodecasaccharide termini and prevalent at the reducing ends (Fig. 9). Here, these transitions were more frequent in the antiparallel double-helix 2 (cf. parallel 3). All Glc pyranoses in 3 underwent chair–chair exchange, while ring inversion was comparatively suppressed in the central Glc rings of 2.
Fig. 9. Forward aqueous transition rates for glycosidic linkages (ψ, syn → anti) and pyranose rings (θ, 4 C 1 → 1 C 4) in model double-stranded amylose fragments 2 and 3. Linkage (black) and ring (grey) transition rates are defined in the legend to Fig. 3. Strands A and B are labeled, molecular properties were calculated from 9 μs unbiased explicit solvent simulations of 2 and 3 (i.e., excluding the initial 1 μs).
The finding that glycosidic linkages and pyranose rings exchanged most rapidly at the termini of 2 and 3 contrasts with the model single-stranded amylose dodecasaccharide 1, wherein computed forward transition rates for these degrees of freedom were faster towards the center of the chain (Fig. 3). Furthermore, linkage and ring transitions in 2 and 3 were all much slower than in 1 (comparing the computed rates in Fig. 3 and 9). Recently it was hypothesized that carbohydrate secondary-structure (pyranose stacking) restricts μs ring motions in human N-linked oligosaccharides.34 The observation that dimerization of amylose dodecasaccharides (in 2 and 3) inhibits μs linkage and ring flexibility (cf. in 1) suggests this hypothesis may be extended to higher-order tertiary structural organization. Moreover, it also suggests that caution should be exercised in extrapolating results obtained from simulations of single-stranded amylose to double-stranded assemblies and beyond.
Conclusions
Multi-μs simulations of model single- and double-stranded amyloses using the GLYCAM0639 force-field were found to be in good agreement with previous experiments. In the single-stranded dodecasaccharide, the predominant conformers were helix-like, hitherto unquantified helix–coil exchange was predicted (26 μs–1 forward rate), and evidence for non-4 C 1 chair pyranose puckers was observed, consistent with previous conclusions from atomic force microscopy studies.16 Inferred to have a relatively low free energy barrier to exchange, the model dodecasaccharide helix–coil transitions were correlated with constituent linkage and ring kinetics. Furthermore, the rate of amylose chain dynamics increased with both chain length and distance from an end, leading to the hypothesis that higher chain masses exert greater forces on internal chain segments up to the length of a dodecasaccharide. It is thus proposed that a dodecasaccharide is a good dynamical model for the single-stranded amylose polymer.
Simulations of similar length double-helical amylose models suggested that the parallel form is more stable in water than the antiparallel equivalent. Moreover, tertiary structural organization altered (slowed) local chain dynamics, which advances a recent hypothesis claiming the same with respect to secondary structure in human N-linked oligosaccharides.34 The μs kinetic predictions herein comprise the basis for a quantitative understanding of starch packing, amylose gelation and self-assembly. It is surmised that similar GPU-accelerated simulations can be used to explore amylose host–guest encapsulation and further applied a priori to guide chemical modifications that may influence amylose helical stability. This approach can also be expected to reveal insights into the dynamic structural organization of other more complex polysaccharides, such as amylopectin and glycogen.
Computational methods
Model assemblies
Amylose fragments 1–6 (Fig. 1) were built and modeled using GLYCAM0639 parameters and topologies (i.e., 4GA and 0GA, non-reducing end); the reducing-end terminus hydroxyl was fixed in the α-anomer. Each was solvated in a cubic box of explicit TIP3P40 water using the Amber12 tool tleap.41 Solute atoms were positioned at least 12 Å from the solvent box edge. Side lengths (the number of water molecules present and simulation rate) for each cubic box were as follows: 1, 63 Å (7894, 210 ns per day); 2, 68 Å (9795, 165 ns per day); 3, 66 Å (9042, 155 ns per day); 4, 45 Å (4622); 5, 34 Å (1925); 6, 33 Å (1147). The Glc pyranose rings and glycosidic linkages were set to the 4 C 1 chair and the syn orientation of (φ,ψ) = (60°,120°), respectively (see definitions below), resulting in six Glc residues per helical turn for the dodecasaccharides 1–3, as seen in prior X-ray data8,30,37,42 (at least ten Glc pyranoses are needed for amylose dimerization43). All hydroxymethyl groups were set to the gt conformer. The double-helices 2 and 3 were built manually using copies of 1, avoiding steric clashes while ensuring proximity of inter-strand hydroxymethyl and 2- or 3-position hydroxyls. These hydrogen-bonds were of length 3–5 Å in the initial dimers and thus slightly longer than seen in X-ray data.30,37 This was not expected to impact the results in light of the extensive dynamics, wherein individual strands of the double-helices iteratively unwrapped and re-associated.
Simulations
Unbiased explicit solvent all-atom molecular dynamics simulations of 1–6 (Fig. 1) were performed for 10 μs each using ACEMD44 (Acellera Ltd) and a single NVIDIA GTX TITAN graphics processing unit (5 was extended to 20 μs). Following initial conjugate-gradient energy minimization (1000 steps) the assemblies were heated from 0 to 298 K and then equilibrated in the NPT ensemble for 20 ns prior to 10 or 20 μs of NVT production dynamics. Data were recorded at 10 ps intervals. The velocity-Verlet integration algorithm and a hydrogen mass repartitioning scheme enabled a 4 fs time-step to be used without affecting the equilibrium distribution.45 This scheme has been validated and used to derive experimentally-consistent kinetic conformational models.46 Hydrogen atoms were constrained using M-SHAKE47 and electrostatic interactions were calculated via the PME method, with a grid spacing of less than or equal to 1.0 Å (in the X, Y and Z dimensions). Electrostatic and van der Waals interactions were truncated at 9 Å and the recommended39 scaling factor for carbohydrate 1–4 interactions (1.0) was employed.
Molecular properties
Properties of 1 (dodecasaccharide), 4 (hexasaccharide) and 6 (monosaccharide) were calculated using the complete 10 μs trajectories (i.e., one million datasets). For 2 and 3 (dodecasaccharide double-helices) the last 9 μs were used (see text and ESI†) and for 5 (trisaccharide) the entire 20 μs simulation was employed. Radii of gyration were derived using a standard equation in VMD software,48 with standard deviations of the means being derived from the average of multiple 1 μs sub-sets (see ESI†). The α(1 → 4) glycosidic linkage φ and ψ torsions were calculated using the IUPAC formalism (where n = 4): φ = O5–C1–O–Cn and ψ = C1–O–Cn–C(n–1). Pyranose ring puckering was quantified using the Cremer–Pople49 parameters θ, φ and Q (derived using the GROMACS50 tool g_puckering). Puckers were defined as being one of the 38 canonical conformers, viz.: 4 C 1, O E, O H 1, E 1, 2 H 1, 2 E, 2 H 3, E 3, 4 H 3, 4 E, 4 H 5, E 5, O H 5, 3,O B, 3 S 1, B 1,4, 5 S 1, 2,5 B, 2 S O, B 3,O, 1 S 3, 1,4 B, 1 S 5, B 2,5, O S 2, E O, 1 H O, 1 E, 1 H 2, E 2, 3 H 2, 3 E, 3 H 4, E 4, 5 H 4, 5 E, 5 H O, 1 C 4 (see ESI† for definitions in terms of Cremer–Pople49 θ and φ angles). Here, the θ angle was calculated from ring atoms in the order O5–C1–C2–C3–C4–C5 and puckering convergence (see ESI†) was monitored by inspection of 〈cos θ〉 as previously.17–19,27,33,34 Relative free energies (ΔG) of binned glycosidic linkage conformers and pyranose ring puckers (see ESI†) were computed, as previously,17–19,27,33,34 using the standard relationship ΔG = kT ln(p 1/p 2), where k is the Boltzmann constant, T is temperature (289 K) and p is probability. Linkage and ring conformer populations were calculated by binning conformers and exchange rates by counting transitions between major conformers, as previously.17–19,27,33,34 Puckers were placed in bins of unequal spacing in the azimuthal angle θ, but equal spacing in the meridian angle φ (ensuring that each bin occupied an equal area on the sphere). Pyranose ring 1H–1H three-bond vicinal spin-couplings (3 J H,H) were computed using the substituent-adjusted Karplus equations of Altona and Haasnoot.51 The Amber12 tool ptraj41 was used to perform hierarchical conformational clustering with a sampling frequency of every 50 frames (20 000 for a 10 μs simulation).
Acknowledgments
Financial support was provided by the UK Biotechnology and Biological Sciences Research Council (Grant BB/J00040X/1).
Footnotes
References
- Parker R., Ring S. G. J. Cereal Sci. 2001;34:1–17. [Google Scholar]
- Tamaki Y., Konishi T., Tako M. Materials. 2011;4:1763–1775. doi: 10.3390/ma4101763. [DOI] [PMC free article] [PubMed] [Google Scholar]
- Nomura S., Kyutoku T., Shimomura N., Kaneko Y., Kadokawa J. Polym. J. 2011;43:971–977. [Google Scholar]
- Kumar K., Woortman A. J. J., Loos K. Biomacromolecules. 2013;14:1955–1960. doi: 10.1021/bm400340k. [DOI] [PubMed] [Google Scholar]
- Sapsford K. E., Algar W. R., Berti L., Gemmill K. B., Casey B. J., Oh E., Stewart M. H., Medintz I. L. Chem. Rev. 2013;113:1904–2074. doi: 10.1021/cr300143v. [DOI] [PubMed] [Google Scholar]
- Obiro W. C., Ray S. S., Emmambux M. N. Food Rev. Int. 2012;28:412–438. [Google Scholar]
- Rundle R. E., Edwards F. C. J. Am. Chem. Soc. 1943;65:2200–2203. [Google Scholar]
- Putaux J. L., Nishiyama Y., Mazeau K., Morin M., Cardoso M. B., Chanzy H. Macromol. Symp. 2011;303:1–9. [Google Scholar]
- Hancock R. D., Tarbet B. J. J. Chem. Educ. 2000;77:988–992. [Google Scholar]
- Cheetham N. W. H., Tao L. P. Carbohydr. Polym. 1998;35:287–295. [Google Scholar]
- Breitinger H. G. Biopolymers. 2003;69:301–310. doi: 10.1002/bip.10384. [DOI] [PubMed] [Google Scholar]
- Kida T., Minabe T., Okabe S., Akashi M. Chem. Commun. 2007:1559–1561. doi: 10.1039/b616231b. [DOI] [PubMed] [Google Scholar]
- Yamamoto M., Sano T., Harada S., Yasunaga T. Bull. Chem. Soc. Jpn. 1982;55:3702–3706. [Google Scholar]
- Gessler K., Uson I., Takaha T., Krauss N., Smith S. M., Okada S., Sheldrick G. M., Saenger W. Proc. Natl. Acad. Sci. U. S. A. 1999;96:4246–4251. doi: 10.1073/pnas.96.8.4246. [DOI] [PMC free article] [PubMed] [Google Scholar]
- Jacob J., Gessler K., Hoffmann D., Sanbe H., Koizumi K., Smith S. M., Takaha T., Saenger W. Angew. Chem., Int. Ed. 1998;37:606–609. doi: 10.1002/(SICI)1521-3773(19980316)37:5<605::AID-ANIE605>3.0.CO;2-C. [DOI] [PubMed] [Google Scholar]
- Lu Z. Y., Nowak W., Lee G. R., Marszalek P. E., Yang W. T. J. Am. Chem. Soc. 2004;126:9033–9041. doi: 10.1021/ja031940x. [DOI] [PubMed] [Google Scholar]
- Sattelle B. M., Hansen S. U., Gardiner J., Almond A. J. Am. Chem. Soc. 2010;132:13132–13134. doi: 10.1021/ja1054143. [DOI] [PubMed] [Google Scholar]
- Sattelle B. M., Bose-Basu B., Tessier M., Woods R. J., Serianni A. S., Almond A. J. Phys. Chem. B. 2012:6380–6386. doi: 10.1021/jp303183y. [DOI] [PMC free article] [PubMed] [Google Scholar]
- Sattelle B. M., Almond A. Phys. Chem. Chem. Phys. 2012;14:5843–5848. doi: 10.1039/c2cp40071e. [DOI] [PubMed] [Google Scholar]
- Kuttel M. M., Naidoo K. J. J. Phys. Chem. B. 2005;109:7468–7474. doi: 10.1021/jp044756m. [DOI] [PubMed] [Google Scholar]
- Winger M., Christen M., van Gunsteren W. F. Int. J. Carbohydr. Chem. 2009;2009:307695. doi: 10.1155/2009/307695. [DOI] [Google Scholar]
- Tusch M., Kruger J., Fels G. J. Chem. Theory Comput. 2011;7:2919–2928. doi: 10.1021/ct2005159. [DOI] [PubMed] [Google Scholar]
- Lopez C. A., de Vries A. H., Marrink S. J. Carbohydr. Res. 2012;364:1–7. doi: 10.1016/j.carres.2012.10.007. [DOI] [PubMed] [Google Scholar]
- Eisenhaber F., Schulz W. Biopolymers. 1992;32:1643–1664. [Google Scholar]
- Schlick T. F1000 Biol. Rep. 2009;1:51. doi: 10.3410/B1-51. [DOI] [PMC free article] [PubMed] [Google Scholar]
- Molinero V., Goddard W. A. J. Phys. Chem. B. 2004;108:1414–1427. [Google Scholar]
- Sattelle B. M., Shakeri J., Almond A. Biomacromolecules. 2013;14:1149–1159. doi: 10.1021/bm400067g. [DOI] [PubMed] [Google Scholar]
- Shimada J., Kaneko H., Takada T., Kitamura S., Kajiwara K. J. Phys. Chem. B. 2000;104:2136–2147. [Google Scholar]
- Cheetham N. W. H., Dasgupta P., Ball G. E. Carbohydr. Res. 2003;338:955–962. doi: 10.1016/s0008-6215(03)00069-7. [DOI] [PubMed] [Google Scholar]
- Hinrichs W., Buttner G., Steifa M., Betzel C., Zabel V., Pfannemuller B., Saenger W. Science. 1987;238:205–208. doi: 10.1126/science.238.4824.205. [DOI] [PubMed] [Google Scholar]
- Rappenecker G., Zugenmaier P. Carbohydr. Res. 1981;89:11–19. [Google Scholar]
- Schnupf U., Willett J. L., Momany F. A. Carbohydr. Res. 2009;344:374–383. doi: 10.1016/j.carres.2008.11.016. [DOI] [PubMed] [Google Scholar]
- Sattelle B. M., Almond A. Glycobiology. 2011;21:1651–1662. doi: 10.1093/glycob/cwr101. [DOI] [PMC free article] [PubMed] [Google Scholar]
- Sattelle B. M., Almond A. Carbohydr. Res. 2014;383:34–42. doi: 10.1016/j.carres.2013.10.011. [DOI] [PMC free article] [PubMed] [Google Scholar]
- Tafazzoli M., Grhiasi M. Carbohydr. Res. 2007;342:2086–2096. doi: 10.1016/j.carres.2007.05.032. [DOI] [PubMed] [Google Scholar]
- Roshind M. U., Tahtinen P., Niemitz M., Sjhohn R. Carbohydr. Res. 2008;343:101–112. doi: 10.1016/j.carres.2007.10.008. [DOI] [PubMed] [Google Scholar]
- Popov D., Buleon A., Burghammer M., Chanzy H., Montesanti N., Putaux J. L., Potocki-Veronese G., Riekel C. Macromolecules. 2009;42:1167–1174. [Google Scholar]
- Imberty A., Chanzy H., Perez S., Buleon A., Tran V. J. Mol. Biol. 1988;201:365–378. doi: 10.1016/0022-2836(88)90144-1. [DOI] [PubMed] [Google Scholar]
- Kirschner K. N., Yongye A. B., Tschampel S. M., Gonzalez-Outeirino J., Daniels C. R., Foley B. L., Woods R. J. J. Comput. Chem. 2008;29:622–655. doi: 10.1002/jcc.20820. [DOI] [PMC free article] [PubMed] [Google Scholar]
- Jorgensen W. L., Chandrasekhar J., Madura J. D., Impey R. W., Klein M. L. J. Chem. Phys. 1983;79:926–935. [Google Scholar]
- Case D. A., Cheatham, 3rd T. E., Darden T., Gohlke H., Luo R., Merz, Jr. K. M., Onufriev A., Simmerling C., Wang B., Woods R. J. J. Comput. Chem. 2005;26:1668–1688. doi: 10.1002/jcc.20290. [DOI] [PMC free article] [PubMed] [Google Scholar]
- Winter W. T., Sarko A. Biopolymers. 1974;13:1447–1460. [Google Scholar]
- Pfannemuller B. Int. J. Biol. Macromol. 1987;9:105–108. [Google Scholar]
- Harvey M. J., Giupponi G., De Fabritiis G. J. Chem. Theory Comput. 2009;5:1632–1639. doi: 10.1021/ct9000685. [DOI] [PubMed] [Google Scholar]
- Buch I., Harvey M. J., Giorgino T., Anderson D. P., De Fabritiis G. J. Chem. Inf. Model. 2010;50:397–403. doi: 10.1021/ci900455r. [DOI] [PubMed] [Google Scholar]
- Sadiq S. K., Noe F., De Fabritiis G. Proc. Natl. Acad. Sci. U. S. A. 2012;109:20449–20454. doi: 10.1073/pnas.1210983109. [DOI] [PMC free article] [PubMed] [Google Scholar]
- Krautler V., Van Gunsteren W. F., Hunenberger P. H. J. Comput. Chem. 2001;22:501–508. [Google Scholar]
- Humphrey W., Dalke A., Schulten K. J. Mol. Graphics Modell. 1996;14:33–38. doi: 10.1016/0263-7855(96)00018-5. [DOI] [PubMed] [Google Scholar]
- Cremer D., Pople J. A. J. Am. Chem. Soc. 1975;97:1354–1358. [Google Scholar]
- Hess B., Kutzner C., van der Spoel D., Lindahl E. J. Chem. Theory Comput. 2008;4:435–447. doi: 10.1021/ct700301q. [DOI] [PubMed] [Google Scholar]
- Haasnoot C. A. G., Deleeuw F. A. A. M., Altona C. Tetrahedron. 1980;36:2783–2792. [Google Scholar]
Associated Data
This section collects any data citations, data availability statements, or supplementary materials included in this article.


