

Abstract
Aim:
Erlotinib is used to treat non-small-cell lung cancer (NSCLC), which targets epidermal growth factor receptor (EGFR) tyrosine kinase. The aim of this study was to investigate the relationship between erlotinib plasma concentrations and phosphorylated EGFR (pEGFR) levels, as well as the relationship between pEGFR levels and tumor growth inhibition in a human non-small-cell lung cancer xenograft mouse model.
Methods:
Female BALB/c nude mice were implanted with the human NSCLC cell line SPC-A-1. The animals were given via gavage a single dose of erlotinib (4, 12.5, or 50 mg/kg). Pharmacokinetics of erlotinib was determined using LC-MS/MS. Tumor volume and pEGFR levels in tumor tissues were measured at different time points after erlotinib administration. The levels of pEGFR in tumor tissues was detected using Western blotting and ELISA assays.
Results:
The pharmacokinetics of erlotinib was described by a two-compartment model with first order extravascular absorption kinetics. There was a time delay of approximately 2 h between erlotinib plasma concentrations and pEGFR degradation. The time course of pEGFR degradation was reasonably fit by the indirect response model with a calculated IC50 value of 1.80 μg/mL. The relationship between pEGFR levels and tumor volume was characterized by the integrated model with a Kbio value of 0.507 cm3/week, which described the impact of pEGFR degradation on tumor growth.
Conclusion:
The pharmacokinetic/pharmacodynamic properties of erlotinib in a human tumor xenograft model were described by the indirect response model and integrated model, which will be helpful in understanding the detailed processes of erlotinib activity and determining an appropriate dosing regimen in clinical studies.
Keywords: non-small-cell lung cancer, anticancer drug, erlotinib, epidermal growth factor receptor, pharmacokinetic-pharmacodynamic modeling, human tumor xenograft mouse model
Introduction
Epidermal growth factor receptor (EGFR), which is one of four erbB receptors, is a receptor tyrosine kinase that is highly expressed in solid tumors, including head and neck, non-small cell lung and prostate cancers1. When bound to its ligand (either epidermal growth factor or transforming growth factor α), the kinase domain is activated to generate phosphorylated EGFR (pEGFR), which results in a signaling cascade that produces diverse effects, such as cell migration, maturation and inhibition of apoptosis2. Currently there are two types of EGFR-targeted agents used clinically: those targeted to the receptor's extracellular domain, such as monoclonal antibodies3, and those with an intracellular site of action, such as small molecule tyrosine kinase inhibitors, ie, gefinitib4 and erlotinib5.
Erlotinib is the first targeted therapeutic agent for the treatment of patients with either locally advanced or metastatic NSCLC6, which is the most common type of lung cancer and accounts for 80%–85% of lung cancer cases7. Erlotinib is a potent EGFR tyrosine kinase inhibitor that blocks EGFR-mediated intracellular signaling, which can block the autophosphorylation of EGFR, prevent the generation of pEGFR and subsequently inhibit a series of downstream signaling pathways, which then inhibits cell proliferation and angiogenesis8.
The PK/PD model has been applied in drug discovery and development areas for many years. This model quantitatively describes the process of drug behaviors and action in vivo and helps people to better understand drug efficacy and safety and has become a powerful tool in drug development. Regarding the PK/PD relationships of erlotinib, most preclinical studies focused on the relationship between clinical response (eg, tumor growth inhibition) and plasma erlotinib concentration and showed the correlation between drug exposure and toxicity9. However, this type of PK/PD model does not quantitatively describe the complicated processes between drug exposure and cell death.
A pharmacodynamic biomarker is a PD index that can reflect the process of the drug action, and changes in the biomarker level usually reflect a quantitative relationship with the antitumor effect10. By measuring the level of the PD biomarker at the tumor site and combining this information with the plasma concentration and clinical response, we can acquire direct evidence of the process of drug action, including whether the drug has exerted a pharmacological response, the degree of the response and how the response changes with the time course of drug concentration11. Some phosphoproteins have been identified as effective biomarkers for predicting the inhibition of tumor growth of some tyrosine kinase inhibitors, by inhibiting the corresponding phosphorylation of Bcr-Abl12, c-Met kinase13, MEK14, PI-3 kinase15, and VEGF-R2 tyrosine kinase. EGFR is autophosphorylated upon activation of the EGFR kinase by its natural ligand, whereas phosphorylated EGFR (pEGFR) plays a critical role in subsequent receptor internalization of the EGFR signaling pathway2. Cetuximab is a monoclonal antibody used as an EGFR-targeted agent, which binds to EGFR with a greater affinity than native EGFR ligands and can block the ligand-induced activation of EGFR. Luo et al conducted a pharmacodynamic study in nude mice bearing Geo tumors, and tumoral pEGFR was evaluated as a pharmacodynamic biomarker16. Similar to cetuximab, erlotinib is an EGFR-targeted agent that inhibits the generation of pEGFR and, subsequently, a series of downstream signaling pathways8. Thus, the level of pEGFR in the tumor was chosen as the biomarker for our pharmacodynamic study.
The present study aims to establish an integrated PK/PD model to quantitatively express the relationship among erlotinib plasma concentration, pEGFR levels and tumor volume in BALB/c nude mice xenografted with SPC-A-1 (a NSCLC cell line). Using the in vivo data for the model-based analysis, the PK/PD model constructed could be helpful in quantitatively describing the detailed processes of erlotinib activity in vivo and determining an appropriate dosing regimen in clinical applications.
Materials and methods
Drugs and reagents
Erlotinib was obtained from Shanghai Hanhong Chemical Co Ltd (Shanghai, China), and the human pEGFR enzyme linked immunosorbent assay (ELISA) kit was purchased from Beijing Pulizhicheng Chemical Co Ltd (Beijing, China). RPMI-1640 medium and fetal bovine serum were purchased from Macgene Biotech Co, Ltd (Beijing, China). Other chemicals were purchased from Sigma-Aldrich Co (Milwaukee, WI, USA) unless otherwise indicated.
Cell line and animals
The human NSCLC cell line SPC-A-1 was purchased from the Chinese Academy of Medical Sciences Tumor Cell Bank and cultured in RPMI-1640 medium containing 10% fetal bovine serum, 100 U/mL penicillin and 100 μg/mL streptomycin. The cells were maintained at 37 °C in an atmosphere containing 5% CO2.
Specific pathogen-free (SPF) BALB/c nude mice (7-week-old, female, 20±4 g) were purchased from the Experimental Animal Center at the Peking University Health Science Center. All animal studies were approved by the Institutional Animal Care and Use Committee of Peking University Health Science Center, and the experiments were conducted according to the guidelines set by the National Research Council. Mice were maintained in an environmentally controlled breeding room with specific pathogen-free condition (21 °C with 60% relative humidity and a 12 h light/12 h dark cycle) and adapted to conditions for 3 d before tumor inoculation. Tumors were established by subcutaneous injection in right flanks of mice with 6×10⁶ SPC-A-1 cells suspended in 200 μL PBS.
Pharmacokinetic study
The pharmacokinetics of erlotinib after administration of a single dose in female BALB/c nude mice plasma was determined by a LC-MS/MS method previously described by our group17. The concentration range was 0.5–200 ng/mL, and samples with concentration greater than 200 ng/mL were diluted until the concentration was within the appropriate range. The intra- and inter-day accuracies ranged from 2.00% to 8.00% and 0.07% to 4.0%, respectively, and the intra- and inter-day precision ranged from 2.28% to 8.22% and 5.66% to 14.12%, respectively; all of these values were within the predefined acceptance criteria. The method also presented good stability of erlotinib in plasma at room temperature for 8 h, at -20 °C for 30 d, and after three daily freeze-thaw cycles. The recoveries were 97.01%±14.97%, 101.92%±10.95% and 93.04%±8.36% for erlotinib, at low, medium and high concentrations, respectively, where no matrix effect was observed.
During the study, 24 female BALB/c nude mice were inoculated and dosed by gavage at 12.5 mg/kg erlotinib in 4% SBE-β-CD Captisol® solution when the tumor size reached 0.95–1.00 cm3. Blood samples were collected at 0, 0.5, 1, 3, 5, 7, 16, and 24 h (3 mice per time point) after dose, and the plasma layer was obtained by centrifugation at 1500×g for 15 min and stored at -20 °C until analysis. A two-compartment model with a first order absorption was applied to calculate the pharmacokinetics of erlotinib. According to the model, the clearance rate (Cl/F) was 0.739 L·kg−1·h−1 (RSE=13.3%), the absorption rate constant (Ka) was 0.952 h−1 (RSE=4.66%), the inter-compartment clearance (Q/F) was 0.0308 L·kg−1·h−1 (RSE=40.3%) and the apparent volume of the central and the peripheral compartment were 0.817 L/kg (RSE=13.0%) and 0.152 L/kg (RSE=18.4%), respectively.
Erlotinib has relatively short elimination half-life, thus no accumulation was observed with the dose interval applied in our study. Because of this, it is logical to obtain the PK parameters from single-dose experiments and simulate the PK profiles of multiple doses based to corresponding pharmacodynamic trial courses17. Additionally, it was demonstrated that within the dosing range between 4.0 and 50.0 mg/kg, the PK characteristics of erlotinib is linear18. Thus, we extrapolated the PK profile from a single dose of 12.5 mg/kg to multiple doses of 4.0 and 50.0 mg/kg.
Pharmacodynamic study
Inhibition effect of erlotinib on pEGFR level in tumor of SPC-A-1 xenograft mice measured by Western blotting
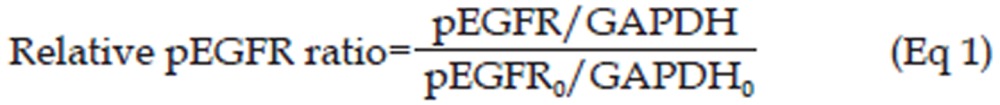
Western blotting was used to investigate the inhibitory effect of erlotinib on pEGFR levels in the tumors of SPC-A-1 xenograft mice. When tumor size reached 0.95–1.00 cm3, 63 mice were randomly assigned to the following three treatment groups: 4.0 mg/kg, 12.5 mg/kg, and 50.0 mg/kg erlotinib treatment. Erlotinib was dissolved in 4% SBE-β-CD Captisol® solution and administered by gavage as a single dose. In each group, before and 0.5, 1, 3, 7, 17, and 24 h (n=3 per time point) after dosing (with drug administration set as time 0 h), tumor tissues were resected after the decapitation of mice and stored at -20 °C until further analysis. Protein extraction and Western blotting analysis were performed as previously described19. Glyceraldehyde 3-phosphate dehydrogenase (GAPDH) was measured at the same time as an internal reference to standardize the pEGFR levels, and the levels at different time points were normalized by the pEGFR level at the point of 0 h, which was calculated as shown in Eq 1.
 |
Pharmacodynamic study based on pEGFR levels in tumor tissues determined by ELISA
The treatment of the animals and processing of samples were the same as described before except that 72 mice were used, and the data collection time points were set at 0.5, 1, 3, 5, 7, 16, and 24 h after dosing. The resected tumors were pulverized using an ice-cooled homogenizer and an ultrasonic cell disruption system. Protein lysates were then collected, homogenized and quantified by the BCA protein method. The amount of pEGFR protein was determined by human pEGFR ELISA kits according to the protocol recommended by the manufacturer (Beijing Pulizhicheng Chemical Co Ltd, Beijing, China). The concentration range was 0.5–8.0 μg/mL, and the accuracy and precision of this method was validated by the merchant.
Pharmacodynamic study based upon tumor volume
When tumor size reached 0.15–0.25 cm3, 15 mice were assigned to the following treatment groups: control group (4% SBE-β-CD Captisol® solution), 4.0 mg/kg erlotinib and 50.0 mg/kg erlotinib. The drug was administered by gavage every 24 h, and the tumor volume was measured every 48 h. Treatments lasted for 3 weeks unless the mice died. The tumor volume was calculated as shown in Eq 220:
 |
PK/PD models
The block diagram of the entire model is shown in Figure 1. For the mechanism of erlotinib action, which includes blocking the autophosphorylation of EGFR, inhibiting the generation of pEGFR and subsequently inhibiting cell proliferation and angiogenesis21, it was assumed that the tumor volume might be quantitatively related to the pEGFR levels. Therefore, we used an indirect response model and a final integrated model to describe the PK/PD properties of erlotinib.
Figure 1.

Schematic of the integrated model that includes the indirect response model for describing pEGFR inhibition. Xa, dose in the absorption compartment; Cc and Cp, concentration of erlotinib in central and peripheral compartment, respectively; Vc and Vp, apparent volume of central compartment and peripheral compartment, respectively; Q, inter-compartment clearance; Cl, clearance rate. Kin and Kout, pEGFR production and output rate constants; E, pEGFR inhibition index; Kbio, parameter describing the antitumor effect of erlotinib via pEGFR inhibition; X′1, natural tumor growth model for the proliferating cells; X1, proliferating compartment; X2–4, non-proliferating compartments; Ktran, transit-rate constant for non-proliferating compartments.
PK/PD modeling based on pEGFR levels
The relationship between pEGFR levels and the plasma concentration of erlotinib was modeled using an indirect response model (IDR model)22. In this model, the IC50 value (ie, the concentration of erlotinib causing one-half maximal inhibition) was used to describe the pEGFR inhibition. The equation used to calculate the inhibition is as shown as Eq 3, and the block diagram is shown in Figure 1.
 |
In Eq 3, pEGFR and pEGFR0 represent the level of pEGFR at the time t and time before administration, respectively. Here, as reported before, pEGFR levels were normalized to initial level of pEGFR23. Kin is the zero order rate constant of the generation of pEGFR/pEGFR0, and Kout is the first order rate constant of the dephosphorylation process of pEGFR/pEGFR0. As observed in preliminary studies, the model suggests that the pEGFR/pEGFR0 level could be completely inhibited by erlotinib, thus the maximal inhibitory effect (ICmax) was locked at 1, which was not shown in Eq 3.
The pEGFR profiles after multiple doses were simulated accordingly, which were used to link the final PD endpoints (tumor volume) to build an integrated PK/PD model.
PK/PD modeling based upon tumor volume
The Gompertz model was used to describe the natural growth of tumor24. At its early phase, tumor growth in the xenograft model is exponential; after that, the growth of tumor follows a linear model and eventually reaches a plateau25. It is necessary to establish a basic progression model for tumor's dynamic growth over the investigatory period. However, the plateau status was unattainable in this study, so an alternative model that focuses only on the exponential and linear phases was used. Here, VOL is used to represent the volume of the total tumor cells, whereas VOL0 was determined as the initial tumor volume just prior to administration as introduced by Simeoni and colleagues20. Thus, the natural growth of the tumor can be described by Eq 4.
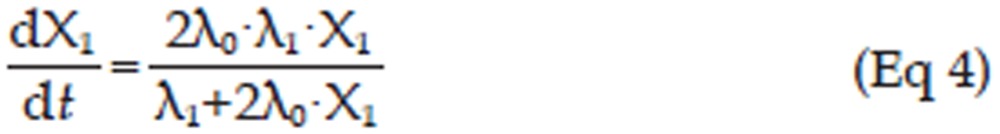 |
X1 represents the volume of proliferating tumor cells, λ0 is the exponential growth rate constant, and λ1 is the linear growth rate constant. Prior to drug administration, all of the tumor cells are proliferating, therefore X1(0)=VOL0.
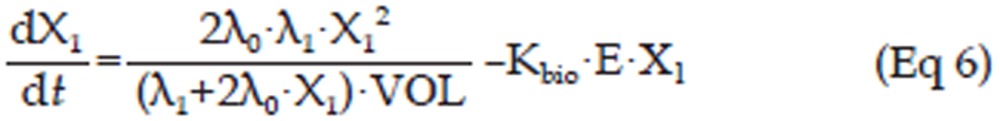
In the erlotinib-treated groups (4.0 mg/kg and 50.0 mg/kg), a series of transit compartment models were used to fit the data20. A percentage of the proliferating cells become non-proliferative due to drug action and pass through several stages of damage (X2, X3, ..., Xn+1) before they die (Figure 1), such that the total tumor volume contains the volume of proliferating cells and non-proliferating cells, ie, VOL=X1+X2+X3+...+Xn+1, whereas only X1, the volume of proliferating cells can be described by Eq 4. Therefore, it has been proposed that the growth of the tumor was slowed at the rate of X1/VOL26, and a constant parameter Kbio proportional to E·X1 was applied to describe the antitumor effect of pEGFR. Here, a pEGFR “inhibition index” E [E=1/(pEGFR/pEGFR0)-1] was used as the variable describing the pEGFR inhibition as reported27. The equation is shown as Eq 5, and the block diagram is shown in Figure 1.
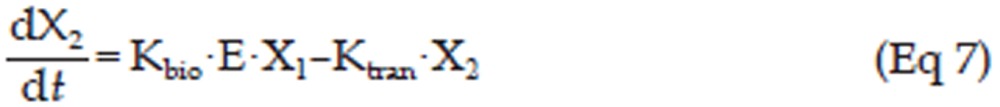
In this study, a transit compartment model was used to explain the lag between PK and PD as previously reported28. It was assumed that non-proliferating cells passed though n stages (named X2, X3, ..., Xn+1) until death. Ktran, a transit rate constant between any two of the non-proliferating compartments, was used to interpret cell death. In this study, three non-proliferating compartments (n=3) were applied based on the goodness-of-fit to the data.
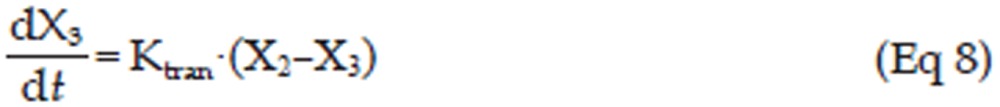
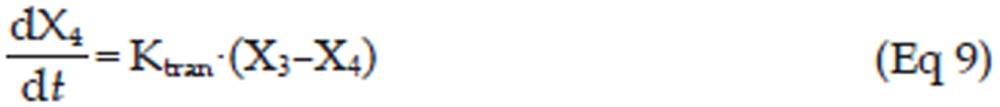
Figure 1 schematically shows the integrated tumor growth inhibition model, including the indirect response model for pEGFR inhibition. The overall model can be described by Eq 5 to Eq 11.
In these equations, X2, X3, and X4 represent the volume of tumor cells at different non-proliferating stages. The tumor volume data of the control group, 4.0 mg/kg erlotinib group, and 50.0 mg/kg erlotinib groups were used to build this integrated model.
 |
 |
 |
 |
 |
 |
 |
Data analysis and model simulations
All of the model estimations were performed using NONMEM 7 (level 2.0) with the FOCE algorithm. Both inter-individual and residual variability were added to the models. It was assumed that the parameters and residual error variability followed logarithmic normal distribution, and the residual error model was a combined error model. Model selection was based on the NONMEM objective function value (OFV), value of estimate, relative standard errors (RSE) in the estimate, and exploratory analysis of the goodness-of-fit plots. Model validations were based on a visual predictive check (VPC) of the predictions with 1000 simulations using PsN (version 3.4.2).
To evaluate the established PK/PD integrated model, the tumor volume-time profiles after administration of multiple doses of 12.5 mg/kg erlotinib were simulated with the model parameters, and the values of the tumor volume from the literature (based on 12.5 mg/kg erlotinib)17 was used as the external validation data. The predicted error, which was calculated by Eq 12, and the mean percentage predicted error (MPE%), which was calculated by Eq 13, were used to assess the predictive performance of the PK/PD model. Pearson correlation analysis was also used to examine the bias of the predicted values29.
 |
 |
Results
Pharmacodynamic studies
Western blotting results of the pEGFR levels at various time points after erlotinib administration are shown in Figure 2A–2C. Erlotinib treatment led to an evident decrease of pEGFR, which bottomed out (ie, 80% to 90% inhibition) approximately 3 h after drug administration and then reverted to above 80% of the original state at approximately 17 h. The pEGFR inhibition profile lags approximately 2 h after the erlotinib concentration profile, which appeared at 1 h after dosing. This type of inhibition increased in conjunction with the dose. The pEGFR levels of low dose group (4.0 mg/kg) reverted faster than the other groups (12.5 mg/kg and 50.0 mg/kg). These results indicate that the inhibition of pEGFR was both dose- and time-dependent.
Figure 2.

(A–C) Western blotting analysis of tumoral phospho-EGFR (pEGFR) in tumor bearing BALB/c nude mice implanted with SPC-A-1 xenografts after single oral dose of erlotinib at 4.0 mg/kg (A), 12.5 mg/kg (B) and 50.0 mg/kg (C). The pEGFR levels in the tumors were quantifies by image scanning of the Western blotting. (D) The mean±SD (n=3) data of pEGFR/pEGFR0 levels as measured by ELISA in tumor bearing BALB/c nude mice implanted with SPC-A-1 xenografts after a single oral dose of erlotinib at 4.0, 12.5, and 50.0 mg/kg. (E) The mean±SD (n=5) data of tumor volume in tumor bearing BALB/c nude mice implanted with SPC-A-1 xenografts after administration of erlotinib at 4.0 and 50.0 mg/kg every 24 h.
ELISA results of pEGFR levels after erlotinib administration at doses of 4.0, 12.5, and 50.0 mg/kg are shown in Figure 2D. At doses of 4.0, 12.5, and 50.0 mg/kg, the extent of pEGFR degradation was approximately 50%, 80%, and 90%, respectively, at 3 h, and the levels in all three groups returned to baseline at 24 h after dosing. The results of the ELISA coincided with that of the Western blotting. The pEGFR level-time profiles as measured by ELISA at different doses were applied to the PK/PD models as pharmacodynamic data.
Figure 2E shows the inhibitory effects of erlotinib at various doses on tumor growth in SPC-A-1 xenograft mice. Compared with the control group, the treated groups (4.0 mg/kg and 50.0 mg/kg erlotinib) showed increased inhibition of tumor growth, and the inhibition levels increased with dosage. The tumor volume-time profiles of the different doses were applied to PK/PD model as pharmacodynamic data.
PK/PD modeling
PK/PD model based on pEGFR levels
The pharmacokinetics of erlotinib were described by a two-compartment model with first order extravascular absorption kinetics as previously described17.
The time course of pEGFR degradation for all of the groups were described by the indirect response model (OFV=-172.445). The observed and model-simulated pEGFR degradation-time profiles by erlotinib in the xenograft model are graphically presented in Figure 3A–3C, and the parameters are shown in Table 1.
Figure 3.

(A–C) Observed and model-simulated pEGFR/pEGFR0 after erlotinib treatment in BALB/c nude mice implanted with SPC-A-1 xenografts after a single oral dose of erlotinib at 4.0 mg/kg (A), 12.5 mg/kg (B), and 50.0 mg/kg (C). The observed data were measured by ELISA. (D–F) Observed and model-simulated tumor volume-time profiles of the control group (D), and groups treated with 4.0 mg/kg (E) and 50.0 mg/kg (F) of erlotinib daily in BALB/c nude mice implanted with SPC-A-1 xenografts after oral administration. For all of the sub-graphs (A–F), the solid line and the solid dots represent the medians of the simulated data and the observed data, respectively. For sub-graphs (D–F), the range between the dotted lines depict the 90% confidence intervals.
Table 1. Estimates of parameters for PK/PD models.
| Parameter | Definition | Estimate | RSE (%)1 | IIV (CV%)2 |
|---|---|---|---|---|
| PK/PD model based upon pEGFR level | ||||
| Kin (h−1) | pEGFR/pEGFR0 production rate | 1.24 | 20.1 | NE3 |
| Kout (h−1) | pEGFR/pEGFR0 output rate | 1.30 | 20.2 | 15.5 |
| IC50 (μg/mL) | The concentration of erlotinib causing one-half maximum inhibition | 1.80 | 13.2 | NE |
| PK/PD model based upon tumor volume | ||||
| λ0 (d−1) | The exponential growth rate | 0.146 | 10.8 | 20.5 |
| λ1 (cm3/d) | The linear growth rate | 0.326 | 12.1 | 18.1 |
| VOL0 (cm3) | Threshold tumor volume | 0.207 | 7.68 | 28.4 |
| Kbio (week−1) | The antitumor effect of the inhibition | 0.507 | 17.6 | NE |
| Ktran (week−1) | Transit-rate constant | 0.179 | 34.9 | NE |
1Percentage relative standard error.
2Percentage coefficient of Inter-individual variability of the estimate.
3Inter-individual variability was fixed to zero when CV<0.1%.
PK/PD model based upon tumor volume
For the tumor growth data, the integrated model, which included the indirect response model for pEGFR inhibition, was used to describe the pharmacodynamic profiles. The three-transit-compartment model was evaluated against other stage numbers for goodness of fit. The results of the observed and simulated tumor volume are shown in Figure 3D–3F, and the parameters are listed in Table 1. Most of the observed values were within the 90% confidence interval of simulations.
Model simulation
For the IDR model and the integrated model, the goodness-of-fit plots are shown in Figure 4A–4D and Figure 4E–4H, respectively. For both models, the dots of observed data (OBS) versus either the predicted value (PRED) or individual predicted value (IPRE) distributed around x=y, and the trend lines closely coincide with x=y. The conditional weighted residuals (CWRES) were randomly and homogenously distributed around x axis, and the trend lines closely coincide with x-axis. Both models reasonably fit the time profiles at all of the doses tested. The model parameters were also estimated with good precision (Table 1).
Figure 4.

(A–D) The goodness-of-fit plots of the IDR model: Relationship between observed versus predicted values of pEGFR/pEGFR0 (A); Relationship between observed versus predicted individual values of pEGFR/pEGFR0 (B); Conditional weighted residuals at different time points (C); Conditional weighted residuals at different predicted values (D). (E–H) The goodness-of-fit plots of the integrated model: Relationship between observed versus predicted values of the tumor volume (E); Relationship between observed versus predicted individual values of the tumor volume (F); Conditional weighted residuals at different time points (G); Conditional weighted residuals at different predicted values (H). For all of the sub-graphs (A–H), the solid lines represent the x=y line, and the dotted lines represent the trend lines.
The observed tumor volume data from the literature17 and model-simulated tumor volume data by the integrated model at an erlotinib dose of 12.5 mg/kg are shown in Figure 5A, and most of the observed values were within the 90% confidence interval of the simulations. Additionally, the observed data and predicted data are shown in Figure 5B, where the trend line closely coincides with x=y. The distribution of the prediction errors is shown in Figure 5C, which distributed around 0 with an MPE% (95% confidence interval) of 7.08% (−34.28% to 48.44%). These results suggested a highly significant correlation between the observed data from the literature and predicted data (Pearson correlation coefficient=0.899>0.8).
Figure 5.

(A) The observed tumor volume data from the literature17 and model-simulated tumor volume data by the integrated model at an erlotinib dose of 12.5 mg/kg. The range between the dotted lines depicts the 90% confidence intervals, and the solid line and the solid dots represent the medians of the simulated data and the observed data, respectively. (B) The observed and predicted tumor volume at an erlotinib dose of 12.5 mg/kg. The solid line represents the x=y line, and the dotted lines represent the trend line. (C) The distribution of the percentage prediction errors.
Discussion
The present study provides novel information on the PK/PD relationship for erlotinib, a pEGFR inhibitor, in a human NSCLC SPC-A-1 xenograft model. Several lines of evidence have shown that EGFR is highly expressed in NSCLC, and some studies have shown that EGFR appears to have a prognostic value in patients with lung cancer30. Erlotinib is a small molecule tyrosine kinase inhibitor that targets EGFR at an intracellular site and inhibits EGFR-mediated intracellular signaling by blocking the autophosphorylation of EGFR21. Thus, reducing the pEGFR levels plays an important role in erlotinib action. However, there is no report of evaluating pEGFR levels after erlotinib administration, and the relationship between pEGFR levels and tumor volume is still unclear. Our Western blotting results showed that the pEGFR levels in the tumors of SPC-A-1 xenograft mice evidently inhibited by erlotinib in both a time- and dose-dependent manner. These results also suggest that pEGFR is an effective biomarker for investigating the efficacy of other small molecule tyrosine kinase inhibitors such as gefitinib. Because Western blotting is a semi-quantitative method, ELISA was used to build the PK/PD model because it could quantitatively detect the pEGFR levels in tumor bearing BALB/c nude mice xenograft with SPC-A-1 cells, and the ELISA results were quantitatively consistent with the Western blotting results.
An indirect response model was used to describe the relationship between the plasma concentrations of erlotinib and pEGFR levels in the tumor. In this PK/PD relationship, pEGFR inhibition in the tumors was delayed relative to the plasma concentrations of erlotinib. It was assumed that the reason for this lag was the indirect mechanisms of action of erlotinib31. After erlotinib enters the cells, it reversibly binds to the adenosine triphosphate (ATP) binding site of EGFR. For transmission of the EGFR-mediated signal, two EGFR molecules need to form a homodimer, which then use the ATP molecule to trans-phosphorylate each other on tyrosine residues. Thus, by inhibiting ATP binding, formation of phosphotyrosine residues on EGFR is blocked, and the signal cascades are not initiated8. The IDR model used here assumes that the rate of the onset and offset of the pEGFR levels is governed by the indirect mechanism of action, ie, inhibition of formation (Kin), because erlotinib blocks the formation of pEGFR. The model reasonably described the PK/PD relationship of the plasma concentration and pEGFR inhibition as well as provided the best fit to the observed biomarker data other than the effect compartment model (data not shown), the latter model is usually used to describe the delayed response due to delayed drug distribution13,27.
One study previously reported that treatment with PF02341066, a cMet kinase inhibitor, and monitoring cMet as a biomarker showed that the EC90 for inhibiting cMet phosphorylation was as same as the EC50 for tumor growth inhibition, suggesting that 90% inhibition of cMet is required for 50% tumor growth inhibition13. A similar study on PF04942847, an HSP90 inhibitor, that used Akt as a biomarker showed that 30% inhibition of Akt is required for 50% tumor growth inhibition27. Thus the comparison of the PD parameters estimated from different models could be a reasonable approach to predict a clinical response. Tan et al suggested that for cancer patients who were treated with a effective daily dose of 150 mg erlotinib orally, the minimum steady-state concentration (Css, min) was 1.473 μg/mL (SD=0.877 μg/mL), the maximum steady-state concentration (Css, max) was 2.528 μg/mL (SD=1.187 μg/mL) and the average steady-state concentration (Css, ave) was 1.818 μg/mL (SD=0.973 μg/mL)32. For this research, the IC50 for pEGFR degradation was 1.80 μg/mL, which was within the steady-state minimum and maximum concentration window. This result suggested that approximately 50% of pEGFR inhibition in tumor is required for the effective inhibition of tumor growth in clinical applications, which provided an indicator for the clinical response.
The relationship between pEGFR degradation and tumor growth inhibition was also investigated with an integrated PK/PD model, which simultaneously accounted for pEGFR inhibition and tumor growth. In the tumor growth model, five physiologically relevant parameters were used. Among them, two parameters (λ0 and λ1) described the features of natural tumor growth in control animals, which started as exponential growth and shifted to linear growth. It was assumed that treatment with erlotinib caused a portion of the proliferating cells became non-proliferating, but the growth characteristics of the proliferating cells were unchanged. Simeoni et al suggested a model where the drug elicited its effect in decreasing the tumor growth rate by a factor proportional to C·X1, where C represents the drug plasma concentration20. In this study, a factor proportional to the pEGFR levels and X1 was assumed to explain the antitumor effect of erlotinib according to the drug's mechanism of action, which is the inhibition of EGFR phosphorylation leading to the prevention of cell signal transduction pathways and eventually resulting in tumor cell death18,31. In the integrated model, the anticancer effect of the drug was linearly related to both pEGFR inhibition and tumor volume. The parameter Kbio was used to describe this type of linear anticancer effect. The quantitative relationship of pEGFR degradation and tumor growth inhibition can be described by the integrated model, which provides an effective approach to understand the PK/PD relationship and the mechanism of drug action. Compared to the common PK/PD model based upon drug concentration and tumor volume, this integrated model provides a more intuitive view about whether the drug has reached its target site and exerted a pharmacological response as well as quantitatively explains the degree of the response and the resultant clinical effects. The integrated model focuses on the biomarker, which proved to be an important index for the drug action and directly linked the biomarker response to tumor growth inhibition, which helps provide a thorough understanding of drug action and its related clinical output.
The observed tumor volume at the dose of 12.5 mg/kg erlotinib from the reported study was well predicted by the integrated model, with the parameters estimated from the observation of erlotinib at 4.0 mg/kg and 50.0 mg/kg. The results demonstrated a good prediction of performance, indicating that by using the integrated model, tumor volume can be reliably predicted at a different dosages, which provides an opportunity to predict the tumor volume before adjusting the erlotinib dose without the need to undergo a tumor growth study as well as helps in optimizing the experimental design in preclinical and clinical studies29.
The results of the integrated model must be interpreted in light of limitations. First, the linear link of pEGFR inhibition to tumor volume can not explain the occurrence of nonlinearities caused by drug resistance and either active or saturable processed in the systems. Yamazaki et al provided an Emax model to describe the quantitative relationship between PD biomarkers and tumor growth and to investigate this complex PK/PD relationship, more study designs are required to explain the nonlinear aspect of the relationship27. Second, the pEGFR inhibitor erlotinib might inhibit tumor growth through a variety of additional biomarker responses. Therefore, to better understand the PK/PD relationships, more mechanistic PK/PD models are needed. Additionally, multiple biomarker response studies and intensive sampling at multiple doses are required.
In conclusion, the relationship among erlotinib plasma concentrations, pEGFR degradation, and tumor growth inhibition in a human tumor xenograft model was appropriately characterized in a quantitative manner by an integral PK/PD model. The intracellular indirect mechanism of action of erlotinib was responsible for the pEGFR inhibition lag behind the measured erlotinib plasma concentration. The IC50 value for pEGFR degradation was within the minimum and maximum steady-state concentration window of the clinical effective dosage, which provides evidence of the clinical significance of PK/PD modeling based on biomarkers. In the integrated PK/PD model, the pEGFR inhibition was linearly related to the tumor growth inhibition, which provides a thorough understanding of drug action and its therapeutic response. Additionally, the prediction capability of the integrated model was proven by the good prediction of tumor volume data after treatment with 12.5 mg/kg erlotinib. We believe that these PK/PD results will be helpful in understanding the mechanism of action and its therapeutic response and determining the appropriate experimental design in preclinical and clinical studies.
Author contribution
Qiong WU, Tian-yan ZHOU, and Wei LU designed the research; Qiong WU, Meng-yao LI, and Han-qing LI performed the research; Qiong WU, Liang LI, and Chen-hui DENG analyzed the data; and Qiong WU wrote the paper.
Acknowledgments
This work was supported by the Innovation Team of Ministry of Education (No BMU20110263E), and the National Natural Science Foundation of China (81273583).
References
- Salomon DS, Brandt R, Ciardiello F, Normanno N. Epidermal growth factor-related peptides and their receptors in human malignancies. Crit Rev Oncol Hematol. 1995;19:183–232. doi: 10.1016/1040-8428(94)00144-i. [DOI] [PubMed] [Google Scholar]
- Woodburn JR. The epidermal growth factor receptor and its inhibition in cancer therapy. Pharmacol Ther. 1999;82:241–50. doi: 10.1016/s0163-7258(98)00045-x. [DOI] [PubMed] [Google Scholar]
- Baselga J. Monoclonal antibodies directed at growth factor receptors. Ann Oncol. 2000;11:187–90. doi: 10.1093/annonc/11.suppl_3.187. [DOI] [PubMed] [Google Scholar]
- Ranson M, Hammond LA, Ferry D, Kris M, Tullo A, Murray PI, et al. ZD1839, a selective oral epidermal growth factor receptor-tyrosine kinase inhibitor, is well tolerated and active in patients with solid, malignant tumors: results of a phase I trial. J Clin Oncol. 2002;20:2240–50. doi: 10.1200/JCO.2002.10.112. [DOI] [PubMed] [Google Scholar]
- Hidalgo M, Siu LL, Nemunaitis J, Rizzo J, Hammond LA, Takimoto C, et al. Phase I and pharmacologic study of OSI-774, an epidermal growth factor receptor tyrosine kinase inhibitor, in patients with advanced solid malignancies. J Clin Oncol. 2001;19:3267–79. doi: 10.1200/JCO.2001.19.13.3267. [DOI] [PubMed] [Google Scholar]
- Thomas F, Rochaix P, White-Koning M, Hennebelle I, Sarini J, Benlyazid A, et al. Population pharmacokinetics of erlotinib and its pharmacokinetic/pharmacodynamic relationships in head and neck squamous cell carcinoma. Eur J Cancer. 2009;45:2316–23. doi: 10.1016/j.ejca.2009.05.007. [DOI] [PubMed] [Google Scholar]
- Shepherd FA, Rodrigues Pereira J, Ciuleanu T, Tan EH, Hirsh V, Thongprasert S, et al. Erlotinib in previously treated non-small-cell lung cancer. N Engl J Med. 2005;353:123–32. doi: 10.1056/NEJMoa050753. [DOI] [PubMed] [Google Scholar]
- Yarden Y. The EGFR family and its ligands in human cancer signalling mechanisms and therapeutic opportunities. Eur J Cancer. 2001;37:S3–8. doi: 10.1016/s0959-8049(01)00230-1. [DOI] [PubMed] [Google Scholar]
- Soulieres D, Senzer NN, Vokes EE, Hidalgo M, Agarwala SS, Siu LL. Multicenter phase II study of erlotinib, an oral epidermal growth factor receptor tyrosine kinase inhibitor, in patients with recurrent or metastatic squamous cell cancer of the head and neck. J Clin Oncol. 2004;22:77–85. doi: 10.1200/JCO.2004.06.075. [DOI] [PubMed] [Google Scholar]
- Jackson RC. Pharmacodynamic modelling of biomarker data in oncology. ISRN Pharmacol. 2012;2012:590626. doi: 10.5402/2012/590626. [DOI] [PMC free article] [PubMed] [Google Scholar]
- Sarker D, Workman P. Pharmacodynamic biomarkers for molecular cancer therapeutics. Adv Cancer Res. 2007;96:213–68. doi: 10.1016/S0065-230X(06)96008-4. [DOI] [PubMed] [Google Scholar]
- Luo FR, Yang Z, Camuso A, Smykla R, McGlinchey K, Fager K, et al. Dasatinib (BMS-354825) pharmacokinetics and pharmacodynamic biomarkers in animal models predict optimal clinical exposure. Clin Cancer Res. 2006;12:7180–6. doi: 10.1158/1078-0432.CCR-06-1112. [DOI] [PubMed] [Google Scholar]
- Yamazaki S, Skaptason J, Romero D, Lee JH, Zou HY, Christensen JG, et al. Pharmacokinetic-pharmacodynamic modeling of biomarker response and tumor growth inhibition to an orally available cMet kinase inhibitor in human tumor xenograft mouse models. Drug Metab Dispos. 2008;36:1267–74. doi: 10.1124/dmd.107.019711. [DOI] [PubMed] [Google Scholar]
- Lee L, Niu H, Rueger R, Igawa Y, Deutsch J, Ishii N, et al. The safety, tolerability, pharmacokinetics, and pharmacodynamics of single oral doses of CH4987655 in healthy volunteers: target suppression using a biomarker. Clin Cancer Res. 2009;15:7368–74. doi: 10.1158/1078-0432.CCR-09-1696. [DOI] [PubMed] [Google Scholar]
- Salphati L, Pang J, Plise EG, Chou B, Halladay JS, Olivero AG, et al. Preclinical pharmacokinetics of the novel PI3K inhibitor GDC-0941 and prediction of its pharmacokinetics and efficacy in human. Xenobiotica. 2011;41:1088–99. doi: 10.3109/00498254.2011.603386. [DOI] [PubMed] [Google Scholar]
- Luo FR, Yang Z, Dong H, Camuso A, McGlinchey K, Fager K, et al. Prediction of active drug plasma concentrations achieved in cancer patients by pharmacodynamic biomarkers identified from the geo human colon carcinoma xenograft model. Clin Cancer Res. 2005;11:5558–65. doi: 10.1158/1078-0432.CCR-05-0368. [DOI] [PubMed] [Google Scholar]
- Li M, Li H, Cheng X, Wang X, Li L, Zhou T, et al. Preclinical Pharmacokinetic/pharmacodynamic models to predict schedule-dependent interaction between erlotinib and gemcitabine. Pharm Res. 2013;30:1400–8. doi: 10.1007/s11095-013-0978-7. [DOI] [PubMed] [Google Scholar]
- Li HQ, Chen Y, Li ZQ, Deng CH, Li L, Bi SS, et al. A high performance liquid chromatography method for the quantitative determination of erlotinib in the plasma of tumor bearing BALB/c nude mice and its application in a pharmacokinetic study. J Chin Pharmaceut Sci. 2011;20:245–52. [Google Scholar]
- Aquino G, Pannone G, Santoro A, Liguori G, Franco R, Serpico R, et al. pEGFR-Tyr 845 expression as prognostic factors in oral squamous cell carcinoma: a tissue-microarray study with clinic-pathological correlations. Cancer Biol Ther. 2012;13:967–77. doi: 10.4161/cbt.20991. [DOI] [PMC free article] [PubMed] [Google Scholar]
- Simeoni M, Magni P, Cammia C, De Nicolao G, Croci V, Pesenti E, et al. Predictive pharmacokinetic-pharmacodynamic modeling of tumor growth kinetics in xenograft models after administration of anticancer agents. Cancer Res. 2004;64:1094–101. doi: 10.1158/0008-5472.can-03-2524. [DOI] [PubMed] [Google Scholar]
- Li J, Zhao M, He P, Hidalgo M, Baker SD. Differential metabolism of gefitinib and erlotinib by human cytochrome P450 enzymes. Clin Cancer Res. 2007;13:3731–7. doi: 10.1158/1078-0432.CCR-07-0088. [DOI] [PubMed] [Google Scholar]
- Jusko WJ, Ko HC. Physiologic indirect response models characterize diverse types of pharmacodynamic effects. Clin Pharmacol Ther. 1994;56:406–19. doi: 10.1038/clpt.1994.155. [DOI] [PubMed] [Google Scholar]
- Xu L, Eiseman JL, Egorin MJ, D'Argenio DZ. Physiologically-based pharmacokinetics and molecular pharmacodynamics of 17-(allylamino)-17-demethoxygeldanamycin and its active metabolite in tumor-bearing mice. J Pharmacokinet Pharmacodyn. 2003;30:185–219. doi: 10.1023/a:1025542026488. [DOI] [PubMed] [Google Scholar]
- Norton L, Simon R. Growth curve of an experimental solid tumor following radiotherapy. J Natl Cancer Inst. 1977;58:1735–41. doi: 10.1093/jnci/58.6.1735. [DOI] [PubMed] [Google Scholar]
- Bissery MC, Vrignaud P, Lavelle F, Chabot GG. Experimental antitumor activity and pharmacokinetics of the camptothecin analog irinotecan (CPT-11) in mice. Anticancer Drugs. 1996;7:437–60. doi: 10.1097/00001813-199606000-00010. [DOI] [PubMed] [Google Scholar]
- Koch G, Walz A, Lahu G, Schropp J. Modeling of tumor growth and anticancer effects of combination therapy. J Pharmacokinet Pharmacodyn. 2009;36:179–97. doi: 10.1007/s10928-009-9117-9. [DOI] [PubMed] [Google Scholar]
- Yamazaki S, Nguyen L, Vekich S, Shen Z, Yin MJ, Mehta PP, et al. Pharmacokinetic-pharmacodynamic modeling of biomarker response and tumor growth inhibition to an orally available heat shock protein 90 inhibitor in a human tumor xenograft mouse model. J Pharmacol Exp Ther. 2011;338:964–73. doi: 10.1124/jpet.111.181339. [DOI] [PubMed] [Google Scholar]
- Mager DE, Jusko WJ. Pharmacodynamic modeling of time-dependent transduction systems. Clin Pharmacol Ther. 2001;70:210–6. doi: 10.1067/mcp.2001.118244. [DOI] [PubMed] [Google Scholar]
- Uchida H, Mamo DC, Pollock BG, Suzuki T, Tsunoda K, Watanabe K, et al. Predicting plasma concentration of risperidone associated with dosage change: a population pharmacokinetic study. Ther Drug Monit. 2012;34:182–7. doi: 10.1097/FTD.0b013e3182489a6f. [DOI] [PubMed] [Google Scholar]
- Ciardiello F, Tortora G. Epidermal growth factor receptor (EGFR) as a target in cancer therapy: understanding the role of receptor expression and other molecular determinants that could influence the response to anti-EGFR drugs. Eur J Cancer. 2003;39:1348–54. doi: 10.1016/s0959-8049(03)00235-1. [DOI] [PubMed] [Google Scholar]
- Dayneka NL, Garg V, Jusko WJ. Comparison of four basic models of indirect pharmacodynamic responses. J Pharmacokinet Biopharm. 1993;21:457–78. doi: 10.1007/BF01061691. [DOI] [PMC free article] [PubMed] [Google Scholar]
- Tan AR, Yang X, Hewitt SM, Berman A, Lepper ER, Sparreboom A, et al. Evaluation of biologic end points and pharmacokinetics in patients with metastatic breast cancer after treatment with erlotinib, an epidermal growth factor receptor tyrosine kinase inhibitor. J Clin Oncol. 2004;22:3080–90. doi: 10.1200/JCO.2004.08.189. [DOI] [PubMed] [Google Scholar]