

This study identified an increased copy number variant (CNV) content in lenti-miPSCs and retro-miPSCs (29∼53 CNVs) compared with p-miPSCs (9∼10 CNVs), indicating that this improved protein-based reprogramming method maintains genomic integrity better than current viral reprogramming methods. Thus, this study demonstrates that reprogramming methods significantly influence the genomic integrity of resulting induced pluripotent stem cells.
Keywords: Copy number variant, Induced pluripotent stem cell, Reprogramming method, Genomic integrity, Protein-based iPSC
Abstract
It has recently been shown that genomic integrity (with respect to copy number variants [CNVs]) is compromised in human induced pluripotent stem cells (iPSCs) generated by viral-based ectopic expression of specific transcription factors (e.g., Oct4, Sox2, Klf4, and c-Myc). However, it is unclear how different methods for iPSC generation compare with one another with respect to CNV formation. Because array-based methods remain the gold standard for detecting unbalanced structural variants (i.e., CNVs), we have used this approach to comprehensively identify CNVs in iPSC as a proxy for determining whether our modified protein-based method minimizes genomic instability compared with retro- and lentiviral methods. In this study, we established an improved method for protein reprogramming by using partially purified reprogramming proteins, resulting in more efficient generation of iPSCs from C57/BL6J mouse hepatocytes than using protein extracts. We also developed a robust and unbiased 1 M custom array CGH platform to identify novel CNVs and previously described hot spots for CNV formation, allowing us to detect CNVs down to the size of 1.9 kb. The genomic integrity of these protein-based mouse iPSCs (p-miPSCs) was compared with miPSCs developed from viral-based strategies (i.e., retroviral: retro-miPSCs or lentiviral: lenti-miPSCs). We identified an increased CNV content in lenti-miPSCs and retro-miPSCs (29∼53 CNVs) compared with p-miPSCs (9∼10 CNVs), indicating that our improved protein-based reprogramming method maintains genomic integrity better than current viral reprogramming methods. Thus, our study, for the first time to our knowledge, demonstrates that reprogramming methods significantly influence the genomic integrity of resulting iPSCs.
Introduction
Successful reprogramming of somatic cells to produce induced pluripotent stem cells (iPSCs) by viral introduction of defined transcription factors (e.g., Oct4, Sox2, Klf4, and c-Myc) has paved the way to generate disease- and patient-specific stem cells that can be used to study and treat human diseases [1]. Subsequent studies demonstrated that a wide variety of mouse and human tissues could be reprogrammed by the same, or similar, sets of reprogramming factors [2–4]. These studies demonstrated that iPSCs are almost indistinguishable in morphological, cellular, molecular, and differentiation properties from their embryonic stem cell (ESC) counterparts. However, because most reprogramming methods use oncogenes and/or genome-integrating viruses, it is possible that genetic/genomic changes accompany the reprogramming process. Indeed, several recent studies have begun to investigate the chromosomal integrity of cells that have undergone the reprogramming process and/or prolonged in vitro culturing and reported substantial amounts of chromosomal aberrations in iPSCs [5–11]. In particular, Hussein et al. [7] showed that human iPSC lines that were established either by retroviral or PiggyBac gene delivery methods presented with a significant number of copy number variants (CNVs) during early passages. Laurent et al. [8] found that many human iPSCs had CNVs in the form of deletions overlapping specific tumor suppressor genes. Clearly, these studies demonstrate that CNV formation serves as an important parameter for measuring genome integrity beyond the resolution available from conventional GTG-banded karyotype analysis [7–9]. Taken together, compromised genomic integrity of iPSCs is emerging as a critical issue for future application of iPSCs for biomedical and regenerative medicine [12–14].
We hypothesize that different reprogramming methods (e.g., genome-integrating vs. nongenome-integrating as well as gene-based vs. protein-based methods) may differentially affect chromosomal integrity in the reprogrammed iPSCs. To address this, we analyzed the extent of CNV formation in iPSCs generated with different methodologies derived from the same cell source. In this study, we describe an improved protein-based method for iPSC generation and show by CNV analyses that it maintains genome integrity better than viral-based methods, including lentiviral and retroviral procedures.
Materials and Methods
Cell Cultures
Primary mouse hepatocytes (mH) were isolated from 13.5-day-pregnant C57/BL6J mice and cultured in Dulbecco’s modified Eagle’s medium (DMEM; Invitrogen, Carlsbad, CA, http://www.invitrogen.com), supplemented with 10 ng/ml epidermal growth factor (Peprotech, Rocky Hill, NJ, http://www.peprotech.com), 15% fetal bovine serum (FBS; HyClone, Thermo Scientific, Logan, UT, http://www.hyclone.com), 100 U/ml penicillin, and 100 μg/ml streptomycin (Invitrogen, Grand Island, NY). Reprogramming was initiated with proteins or viruses when cultures reached 10%–20% confluence. Cultures were maintained at 37°C and 5% CO2, and media was changed every other day. Mouse embryonic fibroblasts (MEF) were isolated from uteri of 13.5-day-pregnant CD1 mice and used as feeders for mouse iPSCs and ESCs. Mouse embryonic stem cells (mESCs) derived from murine strain C57/BL6J were purchased from Millipore (catalogue SF-CMT1-2; Billerica, MA, http://www.millipore.com) and maintained in mouse embryonic stem (ES) medium (DMEM supplemented with 2 mM L-glutamine [Invitrogen], 1 mM β-mercaptoethanol, 1× nonessential amino acids [Invitrogen], 15% fetal bovine serum [FBS; Hyclone, Thermo Scientific], 100 U/ml penicillin, 100 μg/ml streptomycin [Invitrogen], and 1,500 U/ml [Millipore]). Mouse iPSCs (miPSCs) were generated and maintained in mouse ES media. miPSCs were maintained on MEF feeder cells treated with mitomycin C (10 μg/ml media; Sigma-Aldrich, St. Louis, MO, http://www.sigmaaldrich.com) and passaged by washing twice with phosphate-buffered saline (PBS), followed by dissociation with 1× trypsin-EDTA solution (Invitrogen; 10 minutes). Cells were suspended in an appropriate volume of medium and transferred onto MEF feeder cells in a new dish.
Protein Preparation and Purification
Stable HEK293 cell lines expressing each of the four recombinant reprogramming proteins were previously described [15]. Stable HEK293 cells were grown at 37°C and 5% CO2 in DMEM supplemented with 10% fetal calf serum and 400 μg/ml G-418. To purify recombinant reprogramming proteins, cells were washed twice with PBS, suspended in lysis buffer (50 mM NaH2PO4, 300 mM NaCl, 10 mM imidazole, 0.05% Tween 20, pH 8.0), and lysed by sonication on ice. After centrifugation, the resulting lysates were added to Ni-NTA columns (Qiagen, Hilden, Germany, http://www.qiagen.com). After washing with 10-column volumes (50 mM NaH2PO4, 300 mM NaCl, 20 mM imidazole, 0.05% Tween 20, pH 8.0), the recombinant proteins were eluted (50 mM NaH2PO4, 300 mM NaCl, 250 mM imidazole, 0.05% Tween 20, pH 8.0) and dialyzed against PBS at 4°C.
Western Blotting
To monitor protein purification, we performed Western blot analyses. Cell lysates (radioimmunoprecipitation assay buffer consisting of 50 mM Tris [pH 7.5], 150 mM NaCl, 1% Nonidet P-40, 0.5% deoxycholic acid, 0.1% SDS, supplemented with a protease inhibitor cocktail [Roche, Indianapolis, IN, http://www.roche.com]) were mixed with an equal volume of sample buffer consisting of 125 mM Tris (pH 6.8), 2% SDS, 15% glycerol, 5% β-mercaptoethanol, and 0.05% bromophenol blue. Proteins were separated by 10% SDS-polyacrylamide gel electrophoresis and transferred to a nitrocellulose membrane (Hybond-ECL; Amersham Biosciences, Piscataway, NJ, http://www.amersham.com). After blocking, the membrane was incubated with mouse anti-myc (Roche; 1:3,000) antibodies diluted in PBS containing 0.1% BSA for 12 hours at 4°C. The membrane was incubated with 1:3,000 dilution of horseradish peroxidase-conjugated anti-mouse or anti-rabbit immunoglobulin G (IgG) antibody (Amersham). Detection was achieved using an enhanced chemiluminescent substrate (Amersham).
Reprogramming of Primary Mouse Hepatocytes by Direct Protein Delivery and Lentiviral Infection
To generate mouse iPSCs by direct protein delivery or lentiviral methods, primary mH cells isolated from the same pool of C57/BL6J mice were incubated with a combination of four partially purified proteins (Oct4, Sox2, Klf4, and c-Myc). In addition, primary mH cells were treated with total cell extracts containing all four protein factors. In both methods, approximately 2 μg of each protein was used per each treatment after confirming their transcriptional activities using relevant reporter assays. Cells were incubated overnight (16 hours) with the protein extracts, followed by incubation for 2 days in ES medium. This 3-day cycle was repeated six times. Cell colonies were transferred onto MEF. After 18 days on MEF, protein-based iPSC lines were established and maintained in ES medium. For lentiviral transduction, the same primary mH cells from the same pool of C57/BL6J mice were incubated with viral supernatant containing polybrene (hexadimethrine bromide; 1 µg/ml; Sigma-Aldrich) for 2–4 hours. After infection, cells were incubated 3 days in normal culture medium (DMEM with 15% defined FBS). At day 4 postinfection, cells were replated onto mitomycin-treated MEF. Virus-infected mH cells were cultured in mouse ES medium, and iPS-like colonies appeared at approximately day 20 postinfection. Among these multiple iPS-like colonies, six protein-based miPSC (p-miPSC) and five lentiviral (lenti)-miPSC lines were established and maintained for more than 30 passages.
Plasmid and Virus Construction
Plasmids expressing recombinant Oct4, Sox2, Klf4, and c-Myc fused with 9R, myc, and histidine tag were described in our previous study [16]. We purchased inducible lentivirus constructs (FUW-TetO-lox-each 4F cDNA) for reprogramming factor genes (catalogue 20728, 20729, 20727, and 20723) and green fluorescent protein (GFP; pLCAG EGFP; catalogue 14857) from Addgene (Cambridge, MA, http://www.addgene.org). Lentiviruses were prepared using the 293T cell line. Briefly, for each target plasmid, the packaging plasmid pMDLg/pRRE (catalogue 12251; Addgene) and vesicular stomatitis virus-G expression plasmid pMD2.G (catalogue 12259; Addgene) were transfected into 293T cells at a ratio of 3:3:1 using Lipofectamine (catalogue 18324; Invitrogen) and PLUS reagent (catalogue 11514; Invitrogen). The supernatant containing viral particles was collected every 24 hours for 3 days and passed through 0.45-μm filters. The viral supernatant was used immediately for infection or stored at −80°C for use later.
Real-Time Quantitative Polymerase Chain Reaction Analyses for Marker Genes’ Expression
Total RNA was isolated from each iPSC with TRIzol reagent (Invitrogen) and reverse transcribed with SuperScript II (Invitrogen) and oligo-dT primer, according to the manufacturer’s instructions. Real-time polymerase chain reaction (PCR) analyses were performed in triplicate using SYBR Green I and a DNA engine Opticon (MJ Research, Waltham, MA, http://mj-research.com). Amplification reactions were performed in 25 µl containing 0.5 µM of each primer, 0.5× SYBR Green I (Molecular Probes, Eugene, OR, http://probes.invitrogen.com), and 2 µl of cDNA. PCR was performed with a temperature profile consisting of 95°C for 30 seconds, 55°C for 30 seconds, 72°C for 30 seconds, and 79°C for 5 seconds for 40–50 cycles. The dissociation curve of each PCR product was determined to ensure that the observed fluorescent signals were only from specific PCR products. After each PCR cycle, the fluorescent signals were detected at 79°C to melt primer dimers (melting temperatures of all primer dimers used in this study were <76°C). A standard curve was constructed using plasmid DNAs containing the control GAPDH gene (from 104 to 109 molecules). The fluorescent signals from specific PCR products were normalized against that of the actin gene. Primer sequences used for reverse transcription-PCR are listed in supplemental online Table 1.
Bisulfite Genomic Sequencing
The epigenetic status of the mouse Oct4 gene promoter was analyzed by using genomic DNA isolated with the DNeasy Tissue Kit (Qiagen). Bisulfite sequencing was performed with the EpiTect Bisulfite Kit (Qiagen), according to the manufacturer’s instructions. The promoter region of the mouse Oct4 gene was amplified by PCR, and the resulting PCR products were gel-purified, cloned into the pGEM-T Easy vector (Promega, Madison, WI, http://www.promega.com), and sequenced with T7 and Sp6 primers.
Karyotyping Analysis
Standard G-banded chromosome analysis was performed for each m-iPSC line at Cell Line Genetics (Madison, WI, http://www.clgenetics.com).
Alkaline Phosphatase Staining and Immunocytochemistry
Alkaline phosphatase (AP) staining was done using the alkaline phosphatase staining kit II (Vector Laboratories, Burlingame, CA, http://www.vectorlabs.com). For immunocytochemistry, cells were fixed with 4% formaldehyde for 20 minutes at room temperature and treated with PBS containing 10% normal goat serum and 0.1% Triton X-100 for 45 minutes at room temperature. Antibodies against SSEA1 (monoclonal, 1:300; Chemicon, Temecula, CA, http://www.chemicon.com), Oct4 (monoclonal, 1:300; Santa Cruz Biotechnology, Santa Cruz, CA, http://www.scbt.com), Nanog (monoclonal, 1:300; Chemicon), smooth muscle actin (SMA) (monoclonal, 1:400; Dako, Glostrup, Denmark, http://www.dako.com), antineuronal class III β-tubulin (Tuj1; monoclonal, 1:500; Covance, Richmond, CA, http://www.covance.com), Desmin (polyclonal, 1:500; Dako), hepatocyte necrosis factor (HNF 3β; monoclonal, 1:1,000; Chemicon), α-fetoprotein (monoclonal, 1:150; Santa Cruz Biotechnology), and low-density lipoprotein (LDL; polyclonal, 1:1,000; Invitrogen) were used as primary antibodies. To detect the signal, fluorescence-labeled (Alexa Fluor 488 or 568; Molecular Probes) secondary antibodies were used, following cell mounting using Vectashield containing 4′,6-diamidino-2-phenylindole (Vector Laboratories), and analyzed by fluorescent microscopy.
In Vitro and In Vivo Differentiation of iPSCs
Following dissociation of p-miPSCs, cells were plated on bacterial dishes in ES media without leukemia inhibitory factor, and embryoid bodies (EBs) were allowed to form for 8 days. EBs were attached onto tissue culture dishes and were differentiated into (neuro)ectoderm, endoderm, and mesoderm cells using DMEM/F12 medium supplemented with insulin, transferrin, selenium, and fibronectin for 3 weeks. Each lineage cell type was identified by immunostaining using specific antibodies. For teratoma generation, miPSCs were suspended in DMEM containing 10% FBS and injected under the kidney capsule of severe combined immunodeficiency mice anesthetized with diethyl ether. Six to 8 weeks postinjection, tumors were surgically dissected and analyzed for the presence of the three germ layer tissues following staining with hematoxylin and eosin.
Expression Array Analysis
Total RNAs were prepared from mH, mESCs, and miPSCs using TRIzol reagent (Invitrogen), and their cDNAs were allowed to hybridize to Affymetrix Mouse Expression Array 430 containing more than 43,000 mouse transcripts at the Harvard Partners Center for Genetics and Genomics. Detailed procedure is described in the website at http://pcpgm.partners.org/research-services/microarrays/affymetrix.
aCGH Experiments
For the array comparative genomic hybridization (aCGH) experiments, DNAs from four p-miPSC lines, five lenti-miPSC, and one retroviral (retro)-miPSC line of C57/BL6J mice were prepared. To avoid the biased effect of CNV formation as a result of different passages in culture, genomic DNAs were prepared from these iPSC lines at the same passage number (p18). Reference DNA was extracted from C57/BL6J mice liver (hepatocytes) for all aCGH experiments. An Agilent custom aCGH platform was designed using 1,005,044 oligonucleotide probes based on the Mouse (Mus musculus) July 2007 (NCBI37/mm9) assembly, obtained from the Build 37 assembly by National Center for Biotechnology Information and the Mouse Genome Sequencing Consortium. The array was developed to identify novel CNVs and previously described hot spots for CNV formation [17–20] with a median spacing of 461 bases for the hot spots and 1,180 bases for the entire genome, allowing us to detect CNVs down to the size of 1.4 kb (supplemental online Fig. 5A). We conducted aCGH experiments according to the manufacturer’s instructions. Briefly, test and reference genomic DNAs (1,500 ng) were fragmented using heat fragmentation methods and fluorescently labeled with Cy5 (test) and Cy3 (reference) using the Agilent DNA Labeling Kit. We combined labeled test and reference DNAs and denatured, preannealed with Cot-1 DNA (Invitrogen) and blocking reagent (Agilent Technologies, Palo Alto, CA, http://www.agilent.com), and then hybridized to the arrays for 40 hours in a rotating oven (Agilent Technologies) at 65°C and 20 rpm. Following hybridization and recommended washes, the arrays were scanned at 3 μm resolution using an Agilent scanner. Images were analyzed with the Feature Extraction Software 10.5.1.1 (Agilent Technologies), using the CGH-105_Jan09 protocol for background subtraction and normalization. We used data that passed “Quality Check” calculated by the Agilent Feature Extraction program. Through QCMetrics, we checked reproducibility, background noise, signal intensity, and signal-to-noise ratio for each probe. For the two independent sources of noise contributing to the total noise intervals, the centralization and the fuzzy zero algorithms were used. The centralization algorithm changes log ratio values, and the fuzzy zero algorithm changes scores for aberration algorithms by applying a more robust error model that accounts for the global noise of the array. The Aberration Detection Method (ADM) [21] statistical algorithm was subsequently used to identify CNVs based on the combined log2 ratios. ADM2 uses an iterative procedure to identify all genomic regions for which the weighted average of the measured probe signals is different from the expected value of 0. ADM2 takes individual probe quality into account (log ratio error). Because ADM2 incorporates the quality of the probe, we can detect small aberrant intervals especially. The ADM2 calculation excludes the low-quality features and features with low signals on an array, which will have a high log ratio error value. Each feature will have its own log ratio error value. We called CNV segments by ≥3 consecutive probes, a p value of <1.0 × 10⁻¹⁵, and |log2 ratio| ≥0.6 for aCGH data.
Quantitative PCR and PCR Experiments
All 10 samples, as well as the parental sample mH, were used in validation studies by real-time quantitative PCR using SYBR Green for whole CNV regions identified by custom aCGH. The list of primers and sequence information is shown (supplemental online Table 1). We performed quantitative PCR (qPCR) experiments on genomic DNAs to validate somatic CNVs identified by custom aCGH. SYBR Green validations were run on an Applied Biosystems (Foster City, CA, http://www.appliedbiosystems.com) 7900HT Fast real-time PCR instrument. SYBR Premix Ex Taq RR041A was ordered from Takara Bio (Shiga, Japan, http://www.takara-bio.com). The conditions for the qPCR experiments were 5 ng of genomic DNA, 2× SYBR, 50× ROXII reference dye, and 10 μM primers in a 20 μl total reaction volume. Each experiment was run in triplicate. PCRs were incubated for 2 minutes at 95°C, followed by 40 cycles of 5 seconds at 95°C and 30 seconds at 60°C. Data were collected and processed with the SDS 2.3 software provided by the manufacturer and subsequently analyzed by Microsoft Excel. Fold change for each sample relative to the mH was calculated using the standard δ-δ cycle threshold (DDCt) method. The qPCR and aCGH results were compared for our validation. In each validation region, samples were clustered into three groups (copy number [CN] loss, normal, and gain) by DDCt values and the corresponding log2 ratios independently, and a 3 × 3 table was generated. Using the log2 ratio of aCGH data, qPCR values, and PCR results, we used cutoffs: less than 0.5 and less than 0.2 for single loss and homozygous deletions, respectively. We also validated some of these regions by regular PCR with flanking primers targeted against the ends of each CNV region. PCR amplification was performed in 50 μl with 50 ng of genomic DNA, 10 pmol of forward and reverse primer each, standard volume of Ex Taq (Takara, Otsu, Japan, http://www.takara.co.jp), Ex Taq buffer (Takara), and dNTPs (Takara) at 95°C for 10 minutes, 40 cycles of 95°C for 30 seconds, 60°C for 30 seconds, 72°C for 30 seconds, and, finally, 72°C for 10 minutes. Using 1 M custom array platform, the minimum size of somatic CNVs detected and validated by qPCR was 1.9 kb.
Gene Ontology
Relationship among genes, gene products, and their pathways associated with the CNVs was performed using the gene ontology analysis. We used the PANTHER ontology (http://www.pantherdb.org) algorithm for classifying genes in which coding sequences overlap with shared CN gains or CN losses. Refseq genes from the genome browser of the University of California, Santa Cruz, were used as input into the pathway with default settings.
Results
Improved Protein-Based Method for iPSC Generation
Our previous protein-based reprogramming methods used direct delivery of four reprogramming factors (Oct4, Sox2, Klf4, and c-Myc), each fused to a cell-penetrating peptide (a nine arginine stretch; 9R) [15]. Whole-cell extracts obtained from HEK293 cell lines were used, which express the recombinant reprogramming factors. Unfortunately, this reprogramming method was highly inefficient and took longer to generate iPSCs compared with viral-based methods, partially because of the cytotoxicity of the whole-cell extracts [15]. An alternate approach is to use purified recombinant reprogramming proteins following expression in Escherichia coli [22]. Whereas high levels of reprogramming proteins can be expressed in E. coli, they become insoluble forms without post-translational modification(s) and need to be resolubilized. Thus, we expressed these reprogramming proteins in mammalian cells and attempted to purify them by nickel affinity chromatography using the histidine tag next to the 9R stretch. Although their purification was incomplete, recombinant reprogramming proteins were significantly enriched using this process and were much less cytotoxic than whole-cell extracts (supplemental online Fig. 1A, 1B).
Primary cultures of C57/BL6J mouse hepatocytes (mH) were treated with these partially purified proteins, as described in supplemental online Fig. 1C. In parallel, we also tested the use of cell extracts expressing each of the four proteins as well as lentiviruses expressing the same four factors. Following an overnight treatment (16 hours), cells were washed and incubated for 2 days in mouse ES media, and this 3-day treatment cycle was repeated six times. By day 18, approximately 10 alkaline phosphatase (AP)-positive colonies were generated from 1 × 10⁵ cells by the use of partially purified proteins (Fig. 1A). In contrast, AP-positive colonies were not observed when whole-cell extracts were treated six times. These protein-treated cells were transferred (“reseeded”) onto MEF cells in the presence of the same mouse ES media, and colonies with iPS-like morphology were handpicked at ∼day 28 (Fig. 1A).
Figure 1.

Generation and characterization of mouse induced pluripotent stem cell lines using the protein reprogramming method. (A): Starting primary hepatocyte culture (far left image); morphology after six cycle protein treatments; established iPS colonies; and AP staining of established iPS colonies (far right image). (B): Immunostaining of mESC markers (Nanog, Oct4, and SSEA1) in p-miPSC-1 (upper panel) and in p-miPSC-2 (lower panel). Nuclei were stained with 4′,6-diamidino-2-phenylindole (blue) and shown in inlets. (C): Quantitative reverse transcription-polymerase chain reaction analysis of embryonic stem cell marker genes (c-Myc, Klf4, Oct4, Nanog, GDF3, Zfp296, Sox2, FGF4, and Dax) in mouse hepatocytes (1), mESCs (2), p-miPSC-1 (3), and p-miPSC-2 (4). Relative gene expression represents log scale fold changes relative to that of hepatocytes, following normalization to actin expression. (D): Global gene-expression patterns by Affymetrix microarrays showed a similar pattern between p-miPSC-1 and p-miPSC-2 and mESCs. Expression of Oct4 and Nanog is indicated by red dots and within the thresholds (red lines) when compared with mESCs but outside the thresholds for mH. (E): Bisulfite sequencing analysis of the Oct4 promoter reveals almost complete epigenetic reprogramming in p-miPSC-1 and p-miPSC-2. Open and filled circles indicate unmethylated and methylated CpG, respectively. Abbreviations: AP, alkaline phosphatase; iPS, induced pluripotent stem; mESC, mouse embryonic stem cell; mH, mouse hepatocytes; p-miPSC, protein-based mouse induced pluripotent stem cell.
In the case of lentiviral transduction, at day 4 postinfection, cells were replated onto mitomycin-treated MEF and >100 iPS-like colonies appeared at approximately day 20 postinfection. Among these multiple iPS-like colonies, we established six fully reprogrammed protein-based iPSC lines (p-miPSC-1∼6) and five lentivirus-based iPSC lines (lenti-miPSC-1∼5) with cell morphologies indistinguishable from mouse ESCs and maintained for more than 30 passages. Thus, the use of semipurified proteins made protein-based reprogramming significantly more efficient than using whole-cell extracts.
Protein-Based Mouse iPSC Lines Exhibit Molecular and Differentiation Properties Similar to Those of mESCs
Among the six established protein-based iPSC lines, we fully characterized four lines (p-miPSC-1∼4) for their morphological, proliferation, molecular, and differentiation properties. Each protein-based iPSC line prominently expressed ESC markers such as Nanog, Oct4, and SSEA1 (Fig. 1B; supplemental online Fig. 2). Quantitative reverse transcription-PCR analysis confirmed expression of endogenous ESC marker genes (i.e., c-Myc, Klf4, Oct4, Nanog, growth and differentiation factor 3 [Gdf3], ZFP296, Sox2, FGF4, and Dax) at comparable levels to those of mESCs (Fig. 1C; supplemental online Fig. 3A). Scatter plots of DNA microarray analyses of p-miPSCs and mESCs showed similar global gene-expression patterns and tight correlation between them, but they are distinct from those of primary hepatocytes (Fig. 1D; supplemental online Fig. 3B), supporting that all four p-miPSC lines have global transcriptional profiles similar to that of mESCs. Bisulfite sequencing analysis demonstrated that the Oct4 gene promoter region was greatly demethylated in all p-miPSC lines as well as in mESC lines, whereas in parental hepatocytes it was hypermethylated (Fig. 1E; supplemental online Fig. 3C). Using an embryoid body (EB)-based in vitro differentiation procedure, these p-miPSC lines generated all three germ layer cells in vitro (Fig. 2A; supplemental online Fig. 4A), evidenced by immunocytochemical staining of cell types positive for Tuj1 (ectodermal marker), smooth-muscle actin (SMA, mesodermal marker), desmin (mesodermal marker), low-density lipoprotein (LDL, mesodermal marker), α-fetoprotein (α-feto, endodermal marker), and hepatocyte necrosis factor 3β (HNF3β, endodermal marker). In vivo pluripotency was also confirmed by teratoma formation, which included all three germ layer tissues (Fig. 2B; supplemental online Fig. 4B), after transplantation of p-miPSCs into the kidney capsule of nude mice for 6 weeks. Furthermore, we injected p-miPSCs, infected by green fluorescent protein (GFP)-expressing viral vector (pCV II-GFP), into CD1 blastocysts by microinjection. At E13.5, we found chimeras exhibiting a high amount of GFP-expressing p-miPSCs (Fig. 2C). Finally, we performed karyotype analysis and found that all p-miPSC lines had a normal karyotype (Fig. 2D and data not shown). Similarly, we confirmed that lentivirus-based iPSC lines (lenti-miPSC-1∼5) also have all criteria of fully reprogrammed cells (supplemental online Figs. 2B, 4).
Figure 2.

Protein-based mouse induced pluripotent stem cells exhibit pluripotent differentiation potential in vitro and in vivo and have normal karyotype. (A): In vitro differentiation potential was analyzed by EB generation in suspension culture, followed by differentiation for 2 weeks. Cells from all three germ layers were identified by immunocytostaining, including neural (ectodermal), muscle and endothelial-like (mesodermal), and endoderm-lineage cells (endoderm). Upper panel, p-miPSC-1; lower panel, p-miPSC-2. (B): In vivo differentiation potential was analyzed by injecting p-miPSCs into immunodeficiency mice and by hematoxylin and eosin staining of teratomas. The resulting teratomas contained tissues representing all three germ layers: ectoderm (neural tube or epidermis), mesoderm (cartilage or muscle), and endoderm (respiratory epithelium or intestinal-like epithelium) lineage cells. Upper panel, p-miPSC-1; lower panel, p-miPSC-2. (C): Chimeras derived from p-miPSC-1 (left panel) and p-miPSC-2 (right panel) at E13.5 fetuses show a high level of GFP from injected p-miPSCs. (D): Standard G-banded chromosome analysis showed normal karyotypes for p-miPSC-1 and p-miPSC-2. Abbreviations: GFP, green fluorescent protein; p-miPSC, protein-based mouse induced pluripotent stem cell.
Comprehensive Copy Number Variants Discovery
CNVs in the human genome play a major role in affecting gene expression and phenotypic variation through changes in gene dosage, transcripts, and gene fusion [23–25]. Because CNV formation is an important parameter of genome integrity [7–9, 12–14], we assessed the extent of CNV in iPSC lines generated by the protein-based reprogramming method described above and compared it with those of iPSCs generated by lentiviruses expressing the same four reprogramming factors (Oct4, Sox2, Klf4, and c-Myc). We also included a retrovirus-based miPSC line 103 C-1 (retro-miPSC) that was previously derived from C57/BL6J mouse hepatocytes by retroviral expression of the same four factors [26]. Genomic DNAs were prepared from these iPSC lines at the same passage number (p18) to exclude CNVs biased from cell culture passaging effects [7]. These genomic DNAs prepared from the original hepatocytes, p-miPSCs-1∼4, lenti-miPSCs-1∼5, and retro-miPSC, were applied to a mouse custom-designed aCGH platform (Fig. 3A).
Figure 3.

Identification and comparison of copy number variants (CNVs) from protein-, lenti-, and retro-based induced pluripotent stem cell (iPSC) lines using 1 M array comparative genomic hybridization (aCGH) platforms. (A): The genomic DNAs of 10 iPSC lines (4 protein-based, 5 lentiviral-based, and 1 retrovirus-based) derived from C57/BL6J mouse hepatocytes were used for the 1 M aCGH experiments. (B): Frequency of CN gains and losses. The number of CN gains and losses from each miPSCs is shown. The x-axis represents type of iPSCs, and the y-axes show number of CNVs. (C): Chromosomal distribution of CNVs in p-miPSCs (p-miPSC-1∼4) and viral iPSCs (lenti-miPSC-1∼5 and retro-miPSC). The x-axis represents chromosome, and the y-axes show average number of CNVs. Abbreviations: Chr, chromosome; CN, copy number; lenti, lentiviral; mH, mouse hepatocytes; p-miPSC, protein-based mouse induced pluripotent stem cell; retro, retroviral.
To validate our aCGH results, we tested whole somatic CNVs by use of qPCR and ordinary PCR experiments across all the 10 iPSCs and mH. Using 1 M custom array platform, the minimum size of somatic CNVs detected and validated by qPCR was 1.9 kb (supplemental online Fig. 5B, 5C). This approach validated total 276 somatic CNVs using 107 primer pairs with 92% sensitivity for detecting somatic CNVs (supplemental online Tables 1, 2). Thus, this array detects CNVs at a resolution higher than that for any previous iPS genomic study. For instance, Affymetrix SNP array 6.0 found CNVs larger than 10 kb [7], Illumina OmniQuad version 1 detected CNVs larger than 30 kb [8], and Martins-Taylor et al. [9] used aCGH with 385k probes or 135k probes, identifying CNVs larger than 10 kb. The reference DNA source used for our aCGH experiments was genomic DNA of the primary hepatocytes of the C57/BL6J mouse from which these iPS lines were derived. We confirmed 0∼1 copy number (CN) gains and 8∼10 CN losses in p-miPSCs-1∼4. In contrast, 4∼10 CN gains and 25∼39 CN losses were validated in viral-miPSCs (lenti-miPSC-1∼5 and retro-miPSC) (Fig. 3B). By Wilcoxon two-sample test for the number of CN gains and CN losses of p-miPSCs and viral miPSCs, p values were .0095 and .0048, respectively. The genomic distribution of the CNVs in viral-miPSCs (i.e., lenti-miPSC-1∼5 and retro-miPSC) shows a correspondingly sharp increase in the number of CNV locations when compared with p-miPSC-1∼4 (Fig. 3C).
Validation and Characterization of CNVs
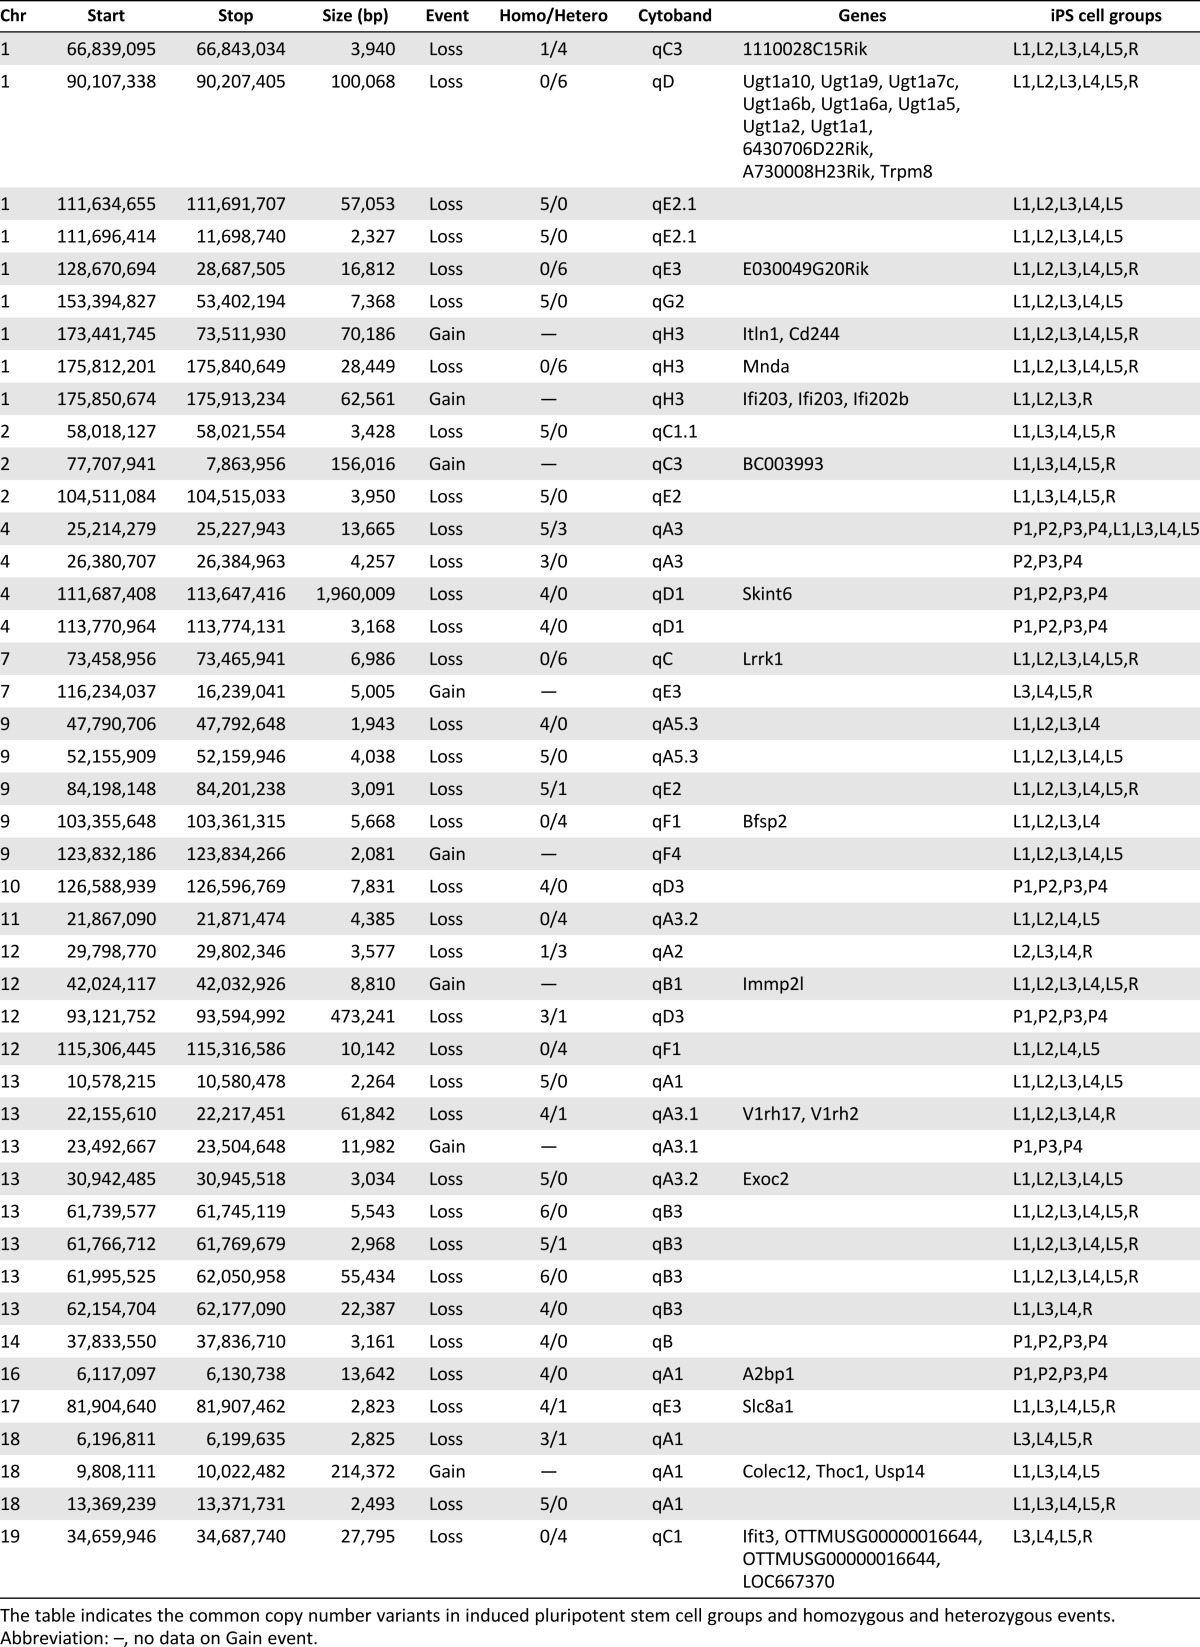
Fig. 4A shows representative unique CN losses in p-miPSC-1, lenti-miPSC-1, and retro-miPSC compared with mH. We found that 53.5% of CNVs were less than 10 kb in size (Fig. 4B), which would have been undetectable by previous studies because of a low resolution. We found 44 common CNVs in iPSC groups (>50% in p-miPSCs or viral-miPSCs) and identified 36 common CNVs (29 CN losses and 7 CN gains) in viral-miPSCs and 9 CNVs (8 CN losses and 1 CN gain) in p-miPSCs. The percentages of CN gains and CN losses involving known genes for p-miPSCs were 20% and 17%, respectively. As for viral-miPSCs, the percentages of CN gains and CN losses were 40% and 20%. Of 44 common CNVs identified in this study, only 1 CNV was conserved between p-miPSCs and lenti-miPSCs (CNV location on chromosome 4: 25,214,279-25,227,943). Table 1 also indicates homozygous and heterozygous events for CNVs according to qPCR results. Interestingly, homozygous CN losses (60%) were identified more frequently than heterozygous CN losses. Using the PANTHER gene ontology, CNVs found the viral-miPSCs had an increased bias toward genes having functions associated with cellular, metabolic, immune system process, and cell communication (Fig. 4C). We used only the biological processes ontology. As we found very small number of genic CNVs in p-miPSCs-1∼4, genic CNVs identified more than one time were used to check up the biological process ontology.
Figure 4.

Analyses of CNVs. (A): CNV changes of induced pluripotent stem cells (iPSCs) compared with mH. CNV regions detected by aCGH and validated by polymerase chain reaction for p-miPSC-1 and retro-miPSC are shown. The different colors of shading represent CNV regions. (B): The frequency and size distribution of CNVs in p-miPSCs (p-miPSC-1∼4) and viral iPSCs (lenti-miPSC-1∼5 and retro-miPSC). The x-axis represents size of CNVs, and the y-axes show number of CNVs. The number of CNVs from p-miPSCs and viral miPSCs was significantly different, as examined by Wilcoxon two-sample test; p values for the number of CNVs less than 10 kb and those less than 100 kb were 0.125 and 0.125, respectively. (C): Biological processes annotated to frequent CNVs of four p-miPSCs and six viral-miPSCs. Distribution of gene ontology terms identified by modified PANTHER for genes overlapping with CNV regions identified in p-miPSCs and viral-miPSCs. (D): Real-time PCR analysis confirmed the downregulation of Fbxo15 and Rnf12 gene expressions in retro-miPSC and p-miPSCs, respectively. Abbreviations: Chr, chromosome; CNV, copy number variant; lenti, lentiviral; mESC, mouse embryonic stem cell; mH, mouse hepatocytes; miPSC, mouse induced pluripotent stem cell; p-miPSC, protein-based mouse induced pluripotent stem cell; retro, retroviral.
Table 1.
Summary of common CNVs identified in iPSCs
In our initial attempt to correlate CNVs and gene expression, we examined those genes that are lost in p-miPSCs but not in viral-miPSCs or vice versa. We analyzed our microarray data using DNA-Chip Analyzer algorithms (dChip [27]) and identified the Fbxo15 gene and the Rnf12 gene that are most prominently downregulated in undifferentiated retro-miPSCs and p-miPSCs, respectively, which was further validated in our real-time PCR analyses (Fig. 4D; supplemental online Table 3).
Discussion
In the present study, we established an improved method for protein reprogramming by using partially purified 9R-fused reprogramming proteins after their expression in mammalian cells. Our improved reprogramming method allowed generating iPSCs from C57/BL6J mouse hepatocytes more efficiently compared with the use of whole-protein extracts [28]. To analyze and compare the genomic integrity of these protein-based miPSCs with those of retro- and lenti-miPSCs, we developed a robust and unbiased 1 M custom array CGH platform with a median probe spacing of 1,180 bases for the entire genome and 461 bases for the hot spots. Using this custom array CGH, we identified novel CNVs over the size of 1.9 kb at a resolution higher than that for any previous iPS study [7–9, 29]. Remarkably, we identified substantially increased CNV content in lenti-miPSCs and retro-miPSCs (29∼53 CNVs) compared with p-miPSCs (9∼10 CNVs), strongly suggesting that our improved protein-based reprogramming method maintains genomic integrity better than current viral reprogramming methods.
Whereas iPSCs are considered to be the most potential cell source to study and treat various human diseases, there are several important questions to be answered, such as how different iPSCs are from ESCs [2–4]. For instance, it is of great importance to understand how much genetic and/or epigenetic integrities are compromised compared with those of original tissues, compared with ESCs. Although this subject has recently been subject to extensive investigation, it remains controversial whether genomic changes (either mutation or CNV) found in iPSCs are de novo generated during the reprogramming process (reprogramming-induced changes) or originate from the parental cells (parental mosaicism-derived changes). From the karyotype analysis of numerous human embryonic stem cell (hESC) and human induced pluripotent stem cell (hiPSC) lines, Taapken et al. [11] showed that the types and frequencies of abnormal karyotypes are strikingly similar (12.9% abnormal karyotypes in 40 hESC lines; 12.5% abnormal karyotypes in 219 hiPSCs). Notably, the pattern was the same in viral and episomal iPSCs. Martins-Taylor et al. [9] also found that the frequency of CNVs is similar in hESCs and hiPSCs and showed that there are two types of CNVs: type I is shared with parental fibroblasts, and type II is only found in hiPSCs. Using exome sequencing of 22 hiPSC lines and the 9 matched fibroblasts, Gore et al. [6] found six protein-coding mutations per human iPSC line regardless of the reprogramming methods. Interestingly, Hussein et al. [7] showed that most CNVs found in early-passage iPSCs are de novo, but, at >passage 10, the number of CNVs becomes similar to those found in human ESCs and even in fibroblasts. Using the ultradeep amplicon sequencing, they showed that reprogramming process contributed 74% to the iPSC coding point mutation load, whereas 19% of the mutations pre-exist as rare mutations in the parental fibroblasts [7]. Taken together, these studies support the concept that the reprogramming process is mutagenic and generates chromosomal alterations, although pre-existing mosaicisms and prolonged in vitro passaging also contribute to genomic changes.
Notably, in contrast to findings of multiple CNVs in iPSCs [5–9], more recent whole-genome sequencing analyses indicated that there are few, if any, CNVs in mouse or human iPSCs [29, 30]. Although these differences await further investigation, it is worthwhile to note that CNV calls from sequence-based approaches have a 82% sensitivity for detecting known common deletions when a genome has been sequenced at 42× average coverage and 69% sensitivity for detecting known common deletions at a 4× average sequence coverage [31]. As library fragment lengths and read lengths span only a few hundred bases and read depths are randomly distributed even in the robust, unbiased whole-genome sequencing technology, Cheng et al. [29] agreed that accurately detecting CNVs by the current whole-genome sequencing technology remains difficult. Thus, aCGH platforms remain the gold standard for detecting unbalanced structural variants [32].
In summary, this study demonstrates, for the first time to our knowledge, that reprogramming methods significantly influence the genomic integrity of resulting iPSCs and that our improved protein-based reprogramming method maintains genomic integrity better than current viral reprogramming methods. Because we compared viral reprogramming methods with protein-based method, it is not known how other genome-nonintegrating methods (e.g., episomal and mRNA-based methods) influence the genomic integrity. In particular, it is of great interest to compare these methods with the most recent chemical reprogramming method [33]. It is to be noted that even protein-based iPSCs have acquired a number of CNVs indicating that the reprogramming process itself and/or in vitro cell culturing may contribute to the generation of CNVs. Because the present study is limited to mouse iPSCs, it remains to be tested whether these different reprogramming methods also influence the genomic integrity of human iPSCs. Furthermore, it will be critical to elucidate the functional consequences of the identified CNVs in appropriate physiological contexts (e.g., relevant differentiated cell types) before we can define clinically safe iPSCs. Taken together, we recommend comprehensive characterization (via high-resolution CNV analyses and/or whole-genome sequencing) of newly generated iPSCs and their functional analyses to ensure that only those that maintain genomic and functional integrity are subsequently used for clinical and biomedical applications.
Conclusion
Using a 1 million custom array CGH platform, we analyzed and compared CNVs from multiple iPSC lines generated by protein and viral reprogramming methods. Our data demonstrate significantly less CNVs in protein-based iPS lines than viral iPS lines, strongly suggesting that reprogramming methods influence the genomic integrity of resulting iPSCs.
Supplementary Material
Acknowledgments
This work was supported by National Institutes of Health Grants NS070577, MH087903, and HL106627 (to K.-S.K.). We are grateful to Dr. Shinya Yamanaka for the generous gift of the miPSC line 103 C-1 (retro-miPSC); all collaborators for help; and R. Govindaraju for editing early versions of this manuscript.
Author Contributions
H.P. and D.K.: conception and design, collection and/or assembly of data, manuscript writing; C.-H.K., R.E.M., M.-Y.C., R.C.I., S.K., J.-I.M., H.W.C., P.S.M.Y., J.T.D., M.-J.H., and C.Z.: collection and/or assembly of data, data analysis and interpretation; E.G.L. and J.K.J.: provision of study material; R.L.: conception and design, data analysis and interpretation; K.-S.K.: conception and design, financial support, data analysis and interpretation, manuscript writing, final approval of manuscript.
Disclosure of Potential Conflicts of Interest
R.L. has compensated employment, uncompensated intellectual property rights, and compensated stock options from Advanced Cell Technology.
References
- 1.Takahashi K, Yamanaka S. Induction of pluripotent stem cells from mouse embryonic and adult fibroblast cultures by defined factors. Cell. 2006;126:663–676. doi: 10.1016/j.cell.2006.07.024. [DOI] [PubMed] [Google Scholar]
- 2.Yamanaka S. Induced pluripotent stem cells: Past, present, and future. Cell Stem Cell. 2012;10:678–684. doi: 10.1016/j.stem.2012.05.005. [DOI] [PubMed] [Google Scholar]
- 3.Robinton DA, Daley GQ. The promise of induced pluripotent stem cells in research and therapy. Nature. 2012;481:295–305. doi: 10.1038/nature10761. [DOI] [PMC free article] [PubMed] [Google Scholar]
- 4.Hanna JH, Saha K, Jaenisch R. Pluripotency and cellular reprogramming: Facts, hypotheses, unresolved issues. Cell. 2010;143:508–525. doi: 10.1016/j.cell.2010.10.008. [DOI] [PMC free article] [PubMed] [Google Scholar]
- 5.Mayshar Y, Ben-David U, Lavon N, et al. Identification and classification of chromosomal aberrations in human induced pluripotent stem cells. Cell Stem Cell. 2010;7:521–531. doi: 10.1016/j.stem.2010.07.017. [DOI] [PubMed] [Google Scholar]
- 6.Gore A, Li Z, Fung HL, et al. Somatic coding mutations in human induced pluripotent stem cells. Nature. 2011;471:63–67. doi: 10.1038/nature09805. [DOI] [PMC free article] [PubMed] [Google Scholar]
- 7.Hussein SM, Batada NN, Vuoristo S, et al. Copy number variation and selection during reprogramming to pluripotency. Nature. 2011;471:58–62. doi: 10.1038/nature09871. [DOI] [PubMed] [Google Scholar]
- 8.Laurent LC, Ulitsky I, Slavin I, et al. Dynamic changes in the copy number of pluripotency and cell proliferation genes in human ESCs and iPSCs during reprogramming and time in culture. Cell Stem Cell. 2011;8:106–118. doi: 10.1016/j.stem.2010.12.003. [DOI] [PMC free article] [PubMed] [Google Scholar]
- 9.Martins-Taylor K, Nisler BS, Taapken SM, et al. Recurrent copy number variations in human induced pluripotent stem cells. Nat Biotechnol. 2011;29:488–491. doi: 10.1038/nbt.1890. [DOI] [PubMed] [Google Scholar]
- 10.Amps K, Andrews PW, Anyfantis G, et al. Screening ethnically diverse human embryonic stem cells identifies a chromosome 20 minimal amplicon conferring growth advantage. Nat Biotechnol. 2011;29:1132–1144. doi: 10.1038/nbt.2051. [DOI] [PMC free article] [PubMed] [Google Scholar]
- 11.Taapken SM, Nisler BS, Newton MA, et al. Karotypic abnormalities in human induced pluripotent stem cells and embryonic stem cells. Nat Biotechnol. 2011;29:313–314. doi: 10.1038/nbt.1835. [DOI] [PubMed] [Google Scholar]
- 12.Pera MF. Stem cells: The dark side of induced pluripotency. Nature. 2011;471:46–47. doi: 10.1038/471046a. [DOI] [PubMed] [Google Scholar]
- 13.Panopoulos AD, Ruiz S, Izpisua Belmonte JC. iPSCs: Induced back to controversy. Cell Stem Cell. 2011;8:347–348. doi: 10.1016/j.stem.2011.03.003. [DOI] [PubMed] [Google Scholar]
- 14.Martins-Taylor K, Xu RH. Concise review: Genomic stability of human induced pluripotent stem cells. Stem Cells. 2012;30:22–27. doi: 10.1002/stem.705. [DOI] [PubMed] [Google Scholar]
- 15.Kim D, Kim CH, Moon JI, et al. Generation of human induced pluripotent stem cells by direct delivery of reprogramming proteins. Cell Stem Cell. 2009;4:472–476. doi: 10.1016/j.stem.2009.05.005. [DOI] [PMC free article] [PubMed] [Google Scholar]
- 16.Kim JI, Ju YS, Park H, et al. A highly annotated whole-genome sequence of a Korean individual. Nature. 2009;460:1011–1015. doi: 10.1038/nature08211. [DOI] [PMC free article] [PubMed] [Google Scholar]
- 17.Cahan P, Li Y, Izumi M, et al. The impact of copy number variation on local gene expression in mouse hematopoietic stem and progenitor cells. Nat Genet. 2009;41:430–437. doi: 10.1038/ng.350. [DOI] [PMC free article] [PubMed] [Google Scholar]
- 18.Cutler G, Marshall LA, Chin N, et al. Significant gene content variation characterizes the genomes of inbred mouse strains. Genome Res. 2007;17:1743–1754. doi: 10.1101/gr.6754607. [DOI] [PMC free article] [PubMed] [Google Scholar]
- 19.Graubert TA, Cahan P, Edwin D, et al. A high-resolution map of segmental DNA copy number variation in the mouse genome. PLoS Genet. 2007;3:e3. doi: 10.1371/journal.pgen.0030003. [DOI] [PMC free article] [PubMed] [Google Scholar]
- 20.She X, Cheng Z, Zöllner S, et al. Mouse segmental duplication and copy number variation. Nat Genet. 2008;40:909–914. doi: 10.1038/ng.172. [DOI] [PMC free article] [PubMed] [Google Scholar]
- 21.Lipson D, Aumann Y, Ben-Dor A, et al. Efficient calculation of interval scores for DNA copy number data analysis. J Comput Biol. 2006;13:215–228. doi: 10.1089/cmb.2006.13.215. [DOI] [PubMed] [Google Scholar]
- 22.Zhou H, Wu S, Joo JY, et al. Generation of induced pluripotent stem cells using recombinant proteins. Cell Stem Cell. 2009;4:381–384. doi: 10.1016/j.stem.2009.04.005. [DOI] [PMC free article] [PubMed] [Google Scholar]
- 23.McCarroll SA, Hadnott TN, Perry GH, et al. Common deletion polymorphisms in the human genome. Nat Genet. 2006;38:86–92. doi: 10.1038/ng1696. [DOI] [PubMed] [Google Scholar]
- 24.Buckland PR. Polymorphically duplicated genes: Their relevance to phenotypic variation in humans. Ann Med. 2003;35:308–315. doi: 10.1080/07853890310001276. [DOI] [PubMed] [Google Scholar]
- 25.Stranger BE, Forrest MS, Dunning M, et al. Relative impact of nucleotide and copy number variation on gene expression phenotypes. Science. 2007;315:848–853. doi: 10.1126/science.1136678. [DOI] [PMC free article] [PubMed] [Google Scholar]
- 26.Aoi T, Yae K, Nakagawa M, et al. Generation of pluripotent stem cells from adult mouse liver and stomach cells. Science. 2008;321:699–702. doi: 10.1126/science.1154884. [DOI] [PubMed] [Google Scholar]
- 27.Li C, Wong WH. Model-based analysis of oligonucleotide arrays: Expression index computation and outlier detection. Proc Natl Acad Sci USA. 2001;98:31–36. doi: 10.1073/pnas.011404098. [DOI] [PMC free article] [PubMed] [Google Scholar]
- 28.Lee G, Papapetrou EP, Kim H, et al. Modelling pathogenesis and treatment of familial dysautonomia using patient-specific iPSCs. Nature. 2009;461:402–406. doi: 10.1038/nature08320. [DOI] [PMC free article] [PubMed] [Google Scholar]
- 29.Cheng L, Hansen NF, Zhao L, et al. Low incidence of DNA sequence variation in human induced pluripotent stem cells generated by nonintegrating plasmid expression. Cell Stem Cell. 2012;10:337–344. doi: 10.1016/j.stem.2012.01.005. [DOI] [PMC free article] [PubMed] [Google Scholar]
- 30.Quinlan AR, Boland MJ, Leibowitz ML, et al. Genome sequencing of mouse induced pluripotent stem cells reveals retroelement stability and infrequent DNA rearrangement during reprogramming. Cell Stem Cell. 2011;9:366–373. doi: 10.1016/j.stem.2011.07.018. [DOI] [PMC free article] [PubMed] [Google Scholar]
- 31.Mills RE, Walter K, Stewart C, et al. Mapping copy number variation by population-scale genome sequencing. Nature. 2011;470:59–65. doi: 10.1038/nature09708. [DOI] [PMC free article] [PubMed] [Google Scholar]
- 32.Conrad DF, Pinto D, Redon R, et al. Origins and functional impact of copy number variation in the human genome. Nature. 2010;464:704–712. doi: 10.1038/nature08516. [DOI] [PMC free article] [PubMed] [Google Scholar]
- 33.Hou P, Li Y, Zhang X, et al. Pluripotent stem cells induced from mouse somatic cells by small-molecule compounds. Science. 2013;341:651–654. doi: 10.1126/science.1239278. [DOI] [PubMed] [Google Scholar]
Associated Data
This section collects any data citations, data availability statements, or supplementary materials included in this article.