

Abstract
Purpose
To investigate a model of language development for nonverbal preschool age children learning to communicate with AAC.
Method
Ninety-three preschool children with intellectual disabilities were assessed at Time 1, and 82 of these children were assessed one year later at Time 2. The outcome variable was the number of different words the children produced (with speech, sign or SGD). Children’s intrinsic predictor for language was modeled as a latent variable consisting of cognitive development, comprehension, play, and nonverbal communication complexity. Adult input at school and home, and amount of AAC instruction were proposed mediators of vocabulary acquisition.
Results
A confirmatory factor analysis revealed that measures converged as a coherent construct and an SEM model indicated that the intrinsic child predictor construct predicted different words children produced. The amount of input received at home but not at school was a significant mediator.
Conclusions
Our hypothesized model accurately reflected a latent construct of Intrinsic Symbolic Factor (ISF). Children who evidenced higher initial levels of ISF and more adult input at home produced more words one year later. Findings support the need to assess multiple child variables, and suggest interventions directed to the indicators of ISF and input.
Approximately 51, 046 children between the ages of 4–6 in the United States are learning to communicate with augmentative or alternative forms of communication (AAC) based on data from the U.S. Department of Education (2011) and Binger and Light (2006). AAC is typically prescribed when children are struggling with learning to communicate with speech, or if they are at risk for having delayed speech development due to a diagnosed condition such as Down syndrome or autism. AAC is becoming more accepted and common for very young children as previous misconceptions about AAC have been addressed (Cress & Marvin, 2003). However, little is known about what contributes to successful outcomes for these children. Many children learn to use AAC for brief periods of time and then transition into speech communication. Other children continue to rely on AAC as their primary form of communication. Whether in speech or AAC, productive vocabulary acquisition varies considerably. The research described in this paper is aimed at describing a set of variables that predict the outcome of vocabulary acquisition.
Three research questions were addressed. The first was whether a set of variables identified a priori in accordance with a model of early symbolic development would co-vary and converge on a latent construct we refer to as Intrinsic Symbolic Factor (ISF). Our second question was whether this construct would significantly predict symbolic communication outcomes. Our third question was whether the effects of this construct were mediated by social environmental variables for children in the beginning stages of learning to communicate. These questions were addressed by first evaluating the psychometric properties of the construct and then investigating how well the construct predicted vocabulary outcomes and whether or not the effects were mediated by input and instruction, using a structural equation model.
Model of Early Symbolic Development
We began with an a priori model of multiple intrinsic child and environmental variables proposed to predict communication outcomes for children learning AAC. The theoretical basis of the proposed model most closely aligns with an emergentist view (Poll, 2011). According to the emergentist theory of language learning, language is a product of the interaction of intrinsic capabilities of the child and the outside language environment. Although often applied to grammatical learning, emergentist theories have also been used to explain early symbol development (Bates, et al., 1979; Bates & Dick, 2002). According to an emergentist view, both intrinsic child variables and specific characteristics of social interaction, including language input, are critical for language learning. Our focus is on early symbol use which, according to this theory, emerges from presymbolic communication in social contexts (Bates et al., 1979; Brady, Marquis, Fleming, & McLean, 2004; Iverson & Thal, 1998). However, not all children progress in symbol learning at similar rates and many are significantly impaired in learning to communicate with symbols. We propose that a latent construct, ISF, reflects children’s intrinsic predisposition for learning to communicate with symbols. The variables selected for this model include traditional predictors of early language growth such as receptive language, but also measures that do not rely on speech, such as play. Non-speech related indicators were selected because we are modeling early symbol development that is not exclusively reliant on speech. Each variable in the model is described below, along with a rationale for its selection.
In addition to demonstrating the importance of each individual variable for predicting language outcomes, we investigated how well a group of variables converged on a single latent construct we refer to as ISF. This construct is theoretical but indicated by a set of real measures. In order to address our first research question, we investigated the contributions of different variables of child language predictors using a latent construct model. In a latent construct model, a complex construct is measured through multiple manifest indicators (Graham, Collins, Wugalter, Chung, & Hansen, 1991). For example, Bornstein and Haynes (1998) investigated the extent to which various assessments, observations of child speech, and maternal reports all converged on a construct they referred to as vocabulary competence. This construct was then investigated as a predictor of vocabulary outcome measured 2 years later. In a study of children with autism, Harrison and Smith (2012) used a latent modeling approach to measure the construct of autism severity, indicated by communication, social, and stereotyped behavior and restricted interests scores from two different autism measures. The authors then determined how the construct of autism severity predicted child well-being.
There are several advantages to a latent variable approach to modeling outcomes. A latent variable approach links observable data to theoretical constructs of interest. In terms of measurement theory, condensing multiple measures into an aggregate reduces dimensionality of the data (Bartholomew, Knott & Moustaki, 2011). Analyzing the relationships between latent constructs is superior to analyzing relationships between individual indicators because measurement error is removed when the latent constructs are estimated. Consequently, the relationships between latent constructs provide better estimates of the true scores of each construct and therefore more accurate estimation of the causal relations over time. In addition, a multi-method approach increases assessment validity by reducing reliance on a single measure (Bornstein & Haynes, 1998). A convergent approach such as latent construct analysis allows one to evaluate an individual child’s inferred predisposition for learning that is not dependent on just one testing procedure. This approach is particularly helpful for children with intellectual disabilities (ID) who may show uneven profiles due to preferences or behavioral limitations. In the next section we will describe the components of ISF and introduce the social interaction and instructional variables included in our model of communication development.
Indicators of Intrinsic Symbolic Factor (ISF)
ISF is proposed as a latent construct with multiple indicators. The specific variables identified as potential indicators of ISF were drawn from past research on predictors of early communication development in both typically developing children and children with IDs (e.g., Maatta, Laakso, Tolvanen, Ahonen, & Aro, 2012; McCathren, Warren, & Yoder, 1996; Watt, Wetherby, & Shumway, 2006). Importantly for the current investigation, we wanted to include indicators that did not rely on speech production. In essence, our aim was to measure the intrinsic resources a child brings to learning symbolic relationships between referents and symbols such as visual images, signs or spoken words. Indicators were selected from the domains of nonverbal cognitive development, language comprehension, complexity of pre-symbolic communication (e.g., gesture use), and play. Assessment of children with IDs is often difficult and standardized tests alone seldom provide sufficient information. Therefore we have used both standardized and nonstandardized measures where appropriate. Further discussion for the rationale for each indicator and its measure is provided in the following paragraphs.
Nonverbal cognitive development
Cognitive development refers to development of skills or abilities that contribute to a child’s aptitude for learning in general. Measures such as IQ or other age-referenced composite scores are derived by averaging results from subtests such as visual perception or processing, auditory perception or processing, attention, memory, sequencing, fine motor skills and language. For the present study, we focused on nonverbal measures of cognitive development because (1) all participating children were identified as having severely limited verbal productions, (2) verbal language is one of our outcome measures, and (3) nonverbal cognitive levels have been found to predict later language outcomes in children with IDs and in children with autism (Brady, Steeples, & Fleming, 2005; Thurm, Lord, Lee, & Newschaffer, 2007). The visual reception subtest from the Mullen Scales of Early Learning (MSEL) (Mullen, 1995) is particularly relevant to symbol learning for children who are candidates for AAC because most AAC systems rely on visual reception and discrimination. The fine motor subtest provides a measure of visual-motor planning and control that is also relevant to symbol use. These subtests from the MSEL have been used in past studies to measure nonverbal cognitive development in children with IDs (Philofsky, Hepburn, Hayes, Hagerman, & Rogers, 2004; Wetherby et al., 2007).
Language comprehension
Language comprehension is often cited as an early predictor of later word production in typically developing children (Bates, O’Connell, & Shore, 1987) and in children with disabilities (Chapman, Seung, Schwartz, & Bird, 2000; Sevcik & Romski, 1997). Although many measures of language comprehension in children less than 2 years of age rely on parent report, findings by Watt and colleagues indicate that direct behavioral measures of comprehension can also be robust predictors of later expressive language (Watt, et al.,, 2006). Early language comprehension abilities indicate an understanding that things have names and this insight appears critical to symbolic understanding.
Comprehension of both verbal and nonverbal aspects of language is a core deficit for children with autism (Prizant, Wetherby & Rydell, 2000) and Down syndrome (Chapman, 2003). The importance of comprehension for predicting expressive language development appears to vary by the child’s stage of development. For example, Vandereet and colleagues (Vandereet, Maes, Lembrechts, & Zink, 2010) found that vocabulary comprehension was the only unique predictor of initial expressive vocabulary for a group of 36 children with ID. However, children in the Vandereet et al. study had expressive vocabulary averages of 67 words at the start of their study. For young prelinguistic children (expressive vocabularies less than 20 words), findings have demonstrated that receptive vocabulary was not exclusively predictive of expressive vocabulary in typically developing children (Laakso, Poikeus, Eklund, & Lyytinen, 1999) or in children with developmental disabilities (McCathren, Yoder, & Warren, 1998).
Despite conflicting findings in past research, it is worthwhile to continue investigating the role of language comprehension, particularly for children learning AAC. Sevcik and Romski (2002) describe the different learning processes for individuals learning to use AAC who have good speech comprehension skills vs. those who have poor comprehension. Their research centered on children learning to use symbols paired with speech generating devices (SGDs) (Romski, et al., 2010). Communication via SGD involves selection of a symbol that produces a synthesized or digitized spoken utterance. Individuals who are skilled in comprehending speech may use their knowledge about the relationship between words and the referents in their environment to help learn AAC selection responses.
Communication Complexity
We also wanted a measure to reflect how the child communicated with gestures, vocalizations, words and symbols in social communicative contexts, and for this we relied upon a measure developed by our research team called the Communication Complexity Scale (CCS). We use the term communication complexity to refer to the development of communication that typically occurs before linguistic communication. Prior to speech, children communicate with a variety of gestures and vocalizations and these presymbolic communication acts are thought to pave the way for later symbolic communication (Butterworth, 2003; Tomasello, 2003). Research from typically developing children (Carpenter, Nagell, & Tomasello, 1998; Crais, Day Douglas, & Cox Campbell, 2004) as well as children with disabilities (Brady et al., 2011; Brady, et al., 2004) suggests that the progression in prelinguistic communication is related to the onset of symbolic communication. For example, children who point earlier, tend to also speak earlier (Brooks & Meltzoff, 2008).
Advancements in forms (specifically gesture types), functions, and rates of prelinguistic communication can be observed in changes in the use of communicative gestures and vocalizations, and in the coordinated use of these behaviors with communicative partners (Adamson & Chance, 1998; Legerstee & Fisher, 2008). The CCS was developed for and used in this study to measure these prelinguistic communication behaviors.
Play levels
Play has been related to language development both in typical populations (Eisert & Lamorey, 1996; McCune-Nicolich & Carroll, 1981) and in children with disabilities (Kasari, Freeman, & Paparella, 2001; Landa, Holman, & Garrett-Mayer, 2007). Children’s play may provide insight into underlying symbolic understanding that might not be obvious through other cognitive and language assessments. In typical development, symbolic or pretend play and language occur at around the same time. Researchers have argued that this co-occurrence is because both symbolic play and language are manifestations of the same underlying representational ability (Piaget, 1962; Werner & Kaplan, 1984). McCathren et al. (1998) reported that children’s level of representational play was significantly related to later expressive language. Similarly, Laakso et al. (1999) found that children’s scores on the Symbolic Play Test (Lowe & Costello, 1976) at 14 months of age significantly predicted language comprehension at 18 months of age in typically developing children. Similar findings have been reported for children with Down syndrome (Cunningham, Glenn, Wilkinson, & Sloper, 1985), and children with autism (Stone, Lemanek, Fishel, Fernandez, & Altemeier, 1990; Thiemann-Bourque, Brady & Fleming, 2011). Based on research indicating the importance of play as an index of child communication development, we adapted a play measure from research with children with ID to yield the play indicator for our construct. This play measure is described in the Methods section.
Social Interaction Variables
Consistent with emergentist theories of language acquisition, we hypothesize that certain elements of the social interactions that surround communication contribute directly to child outcomes and significantly mediate contributions by the child’s intrinsic abilities. Specifically, communication input by adults is proposed to significantly impact communication development (MacWhinney, 2004)
Communication input
The amount of communication directed to a child in everyday interactions directly relates to the child’s communication and language attainments (Hart & Risley, 1995; Landry, Smith, Swank, & Guttentag, 2008). One of the key themes of emergentist views of language is that language learning depends heavily on the amount and quality of language input (Poll, 2011). Emergentist research on grammar suggests that both the overall volume of language input as well as exposure to particular grammatical forms relates to improved learning outcomes. Input is recognized as an important variable for vocabulary learning too. Children who experience more language input during their early years have significantly better vocabulary outcomes than children with less input (Huttenlocher, Haight, Bryk, Seltzer, & Lyons, 1991). Hoff (2003) reported that differences in maternal mean length of utterance (mlu) and word types and tokens spoken to their 2-year old children were associated with differences in the children’s number of different words produced. Children’s language comprehension is also improved through greater input, hence input may facilitate word learning by increasing comprehension for a referent word that is being represented by one or more different symbol types (Brady, 2000; Romski & Sevcik, 1993)
Input involving different communication modes has been explored for children with IDs. Many children with IDs use modes other than speech to communicate. Input to these children is typically speech; although some advocate using other modes in addition to speech. For example, in a review of 33 studies involving a total of 216 children with various disabilities, Dunst and colleagues (Dunst, Meter & Hambri, 2011) reported that simultaneous input that combined speech with sign language had positive effects on child oral language output (average effect size was .72 for group studies and 1.48 for single subject studies). The review focused on intervention studies, however, and did not examine the effect of different amounts of input. For children learning to use graphic forms of AAC including SGDs, various interventions have been developed that rely on providing augmented input (e.g., Harris & Reichle, 2004; Romski et. al, 2010). Under these approaches, communicative partners are taught to speak while touching symbols on the child’s communication device. For example, the partner might say, “It’s sunny outside” while pointing to the symbol for sunny. Strategies that provide augmented input (either sign or symbol) are designed to emulate natural language learning opportunities and capitalize on learner’s abilities to associate speech, referent and symbol.
Although most studies of input effects have measured input by parents, a few studies have also considered input from teachers and other school personnel. Brady, Herynk and Fleming (2010) reported that input at pre-schools was relatively sparse, but there was a wide range of variability in teacher initiations to children with IDs (mean initiation rate of 1.62 per minute; standard deviation = .56). Children who experienced more input from teachers also communicated more during these observations. Similar findings were reported by Rowland in classrooms serving children with multiple disabilities (Rowland, 1990). Hadley and Rice (1991) reported less teacher input to children with more severe language impairments compared to more language-able children.
Amount of Instruction
In addition to interventions aimed at increasing partner input and facilitation, direct AAC intervention with a child is a likely source of variability in children’s language outcomes. For example, based on lengthy video tape analyses of teachers in classrooms, Connor and colleagues found that the amounts of particular instructional activities was associated with literacy outcomes in preschool children (Connor, Morrison, & Slominski, 2006). Although it may seem intuitive to ask how the amount of instruction within AAC instructional activities leads to positive changes in communication, the amount of AAC instruction as a variable or outcome measure has yet to be documented. Given the significant variability of instructional contexts, types of systems being used, and treatment dosage inherent across different preschool classrooms and populations, defining and clearly measuring this variable is difficult. For example, most preschool programs embed teaching opportunities throughout the day which is beneficial for the children, but creates difficulty for measuring instruction time. An estimate of amount of AAC instruction time based on teacher report is one method to determine if this variable has a potential effect on language outcome.
To summarize, in the current study we first determined if the set of variables proposed as indicators of ISF (nonverbal cognition, language comprehension, communication complexity and play) did in fact significantly contribute to this latent construct. Second, we determined if this construct predicted child language outcomes 1 year later and third, we evaluated if language input and instruction time interacted with ISF to effect language outcome.
Method
The research reported in this study was approved by the Human Subjects Committee, the Internal Review Board of the University of Kansas.
Participants
Ninety-three children participated in this study. Seventy-three of the children were boys. Two observation points, one year apart, were measured in this study. Eighty-two of the children were observed at the second data point. The mean chronological age at the first observation was 50.3 months. All of the children had composite scores on the Mullen Scales of Early Learning (MSEL) (Mullen, 1995) that were at least two standard deviations below the norm for their age. The range in standard scores was 48–58 based on a normative mean of 100. Many children had a specific diagnosis such as autism spectrum disorders (ASD) (n = 44) or Down syndrome (n = 15). The remaining children either had a relatively rare disorder, such as Opitztrigenocephaly, or didn’t have a diagnosis specifically associated with their intellectual and language disability. Table 1 presents descriptive information for the participants, including age equivalent test score information. The information is broken down according to prominent diagnostic groups (autism, Down syndrome, other), purely for descriptive purposes. These groups were not compared or contrasted in our analyses.
Table 1.
Descriptive Statistics of Participant Demographics, Medians (and ranges) of Cognitive and Language Assessments at Time 1 for Participants with Autism Spectrum Disorders, Down Syndrome and All Other Diagnoses
| ASD (N=45) | Down Syndrome (N=15) | Other (N=33) | |
|---|---|---|---|
| Age in Months (Range) | 50 (37 – 71) | 52 (36–68) | 46 (37–66) |
| Percent Male | 87% | 60% | 76% |
| MSELa Age Equivalents | |||
| Receptive language | 13 (2–34) | 23 (11–34) | 18 (5–34) |
| Expressive language | 14 (5–24) | 16 (10–21) | 12 (0–26) |
| Visual reception | 20 (1–29) | 23 (8–31) | 19 (0–37) |
| Fine motor | 21 (11–33) | 22 (10–34) | 18 (2–34) |
| PLS-4b Age Equivalents | |||
| Auditory comprehension | 15 (10–28) | 21 (10–33) | 18 (7–45) |
| Expressive communication | 20 (11–27) | 20 (13–27) | 17 (7–25) |
| Total Age Equivalent | 17 (10–27) | 18 (16–30) | 18 (7–30) |
MSEL is the Mullen Scales of Early Learning,
PLS 4 is the Preschool Language Scale – 4th edition.
Children were recruited by contacting school districts in and near to the Kansas City metropolitan area, Topeka and Wichita, Kansas. Teachers and SLPs were asked to nominate any children meeting the criteria outlined below. Once nominated, parents were contacted to gain informed consent and complete the screening and assessment process. At intake, each participant met the following criteria, verified through either teacher report or direct observation: (a) chronological age between 3–5 years; (b) enrolled in a preschool program; (c) vision reported as 20/80 or better in at least one eye (with or without correction); (d) hearing reported as 25 dB HL or better in at least one ear (with or without amplification); (e) upper body motor skills sufficient to directly select symbols with fingers, hands, or arms; (f) English as the primary language spoken at home; (g) current teaching plans that included AAC (graphic symbols, sign language, and/or an SGD) and (h) vocabularies of less than 20 different words said, signed or selected. For this last criterion, parents and teachers were asked to list words produced spontaneously (without prompting), intentionally (directed to another person) and intelligibly. If there were inconsistent reports between teachers and parents for individual children, we moved forward with the first visits and would screen based on further discussions and observations of the child at school and home. Any children who we observed to produce more than 20 different words during our initial observations at school and home were not included in the study.
Table 2 presents the types of AAC used by participants at the first observation, according to teacher report. These types of AAC were selected by teachers from a list of options, and teachers were asked to record all types of AAC in use for a given child. Many children were being taught to use multiple forms (e.g., sign plus a graphic form of AAC). However, teachers also frequently reported that they were “trying out different systems” for a particular child, which is common, particularly for this age group. Many of the children added or changed systems over the course of this study (hence analyses related to specific types of AAC were not possible).
Table 2.
Percentages (and Numbers) of Participants Reported to Use a Particular Type of AAC at First Observation
| ASD (N=45) | Down Syndrome (N=15) | Other (N=33) | |
|---|---|---|---|
| AAC Systems Used | |||
| PECSa only | 56% (25) | 27% (4) | 21% (7) |
| Sign only | 0 | 13% (2) | 6% (2) |
| SGD only | 2% (1) | 0 | 30% (10) |
| PECS and Sign | 18% (8) | 40% (6) | 24% (8) |
| PECS and SGD | 20% (9) | 7% (1) | 3% (1) |
| Sign and SGD | 4% (2) | 7% (1) | 6% (2) |
| PECS, Sign, & SGD | 0 | 7% (1) | 9% (3) |
(PECS) is the Picture Exchange Communication System.
In order to estimate socio-economic status (SES), families were asked to indicate the highest level of maternal education. Seventy eight families responded to this question and of these, 15 had graduate degrees; 22 had 4 year college degrees; 17 had 2 years of college; 22 had high school or equivalent and 2 had less than a high school education. The mean income level was between $50,000.00 – 59,000.00 with a range of less than $9,999.00 to over $100,000.00. In terms of ethnic diversity, 60 children were white, 16 were African American (not Hispanic), 6 were Hispanic, 3 were Asian, 4 were another race (‘other’), and 4 were multi-racial.
Procedures
Once children were recruited and informed consent obtained, staff contacted parents and school staff to schedule the following assessments, which were completed at home: the Mullen Scales of Early Learning (MSEL) (Mullen, 1995), the Preschool Language Scale-4 (PLS-4) (Zimmerman, Steiner, & Evatt Pond, 2003), and a structured play assessment. Each of these assessments is described below. During the home visit, research staff also collected demographic and background history information. Once a child was enrolled in the study, additional observations of the child communicating in their classroom and home environments were made at the time of enrollment and again approximately one year later. To be exact, the mean time between first and second observations was 13.4 months and the range was 10.4 to 17.6 months. Adult input was obtained from videotaped observations collected at home and school at Time 1. Children’s number of different words produced—our outcome variable- was obtained in two different settings at Time 2: (1) home observation, and (2) a scripted communication sample. Each of these contexts is described below.
Time 1 Predictor Measures
Procedures for obtaining the measures that were proposed as indicators of ISF are described below.
Standardized assessments
Two standardized assessments were administered at Time 1. Research assistants were taught to administer these tests to standard criteria and periodic fidelity rechecks were performed by the second author to ensure accurate administration. The MSEL is an assessment of early learning designed for children from birth to 6 years of age. It consists of multiple scales, including receptive and expressive language. The visual reception and fine motor subscales from the MSEL were used as the measure of nonverbal learning. We computed the average of the raw scores from these subscales to yield an estimate of nonverbal cognitive skills.
The Auditory Comprehension subtest of the PLS-4 was administered to obtain a measure of receptive language. In terms of early language testing, the PLS-4 has some advantages compared to the MSEL, in that it includes more items that test earlier developmental skills. We used raw scores for the PLS-4 in our analyses because most of our participants scored at the lowest level possible, leading to low variability across participants. The means and ranges of scores from these tests are presented in Table 1.
Play assessment
Children’s play was assessed for a total of 15 minutes during unstructured and semi-structured activities with a research assistant as the examiner. Five different sets of toys were used. The examiner modeled one symbolic play act, and then the child played with each set of toys for 3 minutes. Examiners were trained to only imitate the child’s play actions, and not introduce any new play actions on the toys, and to limit use of language facilitating strategies. Play skills were coded using an online play coder program (adapted from Tapp & Yoder, 2001) that contained 11 of 15 categories from the Developmental Play Assessment (DPA) Instrument (Lifter, Sulzer-Azaroff, Anderson, & Cowdery, 1993). A complete definitions for each play behavior coded is provided in Thieman-Bourque, et al., (2010). To summarize, the 11 categories comprised four Play Levels: Level 1 - Indiscriminate Actions, Level 2: Functional Play/Object Use, Level 3: Functional Combinatorial, and Level 4: Symbolic Play. For the purposes of this paper, play analyses did not include indiscriminate actions on objects (i.e., mouthing, shaking, banging, and inspecting) as these acts were considered undifferentiated play. Each child received a weighted score by assigning a score of 1, 2, or 3 to each play act - 1 point for any Level 2 act, 2 points for any Level 3 act, and 3 points for any Level 4 act. A weighted play score was calculated for each child by totaling these points across the five, 3-min play sets. The means and standard deviations for the weighted play scores are presented in Table 3.
Table 3.
Means and Standard Deviations of Variables used in Confirmatory Factor Analysis (First Four Variables) and in the Structural Equation Model
| Variable | Mean | SD |
|---|---|---|
| Complexity of Communication | 8.85 | 1.41 |
| PLS-4a Language Comprehension | 22.91 | 5.47 |
| Weighted Total Play | 33.09 | 20.10 |
| MSELb Nonverbal Composite Raw | 41.70 | 12.04 |
| Ratec of Adult Input Home Time 1c | 4.09 | 1.49 |
| Amount of AAC Instructiond | 3.13 | 1.07 |
| Rate of Different Words Home Time2 | 1.30 | 1.40 |
| Rate of Different Words Scripted (Assessment at Time 2) | .71 | 1.08 |
PLS-4 is the Preschool Language Scale.
MSEL is the Mullen Scales of Early Learning.
Rates are # per minute.
Amount of instruction is based on a scale of 1–5.
Two research assistants independently coded 33% randomly selected play assessments and Intraclass Correlation Coefficients (ICCs) were calculated for reliability. The ICC for the overall weighted play score was quite high at .99. The ICCs for the individual play types that are combined to form the weighted play score were also high ranging from .87 for Takes Apart Combinations to .99 for Child as Agent and Specific Combinations.
Scripted communication sample – Communication Complexity Scale
A scripted set of activities was provided to each child in order to obtain a sample of communication that would be in a similar context across all participants. The scripted communication sample was administered by one of our trained research assistants in a quiet location at the child’s school. A series of 12 age-appropriate play opportunities, 6 to request and 6 to comment, were presented by a trained RA to each child. For example, playing with a wind-up toy (one broken, one working to elicit a request) and looking through books with disfigured pages (to elicit a comment). These opportunities were similar to what other assessments refer to as “temptations” (Eadie et al., 2010; Wetherby & Prizant, 2003) in that opportunities to play with an item are provided and the experimenter takes turns interacting with the child and the materials. Next the experimenter waits for the child to request continuation of the activity (in behavior regulation tasks) or introduces a surprising element (joint attention) and waits for the child to respond. Similar strategies have been used by numerous research teams and interventionists to assess intentional communication acts (e.g., Brady, Steeples, & Fleming, 2005; Kasari, Paparella, Freeman, & Jahromi, 2008). All samples were videotaped and coded at a later time using the Noldus Observer XT software (see description below).
The scripted assessment was designed to assess presymbolic and early symbolic communication. All tasks could be responded to with gestures and vocalizations but in order to also allow for children to use symbols, we provided graphic symbols representing one toy in each activity along with general symbols for “help” and “look.” The RA demonstrated the availability of the toy symbol by holding the symbol next to the referent toy and saying “this (reference to the symbol) means this (reference to the toy)” prior to each activity. Research staff also encouraged the use of existing AAC systems. For example, children who used PECS brought their personal symbol array to the testing. Children who were learning to use an SGD had the device available during the assessment; however, advanced programming of specific vocabulary was not possible due to time constraints. The RAs were familiar with frequently used signs and responded appropriately if a child produced a recognized sign during the scripted communication assessment.
The scripted communication sample was the context for scoring the Communication Complexity Scale (CCS). The CCS is an 11 point scale developed by the research team to describe a participant’s level of prelinguistic and symbolic communication development (Brady, et al., 2011). All potentially communicative behaviors (PCBs) are recorded from the videotapes and the PCBs that occur in response to the scripted opportunity are assigned a score based on the 11 point scale. Increasing scores reflect more complex prelinguistic and early linguistic communication. The entire scale for the CCS is presented in Appendix B. To score the CCS, a research assistant viewed participants’ responses to each of the 12 communication opportunities and determined the highest level response for that opportunity. We treated the scale as a continuous, ordinal measure and computed mean scores, standard deviations, and correlations from scores we obtained (Iacobucci, 2012). The average of the three opportunities (temptations) with highest scores was used as each participant’s CCS score in our analyses.
Social Interaction Variables
Procedures used to obtain data for social interaction variables are described below.
Classroom observations
Each participant was observed in their classroom over two, one-hour visits scheduled on different days. Our goal was to observe a total of 120 minutes for each child over two different days at Time 1 and again 12 months later at Time 2. The mean number of minutes of actual observation at Time 1 was 127 minutes, with a range of 108 – 155 minutes, and at Time 2 the mean duration was 125.9, with a range of 60 – 180 min. The first and second hours of observation were intentionally scheduled during different periods of the preschooler’s day. This insured the broadest sample of activities and interactions across the day. Our goal was to capture a typical day in each child’s preschool environment. The activities during the observed time were not planned or adapted to our visit in any way. Thus, it can be said that the sample of communicative behavior was random and represents a broad range of activities. Several different activities were observed over the course of an observation period for one child (e.g., small group, snack, free play, and recess). However, because each classroom was different, the activities observed also differed across school sites. The average class size for each child was 8 children and 3 staff.
On a typical school visit, one or two trained research assistants entered the child’s classroom to code adult-child communication interactions with handheld PDAs. Each hand-held PDA was equipped with the software package Pocket Observer by Noldus™. Adult and child communication behaviors were recorded by tapping the screen with a stylus. The observers positioned themselves within an audible and visible distance from the child, but remained unobtrusive. Coding was paused for bathroom breaks, or if the communication was inaudible due to the classroom noise level or invisible due to positioning. Also, coding was paused or stopped if the activity prevented observation of typical communication opportunities, such as playing a movie, nap time, illness, or extended disruptive behavior.
For our analyses, we used the number of adult communication acts recorded during this classroom observation as an indicator of communication input. Adult communication was coded whenever an educator directed communication to the target child. We excluded adult communication directed to a group of children unless it could be determined by the educators’ speech or gestures that the communication was specifically intended for the focus child. Frequencies were converted to rates/minute for total communication acts to account for differences in times. Although the types of adult communication (speech, sign, symbol, etc.) were recorded, for the purpose of our analyses all types were combined into a total adult input variable. Child communication acts (e.g., initiations, responses) were also recorded during the classroom observations, however they were not included in the current analyses.
Instruction time
Although comprehensive measures of the amount of instruction children received were not obtained for this study, we were able to estimate variability in the amount of AAC instruction. In an effort to describe variations in AAC instruction time, the RA asked the primary educator the following question during the Time 1 visit: “During a typical school week, how often does this child receive direct AAC intervention?” The RA filled in the teacher report on a form categorizing hours of instruction per week (i.e., 1 = Never, 2 = Less than 30-minutes/week; 3 = 30 minutes/week or more, but less than 60-minutes/week; 4 = 60 minutes/week or more, but less than 90-minutes/week; or 5 = 90-minutes/week or more). We explained that they should consider any AAC instruction provided throughout the day not just instruction that was given during specified therapy sessions. However, we asked them to exclude group activities such as circle time that could include some AAC, but that was not directed specifically to the target child. AAC instruction survey data was collected for 93 (or 100%) of the participants at Time 1. The mean teacher report score of 3.13 was closest to the category of 30 minutes/week or more, but less than 60 minutes per week.
Home observations
Each participant was also observed interacting with an identified primary caregiver in his or her home for one hour at Time 1 and at Time 2. For 83 of the families, the primary caregiver was the mother. For 5 families, the identified caregiver was the father, and for an additional 5 families, the primary caregiver was a grandparent. The identified caregiver remained consistent for both Times 1 and 2. The home observations were videotaped by research staff and coded at a later time using the Noldus Observer XT software.
Our goal (that was also expressed to parents) was to measure parent-child interactions during typical activities at home such as meal or snack time, play time, or regular routines (e.g., getting dressed for school or being read to at night if preparing for bed). Whenever possible, RAs scheduled home observations when the primary caregiver would be alone with his or her child. Parents were instructed to stay in the same room as his or her child and to leave the television off or turned down. The RAs provided a bin of toys during each visit, and informed parents that playing with them was optional. Parents were encouraged to go about their typical, daily routines (outside of watching television). These were the only instructions provided and parents were free to engage in activities that may not be conducive to interaction, such as video games, if they chose to. Anecdotally, our research assistants reported that solitary activities such as video games rarely occurred during our home observations. Similar strategies have been used to record vocabulary input and output in natural contexts (Hart & Risley, 1995; Huttenlocher, Haight, Bryk, Seltzer, & Lyons, 1991). For our study, the amount of caregiver input to children was measured, using the definitions and conventions described above.
Child Outcome Variables
The primary outcomes for the current analyses were the number of different words (said, signed or selected on a device) produced by children at Time 2. Because of our criteria for participants entering the study, there was little variability in Time 1 word production (mean rate of different words at time 1 was .20/min.; standard deviation .32/min.), hence only differences at Time 2 were analyzed. We were able to obtain the number of different words within the home and scripted communication contexts because we videotaped and transcribed in these contexts. It was not possible to videotape during classroom observations due to privacy concerns and we were not confident in our ability to reliably transcribe words during live observations. The entire scripted communication sample and approximately one hour of parent-child observation was video recorded. The middle 20 minutes of the home observations were later coded and transcribed. These middle 20 minutes were selected because this allowed the caregiver and child the opportunity to get familiar with the research staff and camera in the home (i.e., a warm up period), and coding was finished before the family became fatigued.
Transcription
All child utterances containing words said or signed or produced with an SGD were transcribed during the video coding process using Noldus software. These transcribed utterances were later analyzed using the Systematic Analysis of Language Transcripts (SALT) (Miller & Chapman, 1985). The number of different (unique) words was derived from the SALT analyses of these transcripts. All utterances were considered, including those with unintelligible words, as long as at least one word could be transcribed (see below). The number of different words was converted to rates of different words per minute before completing the structural equation analyses described below.
Transcribers (trained research assistants) were instructed to listen to an utterance no more than three times before transcribing it. If the transcriber could not identify any specific words after watching the video segment three times, the utterance was coded as a vocalization rather than a verbalization. If an utterance contained both intelligible and unintelligible words, intelligible words were transcribed and an X was used to denote an unintelligible word. For example, an utterance may have been transcribed as “I want X.” with X denoting the unintelligible word.
Spoken words were transcribed if they met the utterance met the following criteria: a) the utterance contained one vowel, b) the utterance contained one or more consonants matching the consonant placement in the target word; or a developmentally appropriate substitute (e.g.,, if the child said “tum” for “thumb” this would be transcribed as thumb, c) close approximations of words needed non-linguistic support such as child attention to the referent object, person, or event or repeated use across multiple utterances, and d) the word was not a direct imitation of the adult’s immediately preceding word. If a child repeated part of an adult phrase, additional evidence of communicative intent was required. For example, if the adult said “Do you want more track?” and the child said “more track” while reaching for the track, this utterance was transcribed and coded as two words.
Similarly, signs were coded if they were acceptable approximations of American Sign Language (ASL) Signs. Transcribers were allowed to look up signs in an ASL dictionary if necessary in order to determine if the child’s production matched at least 2 of the following parameters: hand shape, movement, location and orientation. If a child both spoke and signed the same word simultaneously, the word would be transcribed once. Words that were both said and signed were only counted as one unique word for determining the number of different words.
SGD productions were recorded when the child independently selected a symbol on the device, resulting in audible speech from the device. Only if the child’s selection did not have sufficient pressure to produce speech, a symbol selection was coded instead. If selecting one symbol produced a phrase, the phrase was transcribed together and only one word was counted in SALT. For example, if selecting a single symbol produced the phrase “I want more” this was transcribed as “Iwantmore” and only 1 word was counted. However, if a child selected separate symbols for “I” “want” and “more,” 3 words were counted. As with sign, if the child spoke and selected a symbol for the same referent, only one unique word was counted for determining the number of different words.
Reliability
We measured reliability for variables measured in both live and video coding. For live coding, 80 randomly selected observations (45%), were completed by two trained observers who simultaneously recorded the communication observed in classrooms. The two observers stood away from each other and independently coded behaviors. Comparisons across the independent coding were completed with the intraclass correlation coefficient (ICC). The ICC for Adult communication acts was .99.
Reliability for video recording was measured by having two coders independently code 90 randomly selected videos (37%). After a file was coded by both independent coders, the results were compared to each other, first using percent agreement, and then later with ICCs. If percent agreement fell below 75% a consensus coding procedure was followed. The two coders conferred and came to a consensus regarding all disagreements. The consensus file was then used to extract the data for the communication variables. ICCs between primary, reliability and consensus files ranged between .97 and .99. Reliability for the number of different child words was computed by having an additional coder transcribe 41 randomly selected files (47% files). The ICC between raters for the number of different words was .99.
Prior to analysis, all frequency data were converted into rates per minute in order to account for slight variations in observation times. Rate was computed as the frequency divided by the duration of each observation.
Results
Analysis Plan
Our research questions about the predictive relationships between child and environmental variables and child language outcomes required three steps. The first step was to complete a confirmatory factor analysis to determine if we had selected indicators of ISF that fit the data well. Next, we determined if ISF predicted the number of different words children produced one year later. Finally, we determined if the amount of communication input provided by adult communication partners at home and at school and variations in the amount of AAC instruction were significant mediators.
Confirmatory Factor Analysis
Recall that one of our research questions was whether the set of hypothesized child variables were indicators of a latent construct, ISF. To address this question, a Confirmatory Factor Analysis (CFA) was conducted using Mplus 6.11 (Muthen & Muthen, 1998Muthen & Muthen, 2011). Prior to conducting the CFA, the univariate distributions of the indicator variables were checked for normalcy and outliers. None of the variables required transformation. Both standard maximum likelihood estimation and robust maximum likelihood estimation was used given the limited sample size. Table 3 shows the means and standard deviations for the four indicators of ISF. Table 4 presents the correlations among all of the child variables and the other measures included in the model, with the indicators of ISF listed first. Correlations among the ISF indicators ranged from .40 to .75 with Mullen Nonverbal scores and play scores being most strongly related. The a-priori model was that all child reflective indicators would load without covarying errors on a single factor. Goodness of fit was evaluated using the root mean square error of approximation (RMSEA), standardized root mean square residual (SRMR), and the comparative fit index (CFI). The RMSEA is a measure of lack of fit, where values below .08 indicate acceptable fit and below .05 indicate excellent fit. CFI values above .90 or .95 indicate acceptable and excellent fit, respectively. The SRMR is an absolute measure of fit and values less than .08 are considered to be good fit.
Table 4.
Summary of Intercorrelations for Variables Used in Confirmatory Factor Analysis (first four variables) and in the Structural Equation Model
| 1 | 2 | 3 | 4 | 5 | 6 | 7 | 8 | |
|---|---|---|---|---|---|---|---|---|
| 1. Communication Complexity | ||||||||
| 2. PLS-4a Auditory Comprehension | .40** | |||||||
| 3. Weighted Total Play | .45** | .50** | ||||||
| 4. MSELb Nonverbal Composite Raw | .46** | .59** | .75** | |||||
| 5. Ratec of Adult Input Home Time 1 | .32** | .40** | .34** | .33** | ||||
| 6. Rate of Adult Input School Time 1 | .25* | .07 | −.06 | .10 | .06 | |||
| 7. Rate of Different Words Home Time 2 | .29** | .43** | .49** | .34** | .48** | .16 | ||
| 8. Rate of Different Words Scripted Time 2 | .38** | .35** | .36** | .23* | .49** | .07 | .80** | |
| 9. Amount of AAC Instructiond | .02 | .11 | −.06 | .06 | −.12 | .07 | −.27* | −.23* |
Note:
p < .05 and
p < .01.
PLS-4 is the Preschool Language Scale.
MSEL is the Mullen Scales of Early Learning.
Rates are # per minute.
Amount of instruction is based on a scale of 1–5.
The model fit the data well using the maximum likelihood estimator, RMSEA = .056, CFI = .996, and SRMR = .026. No modifications to the model were recommended. All of the child indicators loaded on the latent variable (ISF), and the loadings were significant at the .001 level. Loadings ranged in magnitude from .59 for Complexity of Communication to .94 for Mullen Nonverbal Composite Raw score. PLS-4 Auditory Comprehension had a loading of .67 and Weighted Total Play had loading of .76. The same model was run again using the robust maximum likelihood estimator given the relatively small sample size. The data fit the model even better using the robust estimator, RMSEA = .001, CFI = 1.00, and SRMR = .026 with no change in the parameter estimates.
Structural Equation Models
Model 1
A structural equation model was developed to explore the relationships among ISF at Time 1, adult input at Time 1, and child communication at Time 2 as shown in Figure 1. The model hypothesized that ISF at Time 1 (as indicated by PLS-4 Auditory Comprehension, Weighted Total Play, Mullen Nonverbal, and Communication Complexity Score) influenced both child communication at Time 2 and adult input at Time1. Adult input at Time 1 also predicted child communication at Time 2 in the model. Two variables were chosen as indicators for child communication: rate of different words produced at home excluding imitated words, and rate of different words produced in the scripted interaction protocol excluding imitated words. Two variables were initially hypothesized to be indicators of adult input; adult input at home, and adult input at school at the initial observations. Parents at home had an average input rate of 4.09 communication acts per minute (SD=1.49) while teachers at school averaged 2.21 communication acts per minute (SD = .82).
Figure 1.
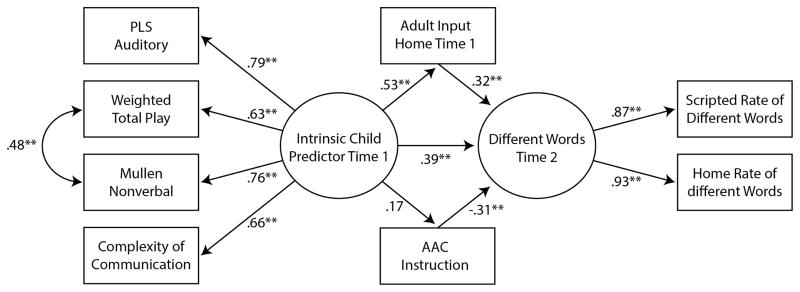
Summary SEM model for child language outcome (rate of different words from scripted communication assessment and home observation) with adult input as a mediator. PLS auditory = the auditory comprehension scale of the Preschool Language Scale – 4. Completely standardized robust maximum likelihood parameter estimates are shown.
Prior to evaluation of the structural model, the univariate distributions of each child communication variable were checked for normalcy and outliers and the correlation matrix was also examined (see Table 4). Correlations between the ISF indicator variables and the child communication outcome variables, rate of different words produced at home and at school, were all significant ranging from .26 to .48. Play scores and rate of different words used at home were the most highly correlated. The correlations between the adult input variables and child language outcomes were not as expected. Whereas correlations between adult input at home and child outcomes were moderate and significant ranging from .31 to .39, correlations between adult input at school and most of the other variables in the model were near zero with the exception of Communication Complexity (r = .26*). Given the pattern of correlations, adult input at school was dropped from the model and input at home was the only adult input variable used in the models below.
In order to determine if ISF at Time 1 predicted child communication at Time 2, child communication at Time 2 was regressed on the latent variable for ISF at Time 1 and adult input at home at Time 1. This allowed analyses of the direct effects of ISF at Time 1 and adult input at home at Time 1 on child communication at Time 2. Additionally, adult input at home was regressed on the latent variable for ISF to analyze the direct effect between adult input at home and ISF at Time 1. The model using robust maximum likelihood estimation fit the data fairly well, RMSEA = .091, CFI = .966, and SRMR = .051. Examination of the residuals for covariances (i.e., the difference between the observed and the model indicated covariance) indicated that the weighted total play scores and the Mullen nonverbal scores were more related than the model predicted. Adding a residual covariance between these scores accounted for the statistical relationship between these two scores. Theoretically, it makes sense that play and nonverbal MSEL scores would be related because they are both nonverbal performance measures based on interactions with objects.
Model 2
A second model identical to Model 1 with the addition of a residual covariance between Mullen nonverbal scores and weighted total play scores was evaluated. This Model 2 fit the data well, RMSEA = .060, CFI = .986, and SRMR = .038. All paths were statistically significant indicating that both ISF and adult input at home significantly influenced child communication one year later. There was also a relationship between ISF and adult input at home although the path weight was somewhat smaller.
In order to determine if adult input at home was a significant mediator of the effect of ISF on child outcomes, the indirect effect of ISF on child communication through adult input at home was examined. In order to properly test the indirect effect, bootstrapping was used to get the appropriate standard error and confidence interval. In finite samples the normality assumption of the indirect effect is rarely met. A resampling strategy such as bootstrapping, where repeated samples of the original data are drawn with replacement to get an empirical distribution of the observed data, can be used to obtain a nonparametric approximation of the sampling distribution of the indirect effect. Preacher and Hays (2008) indicate that bootstrapping methods are preferred over methods that assume symmetry and normality. The estimate of the indirect effect was .21 with a standard error of .09, p = .016. The 95% Confidence Interval for the indirect effect was .039 to .371 and did not include 0. Therefore, we can conclude that the effect is statistically significantly different from zero and that adult input was a significant mediator of ISF.
Model 3
An additional model was evaluated that added teacher reported amount of AAC instruction per week to the model. The mean and standard deviation of instruction time reported is presented in Table 2. Child communication at Time 2 was regressed on the latent variable for ISF at Time 1, adult input at home at Time 1, and teacher report of AAC instruction at Time 1. This allowed analyses of the direct effects of ISF at Time 1 and adult input at home at Time 1 on child communication at Time 2. Additionally, adult input at home and amount of AAC instruction per week were regressed on the latent variable for ISF. In order to determine if amount of AAC instruction was a significant mediator of the effect of ISF on child outcomes, the indirect effect of ISF on child communication through AAC instruction was examined.
The model using robust maximum likelihood estimation fit the data well, RMSEA = .057, CFI = .983, and SRMR = .046. As can be seen in Figure 1, all paths except the path from ISF to AAC instruction were statistically significant indicating that ISF, adult input at home, and amount of AAC instruction significantly influenced child communication rate one year later.
In order to determine if AAC instruction was a significant mediator of ISF and if adult input at home remained a significant mediator of the effect of ISF on child outcomes, the indirect effects of ISF on child communication through both variables was examined. Bootstrapping was once again used to get the appropriate standard error and confidence interval. The estimate of the indirect effect through adult input at home was .17 with a standard error of .08, p = .023. The 95% Confidence Interval for the indirect effect was .023 to .322. Thus, adult input at home remained a significant mediator even with the addition of AAC instruction to the model. The estimate of the indirect effect through AAC instruction was −.05 with a standard error of .054, p = .342. AAC instruction was not a significant mediator in this model.
In summary, the final model which included child ISF, adult input at home and the reported amount of AAC instruction predicting the number of different words produced (through speech, sign or SGD) at the second time point fit the data well. Adult input at home remained a significant mediator of ISF even with the addition of amount of AAC instruction to the model.
Discussion
The results of this study are unique and compelling because we were able to investigate models of early language development based on a large number of preschoolers with intellectual disabilities and significant language delays observed in authentic communication contexts. Observational data from ninety-three preschool-age children observed at home and at school were evaluated in addition to standardized test results to address two hypotheses about language development in young children learning AAC.
First, we hypothesized that a set of proposed indicators-- representing both verbal and nonverbal domains theoretically linked to symbolic development-- accurately reflected a latent construct of ISF. Four different measures (language comprehension, play, nonverbal cognition and complexity of communication) converged as a coherent construct for preparedness for learning symbolic relationships. Together, these measures reflect intrinsic child variables that may predict successful language outcomes for children learning to use AAC, and thus should be considered for initial assessments that drive early language intervention programming.
Our findings show that these indicators share a significant amount of variance and describe a presumably stable underlying construct. It is not surprising that a complex construct such as a child’s ISF is reflected by multiple measures. Basing a construct on multiple measures is more robust than a single measure which may be more susceptible to testing artifacts associated with that single measure (Bornstein & Haynes, 1998). In addition, individual children’s weaknesses in one indicator may be somewhat compensated with strengths in other indicator variables according to this model.
The second hypothesis of this study was that ISF would significantly predict variations in word productions one year later, measured across two contexts—at home with parents and in a scripted communication sample with a research staff member. However, in alignment with an emergentist view, our hypothesized model included the amount of adult input and the amount of AAC instruction as proposed mediators of the effects of ISF. The amount of communication input from parents and classroom staff were considered as mediators. Children with higher initial levels of ISF and more adult input at home produced more words at Time 2. The mediating effect of adult input at home indicates that increased adult input can partially overcome effects of initially low levels of ISF. The negative path from amount of AAC instruction to the amount of different words produced suggests that less AAC instruction is associated with more word production. However, this is explainable because children with more severe impairments are more likely to receive more AAC instruction. The fact that adult input at school was not related to child outcomes or other child variables was unexpected, but may reflect less variability compared to the amount of adult input measured across home environments. Input from teachers and paraeducators at school was relatively high, with little variation. In addition, we only measured input specifically directed to the child. Including group-directed input might have produced different results.
The results of this study complement and extend earlier research in several important ways. In a previous publication we reported that children learning AAC communicated at relatively low rates in their classrooms, most often responding to adult initiations (i.e., initiation rate of .13 communication acts per minute and response rate of .49 communication acts per minute) (Brady et al., 2011). The current findings add information about communication at home and present a model for early communication development.
Previous results by other research teams provided comparable results but with smaller and younger samples. For example, Romski, Sevcik, Reumann & Pate (1989) collected extensive data for nine individuals with significant disabilities during mealtimes. Participants were between 6 and 20 years of age and data indicated that they communicated more often at home than at school, and more often to adults than to peers. When converted to rates, Romski et al.’s data showed about .98 communication acts per minute at home, and about .38 communication acts per minute at school. However, observations in the Romski et al. study were limited to meal-time contexts. The school communication rates reported by Brady and colleagues and by Romski et al. appear higher than those reported by Rowland and colleagues in a study of deaf-blind children communicating in their classrooms (Rowland, 1990); however, a direct comparison is difficult because Rowland reported data in terms of observation intervals and not rates. Taken together, these studies suggest that children communicate less often at school than at home, and suggest that interventions aimed at increasing rates of child communication in classroom contexts are still needed (Bunce, 1995; Horn, Lieber, Shouming Li, Sandall, & Schwartz, 2000; Smith, Warren, Yoder, & Feurer, 2004).
Clinical implications
Our results have implications for clinical assessments, and interventions aimed at improving language outcomes for children with ID learning AAC. In terms of assessments, we found that a cluster of child-focused assessments taken together captured child characteristics associated with differential vocabulary growth. These included familiar and common assessments used by clinicians in the field of communication disorders (e.g., PLS-4; MSEL nonverbal scales), and our assessments of play and communication complexity. Our purpose was not to determine if child outcomes were best predicted by this vs. another set of predictors, or by some subset of our indicator measures. Each of the indicators we selected was based on well-developed theories of early language development. Approximately 2.5 hours of assessment were required to complete all of the child assessments and this amount of time may seem lengthy. However, this comprehensive assessment approach may yield valuable guidance to clinicians in the beginning stages of plotting a course of treatment. Thus, the amount of time may be a worthwhile investment in terms of better understanding children’s initial levels of intrinsic aptitudes for symbol (word) learning.
Our model indicates that interventions aimed at improving ISF and adult input at home should directly benefit vocabulary development. Although ISF is a latent construct, improving the various indicators should strengthen the construct and hence prepare a stronger foundation for word acquisition in young children. It is thus worthwhile to consider curricula that specifically address the indicators of ISF. For example, Kasari and colleagues have shown that play levels can be increased through direct interventions and that enhanced play improves language outcomes for children with autism (Kasari, Paparella, Freeman, & Jahromi, 2008). Several studies have documented that the complexity of communication can be enhanced through intervention. For example Brady and Bashinski ( 2008) and Fey and colleagues (2006) have shown that the frequency and diversity of prelinguistic communicative gestures and vocalizations can be increased through direct interventions. Verbal comprehension may be targeted directly by increasing opportunities for children to associate words (represented through speech, signs or graphic symbols) with their referents (Brady & McLean, 1998; Nigam, Schlosser, & Lloyd, 2006) or indirectly through methods such as aided AAC input interventions . Intervention approaches such as aided language stimulation that incorporate modeling of AAC and speech input may be particularly effective for children with relatively good verbal comprehension skills (Binger & Light, 2006; Harris & Reichle, 2004). Finally, nonverbal cognition is a multi-indicated construct itself that often includes visual processing skills. Recent research indicates that visual processing is an important but often ignored component of AAC (Thistle & Wilkinson, 2009; Wilkinson & Light, 2011). Although research by Wilkinson and colleagues has focused primarily on considerations for optimum display constructions, findings also suggest possible interventions aimed at directly improving the visual discriminations used in AAC communication.
Our finding of the importance of adult input is commensurate with a large literature addressing environmental contributors to both speech and AAC. It has been recognized that children with language delays may receive less language input from parents and peers unless these potential communication partners receive appropriate interventions (Poll, 2011). That is, even though input is even more critical for children struggling to learn a symbolic communication system, there appears to be a somewhat natural tendency to provide less input to these children. Thus, home and school-based interventions aimed at over-riding this tendency by providing adults with specific language strategies to increase language directed to children learning AAC appears to be indicated. Results from our model indicate that increasing adult input at home would positively impact vocabulary growth. Thus, our results add to the growing evidence base supporting the importance of an enriched home language environment (Fernald, Marchman, & Hurtado, 2008; Hart & Risley, 1995; Huttenlocher, et al., 1991), and suggest that increasing the amount of communication input across all environments (e.g., both home and school) is likely to facilitate vocabulary uptake for children with IDs struggling to learn words.
A typical model of language intervention for preschool children is to provide intervention at school, and communicate with families to try to promote carryover of school-based instruction to home. However, our results suggest that a more concerted effort to directly intervene with children’s parents may produce better outcomes for children. For example, parent-based interventions that have typically been used with younger children (e.g., Girolametto & Wieitzman, 2006; Kaiser, Hancock, & Nietfeld, 2000) could be adapted and even intensified for use with parents of preschool age children through a dual home/school based intervention model. One recent intervention that focused on parents of children with autism provided interventions over the internet, and may provide a feasible model for busy school clinicians and families (Venker, McDuffie, Ellis Weismer, & Abbeduto, 2011).
Limitations to this study
Although our sample was quite large and relatively diverse in comparison to other studies of children with IDs, a larger sample would have enhanced the data analytic possibilities. In addition, observing for longer periods of time within one observation session may yield more representative samples of communication behaviors by children and their adult communication partners. The current study followed children for one year. Additional observations would allow modeling of effects over longer periods of time and potentially across more complex language constructs.
We limited our observations to communication between focus children learning AAC and adult communication partners. Thus, we didn’t include potentially important variables of peer input and peer responsiveness. Anecdotally, our observers noted a dearth of peer interactions in classrooms, but we were not able to confirm this with the data collected. Hadley and Rice (1991) reported that peers largely ignored children who were speaking but who had varying degrees of language impairments in preschool classrooms; hence it would not be surprising to find similar limitations in interactions between peers and preschool children learning AAC. Further research is needed to describe communication (or lack thereof) between children learning to use AAC and their classmates without disabilities, with the goal to develop treatment strategies that teach joint communication and responsiveness via AAC systems.
The amount of vocabulary available to children on their AAC system is another variable that affects children’s differntial AAC vocabulary use over time. For example, if a child only has a few symbols available to select with a graphic symbol system, the number of different words used as a measure is limited to the vocabulary available during that observation. Unfortunately we did not systematically record the number of words available to each child via their AAC systems, and this limitation should be noted in interpreting our results.
Another limitation was that our measure for differences in the amount of instruction was limited to teacher report, and only reflected their perceptions of differences in AAC instruction. Other instructional variables such as group size, types of AAC, and use of language facilitating strategies in the classroom were not analyzed. These variables may significantly affect vocabulary acquisition outcomes. However, the negative correlations between amount of AAC instruction and rate of different words produced reported in the current study reflect the difficulty in interpreting longitudinal effects in instructional variables. Although it might be assumed that more instruction would yield more word learning (a positive correlation), our findings make sense because children who have significant language deficits often receive more intervention.
A limitation to our construct of ISF was the focus on cognitive and not biological indicators. Romski and colleagues point out that in addition to measures such as those included in our model, biological factors such as presence of a seizure disorder may impact a child’s ability to take advantage of various language learning opportunities (Romski, et al., 1997). Related to this, we did not examine different diagnoses in our model. Although our purpose was not to compare symbolic communication development across different diagnostic groups, diagnosis could be a significant predictor of language outcomes in a study with larger numbers of children with specific diagnoses.
Conclusions and future directions
A model of early symbolic development in children with intellectual disabilities learning AAC, based on an emergentist theory of language, was developed and tested in the current study. Significant variance in the number of words produced in authentic contexts was accounted for by our model. ISF, adult input at home and the amount of AAC instruction were all significant predictors of child communication outcomes one year later. These findings support the importance of enriching social communication input across home and school environments during this sensitive period of symbolic word learning, as well as assessments of and interventions aimed at improving comprehension, play, visual discrimination, and communication complexity.
ISF was found to significantly predict word production in children experiencing a variety of typical early interventions during the preschool period. Future studies may find that it is also a sensitive predictor of responsiveness to different types or intensities of interventions (Flippin, Reszka, & Watson, 2010). Currently there is little evidence available to guide decisions about what approach to use with children learning to use AAC who have different profiles of abilities, histories, and social environments. Important questions such as these await further research.
Table 5.
Fit indices and Parameter Estimates for Indirect Effects Through Mediators.
| Statistic | Model 1 | Model 2 | Model 3 |
|---|---|---|---|
| CFI | .96 | .986* | .983* |
| SRMR | .051 | .038 | .046* |
| RMSEA | .091 | .060* | .057 |
| Indirect effect adult input home | .21** | .17** | |
| Indirect effect AAC instruction | N/A | −.05 |
Note: RMSEA = root-mean-square error of approximation; CFI = comparative fit index; SMSR = standardized root mean square residual;
p < .05 and
p < .01.
Acknowledgments
This research was supported by the following grants from the National Institutes of Health: DC007684 and HD018955. We wish to thank the families and teachers that participated in this research, and the research assistants who helped with data collection.
Appendix A
Brief definitions of communication categories
Adult Communication
includes initiations, prompts, or responses from an adult to the target child . When multiple adults are communicating only the last adult to communicate is coded. During group activities, only adult communication clearly directed to the focus child is coded. “Prompts” are defined as specific and direct prompts to help the child use words, sign, symbols, or an SGD. “No responses” are coded if 3 seconds elapse after a pause in communication.
Child Communication
includes initiations, responses, or repairs from the target child to an adult. “Repairs” are defined as anytime a child responds to the adult’s specific request for clarification when the adult does not understand the child’s initiation or response. “No responses” are coded if 3 seconds elapse after a pause in communication.
Brief definitions of communication modes
Speech
An utterance containing one vowel and one or more target consonants (or child-like consonant substitutions of the target word) in the appropriate position per syllable in the word. The word must be used in a semantically and pragmatically appropriate manner.
Sign
A combination of hand configurations that represent an expression, a word, a letter, a number, or a combination of words, letters, or numbers that are representative of a sign language system including ASL (American Sign Language).
Gesture
A nonverbal communicative behavior that can be easily recognized by other members of the cultural community. Examples of conventional gestures include a head nods or shakes to indicate yes or no, shoulder shrugs, finger up to mouth in a shush gesture, or a raised hand in a high-five gesture. Examples of nonconventional gestures include a child leading an adult by the hand, tapping someone, or giving or showing an object to another person. Includes points.
Symbol
Photographed, colored, or black and white line drawings, or object symbols that represent an object, activity, or an event that are pointed to, exchanged between communication partners, or held up by the adult to encourage child to focus on the symbol. Picture cards must be part of the child’s targeted communication system; simple flash cards used during a receptive language tasks are not considered symbols unless they contain a letter, word, or numbers.
Vocalization
A single or repeated phoneme (sound) that is not a true word, but has meaning and is directed to a person.
SGD
The act of directly selecting an option (photograph, colored, or black and white line drawings, or object symbol) on the Speech generating device, and a recorded message is played.
Appendix B. CCS Scale
| Scale number | Definition | Example | Communication Level |
|---|---|---|---|
| 0 | No response | An opportunity is presented but the child looks away the entire time. | |
| 1 | Alerting-a change in behavior | A vibrating toy stops vibrating and the child stops smiling | Preintentional |
| 2 | Single object/event/person orientation | Child handles a toy and focuses attention on only this toy | Preintentional |
| 3 | Single object/event/person orientation plus 1 PCB1 | Child handles a toy and vocalizes | Preintentional |
| 4 | Single object/event/person orientation plus more than 1 PCB | Child reaches toward a toy and vocalizes | Preintentional |
| 5 | Scanning between objects/events | The child visually scans (shifts attention) between two different wind-up toys | Preintentional |
| 6 | Dual orientation between a person and an object or event | While playing with a wind-up toy, the child looks up at partner | Preintentional |
| 7a | Triadic eye gaze | Child looks from toy to partner and back to toy within a few seconds | Intentional nonsymbolic |
| 7b | Dual orientation plus 1 or more PCBs | Child looks from toy to partner and vocalizes | Intentional nonsymbolic |
| 8 | Triadic eye gaze plus 1 PCB | Child looks from toy to partner and back to toy while vocalizing | Intentional nonsymbolic |
| 9 | Triadic eye gaze plus more than 1 PCB | Child looks from toy to partner and back to toy while vocalizing and giving toy to partner | Intentional nonsymbolic |
| 10 | One word verbalization, sign or AAC symbol selection | Child says “more” to request more cheerios | Intentional symbolic |
| 11 | Two or more word verbalizations, signs or AAC symbol selections | Child says “more please” to request more cheerios | Intentional symbolic |
PCB = Potentially Communicative Behavior: Behaviors such as vocalizations, gestures, eye gaze or switch closures that appear to be purposeful in response to the stimulus, and that could be viewed as communicating behavior regulation or joint attention or social interaction. Note, this scale was originally published in Brady et al., (2011).
References
- Adamson L, Chance S. Coordinating attention to people, objects, and language. In: Wetherby A, Warren S, Reichle J, editors. Tranisitions in prelinguistic communication. Baltimore: Brookes Publishing Company; 1998. pp. 15–39. [Google Scholar]
- Bates E, Benigni L, Brethern I, Camaioni L, Volterra V. The emergence of symbols: Cognition and communication in infancy. New York, NY: Academic Press; 1979. [Google Scholar]
- Bates E, Dick F. Language, gesture and the developing brain. Developmental Psychobiology. 2002;4(3):293–310. doi: 10.1002/dev.10034. [DOI] [PubMed] [Google Scholar]
- Bates E, O’Connell B, Shore C. Language and communication in infancy. In: Osofsky JD, editor. Handbook of infant development. New York, NY: John-Wiley & Sons; 1987. pp. 149–203. [Google Scholar]
- Binger C, Light J. Demographics of preschoolers who require AAC. Language, Speech, and Hearing Services in Schools. 2006;37:200–208. doi: 10.1044/0161-1461(2006/022). [DOI] [PubMed] [Google Scholar]
- Bornstein MH, Haynes OM. Vocabulary competence in early childhood: Measurement, latent construct, and predictive validity. Child Development. 1998;69(3):654–671. [PubMed] [Google Scholar]
- Brady N. Improved comprehension of object names following voice output communication aid use: Two case studies. Augmentative and Alternative Communication: AAC. 2000;16:197–204. [Google Scholar]
- Brady N, Bashinski S. Increasing communication in children with concurrent vision and hearing loss. Research and Practice for Persons with Severe Disabilities. 2008;33(1–2):59–71. doi: 10.2511/rpsd.33.1-2.59. [DOI] [PMC free article] [PubMed] [Google Scholar]
- Brady N, Fleming K, Thiemann-Bourque K, Olswang L, Dowden P, Saunders M, Marquis J. Development of the communication Complexity Scale. American Journal of Speech-Language Pathology. 2011;21:16–28. doi: 10.1044/1058-0360(2011/10-0099). [DOI] [PMC free article] [PubMed] [Google Scholar]
- Brady N, Herynk J, Fleming K. Communication Input Matters: Lessons From Prelinguistic Children Learning to Use AAC in Preschool Environments. Early childhood Services. 2010;4:141–154. [PMC free article] [PubMed] [Google Scholar]
- Brady N, Marquis J, Fleming K, McLean L. Prelinguistic predictors of language growth in children with developmental disabilities. Journal of Speech, Language and Hearing Research. 2004;47(3):663–667. doi: 10.1044/1092-4388(2004/051). [DOI] [PubMed] [Google Scholar]
- Brady N, McLean L. Simultaneous and delayed matching to sample in gesture users and speakers with mental retardation. Research in Developmental Disabilites. 1998;19:409–421. doi: 10.1016/s0891-4222(98)00014-6. [DOI] [PubMed] [Google Scholar]
- Brady N, Steeples T, Fleming K. Effects of prelinguistic communication levels on initiation and repair of communication in children with disabilities. Journal of Speech, Language and Hearing Research. 2005;48(5):1098–1113. doi: 10.1044/1092-4388(2005/076). [DOI] [PubMed] [Google Scholar]
- Brooks R, Meltzoff A. Infant gaze following and pointing predict accelerated vocabulary growth through two years of age: a longitudinal, growth curve modeling study. Journal of Child Language. 2008;35(1):207–220. doi: 10.1017/s030500090700829x. [DOI] [PubMed] [Google Scholar]
- Butterworth G. Pointing is the royal road to language for babies. In: Kita S, editor. Pointing: Where language, culture, and cognition meet. Mahwah, NJ: Lawrence Erlbaum Associates; 2003. pp. 9–33. [Google Scholar]
- Bunce BH. Building a language-focussed curriculum for the preschool classroom: A planning guide. Baltimore, MD: Paul H. Brookes; 1995. [Google Scholar]
- Carpenter M, Nagell K, Tomasello M. Social cognition, joint attention, and communicative competence from 9 to 15 months of age. Monographs of the Society for Research in Child Development. 1998;63(4):v-174. [PubMed] [Google Scholar]
- Casby MW, McCormack SM. Symbolic play and early communication development in hearing-impaired children. Journal of Communication Disorders. 1985;18(1):67–78. doi: 10.1016/0021-9924(85)90016-4. [DOI] [PubMed] [Google Scholar]
- Chapman R. Language and communication in individuals with Down syndrome. In: Abbeduto L, editor. Language and communication in mental retardation. Vol. 27. Boston, MA: Academic press; 2003. pp. 1–34. [Google Scholar]
- Chapman R, Seung H, Schwartz S, Bird E. Predicting language production in children and adolescents with Down syndrome: The role of comprehension. Journal of Speech and Hearing Research. 2000;43(2):340–350. doi: 10.1044/jslhr.4302.340. [DOI] [PubMed] [Google Scholar]
- Connor CM, Morrison FJ, Slominski L. Preschool instruction and children’s emergent literacy growth. Journal of Educational Psychology. 2006;98(4):665–689. [Google Scholar]
- Crais E, Day Douglas D, Cox Campbell c. The intersection of the development of gestures and intentionality. Journal of Speech, Language and Hearing Research. 2004;47:678–694. doi: 10.1044/1092-4388(2004/052). [DOI] [PubMed] [Google Scholar]
- Cress C, Marvin C. Common questions about AAC services in early intervention. AAC Augmentative and Alternative Communication. 2003;19(4):254–272. [Google Scholar]
- Cunningham C, Glenn S, Wilkinson P, Sloper P. Mental ability, symbolic play and receptive expressive language of young children with Down syndrome. Journal of Child Psychology and Psychiatry. 1985;26:255–265. doi: 10.1111/j.1469-7610.1985.tb02264.x. [DOI] [PubMed] [Google Scholar]
- Drager KDR, Postal VJ, Carrolus L, Castellano M, Gagliano C, Glynn J. The effect of aided language modeling on symbol comprehension and production in 2 preschoolers with autism. American Journal of Speech-Language Pathology. 2006;15(2):112–125. doi: 10.1044/1058-0360(2006/012). [DOI] [PubMed] [Google Scholar]
- Dunst C, Meter D, Hamby D. Influences of sign and oral language inteventions on the speech and oral language production of young children with disabilities. CELL reviews. 2011;4(4) [Google Scholar]
- Eadie P, Ukoumunne O, Skeat J, Ruth Prior M, Bavin E, Bretherton L, Reilly S. Assessing early communication behaviours: structure and validity of the Communication and Symbolic Behaviour Scales--Developmental Profile (CSBS-DP) in 12-month-old infants. International Journal of Language and Communication Disorders. 2010;45(5):572–585. doi: 10.3109/13682820903277944. [DOI] [PubMed] [Google Scholar]
- Fernald A, Marchman VA, Hurtado N. Input affects uptake: How early language experience influences processing efficiency and vocabulary learning. Paper presented at the Development and Learning, 2008. ICDL 2008. 7th IEEE International Conference on.Aug 9–12, 2008. [Google Scholar]
- Eisert D, Lamorey S. Play as a window on child development: The relationship between play and other developmental domains. Early Education & Development. 1996;7(3):221–235. doi: 10.1207/s15566935eed0703_2. [DOI] [Google Scholar]
- Fey M, Warren S, Brady N, Finestack L, Bredin-Oja S, Fairchild M. Early effects of prelinguistic milieu teaching and responsivity education for children with developmental delays and their parents. Journal of Speech, Language and Hearing Research. 2006;49(3):526–547. doi: 10.1044/1092-4388(2006/039). [DOI] [PubMed] [Google Scholar]
- Flippin M, Reszka S, Watson L. Effectiveness of the Picture Exchange Communication System (PECS) on communication & speech for children with autism spectrum disorders: A metanalysis. American Journal of Speech-Language Pathology. 2010;19:178–195. doi: 10.1044/1058-0360(2010/09-0022). [DOI] [PubMed] [Google Scholar]
- Girolametto L, Wieitzman E. It takes two to talk-the Hanen program for parents: Early language intervention through caregiver training. In: McCauley R, Fey M, editors. Treatment of language disorders in children. Baltimore, MD: Brookes Publishing Co; 2006. pp. 77–104. [Google Scholar]
- Graham JW, Collins LM, Wugalter SE, Chung Jacob NK, Hansen WB. Modeling transitions in latent stage-sequential processes: A substance use prevention example. Journal of Consulting and Clinical Psychology. 1991;59(1):48–57. doi: 10.1037/0022-006X.59.1.48. [DOI] [PubMed] [Google Scholar]
- Hadley PA, Rice ML. Conversational responsiveness of speech-and language-impaired preschoolers. Journal of Speech and Hearing Research. 1991;34:1308–1317. doi: 10.1044/jshr.3406.1308. [DOI] [PubMed] [Google Scholar]
- Harris M, Reichle J. The impact of aided language stimulation on symbol comprehension and production in learners with moderate cognitive disabilities. American Journal of Speech-Language Pathology. 2004;13(2):155–167. doi: 10.1044/1058-0360(2004/016). [DOI] [PubMed] [Google Scholar]
- Harrison B, Smith T. Structural equation modeling to measure well-being and its association with autism symptoms. 2012 Retrieved from https://imfar.confex.com/imfar/2012/webprogram/Paper11027.html.
- Hart B, Risley T. Meaningful differences in the everyday experience of young American children. Baltimore, MD: Brookes Publishing; 1995. [Google Scholar]
- Hoff E. The specificity of environmental influence: Socioeconomic status affects early vocabulary development via maternal speech. Child Development. 2003;74(5):1368–1378. doi: 10.1111/1467-8624.00612. [DOI] [PubMed] [Google Scholar]
- Horn E, Lieber J, Shouming Li, Sandall S, Schwartz I. Supporting young children’s IEP goals in inclusive settings through embedded learning opportunities. Topics in Early Childhood Special Education. 2000;20(4):208–223. doi: 10.1177/027112140002000402. [DOI] [Google Scholar]
- Huttenlocher J, Haight W, Bryk A, Seltzer M, Lyons T. Early vocabulary growth: Relation to language input and gender. Developmental Psychology. 1991;27:236–248. [Google Scholar]
- Iacobucci D. Mediation analysis and categorical variables: The final frontier. Journal of Consumer Psychology. 2012;22(4):582–594. doi: 10.1016/j.jcps.2012.03.009. [DOI] [PMC free article] [PubMed] [Google Scholar]
- Iverson JM, Thal DJ. Communicative Transitions: There’s more to the hand than meets the eye. In: Wetherby A, Warren S, Reichle J, editors. Transitions in Prelinguistic Communication. Baltimore, MD: Brookes; 1998. pp. 59–87. [Google Scholar]
- Kaiser T, Hancock T, Nietfeld J. The effects of parent-implemented enhanced milieu teaching on the social communication of children who have autism. Early Education and Development. 2000;11(4):423–446. [Google Scholar]
- Kasari C, Freeman SF, Paparella T. Early intervention in autism: Joint attention and symbolic play. International Review of Research in Mental Retardation. 2001;23:207–237. [Google Scholar]
- Kasari C, Paparella T, Freeman S, Jahromi L. Language outcome in autism: Randomized comparison of joint attention and play interventions. Journal of Consulting and Clinical Psychology. 2008;76(1):125–137. doi: 10.1037/0022-006X.76.1.125. [DOI] [PubMed] [Google Scholar]
- Laakso M, Poikkeus A, Eklund K, Lyytinen P. Social interational behaviors and symbolic play competence as predictors of language development and their associations with maternal attention-directing strategies. Infant Behavior and Development. 1999;22(4):541–556. doi: 10.1016/S0163-6383(00)0022-9. [DOI] [Google Scholar]
- Landa RJ, Holman KC, Garrett-Mayer E. Social and communication development in toddlers with early and later diagnosis of autism spectrum disorders. Archives of General Psychiatry. 2007;64(7):853–864. doi: 10.1001/archpsyc.64.7.853. [DOI] [PubMed] [Google Scholar]
- Landry S, Smith K, Swank P, Guttentag C. A responsive parenting intervention: The optimal timing across early childhood for impacting maternal behaviors and child outcomes. Developmental Psychology. 2008;44(5):1335–1353. doi: 10.1037/a0013030. [DOI] [PMC free article] [PubMed] [Google Scholar]
- Legerstee M, Fisher T. Coordinated attention, declarative and imperative pointing in infants with and without Down syndrome: Sharing experiences with adults and peers. First Language. 2008;28(3):281–211. [Google Scholar]
- Lifter K, Sulzer-Azaroff B, Anderson S, Cowdery GE. Teaching play activities to preschool children with disabilities: The importance of developmental considerations. Journal of Early Intervention. 1993;17:139–159. [Google Scholar]
- Lowe M, Costello AJ. The Symbolic Play Test. Windsor, Great Britain: NFER Publishing; 1976. [Google Scholar]
- MacWhinney B. A multiple process solution to the logical problem of language acquisition. Journal of Child Language. 2004;31:883–914. doi: 10.1017/s0305000904006336. [DOI] [PMC free article] [PubMed] [Google Scholar]
- McCathren R, Warren SF, Yoder PJ. Prelinguistic predictors of later language development. In: Cole KN, Dale PS, Thal DJ, editors. Assessment of communication and language. Baltimore, MD: Paul H. Brookes Publishing Co; 1996. pp. 57–76. [Google Scholar]
- McCathren R, Yoder P, Warren S. Determining spoken language prognosis in children with developmental disabilities. American Journal of Speech-Language Pathology. 1998;7:77–87. [Google Scholar]
- McCune-Nicolich L, Carroll S. Development of symbolic play: Implications for the language specialist. Topics in Language Disorders. 1981;2:1–15. [Google Scholar]
- Miller JF, Chapman RS. Systematic analysis of language transcripts. Madison: Waisman Center on Mental Retardation and Human Development, University of Wisconsin; 1985. [Google Scholar]
- Mullen E. Mullen scales of early learning: AGS edition. Circle Pines, MN: AGS; 1995. [Google Scholar]
- Muthén LK, Muthén BO. Mplus User’s Guide, Sixth Edition. Los Angeles, CA: Muthén & Muthén; 1998–2011. [Google Scholar]
- Nigam R, Schlosser R, Lloyd LL. Concomitant use of the matrix strategy and the mand-model procedure in teaching graphic symbol combinations. Augmentative and Alternative Communication. 2006;22(3):160–177. doi: 10.1080/07434610600650052. [DOI] [PubMed] [Google Scholar]
- Olswang L, Bain BA. Assessment information for predicting upcoming change in language production. Journal of Speech and Hearing Research. 1996;39:414–423. doi: 10.1044/jshr.3902.414. [DOI] [PubMed] [Google Scholar]
- Philofsky A, Hepburn SL, Heys A, Hagerman R, Rogers SL. Linguistic and cognitive functioning and autism symptoms in young children with Fragile X syndrome. American Journal on Mental Retardation. 2004;109(3):208–218. doi: 10.1352/0895-8017(2004)109<208:LACFAA>2.0.CO;2. [DOI] [PubMed] [Google Scholar]
- Piaget J. Play Dreams & Imitation in Childhood. New York, NY: W.W. Norton and Company; 1962. [Google Scholar]
- Poll GH. Increasing the odds: Applying emergentist theory in language intervention. Language, Speech & Hearing Services in the Schools. 2011;42(4):580–591. doi: 10.1044/0161-1461(2011/10-0041). [DOI] [PMC free article] [PubMed] [Google Scholar]
- Preacher KJ, Hayes AF. Asymptotic and resampling strategies for assessing and comparing indirect effects in multiple mediator models. Behavior Research Methods. 2008;40:879–891. doi: 10.3758/brm.40.3.879. [DOI] [PubMed] [Google Scholar]
- Prizant B, Wetherby A, Rydell P. Communication intervention issues for children with autism spectrum disorders. In: Wetherby A, Prizant B, editors. Autism spectrum disorders: A transactional developmental perspective. Vol. 9. Baltimore, MD: Paul H. Brookes; 2000. pp. 193–225. [Google Scholar]
- Romski M, Sevcik R. Language comprehension: Considerations for augmentative and alternative communication. AAC Augmentative and Alternative Communication. 1993;9:281–285. [Google Scholar]
- Romski M, Sevcik R, Adamson L, Cheslock M, Smith A, Barker RM, Bakeman R. Randomized comparison of augmented and nonaugmented language interventions for toddlers with developmental delays and their parents. Journal of Speech, Language, and Hearing Research. 2010;53:350–364. doi: 10.1044/1092-4388(2009/08-0156). [DOI] [PubMed] [Google Scholar]
- Romski M, Sevcik R, Reumann R, Pate J. Youngsters with moderate or severe mental retardation and severe spoken language impairments I: Extant communicative patterns. Journal of Speech and Hearing Disorders. 1989;54:366–373. doi: 10.1044/jshd.5403.366. [DOI] [PubMed] [Google Scholar]
- Rowland C. Communication in the classroom for children with dual sensory impairments: Studies of teacher and child behavior. AAC Augmentative and Alternative Communication. 1990;6(4):262–274. [Google Scholar]
- Seibert JM, Hogan AE, Mundy PC. Assessing interactional competencies: The early social-communication scales. Infant Mental Health Journal. 1982;3(4):244–258. [Google Scholar]
- Sevcik R, Romski M. Comprehension and language acquisition: evidence from youth with severe cognitive disabilities. In: Adamson L, Romski M, editors. Communication and language acquisition: discoveries from atypical development. 1997. [Google Scholar]
- Sevcik RA, Romski MA. The role of language comprehension in establishing early augmented conversations. In: Reichle J, Beukelman D, Light J, editors. Implementing an augmentative communication system: Exemplary strategies for beginning communicators. Baltimore, MD: Brookes; 2002. pp. 453–474. [Google Scholar]
- Smith J, Warren SF, Yoder PJ, Feurer I. Teachers’ use of naturalistic communication intervention practices. Journal of Early Intervention. 2004;27(1):1–14. [Google Scholar]
- Stone WL, Lemanek KL, Fishel PT, Fernandez MC, Altemeier WA. Play and imitation skills in the diagnosis of autism in young children. Pediatrics. 1990;86:267–272. [PubMed] [Google Scholar]
- Tapp, Yoder P. Playcoder. Nashville, TN: Vanderbilt University; 2001. [Google Scholar]
- Thiemann-Bourque K, Brady N, Fleming K. Symbolic play of preschoolers with Severe communication impairments with autism and other developmental delays: More similarities than differences. Journal of Autism and Developmental Disorders. 2011:1–11. doi: 10.1007/s10803-011-1317-7. [DOI] [PMC free article] [PubMed] [Google Scholar]
- Thurm A, Lord C, Lee L, Newschaffer C. Predictors of language acquisition in preschool children with autism spectrum disorders. Journal of Autism and Developmental Disorders. 2007;37:1721–1734. doi: 10.1007/s10803-006-0300-1. [DOI] [PubMed] [Google Scholar]
- Tomasello M. Constructing a language: A usage-based theory of language acquisition. Cambridge, MA: Harvard University Press; 2003. [Google Scholar]
- Thistle JJ, Wilkinson K. The effects of color cues on typically developing preschoolers’ speed of locating a target line drawing: Implications for augmentative and alternative communication display design. American Journal of Speech Language and Pathology. 2009;18(3):231–240. doi: 10.1044/1058-0360(2009/08-0029). [DOI] [PubMed] [Google Scholar]
- U.S. Department of Education. IDEA Data, Part B, Child Count. Data Accountability Center (DAC) Washington, DC: Office of Special Education Programs; Jan, 2011. [Google Scholar]
- Vandereet J, Maes B, Lembrechts D, Zink I. Predicting expressive vocabulary acquisition in children with intellectual disabilities; A 2-year longitudinal study. Journal of Speech Language and Hearing Research. 2010;53:1673–1686. doi: 10.1044/1092-4388(2010/09-0187). [DOI] [PubMed] [Google Scholar]
- Venker CE, McDuffie AS, Ellis Weismer S, Abbeduto L. Increasing verbal responsiveness in parents of children with autism: A pilot Study. Autism. 2011 doi: 10.1177/1362361311413396. [DOI] [PMC free article] [PubMed] [Google Scholar]
- Watt N, Wetherby A, Shumway S. Prelinguistic predictors of language outcome at 3 years of age. J Speech Lang Hear Res. 2006;49(6):1224–1237. doi: 10.1044/1092-4388(2006/088). [DOI] [PubMed] [Google Scholar]
- Werner H, Kaplan B. Symbol Formation. Hillsdale, NJ: Lawrence Erlbaum; 1984. [Google Scholar]
- Wetherby A, Prizant B. CSBS Manual: Communication and symbolic behavior scales manual-Normed edition. Baltimore, MD: Paul H. Brookes; 2003. [Google Scholar]
- Wetherby A, Watt N, Morgan L, Shumway S. Social communication profiles of children with autism spectrum disorders late in the second year of life. Journal of Autism and Developmental Disorders. 2007;37:960–975. doi: 10.1007/s10803-006-0237-4. [DOI] [PubMed] [Google Scholar]
- Wilkinson KM, Light J. Preliminary investigation of visual attention to human figures in photographs: Potential considerations for the design of aided AAC visual scene displays. Journal of Speech language Hearing Research. 2011;54(6):1644–1657. doi: 10.1044/1092-4388(2011/10-0098. [DOI] [PMC free article] [PubMed] [Google Scholar]
- Zimmerman IL, Steiner V, Evatt Pond R. Preschool Language Scale. 4. San Antonio: The Psychological Corporation; 2003. [Google Scholar]